sprint nextel quarterly results 2007 1st
DESCRIPTION
TRANSCRIPT

Contacts: Media Relations
James Fisher 703-433-8677
Investor Relations Kurt Fawkes
800-259-3755 [email protected]
SPRINT NEXTEL REPORTS FIRST QUARTER 2007
RESULTS
Net subscriber additions of nearly 600,000 increase base to more than 53.6 million
Strong demand for Sprint, Boost Mobile and MVNO services; PowerSource dual-band devices post solid debut
Continued industry leadership in wireless data services
Strong growth in Internet Protocol (IP) services
Business investments enhance capabilities, coverage and differentiation
First Quarter Segment Results
Wireless
▪ Total revenues of $8.7 billion; direct service revenues increased 4% year-over-year ▪ Adjusted Operating Income* of $253 million impacted by accelerated resource
commitments ▪ Adjusted OIBDA* of $2.4 billion exceeds capital investment by $1 billion Wireline ▪ Total revenues of $1.6 billion; 28% growth in IP revenues year-over-year ▪ Adjusted Operating Income* of $78 million reflects voice, legacy data trends ▪ Adjusted OIBDA* of $205 million exceeds capital investment by $61 million
RESTON, Va. -- May 2, 2007 -- Sprint Nextel Corp. (NYSE: S) today reported first quarter 2007 financial results. In the quarter, the company added nearly 600,000 net new subscribers, expanded network coverage and capabilities and significantly increased investments in business operations. The company reported strong demand for wireless data services and wireline IP services and achieved a fast start for its PowerSourceTM handset offering that combines the best push-to-talk, voice and data capabilities on one device. The company also substantially completed a major headcount reduction, continued to build momentum on its planned fourth generation wireless data offering and launched a market trial for a Boost Mobile unlimited local calling plan.
1

In the first quarter of 2007, diluted earnings per share (EPS) from continuing operations were a loss of 7 cents, compared to income of 5 cents in the first quarter of 2006. Adjusted EPS before Amortization* was 18 cents compared to 26 cents in the year-ago period. The lower earnings in the quarter are due to reduced contributions from operations and lower non-operating income, partially offset by fewer common shares outstanding. Consolidated net operating revenues of $10.1 billion in the first quarter were modestly above revenues in the year-ago period. Reflecting increased operating expenses, consolidated adjusted OIBDA* of $2.6 billion declined 12% from the first quarter of 2006. First quarter capital expenditures were $1.6 billion and free cash flow* was approximately $500 million. “Our plans in 2007 call for a substantial increase in the funding of business operations to build long term growth and profitability,” said Gary Forsee, Sprint Nextel chairman and CEO. “We established a quick ramp on these investments in the first quarter to accelerate our progress. These increased commitments, along with notably higher device subsidies to drive acquisition and retention, impacted our profitability in the quarter. However, we are seeing some positive tradeoffs in the form of enhanced competitiveness. Examples include:
• Double-digit annual growth in prime credit post-paid acquisitions; • Continuing improvements in the customer experience; • Good progress in integrating our disparate network users through new PowerSource devices
and transitioning to a single billing and service delivery platform; • Stronger key brand recognition metrics as a result of an increase in year-over-year
advertising spend, and further enhancement of our marketing potential with the announcement of a new advertising agency;
• iDEN and CDMA networks now performing at their “best ever” levels; and • Great strides in planning for next generation capabilities, including announcing the market
launch schedule for our WiMAX broadband wireless data services. “In the quarter, we had solid performance in our CDMA post-paid business, including sequential growth in both gross and net additions and improved customer churn,” said Forsee. “We also achieved a stronger Boost Mobile customer gain, continued growth in MVNO channels and good velocity with PowerSource sales. Together, these four lines of business generated 1.3 million net additions during the first quarter. However, these gains were partially offset by a decline in the iDEN post-paid subscriber base reflecting prior network constraints, which have since been largely mitigated. “Overall post-paid subscriber retention rates again trended slightly positive in the quarter, and reported net add performance was ahead of expectations. In the quarter, 44% year-over-year growth in wireless data services continued to partially offset voice revenue declines. In the Wireline segment, we reported 28% growth in IP services year-over-year, and increased the number of cable telephony customers we serve by more than 200,000 during the quarter. Over the course of the year, we expect to achieve improving profitability in consolidated results, consistent with our previously announced annual guidance,” Forsee said. Editor’s Note: In accordance with purchase accounting rules, Sprint Nextel’s reported results for the first quarter which ended March 31, 2006, reflect affiliate acquisitions as of the acquisition date.
2
CONSOLIDATED RESULTS
TABLE No. 1 Selected Unaudited Financial Data (in millions, except per share amounts) Diluted EPS below is from continuing operations.
Quarter Ended March 31,
%
∆ Financial Data 2007 2006 Net operating revenues $ 10,096 $ 10,074 —%
Adjusted operating income* 315 598
(47)% Adjusted OIBDA* 2,583 2,944 (12)% Income (loss) from continuing operations (211) 164 NM Diluted earnings (loss) per share $ (0.07) $ 0.05 NM Capex $ 1,607 $ 1,243 29% Free cash flow* $ 497 $ 808 (38)%
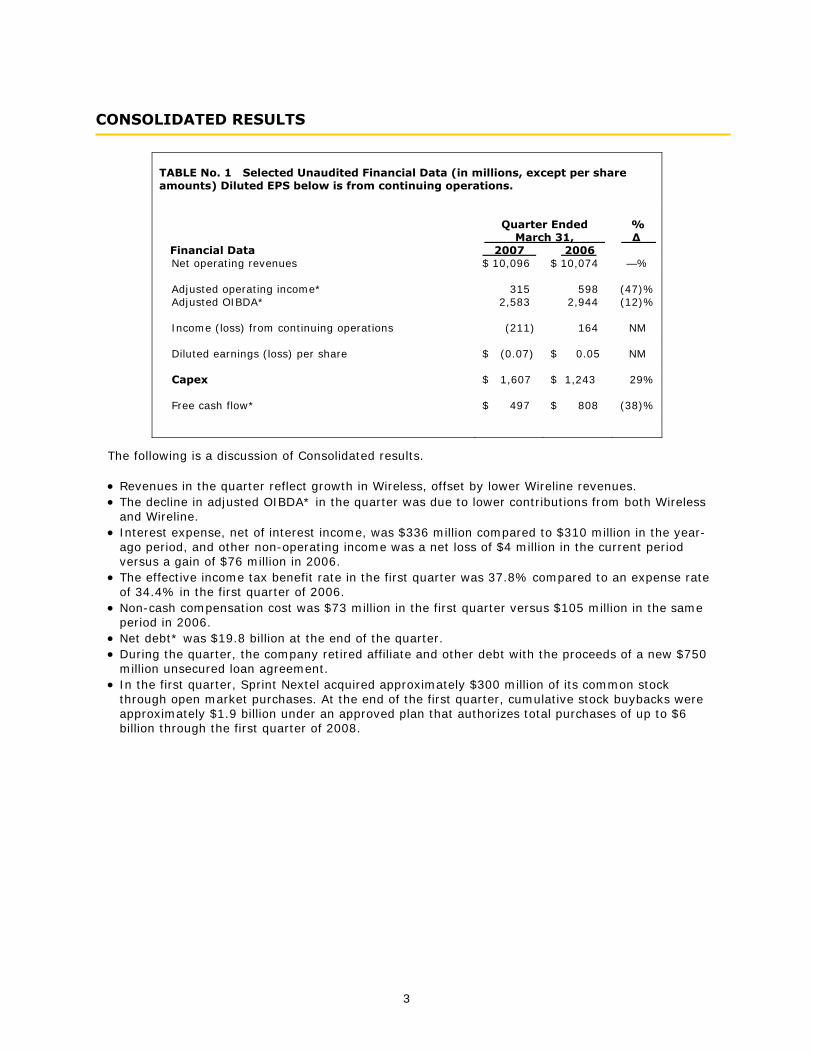
The following is a discussion of Consolidated results. • Revenues in the quarter reflect growth in Wireless, offset by lower Wireline revenues. • The decline in adjusted OIBDA* in the quarter was due to lower contributions from both Wireless
and Wireline. • Interest expense, net of interest income, was $336 million compared to $310 million in the year-
ago period, and other non-operating income was a net loss of $4 million in the current period versus a gain of $76 million in 2006.
• The effective income tax benefit rate in the first quarter was 37.8% compared to an expense rate of 34.4% in the first quarter of 2006.
• Non-cash compensation cost was $73 million in the first quarter versus $105 million in the same period in 2006.
• Net debt* was $19.8 billion at the end of the quarter. • During the quarter, the company retired affiliate and other debt with the proceeds of a new $750
million unsecured loan agreement. • In the first quarter, Sprint Nextel acquired approximately $300 million of its common stock
through open market purchases. At the end of the first quarter, cumulative stock buybacks werapproximately $1.9 billion under an approv
e ed plan that authorizes total purchases of up to $6
billion through the first quarter of 2008.
3

WIRELESS RESULTS
TABLE No. 2 Selected Unaudited Financial Data (dollars in millions) Quarter Ended
March 31, Financial Data 2007 2006
%
∆ Net operating revenues $ 8,723 $ 8,518 2%
Adjusted operating income* 253 461 (45)% Adjusted OIBDA* 2,395 2,684 (11)% Adjusted OIBDA margin 29.7% 34.9% Capex1 $ 1,403 $ 1,071 31% 1Capex includes re-banding capital, but excludes non-network rebanding costs
The following is a discussion of our Wireless results. Subscribers • In the quarter, Wireless added nearly 600,000 subscribers and ended the quarter with a total
subscriber base of 53.6 million, a 10 percent increase from the year-ago period.
o Post-paid subscribers declined by 220,000, reflecting a gain in CDMA and PowerSource subscribers, offset by a decline in iDEN subscribers.
o At the end of the quarter, the company served 41.6 million post-paid subscribers, including 24.7 million on CDMA, 16.5 million on iDEN and 400,000 PowerSource users who access both platforms.
o Boost Mobile prepaid net subscriber additions were 275,000 for the quarter, bringing the ending base to 4.3 million. Boost Unlimited additions were minimal in the quarter.
o Wholesale channels added 467,000 subscribers in the quarter, and the total base at the end of the period was 6.8 million.
o Affiliate channels added 46,000 in the quarter, increasing the base to 945,000. • In the quarter, the company announced the availability of Upstage by Samsung, the first U.S.
wireless phone designed with a revolutionary form factor that optimizes music capabilities with the look of a phone on one side and an MP3 player on the other. Sprint also bolstered its music leadership with the announcement of plans to offer song downloads from the Sprint Music StoreSM for 99 cents each – the lowest rate available for over-the-air song downloads purchased in the United States.
Churn • Post-paid churn for the quarter was 2.3%, compared to a little over 2.3% in the fourth quarter
2006 and 2.1% in the year-ago first quarter. In the quarter, CDMA churn improved sequentially and year-over-year. The iDEN post-paid churn rate increased in the quarter, although total deactivations were modestly lower sequentially. Churn within the former Nextel Partners base improved from the fourth quarter but remained significantly above core iDEN levels.
• Boost Mobile prepaid churn was 7.0% for the quarter compared to 6.5% in the fourth quarter 2006 and 5.4% in the first quarter of 2006. Boost Mobile churn was partially impacted by actions to remove inactive subscribers.
4

Revenues/ARPU • %
ed
•
ontributions. CDMA ARPU declined
• e quarter, which was a 2% sequential
• d $9.25 or 16% of overall ARPU in
ented more than 20% of CDMA ARPU.
p
•
s 0
•
• e
to lower depreciation rates determined under group
life depreciation accounting. This decrease was partially offset by business acquisitions and an loyed capital asset base.
• capital investment by $992 million.
• ssociated with the WiMAX broadband network, but the rate of capital expenditures is expected to increase over the course of the year, with plans calling for initial market deployments by year end.
Net operating revenues increased 2% compared to the year-ago period. This was due to a 4increase in direct service revenues and a 29% increase in wholesale and affiliate revenues, partially offset by a 22% decline in equipment revenues. The lower equipment revenues are due to lower gross additions and more competitive pricing. Compared to the year-ago period, prime credit gross additions increased 14%, while sub-prime declined more than 30%. Sequentially, post-paid gross additions were flat and prepaid gross additions increased. Total revenues declin3% sequentially due to a lower post-paid average revenue per user, or ARPU, and a decline in equipment revenues associated with more aggressive acquisition and retention handset pricing. Post-paid ARPU in the quarter was a little more than $59, a decline of slightly less than 5% fromthe year-ago period and a decline of a little under 2% sequentially. In the quarter, lower voice contributions to ARPU were partially offset by increased data c1% from the year-ago period while iDEN ARPU declined 9%. Boost Mobile ARPU was a little more than $32 for thimprovement but a 12% decline from a year ago. Data service revenues were nearly $1.2 billion in the quarter, an increase of 44% compared to the year-ago period and a 5% sequential increase. Data contributethe quarter and repres
O erating Expenses • Total operating expenses were $8.6 billion in the quarter, an increase of 7% year-over-year and
2% sequentially. In the quarter, costs of services increased 11% compared to the year-ago period but were flat sequentially. The year-over-year increase is due to increased network costs to support a larger footprint and subscriber base and new EV-DO data capabilities. EV-DO revision A, which provideindustry-leading wireless data speeds, currently reaches a population area covering nearly 20million people, and the CDMA and iDEN voice networks both cover an area of more than 270 million people. Cost of products increased 10% year-over-year and 8% sequentially. The major contributors to the increase were handset mix, the ramp-up of higher cost PowerSource devices, and costs associated with restocking Boost Mobile handsets in selected iDEN markets. SG+A costs increased 7% from the first quarter of 2006 and 5% sequentially, mainly due to higher advertising costs, increased dealer commissions and sequentially higher employee incentivcompensation. Bad debt expense increased from the year-ago period, but declined sequentially. Depreciation expense decreased 4% from the year-ago first quarter and decreased 7% from thefourth quarter. The decrease was mainly due
increase in the dep Capital Spending
In the quarter, Adjusted OIBDA* exceeded• Total capital investment in the quarter was $1.4 billion and was targeted at increasing network
capacity, footprint and new functionality. In the quarter, there was minimal capital spending a
5
WIRELINE RESULTS
TABLE No. 3 Selected Unaudited Financial Data (dollars in millions)
Quarter Ended March 31,
%
∆ 2007 2006 Net operating revenues $ 1,598 $ 1,666 (4)% Adjusted operating income* 78 117 (33)% Adjusted OIBDA* 205 239 (14)% Adjusted OIBDA margin* 12.8% $ 14.3% Capex $ 144 $ 92 57%
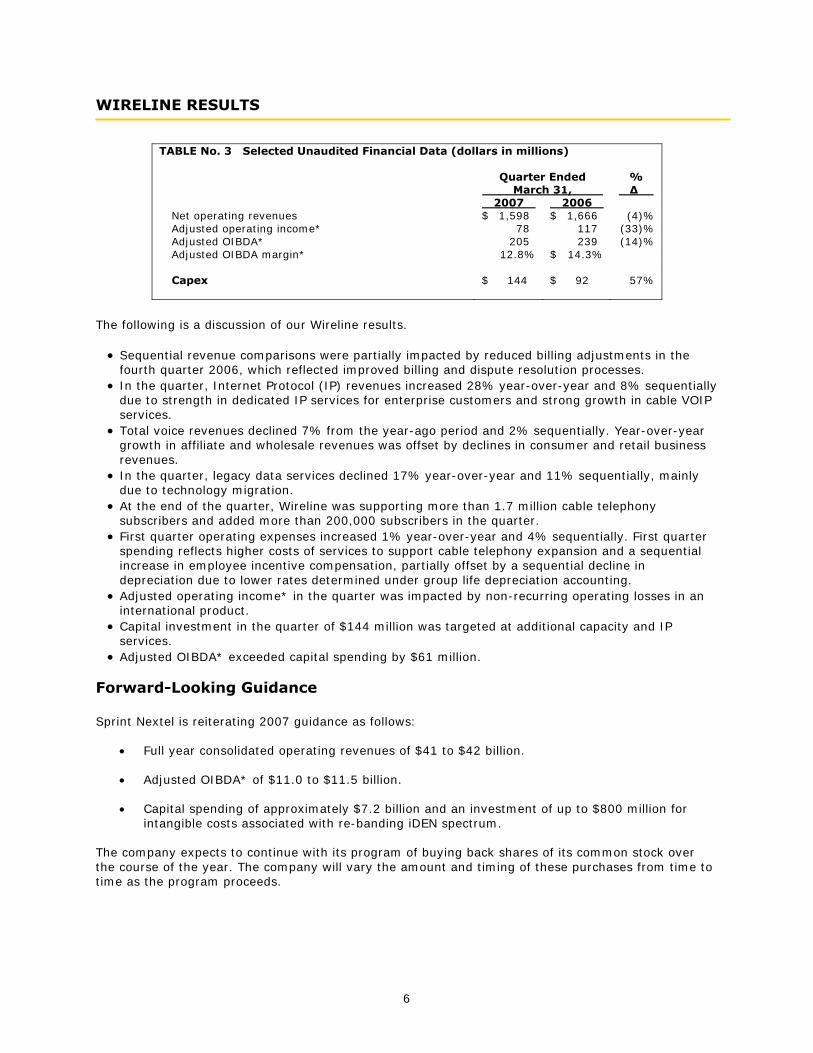
The following is a discussion of our Wireline results. • Sequential revenue comparisons were partially impacted by reduced billing adjustments in the
fourth quarter 2006, which reflected improved billing and dispute resolution processes. • In the quarter, Internet Protocol (IP) revenues increased 28% year-over-year and 8% sequentially
due to strength in dedicated IP services for enterprise customers and strong growth in cable VOIP services.
• Total voice revenues declined 7% from the year-ago period and 2% sequentially. Year-over-year growth in affiliate and wholesale revenues was offset by declines in consumer and retail business revenues.
• In the quarter, legacy data services declined 17% year-over-year and 11% sequentially, mainly due to technology migration.
• At the end of the quarter, Wireline was supporting more than 1.7 million cable telephony subscribers and added more than 200,000 subscribers in the quarter.
• First quarter operating expenses increased 1% year-over-year and 4% sequentially. First quarter spending reflects higher costs of services to support cable telephony expansion and a sequential increase in employee incentive compensation, partially offset by a sequential decline in depreciation due to lower rates determined under group life depreciation accounting.
• Adjusted operating income* in the quarter was impacted by non-recurring operating losses in an international product.
• Capital investment in the quarter of $144 million was targeted at additional capacity and IP services.
• Adjusted OIBDA* exceeded capital spending by $61 million.
print Nextel is reiterating 2007 guidance as follows:
• Full year consolidated operating revenues of $41 to $42 billion.
• Adjusted OIBDA* of $11.0 to $11.5 billion.
• ent of up to $800 million for intangible costs associated with re-banding iDEN spectrum.
any will vary the amount and timing of these purchases from time to me as the program proceeds.
Forward-Looking Guidance S
Capital spending of approximately $7.2 billion and an investm
The company expects to continue with its program of buying back shares of its common stock over the course of the year. The compti
6

*FINANCIAL MEASURES
Sprint Nextel provides financial measures generated using generally accepted accounting principles (GAAP) and using adjustments to GAAP (non-GAAP). The non-GAAP financial measures reflect industry conventions, or standard measures of liquidity, profitability or performance commonly used by the investment community for comparability purposes. These non-GAAP measures are not measurements under accounting principles generally accepted in the United States. These measurements should be considered in addition to, but not as a substitute for, the information contained in our financial statements prepared in accordance with GAAP. We have defined below each of the non-GAAP measures we use, but these measures may not be synonymous to similar measurement terms used by other companies. Sprint Nextel provides reconciliations of these non-GAAP measures in its financial reporting. Because Sprint Nextel does not predict special items that might occur in the future, and our forecasts are developed at a level of detail different than that used to prepare GAAP-based financial measures, Sprint Nextel does not provide reconciliations to GAAP of its forward-looking financial measures. The measures used in this release include the following: Adjusted Earnings (Loss) per Share (EPS) is defined as income from continuing operations, before special items, net of tax and the diluted EPS calculated thereon. Adjusted EPS before Amortization is defined as income from continuing operations, before special items and amortization, net of tax, and the diluted EPS calculated thereon. These non-GAAP measures should be used in addition to, but not as a substitute for, the analysis provided in the statement of operations. We believe that these measures are useful because they allow investors to evaluate our performance for different periods on a more comparable basis by excluding items that relate to acquired amortizable intangible assets and not to the ongoing operations of our businesses. Adjusted Net Income (Loss) is defined as income (loss) from continuing operations before special items, net of tax. Adjusted Net Income before Amortization is defined as income (loss) from continuing operations before special items and amortization, net of tax. These non-GAAP measures should be used in addition to, but not as a substitute for, the analysis provided in the statement of operations. We believe that these measures are useful because they allow investors to evaluate our performance for different periods on a more comparable basis by excluding items that do not relate to the ongoing operations of our businesses. Adjusted Operating Income (Loss) is defined as operating income (loss) before special items. This non-GAAP measure should be used in addition to, but not as a substitute for, the analysis provided in the statement of operations. We believe this measure is useful because it allows investors to evaluate our operating results for different periods on a more comparable basis by excluding special items. Adjusted OIBDA is defined as operating income before depreciation, amortization, restructuring and asset impairments, and special items. Adjusted OIBDA Margin represents Adjusted OIBDA divided by non-equipment net operating revenues for Wireless and Adjusted OIBDA divided by net operating revenues for Long Distance. These non-GAAP measures should be used in addition to, but not as a substitute for, the analysis provided in the statement of operations. We believe that Adjusted OIBDA and Adjusted OIBDA Margin provide useful information to investors because they are an indicator of the strength and performance of our ongoing business operations, including our ability to fund discretionary spending such as capital expenditures, spectrum acquisitions and other investments and our ability to incur and service debt. While depreciation and amortization are considered operating costs under generally accepted accounting principles, these expenses primarily represent non-cash current period allocation of costs associated with long-lived assets acquired or constructed in prior periods. Adjusted OIBDA and Adjusted OIBDA Margin are calculations commonly used as a basis for investors, analysts and credit rating agencies to evaluate and compare the periodic and future operating performance and value of companies within the telecommunications industry. Free Cash Flow is defined as the change in cash and cash equivalents less the change in debt, investment in certain securities, proceeds from common stock and other financing activities, net, from
7

continuing operations. This non-GAAP measure should be used in addition to, but not as a substitute for, the analysis provided in the statement of cash flows. We believe that Free Cash Flow provides useful information to investors, analysts and our management about the cash generated by our core operations after interest and dividends and our ability to fund scheduled debt maturities and other financing activities, including discretionary refinancing and retirement of debt and purchase or sale of investments. Net Debt is consolidated debt, including current maturities, less cash and cash equivalents, current marketable securities and restricted cash. This non-GAAP measure should be used in addition to, but not as a substitute for, the analysis provided in the balance sheet and statement of cash flows. We believe that Net Debt provides useful information to investors, analysts and credit rating agencies about the capacity of the company to reduce the debt load and improve its capital structure. SAFE HARBOR This news release includes “forward-looking statements” within the meaning of the securities laws. The statements in this news release regarding the business outlook, expected performance, forward-looking guidance, continuation of our previously announced share buy-back program, as well as other statements that are not historical facts, are forward-looking statements. The words "estimate," "project," ”forecast,” "intend," "expect," "believe," "target," “providing guidance” and similar expressions are intended to identify forward-looking statements. Forward-looking statements are estimates and projections reflecting management's judgment based on currently available information and involve a number of risks and uncertainties that could cause actual results to differ materially from those suggested by the forward-looking statements. With respect to these forward-looking statements, management has made assumptions regarding, among other things, customer and network usage, customer growth and retention, pricing, operating costs, the timing of various events and the economic environment. Future performance cannot be assured. Actual results may differ materially from those in the forward-looking statements. Some factors that could cause actual results to differ include:
• the effects of vigorous competition, including the impact of competition on the price we are
able to charge customers for services we provide and our ability to attract new customers and retain existing customers; the overall demand for our service offerings, including the impact of decisions of new subscribers between our post-paid and prepaid services offerings and between our two network platforms; and the impact of new, emerging and competing technologies on our business;
• the impact of overall wireless market penetration on our ability to attract and retain customers
with good credit standing and the intensified competition among wireless carriers for those customers;
• the potential impact of difficulties we may encounter in connection with the integration of the
pre-merger Sprint and Nextel businesses, and the integration of the businesses and assets of Nextel Partners, Inc. and the PCS Affiliates that we have acquired, including the risk that these difficulties could prevent or delay our realization of the cost savings and other benefits we expect to achieve as a result of these integration efforts and the risk that we will be unable to continue to retain key employees;
• the uncertainties related to the implementation of our business strategies, investments in our
networks, our systems, and other businesses, including investments required in connection with our planned deployment of a next generation broadband wireless network;
• the costs and business risks associated with providing new services and entering new
geographic markets, including with respect to our development of new services expected to be provided using the next generation broadband wireless network that we plan to deploy;
8

• the impact of potential adverse changes in the ratings afforded our debt securities by ratings
agencies; • the effects of mergers and consolidations and new entrants in the communications industry
and unexpected announcements or developments from others in the communications industry; • unexpected results of litigation filed against us;
• the inability of third parties to perform to our requirements under agreements related to our
business operations, including a significant adverse change in Motorola, Inc.’s ability or willingness to provide handsets and related equipment and software applications, or to develop new technologies or features for our iDEN®, network;
• the impact of adverse network performance; • the costs of compliance with regulatory mandates, particularly requirements related to the
Federal Communications Commission’s Report and Order; • equipment failure, natural disasters, terrorist acts, or other breaches of network or information
technology security; • one or more of the markets in which we compete being impacted by changes in political or
other factors such as monetary policy, legal and regulatory changes or other external factors over which we have no control; and
• other risks referenced from time to time in our filings with the Securities and Exchange
Commission, including our Form 10-K for the year ended December 31, 2006, in Part I, Item 1A, “Risk Factors.”
Sprint Nextel believes these forward-looking statements are reasonable; however, you should not place undue reliance on forward-looking statements, which are based on current expectations and speak only as of the date of this release. Sprint Nextel is not obligated to publicly release any revisions to forward-looking statements to reflect events after the date of this release. ABOUT SPRINT NEXTEL Sprint Nextel offers a comprehensive range of wireless and wireline communications services bringing the freedom of mobility to consumers, businesses and government users. Sprint Nextel is widely recognized for developing, engineering and deploying innovative technologies, including two robust wireless networks serving more than 53.6 million customers at the end of the first quarter 2007; industry-leading mobile data services; instant national and international walkie-talkie capabilities; and a global Tier 1 Internet backbone. For more information, visit www.sprint.com.
9

Sprint Nextel CorporationCONSOLIDATED STATEMENTS OF OPERATIONS (Unaudited) (a)
(millions, except per share data)
TABLE No. 4 Quarter EndedMarch 31, March 31,
2007 2006
Net Operating Revenues 10,096$ 10,074$ Operating Expenses
Costs of services 2,971 2,821 Costs of products 1,379 1,253 Selling, general and administrative (1) 3,303 3,132 Severance, lease exit costs and asset impairments (2) 174 38 Depreciation 1,355 1,408 Amortization 913 938 Total operating expenses 10,095 9,590
Operating Income 1 484 Interest expense (367) (394) Interest income 31 84 Gain on early retirement of debt 4 1 Equity in (losses) earnings of unconsolidated investees, net (2) 20 Other, net (6) 55 (Loss) Income from continuing operations before income taxes (339) 250 Income tax expense 128 (86) (Loss) Income from Continuing Operations (211) 164 Discontinued operations, net (3) - 255 Net (Loss) Income (211) 419 Preferred stock dividends paid - (2) (Loss) Income Available to Common Shareholders (211)$ 417$
Diluted (Loss) Earnings Per Common Share (0.07)$ 0.14$ Discontinued operations, net (3) - (0.09) Diluted (Loss) Earnings Per Common Share from Continuing Operations (0.07)$ 0.05$
Diluted weighted average common shares 2,898.7 2,993.7
Basic (Loss) Earnings Per Common Share (0.07)$ 0.14$
(a) Results for each of the periods reflected include the results of each of the acquired PCS Affiliates and Velocita from either the date ofthe acquisition or the start of the month closest to the acquisition date.
(1), (2), (3) See accompanying Notes to Financial Data.
10

Sprint Nextel CorporationRECONCILIATIONS OF EARNINGS PER SHARE (Unaudited)
(millions, except per share data)
TABLE No. 5Quarter Ended
March 31, March 31,2007 2006
(Loss) Income Available to Common Shareholders (211)$ 417$ Preferred stock dividends paid - 2 Net (Loss) Income (211) 419 Discontinued operations, net - (255) (Loss) Income from Continuing Operations (211) 164 Special items (net of taxes) (a)
Severance, lease exit costs and asset impairments 109 23 Merger and integration expense 60 46
Contingencies and Other (a) 25 - Net gains on investment activities and equity in earnings - (32) Gain on early retirement of debt (2) -
Adjusted Net (Loss) Income* (19)$ 201$
Amortization (net of taxes) 551 565 Adjusted Net Income before Amortization* 532$ 766$
Diluted (Loss) Earnings Per Share (0.07)$ 0.14$ Discontinued operations, net - (0.09) (Loss) Earnings Per Share from Continuing Operations (0.07) 0.05 Special items 0.07 0.02
Adjusted Earnings Per Share* 0.00$ 0.07$
Amortization (net of taxes) (b) 0.18 0.19
Adjusted Earnings Per Share before Amortization* 0.18$ 0.26$
(a) See accompanying Notes to Financial Data for more information(b) Rounding differences are recorded to the Amortization (net of taxes) line
11

Sprint Nextel CorporationCONDENSED CONSOLIDATED BALANCE SHEETS
(millions)
TABLE No. 6 (Unaudited)March 31, December 31,
2007 2006Assets
Current assetsCash and cash equivalents $ 2,346 $ 2,046 Marketable securities 8 15 Accounts receivable, net 4,258 4,595 Inventories 884 1,176 Deferred tax assets 602 923 Prepaid expenses and other current assets 849 1,549 Total current assets 8,947 10,304
Investments 261 253 Property, plant and equipment, net 26,071 25,868 Goodwill 30,556 30,904 FCC licenses and other 20,384 19,935 Customer relationships, net 6,348 7,256 Other definite lived intangible assets, net 1,916 1,962 Other assets 606 679
Total $ 95,089 $ 97,161
Liabilities and Shareholders' EquityCurrent liabilities
Accounts payable $ 3,307 $ 3,394 Accrued expenses and other liabilities 4,606 5,261 Current portion of long-term debt and capital lease obligations 419 1,143 Total current liabilities 8,332 9,798
Long-term debt and capital lease obligations 21,752 21,011 Deferred income taxes 9,160 10,095 Postretirement and other benefit obligations 244 244 Other liabilities 3,129 2,882
Total liabilities 42,617 44,030
Shareholders' equityCommon shares 5,902 5,902 Treasury shares, at cost (1,073) (925)Other shareholders' equity 47,643 48,154 Total shareholders' equity 52,472 53,131
Total $ 95,089 $ 97,161
12

Sprint Nextel CorporationCONDENSED CONSOLIDATED CASH FLOW INFORMATION (Unaudited) (a)
(millions)
TABLE No. 7
March 31, March 31,For the Year-to-Date Period Ended 2007 2006
Operating Activities Net (Loss) income (211)$ 419$ Discontinued operations, net - (255) Depreciation and amortization 2,268 2,346 Deferred income taxes (185) 129 Other, net 592 (372) Net cash provided by continuing operations 2,464 2,267 Net cash provided by discontinued operations - 698 Net cash provided by operating activities 2,464 2,965
Investing Activities Cash paid for capital expenditures (1,813) (1,728) Expenditures relating to FCC licenses and other intangible assets (109) (136) Cash collateral for securities loan agreements 866 - Acquisitions, net of cash acquired - (3,399) Proceeds from sales of assets and investments 27 123 Purchases of marketable securities - (464) Proceeds from maturities and sales of marketable securities 7 1,294 Other, net - 51 Net cash used in investing activities (1,022) (4,259)
Financing Activities Borrowings under credit facility 750 - Purchase and retirements of debt (608) (868) Proceeds from issuance of commercial paper 2,591 - Commercial paper maturities (2,706) - Payments of securities loan agreements (866) - Purchase of common shares (300) - Retirement of redeemable preferred shares - (247) Proceeds from issuance of common shares 69 185 Dividends paid (72) (76) Net cash used in financing activities (1,142) (1,006)
Change in cash and cash equivalents 300 (2,300)
Cash and cash equivalents, beginning of period 2,046 8,903
Cash and cash equivalents, end of period 2,346$ 6,603$
13

Sprint Nextel CorporationNON-GAAP MEASURES AND RECONCILIATIONS (Unaudited)
(millions)
TABLE No. 8 Long Corporate &For the Quarter Ended March 31, 2007 Consolidated Wireless Distance Eliminations
Operating Income (Loss) 1$ 94$ 23$ (116)$ Special items (a)
Severance, lease exit costs and asset impairments 174 141 32 1 Merger and integration expense 99 - - 99 Contingencies and Other (a) 41 18 23 - Adjusted Operating Income (Loss)* 315 253 78 (16) Depreciation and amortization 2,268 2,142 127 (1) Adjusted OIBDA* 2,583 2,395 205 (17) Capital expenditures 1,607 1,403 144 60 Adjusted OIBDA* less Capex 976$ 992$ 61$ (77)$
Long Corporate &For the Quarter Ended March 31, 2006 Consolidated Wireless Distance Eliminations
Operating Income (Loss) 484$ 433$ 107$ (56)$ Special items (a)
Severance, lease exit costs and asset impairments 38 28 10 - Merger and integration expense 76 - - 76 Adjusted Operating Income* 598 461 117 20 Depreciation and amortization 2,346 2,223 122 1 Adjusted OIBDA* 2,944 2,684 239 21 Capital expenditures 1,243 1,071 92 80 Adjusted OIBDA* less Capex 1,701$ 1,613$ 147$ (59)$
(a) See accompanying Notes to Financial Data for more information
14

Sprint Nextel CorporationNON-GAAP MEASURES AND RECONCILIATIONS (Unaudited)
(millions)
TABLE No. 9Quarter Ended
March 31, March 31,2007 2006
WirelessAdjusted OIBDA* 2,395$ 2,684$ Service, wholesale, affiliate and other net operating revenues (a) 8,065 7,688 Adjusted OIBDA margin* 29.7% 34.9%
Operating income 94$ 433$ Operating income margin 1.2% 5.6%
Long DistanceAdjusted OIBDA* 205$ 239$ Total net operating revenues 1,598 1,666 Adjusted OIBDA margin* 12.8% 14.3%
Operating income 23$ 107$ Operating income margin 1.4% 6.4%
Consolidated Adjusted OIBDA* 2,583$ 2,944$ Service, wholesale, affiliate and other net operating revenues (a) 9,438 9,244 Adjusted OIBDA margin* 27.4% 31.8%
Operating income 1$ 484$ Operating income margin 0.0% 5.2%
(a) Excludes $10 million of revenue generated by Velocita, which has been normalized out of Adjusted OIBDA.
15

Sprint Nextel CorporationNON-GAAP MEASURES AND RECONCILIATIONS
(millions)
TABLE No. 10Quarter Ended
March 31, March 31,2007 2006
Adjusted OIBDA* 2,583$ 2,944$ Adjust for special items (314) (114) Other operating activities, net (a) 195 (563) Cash provided by continuing operations (GAAP) 2,464 2,267 Capital expenditures (1,813) (1,518) Dividends paid (72) (76) Proceeds from sales of assets 27 119 Payments for FCC Licenses (107) (136) Other investing activities, net (2) 152 Free Cash Flow* 497 808 Increase (decrease) in debt, net 27 (868) Retirement of redeemable preferred shares - (247) Purchase of common shares (300) - Discontinued operations activity, net (b) - 298 Purchase of PCS Affiliates and Velocita, net of cash acquired - (3,399) Change in restricted cash - 93 Investments in debt securities, net 7 830 Proceeds from common shares issued 69 185 Change in cash and cash equivalents - GAAP 300$ (2,300)$
TABLE No.11March 31,
2007Total Debt 22,171$
Less: Cash on hand (2,346) Less: Current marketable securities (8)
Net Debt* 19,817$
(a) Other operating activities, net includes the change in working capital, change in deferred income taxes, miscellaneous operating activities and non-operating items in net income (loss).(b) See accompanying Notes to Financial Data for more information
16

Sprint Nextel CorporationOPERATING STATISTICS
TABLE No. 121Q07 4Q06
WirelessFinancial and Other Statistics
Direct Post-Paid Subscribers Service revenue (in millions) 7,418$ 7,588$ ARPU 59$ 60$ Churn 2.3% 2.3% Additions (in thousands) (220) (306) End of period subscribers (in thousands) 41,585 41,805 Hours per subscriber 16 16
Direct Prepaid Subscribers Service revenue (in millions) 397$ 371$ ARPU 32$ 32$ Churn 7.0% 6.5% Additions (in thousands) 275 171 End of period subscribers (in thousands) 4,287 4,012
Wholesale Subscribers Additions (in thousands) 467 830 End of period subscribers (in thousands) 6,825 6,358
Affiliate Subscribers Additions (in thousands) 46 46 End of period subscribers (in thousands) 945 899
Total Subscribers Additions (in thousands) 568 741 End of period subscribers (in thousands) 53,642 53,074
Number of cell sites on air (in thousands) 62 61
Adjusted OIBDA* (in millions) (1) (3) 2,395$ -Service, wholesale, affiliate and other net operating revenues(in millions) (2) (3) 8,065$ -Adjusted OIBDA margin* (3) 29.7% -
Capital expenditures 1,403$ 2,238$ Adjusted OIBDA* less capital expenditures (3) 992$ -
Long Distance
Financial and Other Statistics (dollars in millions, except where stated)
Total Long Distance Net Operating Revenues 1,598$ 1,632$ Voice net operating revenue 898$ 912$ Data net operating revenue 311$ 350$ Internet net operating revenue 344$ 319$ Other net operating revenue 45$ 51$
Total Operating Expenses 1,575$ 1,520$ Costs of services and products 1,112$ 1,096$ Selling, general and administrative 304$ 272$ Depreciation 127$ 147$ Severance, lease exit costs and asset impairments 32$ 5$
Operating income 23$ 112$ Operating income margin 1.4% 6.9%
Adjusted OIBDA* (3) 205$ -Adjusted OIBDA margin* (3) 12.8% -
Capital expenditures 144$ 274$ Adjusted OIBDA* less capital expenditures (3) 61$ -
YOY voice volume growth 4% 1%
(1) See Table 8 for Adjusted OIBDA* reconciliation.(2) Excludes $10 million of revenue generated by Velocita, which has been normalized out of Adjusted OIBDA.(3) 4Q06 non-GAAP metrics and other items not included.
17

Sprint Nextel CorporationNOTES TO FINANCIAL DATA (Unaudited)
(1) In the first quarter 2007, we recorded merger and integration costs of $99 million pre-tax ($60 million, net of tax). All merger costs were related to the Sprint-Nextel merger, the PCS Affiliates and Nextel Partners' acquisitions. Certain merger and integration costs are generally considered to be non-recurring in nature and have been reflected as unallocated corporate costs and therefore excluded from segment results.
In the first quarter 2006, we recorded merger and integration costs of $76 million pre-tax ($46 million, net of tax). All merger costs were related to the Sprint-Nextel merger, the PCS Affiliates and Nextel Partners' acquisitions. Certain merger and integration costs are generally considered to be non-recurring in nature and have been reflected as unallocated corporate costs and therefore excluded from segment results.
(2) In the first quarter 2007, we recorded severance, lease exit costs and asset impairment charges of $174 million pre-tax ($109 million, net of tax), which consists of about $166 million pre-tax related to work force reductions and lease termination charges, and $8 million pre-tax of asset impairments primarily related to the abandonment of various assets. Severance, lease exit costs and asset impairment charges are allocated to the appropriate segment results.
In the first quarter 2006, we recorded severance and asset impairment charges of $38 million pre-tax ($23 million, net of tax), which consists of about $20 million pre-tax in severance and related costs associated to work force reductions of legacy Sprint employees and $18 million pre-tax of asset impairments primarily related to software asset impairment and abandonment. Severance, lease exit costs and asset impairment charges are allocated to the appropriate segment results.
(3) In May 2006 we entered into a separation and distribution agreement with Embarq Corporation, which consists primarily of the business that we had reported as the Local segment in our consolidated financial statements in prior periods and at the time, was a wholly owned subsidiary. On May 17, 2006, we completed the spin off of Embarq. The results of the discontinued operations (net of tax), have been reclassified out of the operating results as of the first day of each period presented.
(4) Contingencies and other includes a charge associated with legal contingencies and net costs associated with the planned exit of a non-core line of business.
18