springfield fire department - the state journal...
TRANSCRIPT

Springfield Fire Department
GIS Analysis ofFire Stations and Apparatus
Prepared by:
TTThhheee LLLuuudddwwwiiiggg GGGrrrooouuuppp,,, LLLLLLCCC8915 Eatonwick Drive, Suite 200
Memphis, TN 38016(636) 789-5660
November 2012

Acknowledgements
The Ludwig Group greatly appreciates the excellent cooperation received from all
levels, departments, and organizations within the Springfield Fire Department.
We thank members of the Springfield Fire Department who cooperated, provided
information, or were interviewed.
We wish to especially thank the following individuals for helping to launch,
coordinate, and advise the project.
Chief Ken Fustin Fire Chief
Chief Robert Helmerichs Division Chief of Technical Services
The Ludwig Group Staff and Consultants
Gary Ludwig, Project Manager
Jo Ellen Walker, Subject Matter Expert

Springfield (Illinois)Fire Department
GIS Analysis ofFire Stations and Apparatus
Prepared by:
The Ludwig Group, LLC8915 Eatonwick Drive, Suite 200
Memphis, TN 38016(636) 789-5660
November 2012

Table of Contents
Chapter Page
Chapter 1 – Executive Summary 1
Chapter 2 – Response Times 2
Response Time Standards 2Factors Affecting Response Times 3
Chapter 3 – Call Volume 7
Chapter 4 – Conclusion 9
Facilities 9Fire Station Planning 10Findings 12Recommendations 12
Distribution of All Calls in 2011 Section 1
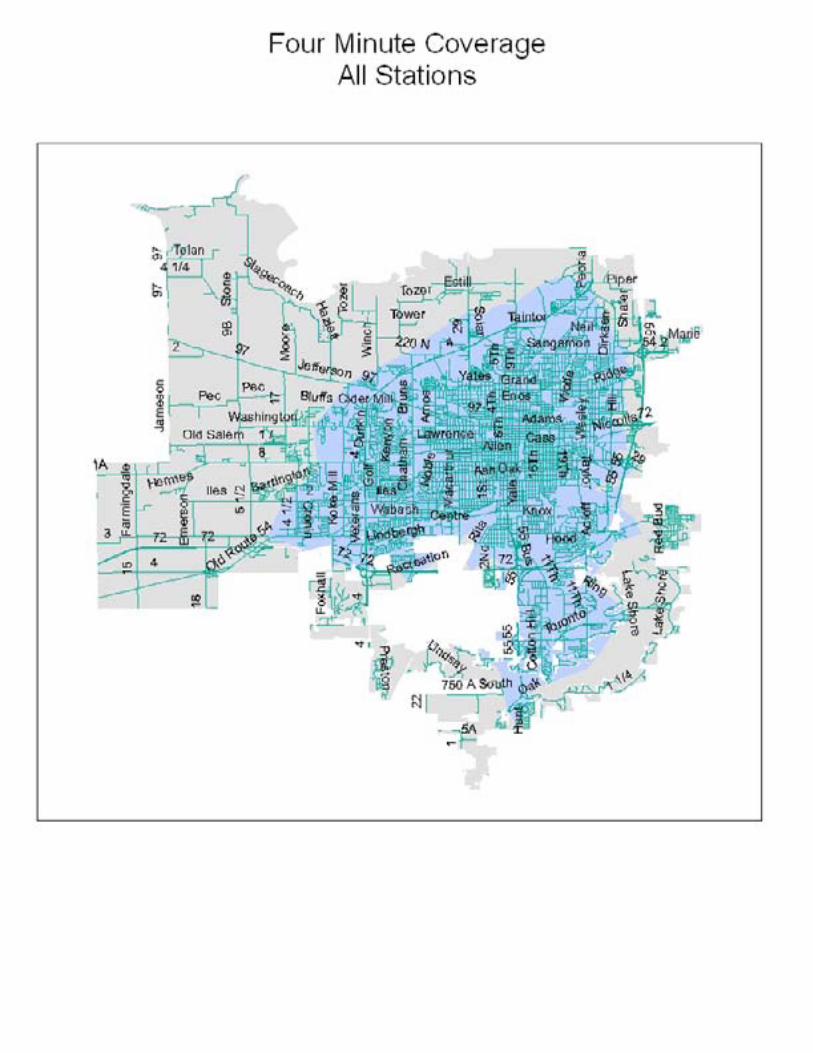
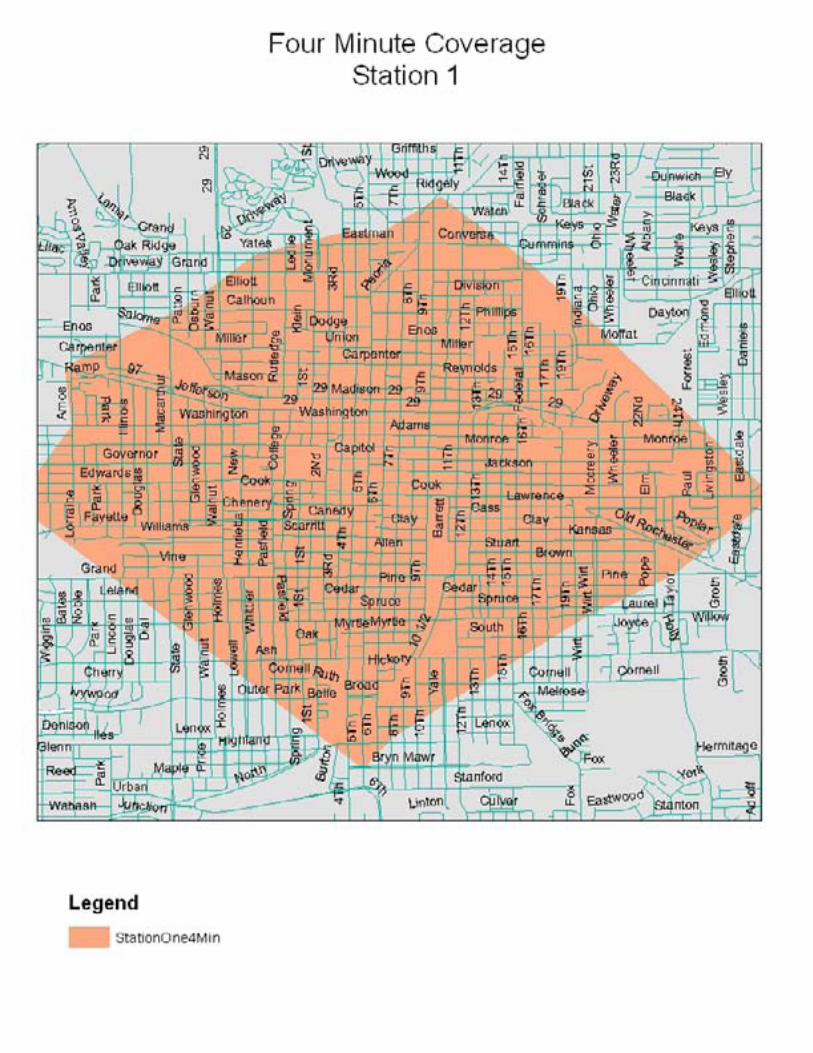
Four Minute Response Zones for Engine Companies Section 2
Eight Minute Response Zones for Ladder Truck Companies Section 3
Engine Company Relocation Section 4
Ladder Truck Relocation Section 5

An GIS Analysis of Fire Response in Springfield, Illinois
The Ludwig Group, LLC November 2012
1
Chapter 1
Executive Summary
A review of the GIS information and formulation of existing and hypothetical fire
stations in Springfield, Illinois has indicated some areas are underserved when
compared against call volume and location and opportunities to adjust fire
equipment and fire stations to achieve better coverage.
In order to better serve the citizens and visitors to Springfield, Illinois, it is
recommended that ladder truck be moved from fire station 12 to 9. Additionally,
the City of Springfield should consider relocating Fire Stations 8, and 10 to
provide better coverage of the City of Springfield.
Additionally, the City of Springfield should consider adding a 13th and 14th fire
station through strategic planning in the future to the northeastern and
southwestern sections of the City in order to provide better coverage to areas
that are currently unprotected with an acceptable response time.

An GIS Analysis of Fire Response in Springfield, Illinois
The Ludwig Group, LLC November 2012
2
Chapter 2
Response Times
This section of the report will deal with each fire engine and ladder truck
response times and discuss well-accepted industry standards.
Response Time Standards
Response time should be defined as the total elapsed time between obtaining a
verifiable address in the communications center and the arrival of sufficient
trained personnel at the scene of the emergency. In some systems, fire
responses are defined as the total time elapsed from the receipt of a verifiable
address until the situation has been successfully mitigated.
Response times may be examined individually, as an average, or as fractals.
Individual response time is measured on a single call basis. Some systems
review this single measure on every call to ensure that response times stay
within set guidelines.
Average response time is the mathematical mean (average) time. All response
times are added up and the total response is divided by the total number of calls.
Fractal response time is the reporting method preferred to response time
averaging. This method is essentially a frequency distribution of response times.
Response times are listed by length of time in order from the shortest to longest
time. Then, a cut-off is drawn to include a percentage (i.e. 90 percent) of the
response times. The response time below that line is the 90 percent fractal
response time (i.e. response time within 6 minutes, 90 percent of the time). All
calls that fall within this 90 percent range are then averaged to determine a
fractal response time. The median response time is the response at the 50
percent line. This method provides easy data analysis to facilitate further
research and system effectiveness reports.
An GIS Analysis of Fire Response in Springfield, Illinois
The Ludwig Group, LLC November 2012
3
Factors Affecting Response Times
A. Elapsed Time Between Inception of a Problem and Detection
The period from start of ignition or detection of a medical problem is a
most critical stage in fire and life safety. Very often, major fires have
been a result of a long burning time before detection. The same can be
said for medical emergencies. The term “Golden Hour” is used to
describe the time period from which the medical emergency is detected
and definitive care can be delivered. Unfortunately, whether it is a fire or
medical emergency, this period is the most difficult for a fire department to
control and reduce.
B. Report of Emergency
The major area of concern to be considered in minimizing the time
required to report an emergency is to educate the residents of the City of
Springfield with the proper procedures to follow after detecting an
emergency. 911 has reduced confusion about whom to contact during an
emergency.
C. Receipt of Alarm and Dispatch of Apparatus
Presently, the Springfield Fire Department is dispatched by the Sangamon
County Combined Dispatch Center (SCCDS), operated jointly by the City
of Springfield and Sangamon County. The alarm center is capable of
receiving an alarm, determining appropriate response assignments, and
dispatching equipment. These alarms should be dispatched within 60
seconds. The utilization of computer-aided dispatching systems improves
efficiency.

An GIS Analysis of Fire Response in Springfield, Illinois
The Ludwig Group, LLC November 2012
4
D. Turnout Time
Turnout time varies depending on the time of the day and location. Career
members may be able to clear the station in 30 seconds or less during the
day if the location is known. Nighttime responses require a longer man-up
time, as can incidents involving unfamiliar locations. The time target is to
clear the station in one minute despite the time of day or location in first-
due areas.
E. Response Time To The Scene of the Alarm
Influencing the response time to the scene is station location, street
patterns, conditions of the streets, traffic congestion, location of fire
companies at time of alarm, and activities of the fire companies. The
standard for response is dictated by the National Fire Protection
Association 1710 standard of the first engine company arriving within four
minutes 90 percent of the time and the first full alarm assignment arriving
on the scene within 8 minutes 90 percent of the time.
F. Station Location
When considering that the fire companies are based statically at stations.
Station location must become the point of focus in calculating the
anticipated lapse time between the fire companies’ receipt of alarm and
their arrival at the fire or emergency medical scene.
G. Other Factors Affecting Response Time
The fire station location considers street patterns, conditions of streets,
and traffic congestion. The remaining two factors that influence the
response time to the scene of an emergency are location of fire
companies at time of alarm and activities of the companies. These are an
administrative consideration and with proper management have little effect
upon the response time.

An GIS Analysis of Fire Response in Springfield, Illinois
The Ludwig Group, LLC November 2012
5
H. Set-up Time At the Scene of the Emergency
Set-up time is that time required for the fire companies to obtain a supply
source of water, lay hose lines in place, locate apparatus, select proper
equipment and devices, place ladders, gain entry, and prepare for the
application of an extinguishing agent or care for a victim.
The time required for fire companies to accomplish the set-up on the
emergency scene and apply an extinguishing agent to the fire is directly
related to the staffing levels. Also impacting this is the type of apparatus,
access to the structure, type of alarm, water supply and hydrant
distribution, built-in fire protection, the magnitude of involvement, number
of companies required, and training of personnel. Operational
procedures and standards are established that will limit set-up time for the
first due companies to two minutes or less. All aspects of the response
time assessment and operation of the fire department relating to set-up
time will be directed toward this objective.

An GIS Analysis of Fire Response in Springfield, Illinois
The Ludwig Group, LLC November 2012
6
Figure 1 reflects the various segments along a response time continuum and
what impact a fire system can have at various points.
Figure 1: Incident Response Timeline
To determine the most appropriate response time, several factors must be
considered. These factors include:
1. The level of demand for fire protection throughout Springfield, Illinois.
2. Actual running time required to reach the various parts of the city from
existing and potential fire station locations.
3. Existing and possible automatic aid agreements with adjoining fire
agencies.
4. Acceptable standards of lapse time for arrival of the first engine company.

An GIS Analysis of Fire Response in Springfield, Illinois
The Ludwig Group, LLC November 2012
7
Chapter 3
Call Volume
The section details call volume for each fire station in the City of Springfield. Any
recommendations in this report will take into consideration any and all impact that
would be placed on other fire stations if one or more fire stations were to be
closed or moved.
In 2011, there were 16,431 calls in the City of Springfield. This does not reflect
the number of runs. As an example, one call can result in four runs if three fire
engines and a chief officer are dispatched on a call.
Of the 16,431 calls, 9,527 were EMS runs. This equates to approximately 58
percent of the run volume being EMS related. Typically, these are single
company responses. Of the remaining 6,904 calls (42 percent) there is a mixture
of single company and multi-company responses.
Table 3.1 on the following page provides for a distribution of calls and runs by
company.

An GIS Analysis of Fire Response in Springfield, Illinois
The Ludwig Group, LLC November 2012
8
Table 3.1 – 2010 and 2011 Call and Run Volume by Company
Company 2010 2011
Engine 1 2539 2718
Engine 2 1464 1575
Engine 3 1462 1407
Engine 4 1805 1980
Engine 5 1820 1961
Engine 6 1505 1481
Engine 7 1429 1337
Engine 8 1712 1658
Engine 9 1333 1359
Engine 10 1060 1065
Engine 11 715 604
Engine 12 1023 1092
Truck 1 1527 1820
Truck 2 721 895
Truck 3 1083 587
Totals 21,198 21,539

An GIS Analysis of Fire Response in Springfield, Illinois
The Ludwig Group, LLC November 2012
9
Chapter 4
Conclusion
In order to efficiently create a more even coverage distribution in the City of
Springfield, a careful analysis of the existing call volume with respect to engine
and truck company static deployment was examined
Facilities
The fire station is the single, most vital unifying force within a fire department. It
not only provides housing for the department’s apparatus and equipment, but
also houses the department’s members. The fire station, as the center of a
community’s fire fighting operations, is a vital symbol of the protection of lives
and property.
The number and location of fire stations must be reevaluated continually because
the buildings and the population of a community constantly change. The number
of fire stations a department will require to accomplish its functions is, like
everything else, a balance between the costs of the buildings and their
maintenance on the one hand, and the need for more fire stations on the other.
If a fire station is located near the high-response section of a community – such
as a heavily populated area of multi-occupancy or wood frame structures – then
fire station relocation would be inappropriate. Fire station relocation would be
more feasible if a fire station is located in a rural area that is considerable
distance from the normal population flow and from urban housing and
development.
Table 4.1 reflects the number of apparatus needed to provide the water flow
recommended by the Insurance Service Office (ISO). All built-up areas should
have an engine company within 1 ½ miles and a ladder/service company with 2
½ miles. Response areas with five buildings that are three stories or 35 feet or

An GIS Analysis of Fire Response in Springfield, Illinois
The Ludwig Group, LLC November 2012
10
more in height, or with five buildings that have a required water flow greater than
3,500 gpm, or any combination of these criteria, should have a ladder company.
Table 4.1: ISO Recommended Water Flows
Required Water Flow
(gpm)
Number of Engine
Companies Needed
Number of Ladder
Companies Needed
4,000 – 4,500 4 1
5,000 – 5,500 5 2
6,000 – 6,500 6 2
7,000 – 7,500 7 3
8,000 – 8,500 8 3
9,000 – 9,500 9 4
10,000 10 4
11,000 11 4
12,000 12 5
The location of a fire station in a community directly affects the total response
time needed to combat fire effectively. For example, although a fire station is
centrally located in a community, the majority of the fires might occur at
substantial distances from the station. Therefore, an evaluation of time from
receipt of an alarm to the arrival at a fire plays an important part in deciding the
need for relocating a fire station.
Fire Station Planning
Fire station planning is critical to managing local fire protection and emergency
medical services. Sound planning of fire station locations can be done in
various ways. With the help of historical response data, deployment can be
based upon call demand or future expected demand call.
Another method for determining optimal locations for fire stations involves
determining response times from various points within the protected area. The
more realistic the average response speeds, the better the projected coverage

An GIS Analysis of Fire Response in Springfield, Illinois
The Ludwig Group, LLC November 2012
11
can be defined.
Another factor that determines optimal fire station locations involves communities
where the risks are accentuated by high population densities and heavy traffic.
Fire departments usually have more fire stations, fire fighters, and fire companies
per thousand population than do fire departments in communities without such
features. Using ArcView Geographic Information Systems (GIS) software, which
analyzes a computer model of the street network, several plots were generated
predicting which roads could be covered by the Springfield Fire Department
within specific time frames consistent with national accepted benchmarks for
response times.
Estimated response time, for the purposes of this analysis, is defined as the time
beginning when apparatus leaves the station enroute to the scene, and ending
when apparatus arrives at the scene. Additionally, response times are based
upon four and eight minute travel times for first due and full alarm assignments.
However, it should be noted that the total response from when the first 911 call is
processed will differ because of factors affecting the time needed to process the
call, dispatch the apparatus, and staff the apparatus. Traditionally, these
segments should add an additional two minutes to any response time.

An GIS Analysis of Fire Response in Springfield, Illinois
The Ludwig Group, LLC November 2012
12
Findings
Engine Company 1 is properly located.
Engine Company 2 is properly located.
Engine Company 3 can be relocated further north and west but there
would not be much advantage for the cost.
Engine Company 4 is properly located.
Engine Company 5 is properly located.
Engine Company 6 is properly located.
Engine Company 7’s response area interfaces with surrounding engine
companies but the removal of this engine company would impact
response with the surrounding companies and create a domino effect
since over 1,300 runs per year would have to be absorbed by other fire
stations.
Engine Company 8 can be relocated further north and west.
Engine Company 9 is properly relocated.
Engine Company 10 can be relocated further west and north.
Engine Company 11 is properly located.
Engine Company 12 is properly located.
Truck 1 is properly located.
Truck 2 can relocated from fire station 12 to fire station 9
Truck 3 is properly located.
Recommendations
Recommendation 4.1 The City of Springfield should consider relocating fire
stations 8 and 10 in order to obtain better coverage and call distribution.
However, it is understood that there will be a cost associated with such a
recommendation. Therefore, careful consideration should be given to cost
versus benefits of such an undertaking.

An GIS Analysis of Fire Response in Springfield, Illinois
The Ludwig Group, LLC November 2012
13
Recommendation 4.2: The City of Springfield, at little or no cost can relocate
Truck 2 from fire station 12 to fire station 9 to obtain better coverage of truck
companies.
Recommendation 4.3: The City of Springfield should incorporate into future city
or strategic planning the addition of a 13th and 14th fire station to the northeastern
section of the city where current growth is occurring as a first consideration and
south and west of the populated areas outside the current four-minute engine
company response zones as a second consideration. Although the call volume
in those areas does not justify fire stations at this point, future population and
commercial growth may warrant better fire and EMS coverage than what
currently exists.

Section 1
Distribution of Calls
in 2011
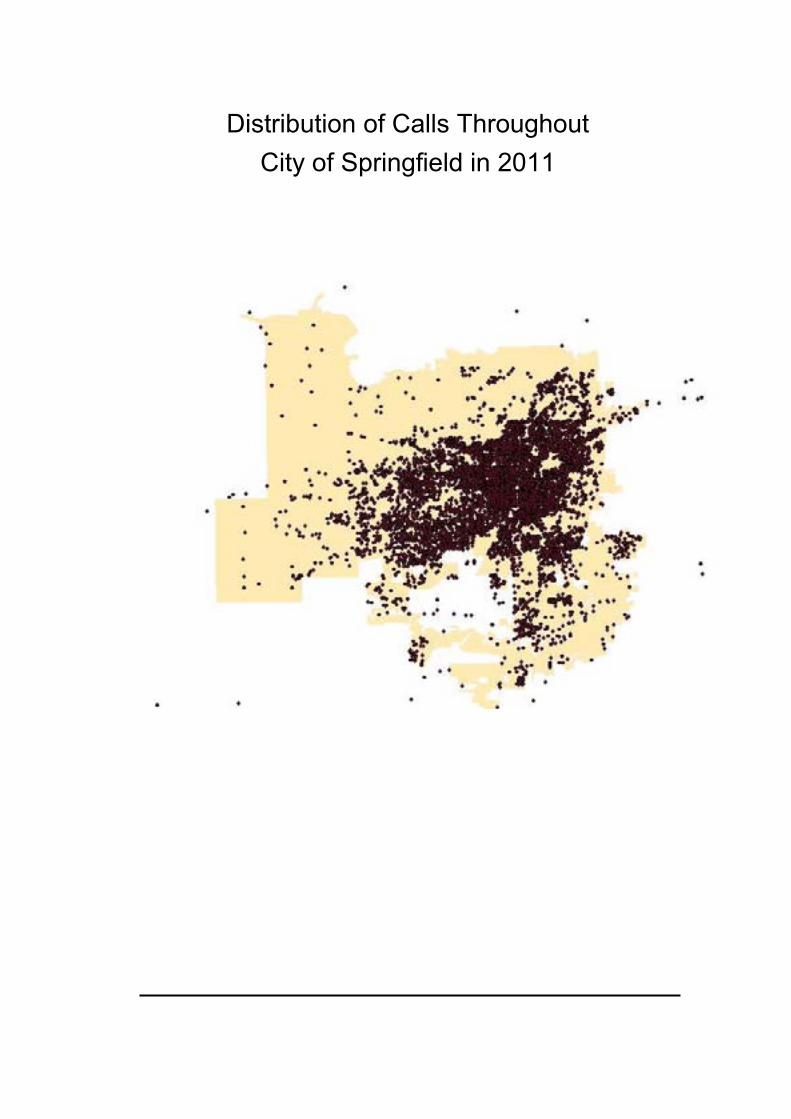
Distribution of Calls Throughout
City of Springfield in 2011

Distribution of Calls Throughout
City of Springfield in 2011 with Four Minute
Engine Company Response Area Displayed

Section 2
Four Minute Response
Zones of Engine
Companies


Section 3
Eight Minute Response
Zones for Ladder Truck
Companies


Section 4
Engine
Company Relocation


Section 5
Ladder Truck Relocation
