springer handbook of condensed matter and...
TRANSCRIPT
903
Ferroelectrics4.5. Ferroelectrics and Antiferroelectrics
Ferroelectric crystals (especially oxides in the formof ceramics) are important basic materials fortechnological applications in capacitors and inpiezoelectric, pyroelectric, and optical devices. Inmany cases their nonlinear characteristics turnout to be very useful, for example in opticalsecond-harmonic generators and other nonlinearoptical devices. In recent decades, ceramic thin-film ferroelectrics have been utilized intensivelyas parts of memory devices. Liquid crystal andpolymer ferroelectrics are utilized in the broadfield of fast displays in electronic equipment.
This chapter surveys the nature of ferroelectrics,making reference to the data presented in theLandolt–Börnstein data collection NumericalData and Functional Relationships in Scienceand Technology, Vol. III/36, Ferroelectrics andRelated Substances (LB III/36). The data in thefigures in this chapter have been taken mainlyfrom the Landolt–Börnstein collection. TheLandolt–Börnstein volume mentioned above
4.5.1 Definition of Ferroelectricsand Antiferroelectrics ......................... 903
4.5.2 Survey of Research on Ferroelectrics ..... 904
4.5.3 Classification of Ferroelectrics .............. 9064.5.3.1 The 72 Families of Ferroelectrics 909
4.5.4 Physical Properties of 43 RepresentativeFerroelectrics ..................................... 9124.5.4.1 Inorganic Crystals Oxides [5.1, 2] 9124.5.4.2 Inorganic Crystals
Other Than Oxides [5.3] ............ 9224.5.4.3 Organic Crystals, Liquid Crystals,
and Polymers [5.4] .................. 930
References .................................................. 936
consists of three subvolumes: Subvolume A [5.1, 2],covering oxides; Subvolume B [5.3], coveringinorganic crystals other than oxides; and Sub-volume C [5.4], covering organic crystals, liquidcrystals, and polymers.
Matter consists of electrons and nuclei. Most of the elec-trons generally are tightly bound to the nuclei, but someof the electrons are only weakly bound or are freely mo-bile in a lattice of ions. The physical properties of mattercan be considered as being split into two categories. Theproperties in the first category are determined directlyby the electrons and by the interaction of the electronswith lattice vibrations. Examples are the metallic, mag-netic, superconductive, and semiconductive properties.The properties in the second category are only indirectlyrelated to the electrons and can be discussed as being due
to interaction between atoms, ions, or molecules. In thiscategory we have, for example, the dielectric, elastic,piezoelectric, and pyroelectric properties; we have thedispersion relations of the lattice vibrations; and we havemost of the properties of liquid crystals and polymers.The important properties of ferroelectrics are linked toall the latter properties, and they exhibit diverse types ofphase transitions together with anomalies in these prop-erties. These specific modifications convey informationabout cooperative interactions among ions, atoms, ormolecules in the condensed phase of matter.
4.5.1 Definition of Ferroelectrics and Antiferroelectrics
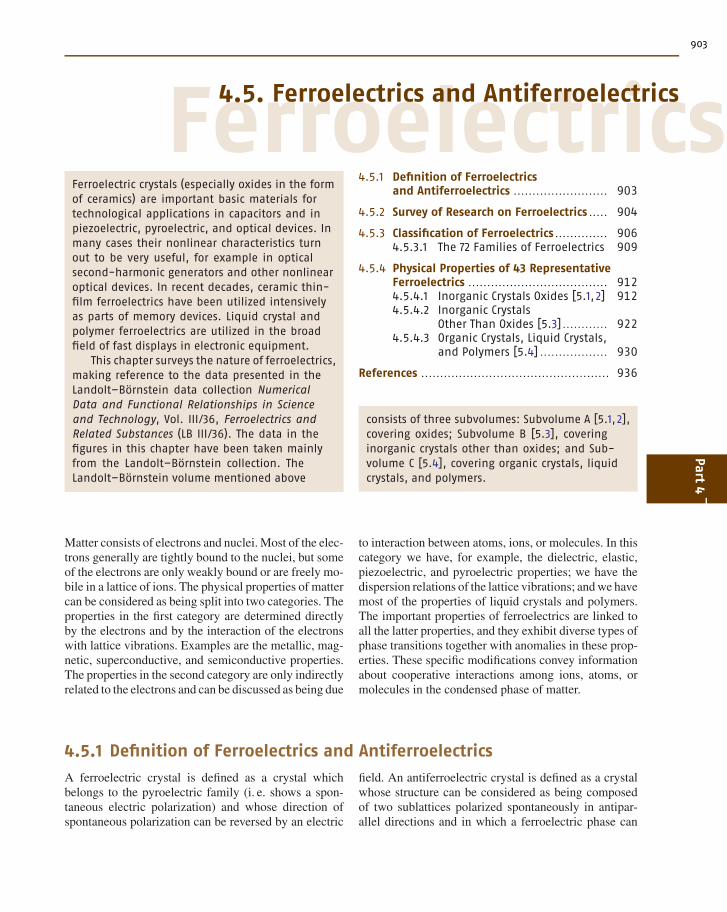
A ferroelectric crystal is defined as a crystal whichbelongs to the pyroelectric family (i. e. shows a spon-taneous electric polarization) and whose direction ofspontaneous polarization can be reversed by an electric
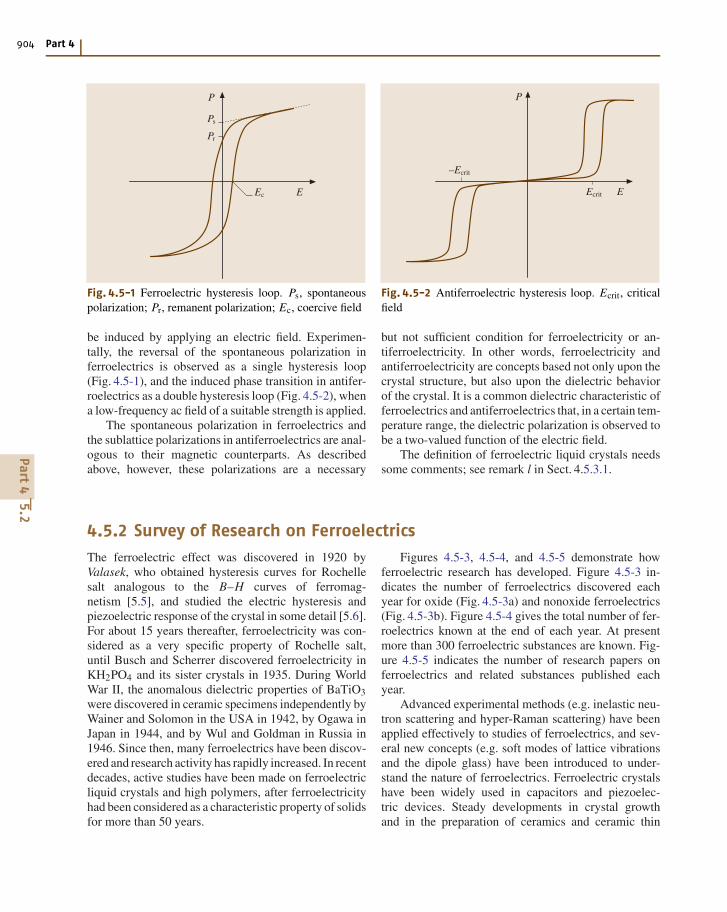
field. An antiferroelectric crystal is defined as a crystalwhose structure can be considered as being composedof two sublattices polarized spontaneously in antipar-allel directions and in which a ferroelectric phase can
Part4
5
904 Part 4
P
Ps
Pr
Ec E
Fig. 4.5-1 Ferroelectric hysteresis loop. Ps, spontaneouspolarization; Pr, remanent polarization; Ec, coercive field
be induced by applying an electric field. Experimen-tally, the reversal of the spontaneous polarization inferroelectrics is observed as a single hysteresis loop(Fig. 4.5-1), and the induced phase transition in antifer-roelectrics as a double hysteresis loop (Fig. 4.5-2), whena low-frequency ac field of a suitable strength is applied.
The spontaneous polarization in ferroelectrics andthe sublattice polarizations in antiferroelectrics are anal-ogous to their magnetic counterparts. As describedabove, however, these polarizations are a necessary
P
EEcrit
–Ecrit
Fig. 4.5-2 Antiferroelectric hysteresis loop. Ecrit, criticalfield
but not sufficient condition for ferroelectricity or an-tiferroelectricity. In other words, ferroelectricity andantiferroelectricity are concepts based not only upon thecrystal structure, but also upon the dielectric behaviorof the crystal. It is a common dielectric characteristic offerroelectrics and antiferroelectrics that, in a certain tem-perature range, the dielectric polarization is observed tobe a two-valued function of the electric field.
The definition of ferroelectric liquid crystals needssome comments; see remark l in Sect. 4.5.3.1.
4.5.2 Survey of Research on Ferroelectrics
The ferroelectric effect was discovered in 1920 byValasek, who obtained hysteresis curves for Rochellesalt analogous to the B–H curves of ferromag-netism [5.5], and studied the electric hysteresis andpiezoelectric response of the crystal in some detail [5.6].For about 15 years thereafter, ferroelectricity was con-sidered as a very specific property of Rochelle salt,until Busch and Scherrer discovered ferroelectricity inKH2PO4 and its sister crystals in 1935. During WorldWar II, the anomalous dielectric properties of BaTiO3were discovered in ceramic specimens independently byWainer and Solomon in the USA in 1942, by Ogawa inJapan in 1944, and by Wul and Goldman in Russia in1946. Since then, many ferroelectrics have been discov-ered and research activity has rapidly increased. In recentdecades, active studies have been made on ferroelectricliquid crystals and high polymers, after ferroelectricityhad been considered as a characteristic property of solidsfor more than 50 years.
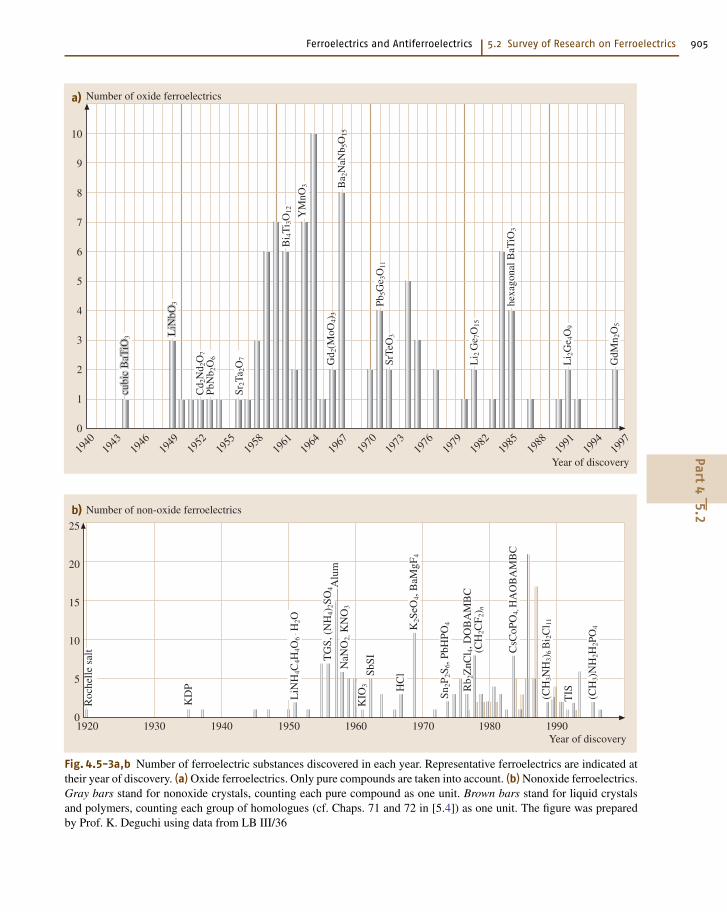
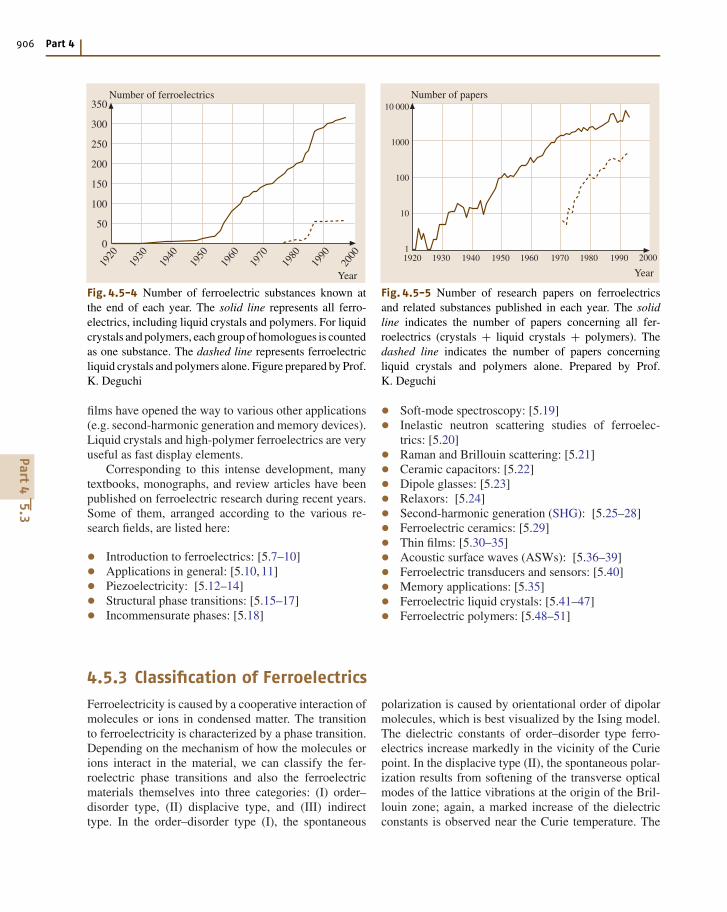
Figures 4.5-3, 4.5-4, and 4.5-5 demonstrate howferroelectric research has developed. Figure 4.5-3 in-dicates the number of ferroelectrics discovered eachyear for oxide (Fig. 4.5-3a) and nonoxide ferroelectrics(Fig. 4.5-3b). Figure 4.5-4 gives the total number of fer-roelectrics known at the end of each year. At presentmore than 300 ferroelectric substances are known. Fig-ure 4.5-5 indicates the number of research papers onferroelectrics and related substances published eachyear.
Advanced experimental methods (e.g. inelastic neu-tron scattering and hyper-Raman scattering) have beenapplied effectively to studies of ferroelectrics, and sev-eral new concepts (e.g. soft modes of lattice vibrationsand the dipole glass) have been introduced to under-stand the nature of ferroelectrics. Ferroelectric crystalshave been widely used in capacitors and piezoelec-tric devices. Steady developments in crystal growthand in the preparation of ceramics and ceramic thin
Part4
5.2
Ferroelectrics and Antiferroelectrics 5.2 Survey of Research on Ferroelectrics 905
a)
10
9
8
7
6
5
4
3
2
1
0
1940
1943
1946
1949
1952
1955
1958
1961
1964
1967
1970
1973
1976
1979
1982
1985
1988
1991
1994
1997
Number of oxide ferroelectrics
Year of discovery
cubi
c B
aTiO
cubi
c B
aTiO
cubi
c B
aTiO
3 LiN
bL
iNb
LiN
b OOO3
Cd 2
Nd 2
O7
PbN
b 2O
6
Sr2T
a 2O
7
Bi 4
Ti 3
O12 YM
nO3 B
a 2N
aNb 5
O15
Gd 2
(MoO
4)3
Pb5G
e 3O
11Sr
TeO
3
Li 2
Ge 7
O15
hexa
gona
l BaT
iO3
Li 2
Ge 4
O9
GdM
n 2O
5
25
20
15
10
5
01920 1930 1940 1950 1960 1970 1980 1990
b) Number of non-oxide ferroelectrics
Year of discovery
Roc
helle
sal
t
KD
P
LiN
H4C
4H4O
6 ˙ H
2O
TG
S, (
NH
4)2S
O4 A
lum
NaN
O2, K
NO
3
KIO
3Sb
SI
HC
lK
2SeO
4, B
aMgF
4
Sn2P
2S6,
PbH
PO4
Rb 2
ZnC
l 4, D
OB
AM
BC
(CH
2CF 2
) n
CsC
oPO
4, H
AO
BA
MB
C
(CH
3NH
3)6 B
i 2C
l 11
TIS (C
H3)
NH
2H2P
O4
Fig. 4.5-3a,b Number of ferroelectric substances discovered in each year. Representative ferroelectrics are indicated attheir year of discovery. (a) Oxide ferroelectrics. Only pure compounds are taken into account. (b) Nonoxide ferroelectrics.Gray bars stand for nonoxide crystals, counting each pure compound as one unit. Brown bars stand for liquid crystalsand polymers, counting each group of homologues (cf. Chaps. 71 and 72 in [5.4]) as one unit. The figure was preparedby Prof. K. Deguchi using data from LB III/36
Part4
5.2
906 Part 4
350
300
250
200
150
100
50
0
1940
1950
1960
1970
1980
1990
2000
1930
1920
Number of ferroelectrics
Year
Fig. 4.5-4 Number of ferroelectric substances known atthe end of each year. The solid line represents all ferro-electrics, including liquid crystals and polymers. For liquidcrystals and polymers, each group of homologues is countedas one substance. The dashed line represents ferroelectricliquid crystals and polymers alone. Figure prepared by Prof.K. Deguchi
films have opened the way to various other applications(e.g. second-harmonic generation and memory devices).Liquid crystals and high-polymer ferroelectrics are veryuseful as fast display elements.
Corresponding to this intense development, manytextbooks, monographs, and review articles have beenpublished on ferroelectric research during recent years.Some of them, arranged according to the various re-search fields, are listed here:
• Introduction to ferroelectrics: [5.7–10]• Applications in general: [5.10, 11]• Piezoelectricity: [5.12–14]• Structural phase transitions: [5.15–17]• Incommensurate phases: [5.18]
10 000
1000
100
10
11940 1950 1960 1970 1980 1990 200019301920
Number of papers
Year
Fig. 4.5-5 Number of research papers on ferroelectricsand related substances published in each year. The solidline indicates the number of papers concerning all fer-roelectrics (crystals + liquid crystals + polymers). Thedashed line indicates the number of papers concerningliquid crystals and polymers alone. Prepared by Prof.K. Deguchi
• Soft-mode spectroscopy: [5.19]• Inelastic neutron scattering studies of ferroelec-trics: [5.20]• Raman and Brillouin scattering: [5.21]• Ceramic capacitors: [5.22]• Dipole glasses: [5.23]• Relaxors: [5.24]• Second-harmonic generation (SHG): [5.25–28]• Ferroelectric ceramics: [5.29]• Thin films: [5.30–35]• Acoustic surface waves (ASWs): [5.36–39]• Ferroelectric transducers and sensors: [5.40]• Memory applications: [5.35]• Ferroelectric liquid crystals: [5.41–47]• Ferroelectric polymers: [5.48–51]
4.5.3 Classification of Ferroelectrics
Ferroelectricity is caused by a cooperative interaction ofmolecules or ions in condensed matter. The transitionto ferroelectricity is characterized by a phase transition.Depending on the mechanism of how the molecules orions interact in the material, we can classify the fer-roelectric phase transitions and also the ferroelectricmaterials themselves into three categories: (I) order–disorder type, (II) displacive type, and (III) indirecttype. In the order–disorder type (I), the spontaneous
polarization is caused by orientational order of dipolarmolecules, which is best visualized by the Ising model.The dielectric constants of order–disorder type ferro-electrics increase markedly in the vicinity of the Curiepoint. In the displacive type (II), the spontaneous polar-ization results from softening of the transverse opticalmodes of the lattice vibrations at the origin of the Bril-louin zone; again, a marked increase of the dielectricconstants is observed near the Curie temperature. The
Part4
5.3
Ferroelectrics and Antiferroelectrics 5.3 Classification of Ferroelectrics 907
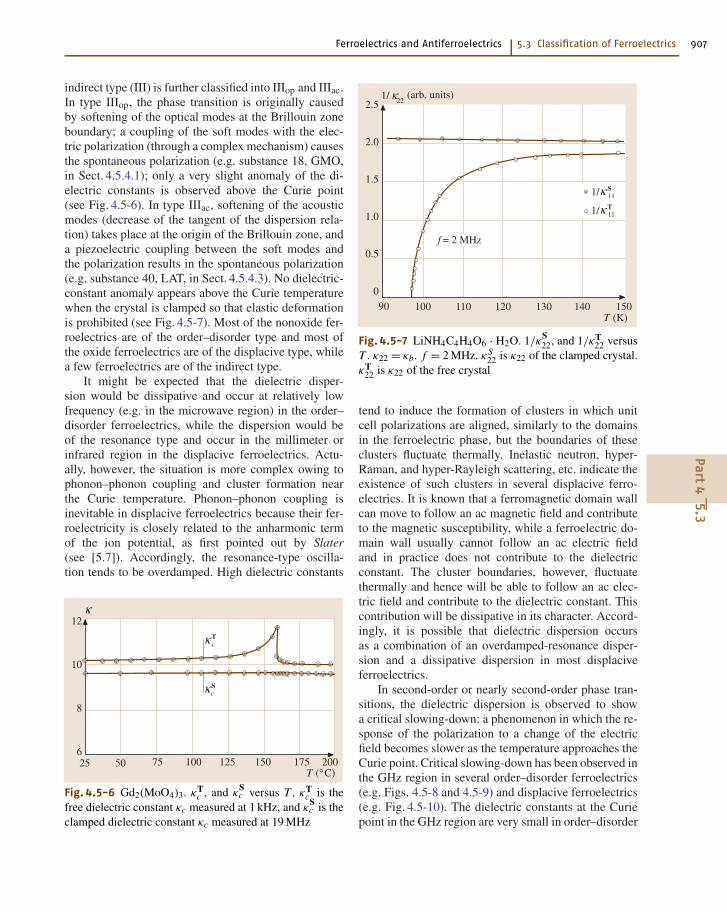
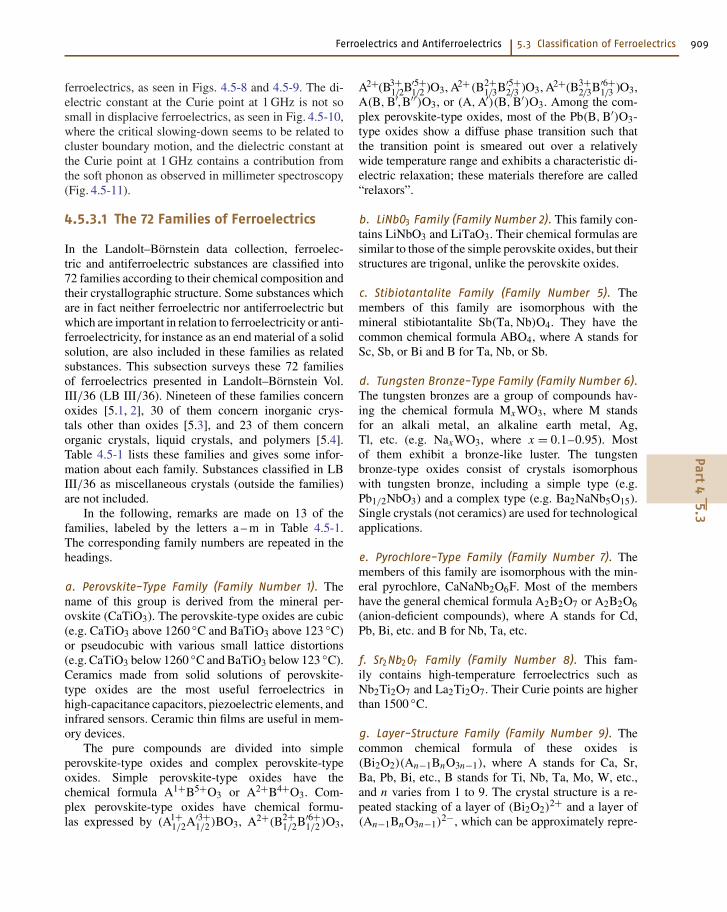
indirect type (III) is further classified into IIIop and IIIac.In type IIIop, the phase transition is originally causedby softening of the optical modes at the Brillouin zoneboundary; a coupling of the soft modes with the elec-tric polarization (through a complex mechanism) causesthe spontaneous polarization (e.g. substance 18, GMO,in Sect. 4.5.4.1); only a very slight anomaly of the di-electric constants is observed above the Curie point(see Fig. 4.5-6). In type IIIac, softening of the acousticmodes (decrease of the tangent of the dispersion rela-tion) takes place at the origin of the Brillouin zone, anda piezoelectric coupling between the soft modes andthe polarization results in the spontaneous polarization(e.g. substance 40, LAT, in Sect. 4.5.4.3). No dielectric-constant anomaly appears above the Curie temperaturewhen the crystal is clamped so that elastic deformationis prohibited (see Fig. 4.5-7). Most of the nonoxide fer-roelectrics are of the order–disorder type and most ofthe oxide ferroelectrics are of the displacive type, whilea few ferroelectrics are of the indirect type.
It might be expected that the dielectric disper-sion would be dissipative and occur at relatively lowfrequency (e.g. in the microwave region) in the order–disorder ferroelectrics, while the dispersion would beof the resonance type and occur in the millimeter orinfrared region in the displacive ferroelectrics. Actu-ally, however, the situation is more complex owing tophonon–phonon coupling and cluster formation nearthe Curie temperature. Phonon–phonon coupling isinevitable in displacive ferroelectrics because their fer-roelectricity is closely related to the anharmonic termof the ion potential, as first pointed out by Slater(see [5.7]). Accordingly, the resonance-type oscilla-tion tends to be overdamped. High dielectric constants
κ
25
12
10
8
650 75 100 125 150 175 200
T (°C)
κ T c
κ S c
Fig. 4.5-6 Gd2(MoO4)3. κTc , and κ
Sc versus T . κT
c is thefree dielectric constant κc measured at 1 kHz, and κ
Sc is the
clamped dielectric constant κc measured at 19 MHz
2.5
2.0
1.5
1.0
0.5
0
(arb. units)
90 100 110 120 130 140 150
f = 2 MHz
T (K)
κ22
κ 11S
1/
1/
κ 11T1/
Fig. 4.5-7 LiNH4C4H4O6 · H2O. 1/κS22, and 1/κT
22 versusT . κ22 = κb. f = 2 MHz. κS
22 is κ22 of the clamped crystal.κT
22 is κ22 of the free crystal
tend to induce the formation of clusters in which unitcell polarizations are aligned, similarly to the domainsin the ferroelectric phase, but the boundaries of theseclusters fluctuate thermally. Inelastic neutron, hyper-Raman, and hyper-Rayleigh scattering, etc. indicate theexistence of such clusters in several displacive ferro-electrics. It is known that a ferromagnetic domain wallcan move to follow an ac magnetic field and contributeto the magnetic susceptibility, while a ferroelectric do-main wall usually cannot follow an ac electric fieldand in practice does not contribute to the dielectricconstant. The cluster boundaries, however, fluctuatethermally and hence will be able to follow an ac elec-tric field and contribute to the dielectric constant. Thiscontribution will be dissipative in its character. Accord-ingly, it is possible that dielectric dispersion occursas a combination of an overdamped-resonance disper-sion and a dissipative dispersion in most displaciveferroelectrics.
In second-order or nearly second-order phase tran-sitions, the dielectric dispersion is observed to showa critical slowing-down: a phenomenon in which the re-sponse of the polarization to a change of the electricfield becomes slower as the temperature approaches theCurie point. Critical slowing-down has been observed inthe GHz region in several order–disorder ferroelectrics(e.g. Figs. 4.5-8 and 4.5-9) and displacive ferroelectrics(e.g. Fig. 4.5-10). The dielectric constants at the Curiepoint in the GHz region are very small in order–disorder
Part4
5.3

908 Part 4
–5 30
103
102
10
10 5 10 15 20 25
κc'
T (°C)
f = 1.0 MHz24.0 MHz95.5 MHz
331.0 MHz1000.0 MHz
Fig. 4.5-8 Ca2Sr(CH3CH2COO)6. κ′c versus T . Param-
eter: f
0
103
102
10
8
6
4
2
40 45 50 55 60 65 70
8
6
4
2
T (°C)
κ b'
0.5 GHz1.2
2.0
4.5 GHz
Fig. 4.5-9 (NH2CH2COOH)3 · H2SO4. κ′b versus T rela-
tion, showing critical slowing-down. Parameter: f
103
102
10
6
4
2
8
130.0
6
4
2
8
130.5 131.5 132.0 132.5
f = 36.3 MHzf = 660.6 MHzf = 1.0 GHz
T (K)
κ b'
131.0
Fig. 4.5-10 (CH3NHCH2COOH)3 · CaCl2. κ′b versus T .
Parameter: f . Critical slowing-down takes place
0 50 100 150 200 250 300
12
9
6
3
0
40
30
20
10
0
ν0 (1011 Hz) ν0 /c (cm–1)
T (K)
Θf
C 92v D16
2h
A1 (TO) B2u (TO)
Fig. 4.5-11 (CH3NHCH2COOH)3 · CaCl2. ν0 versus T .ν0 is the phonon mode frequency. Triangles: measured bymillimeter spectroscopy. Brown circles: measured from far-infrared spectra. Gray circles: measured from electric-field-induced Raman spectra. In the paraelectric phase (T > Θf),ν0 decreases as the temperature decreases toward Θf, thatis, the phonon mode softens
Part4
5.3
Ferroelectrics and Antiferroelectrics 5.3 Classification of Ferroelectrics 909
ferroelectrics, as seen in Figs. 4.5-8 and 4.5-9. The di-electric constant at the Curie point at 1 GHz is not sosmall in displacive ferroelectrics, as seen in Fig. 4.5-10,where the critical slowing-down seems to be related tocluster boundary motion, and the dielectric constant atthe Curie point at 1 GHz contains a contribution fromthe soft phonon as observed in millimeter spectroscopy(Fig. 4.5-11).
4.5.3.1 The 72 Families of Ferroelectrics
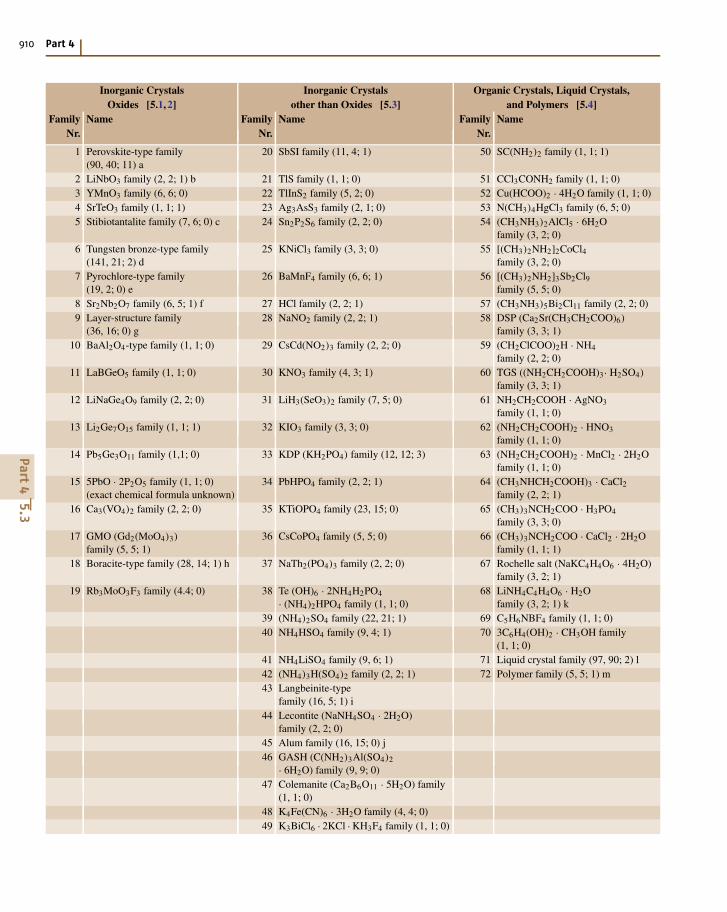
In the Landolt–Börnstein data collection, ferroelec-tric and antiferroelectric substances are classified into72 families according to their chemical composition andtheir crystallographic structure. Some substances whichare in fact neither ferroelectric nor antiferroelectric butwhich are important in relation to ferroelectricity or anti-ferroelectricity, for instance as an end material of a solidsolution, are also included in these families as relatedsubstances. This subsection surveys these 72 familiesof ferroelectrics presented in Landolt–Börnstein Vol.III/36 (LB III/36). Nineteen of these families concernoxides [5.1, 2], 30 of them concern inorganic crys-tals other than oxides [5.3], and 23 of them concernorganic crystals, liquid crystals, and polymers [5.4].Table 4.5-1 lists these families and gives some infor-mation about each family. Substances classified in LBIII/36 as miscellaneous crystals (outside the families)are not included.
In the following, remarks are made on 13 of thefamilies, labeled by the letters a – m in Table 4.5-1.The corresponding family numbers are repeated in theheadings.
a. Perovskite-Type Family (Family Number 1). Thename of this group is derived from the mineral per-ovskite (CaTiO3). The perovskite-type oxides are cubic(e.g. CaTiO3 above 1260 ◦C and BaTiO3 above 123 ◦C)or pseudocubic with various small lattice distortions(e.g. CaTiO3 below 1260 ◦C and BaTiO3 below 123 ◦C).Ceramics made from solid solutions of perovskite-type oxides are the most useful ferroelectrics inhigh-capacitance capacitors, piezoelectric elements, andinfrared sensors. Ceramic thin films are useful in mem-ory devices.
The pure compounds are divided into simpleperovskite-type oxides and complex perovskite-typeoxides. Simple perovskite-type oxides have thechemical formula A1+B5+O3 or A2+B4+O3. Com-plex perovskite-type oxides have chemical formu-las expressed by (A1+
1/2A′3+1/2)BO3, A2+(B2+
1/2B′6+1/2)O3,
A2+(B3+1/2B′5+
1/2 )O3, A2+(B2+1/3B′5+
2/3 )O3, A2+(B3+2/3B′6+
1/3 )O3,A(B, B′,B′′)O3, or (A, A′)(B, B′)O3. Among the com-plex perovskite-type oxides, most of the Pb(B, B′)O3-type oxides show a diffuse phase transition such thatthe transition point is smeared out over a relativelywide temperature range and exhibits a characteristic di-electric relaxation; these materials therefore are called“relaxors”.
b. LiNbO3 Family (Family Number 2). This family con-tains LiNbO3 and LiTaO3. Their chemical formulas aresimilar to those of the simple perovskite oxides, but theirstructures are trigonal, unlike the perovskite oxides.
c. Stibiotantalite Family (Family Number 5). Themembers of this family are isomorphous with themineral stibiotantalite Sb(Ta, Nb)O4. They have thecommon chemical formula ABO4, where A stands forSc, Sb, or Bi and B for Ta, Nb, or Sb.
d. Tungsten Bronze-Type Family (Family Number 6).The tungsten bronzes are a group of compounds hav-ing the chemical formula MxWO3, where M standsfor an alkali metal, an alkaline earth metal, Ag,Tl, etc. (e.g. NaxWO3, where x = 0.1–0.95). Mostof them exhibit a bronze-like luster. The tungstenbronze-type oxides consist of crystals isomorphouswith tungsten bronze, including a simple type (e.g.Pb1/2NbO3) and a complex type (e.g. Ba2NaNb5O15).Single crystals (not ceramics) are used for technologicalapplications.
e. Pyrochlore-Type Family (Family Number 7). Themembers of this family are isomorphous with the min-eral pyrochlore, CaNaNb2O6F. Most of the membershave the general chemical formula A2B2O7 or A2B2O6(anion-deficient compounds), where A stands for Cd,Pb, Bi, etc. and B for Nb, Ta, etc.
f. Sr2Nb2O7 Family (Family Number 8). This fam-ily contains high-temperature ferroelectrics such asNb2Ti2O7 and La2Ti2O7. Their Curie points are higherthan 1500 ◦C.
g. Layer-Structure Family (Family Number 9). Thecommon chemical formula of these oxides is(Bi2O2)(An−1BnO3n−1), where A stands for Ca, Sr,Ba, Pb, Bi, etc., B stands for Ti, Nb, Ta, Mo, W, etc.,and n varies from 1 to 9. The crystal structure is a re-peated stacking of a layer of (Bi2O2)
2+ and a layer of(An−1BnO3n−1)
2−, which can be approximately repre-
Part4
5.3
910 Part 4
Inorganic Crystals Inorganic Crystals Organic Crystals, Liquid Crystals,Oxides [5.1, 2] other than Oxides [5.3] and Polymers [5.4]
Family Name Family Name Family NameNr. Nr. Nr.
1 Perovskite-type family 20 SbSI family (11, 4; 1) 50 SC(NH2)2 family (1, 1; 1)(90, 40; 11) a
2 LiNbO3 family (2, 2; 1) b 21 TlS family (1, 1; 0) 51 CCl3CONH2 family (1, 1; 0)3 YMnO3 family (6, 6; 0) 22 TlInS2 family (5, 2; 0) 52 Cu(HCOO)2 · 4H2O family (1, 1; 0)4 SrTeO3 family (1, 1; 1) 23 Ag3AsS3 family (2, 1; 0) 53 N(CH3)4HgCl3 family (6, 5; 0)5 Stibiotantalite family (7, 6; 0) c 24 Sn2P2S6 family (2, 2; 0) 54 (CH3NH3)2AlCl5 · 6H2O
family (3, 2; 0)6 Tungsten bronze-type family 25 KNiCl3 family (3, 3; 0) 55 [(CH3)2NH2]2CoCl4
(141, 21; 2) d family (3, 2; 0)7 Pyrochlore-type family 26 BaMnF4 family (6, 6; 1) 56 [(CH3)2NH2]3Sb2Cl9
(19, 2; 0) e family (5, 5; 0)8 Sr2Nb2O7 family (6, 5; 1) f 27 HCl family (2, 2; 1) 57 (CH3NH3)5Bi2Cl11 family (2, 2; 0)9 Layer-structure family 28 NaNO2 family (2, 2; 1) 58 DSP (Ca2Sr(CH3CH2COO)6)
(36, 16; 0) g family (3, 3; 1)10 BaAl2O4-type family (1, 1; 0) 29 CsCd(NO2)3 family (2, 2; 0) 59 (CH2ClCOO)2H · NH4
family (2, 2; 0)11 LaBGeO5 family (1, 1; 0) 30 KNO3 family (4, 3; 1) 60 TGS ((NH2CH2COOH)3· H2SO4)
family (3, 3; 1)12 LiNaGe4O9 family (2, 2; 0) 31 LiH3(SeO3)2 family (7, 5; 0) 61 NH2CH2COOH · AgNO3
family (1, 1; 0)13 Li2Ge7O15 family (1, 1; 1) 32 KIO3 family (3, 3; 0) 62 (NH2CH2COOH)2 · HNO3
family (1, 1; 0)14 Pb5Ge3O11 family (1,1; 0) 33 KDP (KH2PO4) family (12, 12; 3) 63 (NH2CH2COOH)2 · MnCl2 · 2H2O
family (1, 1; 0)15 5PbO · 2P2O5 family (1, 1; 0) 34 PbHPO4 family (2, 2; 1) 64 (CH3NHCH2COOH)3 · CaCl2
(exact chemical formula unknown) family (2, 2; 1)16 Ca3(VO4)2 family (2, 2; 0) 35 KTiOPO4 family (23, 15; 0) 65 (CH3)3NCH2COO · H3PO4
family (3, 3; 0)17 GMO (Gd2(MoO4)3) 36 CsCoPO4 family (5, 5; 0) 66 (CH3)3NCH2COO · CaCl2 · 2H2O
family (5, 5; 1) family (1, 1; 1)18 Boracite-type family (28, 14; 1) h 37 NaTh2(PO4)3 family (2, 2; 0) 67 Rochelle salt (NaKC4H4O6 · 4H2O)
family (3, 2; 1)19 Rb3MoO3F3 family (4.4; 0) 38 Te (OH)6 · 2NH4H2PO4 68 LiNH4C4H4O6 · H2O
· (NH4)2HPO4 family (1, 1; 0) family (3, 2; 1) k39 (NH4)2SO4 family (22, 21; 1) 69 C5H6NBF4 family (1, 1; 0)40 NH4HSO4 family (9, 4; 1) 70 3C6H4(OH)2 · CH3OH family
(1, 1; 0)41 NH4LiSO4 family (9, 6; 1) 71 Liquid crystal family (97, 90; 2) l42 (NH4)3H(SO4)2 family (2, 2; 1) 72 Polymer family (5, 5; 1) m43 Langbeinite-type
family (16, 5; 1) i44 Lecontite (NaNH4SO4 · 2H2O)
family (2, 2; 0)45 Alum family (16, 15; 0) j46 GASH (C(NH2)3Al(SO4)2
· 6H2O) family (9, 9; 0)47 Colemanite (Ca2B6O11 · 5H2O) family
(1, 1; 0)48 K4Fe(CN)6 · 3H2O family (4, 4; 0)49 K3BiCl6 · 2KCl · KH3F4 family (1, 1; 0)
Part4
5.3
Ferroelectrics and Antiferroelectrics 5.3 Classification of Ferroelectrics 911
Table 4.5-1J The 72 families of ferroelectric materials. The number assigned to each family corresponds to the numberused in LB III/36. The numbers in parentheses (NSub, NF+A; n) after the family name serve the purpose of conveyingsome information about the size and importance of the family. The numbers indicate the following: NSub, the number ofpure substances (ferroelectric, antiferroelectric, and related substances) which are treated as members of this family inLB III/36; NF+A, the number of ferroelectric and antiferroelectric substances which are treated as members of this familyin LB III/36; n, the number of representative substances from this family whose properties are surveyed in Sect. 4.5.4.For some of these families, additional remarks are needed: for instance, because the perovskite-type oxide family hasmany members and consists of several subfamilies; because the liquid crystal and polymer families have very specificproperties compared with crystalline ferroelectrics; and because the traditional names of some families are apt to lead tomisconceptions about their members. Such families are marked by letters a–m following the parentheses, and remarks onthese families are given under the corresponding letter in the text in Sect. 4.5.3.1
sented by a chain of n perovskite-type units of ABO3perpendicular to the layer.
h. Boracite-Type Family (Family Number 18). Bo-racite is a mineral, Mg3B7O13Cl. The boracite-typefamily contains crystals isomorphous with the mineral,and has the chemical formula M2+
3 B7O13X1−, whereM2+ stands for a divalent cation of Mg, Cr, Mn, Fe, Co,Ni, Cu, Zn, or Cd, and X1− stands for an anion of Cl,Br, or I.
i. Langbeinite-Type Family (Family Number 43). Thisfamily consists of crystals which are basically iso-morphous with K2Mg2(SO4)3 (langbeinite), and havethe common chemical formula M1+
2 M2+2 (SO4)3, where
M1+ stands for a monovalent ion of K, Rb, Cs, Tl, orNH4, and M2+ stands for a divalent ion of Mg, Ca, Mn,Fe, Co, Ni, Zn, or Cd.
j. Alum Family (Family Number 45). The alums arecompounds with the chemical formula M1+M3+(SO4)2· 12 H2O, where M1+ is a monovalent cation and M3+is a trivalent cation. Ferroelectricity has been foundfor the monovalent cations of NH4, CH3NH3, etc.and the trivalent cations of Al, V, Cr, Fe, In, andGa. This family contains a few isomorphous selenates,M1+M3+(SeO4)2 ·12 H2O.
k. LiNH4C4H4O6 ·H2O Family (Family Number 68). Thisfamily contains two ferroelectrics, LiNH4C4H4O6 ·H2Oand LiTlC4H4O6 ·H2O. The polar directions of the twoferroelectrics are different from each other.
l. Liquid Crystals (Family Number 71). Ferroelectricand antiferroelectric liquid crystals are very useful asfast display elements.
A. Ferroelectric liquid crystals (family number 71A).Ferroelectric liquid crystals are defined as liquid
crystals which exhibit a ferroelectric hysteresis looplike that shown in Fig. 4.5-1. Unlike ferroelectriccrystals, however, ferroelectric liquid crystals gen-erally have no spontaneous polarization in the bulkstate. The chiral smectic phase denoted by Sm C∗(e.g. of DOBAMBC) consists of many layers, eachof which has a spontaneous polarization parallel tothe layer plane, but the spontaneous polarizationvaries helically in different directions from layerto layer, so that the bulk has no spontaneous po-larization as a whole. A sufficiently strong electricfield causes a transition from the helical phase toa polar phase. Under an alternating electric field, thehelical structure does not have a chance to buildup owing to the delay in the transition. Instead,a direct transition occurs between the induced po-lar phases, resulting in a hysteresis loop of thetype shown in Fig. 4.5-1. Accordingly, the hysteresisloop may be regarded as one in which the lin-ear part of the antiferroelectric hysteresis shown inFig. 4.5-2 is eliminated. It should be noted, how-ever, that the helical structure disappears and twostable states with parallel and antiparallel polar-izations appear, similar to the domain structureof a ferroelectric crystal, when a liquid crystalis put in a cell which is thinner than the helicalpitch [5.52].
B. Antiferroelectric liquid crystals (family number71B). The phase denoted by Sm C∗
A (e.g. of MH-POBC) exhibits a double hysteresis of the typeshown in Fig. 4.5-2, and a liquid crystal showingthis phase is called antiferroelectric [5.53].
m. Polymers (Family Number 72). Polyvinylidene flu-oride (CH2CF2)n and its copolymers with trifluoroethy-lene (CHFCF2)n , etc. are ferroelectric. Ferroelectricpolymers are usually prepared as thin films in whichcrystalline and amorphous regions coexist. The ferro-electric hysteresis loop originates from reversal of the
Part4
5.3

912 Part 4
spontaneous polarization in the crystalline regions. Theelectric-field distribution is expected to be complex inthe thin film because of the interposition of the amor-phous regions. A ferroelectric hysteresis loop can beobserved when the ratio of the volume of the crys-talline regions to the total volume is relatively large(e.g. more than 50%). The coercive field is larger (e.g.
> 50 MV/m) than that of solid ferroelectrics (usuallya few MV/m or smaller). The ferroelectric propertiesdepend sensitively upon the details of sample prepa-ration, for example the use of melt quenching or meltextrusion, the annealing temperature, or the details ofthe poling procedure. Polymer ferroelectrics are usefulfor soft transducers.
4.5.4 Physical Properties of 43 Representative Ferroelectrics
This section surveys the characteristic properties of43 representative ferroelectrics with the aim of demon-strating the wide variety in the behavior of ferroelectrics.The 43 representative ferroelectrics are selected from29 of the above-mentioned families. The presentationis mainly graphical. Most of the figures are repro-duced from LB III/36, where the relevant referencescan be found. Table 4.5-2 summarizes the meaningof the symbols frequently used in the figure cap-tions and indicates the units in which the data aregiven.
To facilitate to get more information on each repre-sentative substance in LB II/36, the number assigned tothe substance in LB III/36 is given in parenthesis fol-
Table 4.5-2 Symbols and units frequently used in the figure captions
a, b, c unit cell vector, units Å
a∗, b∗, c∗ unit cell vector in reciprocal space, units Å−1
Ec coercive field, units V/m
f frequency, units Hz = 1/s
Ps spontaneous polarization, units C/m2
T temperature, units K or ◦C
κ dielectric constant (or relative permittivity) = ε/ε0, where ε is the permittivity of thematerial and ε0 is the permittivity of a vacuum. κ is a dimensionless number
κ′, κ′′ real and imaginary parts of the complex dielectric constant κ∗ = κ′ + iκ′′.κ′ and κ′′ are both dimensionless numbers
κij component of dielectric-constant tensor; dimensionless numbers
κa, κb, κc κ measured along a, b, c axes; dimensionless numbers
κ(hkl) κ measured perpendicular to the (hkl) plane; dimensionless number
κ[uvw] κ measured parallel to the [uvw] direction; dimensionless number
κT κ of free crystal, i. e. κ measured at constant stress T; dimensionless number
κS κ of clamped crystal, i. e. κ measured at constant strain S; dimensionless number
Θf ferroelectric transition temperature, units K or ◦C
lowing its chemical formula, e.g., KNbO3 (LB number1A-2).
4.5.4.1 Inorganic Crystals Oxides [5.1, 2]
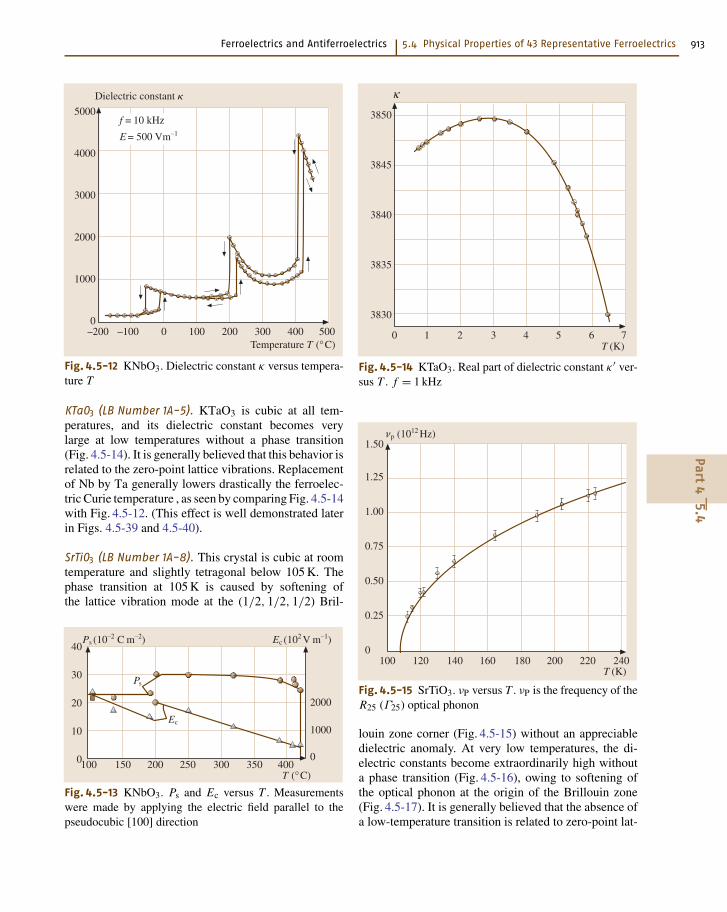
Perovskite-Type FamilyKNbO3 (LB Number 1A-2). This crystal is ferroelec-tric below about 418 ◦C. Further phase transitionstake place at about 225 ◦C and about −10 ◦C, re-taining ferroelectric activity. The crystal has largeelectromechanical coupling constants and is usefulin lead-free piezoelectric elements and SAW (surfaceacoustic wave) filters in communications technology(Fig. 4.5-13,4.5-14).Part
45.4
Ferroelectrics and Antiferroelectrics 5.4 Physical Properties of 43 Representative Ferroelectrics 913
5000
4000
3000
2000
1000
0
Dielectric constant �
–200 –100 0 100 200 300 400 500Temperature T (°C)
f = 10 kHz
E = 500 Vm–1
Fig. 4.5-12 KNbO3. Dielectric constant κ versus tempera-ture T
KTaO3 (LB Number 1A-5). KTaO3 is cubic at all tem-peratures, and its dielectric constant becomes verylarge at low temperatures without a phase transition(Fig. 4.5-14). It is generally believed that this behavior isrelated to the zero-point lattice vibrations. Replacementof Nb by Ta generally lowers drastically the ferroelec-tric Curie temperature , as seen by comparing Fig. 4.5-14with Fig. 4.5-12. (This effect is well demonstrated laterin Figs. 4.5-39 and 4.5-40).
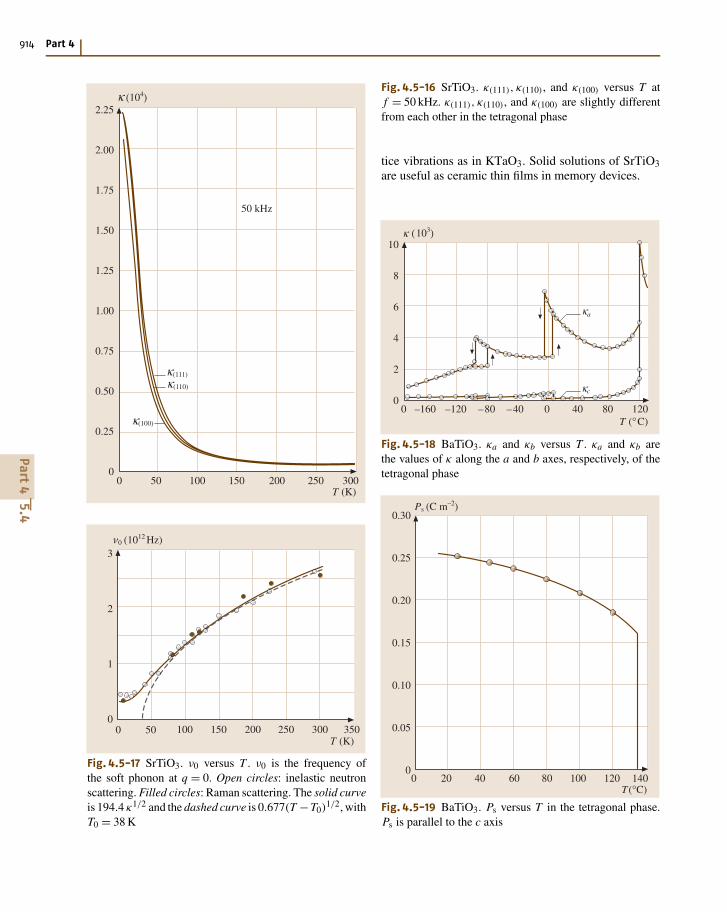
SrTiO3 (LB Number 1A-8). This crystal is cubic at roomtemperature and slightly tetragonal below 105 K. Thephase transition at 105 K is caused by softening ofthe lattice vibration mode at the (1/2, 1/2, 1/2) Bril-
40
30
20
10
0
2000
1000
100 150 200 250 300 350 4000
Ps (10–2 C m–2) Ec (102 V m–1)
T (°C)
Ps
Ec
Fig. 4.5-13 KNbO3. Ps and Ec versus T . Measurementswere made by applying the electric field parallel to thepseudocubic [100] direction
κ
3850
3845
3840
3835
3830
0 71 2 3 4 5 6T (K)
Fig. 4.5-14 KTaO3. Real part of dielectric constant κ′ ver-sus T . f = 1 kHz
νp (1012 Hz)
T (K)100 240
1.50
120 140 160
1.25
1.00
0.75
0.50
0.25
0180 200 220
Fig. 4.5-15 SrTiO3. νP versus T . νP is the frequency of theR25 (Γ25) optical phonon
louin zone corner (Fig. 4.5-15) without an appreciabledielectric anomaly. At very low temperatures, the di-electric constants become extraordinarily high withouta phase transition (Fig. 4.5-16), owing to softening ofthe optical phonon at the origin of the Brillouin zone(Fig. 4.5-17). It is generally believed that the absence ofa low-temperature transition is related to zero-point lat-
Part4
5.4
914 Part 4
T (K)50
2.25
2.00
1.75
1.50
1.25
1.00
0.75
0.50
0.25
0
(104)
100 150 200 250 300
(111)
(110)
(100)
0
κκ
κ
κ
50 kHz
ν0 (1012 Hz)
50 350T (K)
3
2
1
0100 150 200 250 3000
Fig. 4.5-17 SrTiO3. ν0 versus T . ν0 is the frequency ofthe soft phonon at q = 0. Open circles: inelastic neutronscattering. Filled circles: Raman scattering. The solid curveis 194.4 κ1/2 and the dashed curve is 0.677(T −T0)
1/2, withT0 = 38 K
Fig. 4.5-16 SrTiO3. κ(111), κ(110), and κ(100) versus T atf = 50 kHz. κ(111), κ(110), and κ(100) are slightly differentfrom each other in the tetragonal phase
tice vibrations as in KTaO3. Solid solutions of SrTiO3are useful as ceramic thin films in memory devices.
(103)
T (°C)
10
8
6
4
2
00 120–160 –120 –80 –40 0 40 80
κ
a
c
κ
κ
Fig. 4.5-18 BaTiO3. κa and κb versus T . κa and κb arethe values of κ along the a and b axes, respectively, of thetetragonal phase
0.30
0.25
0.20
0.15
0.10
0.05
0200 40 60 80 100 120 140
T (°C)
Ps (C m–2)
Fig. 4.5-19 BaTiO3. Ps versus T in the tetragonal phase.Ps is parallel to the c axis
Part4
5.4
Ferroelectrics and Antiferroelectrics 5.4 Physical Properties of 43 Representative Ferroelectrics 915
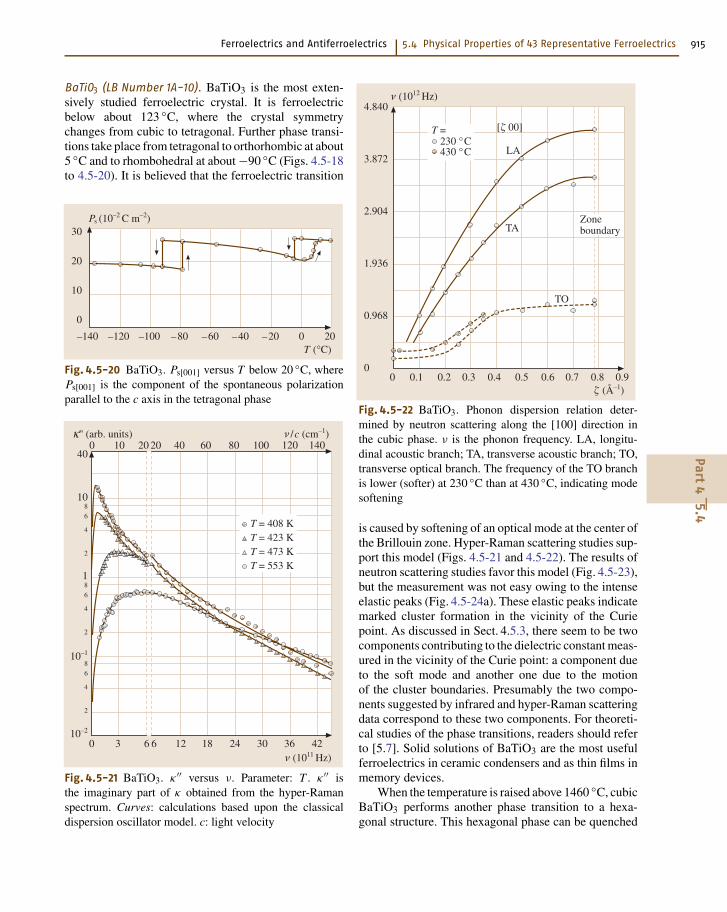
BaTiO3 (LB Number 1A-10). BaTiO3 is the most exten-sively studied ferroelectric crystal. It is ferroelectricbelow about 123 ◦C, where the crystal symmetrychanges from cubic to tetragonal. Further phase transi-tions take place from tetragonal to orthorhombic at about5 ◦C and to rhombohedral at about −90 ◦C (Figs. 4.5-18to 4.5-20). It is believed that the ferroelectric transition
30
20
10
0
–140 –120 –100 –80 –60 –40 –20 0 20T (°C)
Ps (10–2 C m–2)
Fig. 4.5-20 BaTiO3. Ps[001] versus T below 20 ◦C, wherePs[001] is the component of the spontaneous polarizationparallel to the c axis in the tetragonal phase
8
6
4
2
8
6
4
2
8
6
4
2
'' (arb. units)
40
10
10–1
10–2
ν /c (cm–1) 0 10 20 20 40 60 80 100 120 140
0 3 6 6 12 18 24 30 36 42ν (1011 Hz)
1
T = 408 KT = 423 KT = 473 KT = 553 K
κ
Fig. 4.5-21 BaTiO3. κ′′ versus ν. Parameter: T . κ′′ isthe imaginary part of κ obtained from the hyper-Ramanspectrum. Curves: calculations based upon the classicaldispersion oscillator model. c: light velocity
4.840
3.872
2.904
1.936
0.968
00.1 0.2 0.3 0.4 0.5 0.6 0.7 0.8 0.90
ν (1012 Hz)
� (Å–1)
[� 00]
Zoneboundary
T =230 °C430 °C
TA
LA
TO
Fig. 4.5-22 BaTiO3. Phonon dispersion relation deter-mined by neutron scattering along the [100] direction inthe cubic phase. ν is the phonon frequency. LA, longitu-dinal acoustic branch; TA, transverse acoustic branch; TO,transverse optical branch. The frequency of the TO branchis lower (softer) at 230 ◦C than at 430 ◦C, indicating modesoftening
is caused by softening of an optical mode at the center ofthe Brillouin zone. Hyper-Raman scattering studies sup-port this model (Figs. 4.5-21 and 4.5-22). The results ofneutron scattering studies favor this model (Fig. 4.5-23),but the measurement was not easy owing to the intenseelastic peaks (Fig. 4.5-24a). These elastic peaks indicatemarked cluster formation in the vicinity of the Curiepoint. As discussed in Sect. 4.5.3, there seem to be twocomponents contributing to the dielectric constant meas-ured in the vicinity of the Curie point: a component dueto the soft mode and another one due to the motionof the cluster boundaries. Presumably the two compo-nents suggested by infrared and hyper-Raman scatteringdata correspond to these two components. For theoreti-cal studies of the phase transitions, readers should referto [5.7]. Solid solutions of BaTiO3 are the most usefulferroelectrics in ceramic condensers and as thin films inmemory devices.
When the temperature is raised above 1460 ◦C, cubicBaTiO3 performs another phase transition to a hexa-gonal structure. This hexagonal phase can be quenched
Part4
5.4

916 Part 4
T (K)300
8
7
6
5
4
3
2
1
0
250
200
150
100
50
0400 500 600 700 800
∆ν0, Γ (1012Hz) ∆ν0/c (cm–1)
∆ν0Γ
3.6
3.2
2.8
2.4
2.0
1.6
1.2
0.8
0.4
0
0.50
0.25
03.7 3.8 3.9 4.0 4.1 4.2 4.3
H
I (103 counts)
Cubic BaTiO3150 °C
Q = (H, K, O)a*
K = 0.1K = 0.2K = 0.3
ν = 0
K
L
H
ν = 0.97 ×10¹² Hz
b)
a)
Fig. 4.5-23 BaTiO3. ∆ν0 and Γ versus T , obtained fromhyper-Raman scattering in the cubic phase. ∆ν0 and Γ
are the optical mode frequency and damping constant, re-spectively. The different symbols (brown and gray) showresults from different authors. ∆ν0 decreases as the tem-perature decreases to the Curie point, showing the presenceof mode softening. c: ligth velocity
10 000
8000
6000
4000
2000
00 100 200 300 400 500 600
κ
T (°C)
Fig. 4.5-25 PbTiO3. κ versus T
80
60
40
20
00 100 200 300 400 500
Ps (10–2 C m–2)
T (°C)
Fig. 4.5-26 PbTiO3. Ps versus T
Fig. 4.5-24a,b BaTiO3. Triple-axis neutron spectrometerscans at constant frequency across the sheet of diffuse scat-tering at 150 ◦C. The path of the scans is shown in theinset. (a) shows the elastic scan (ν = 0), where the highbackground level is due to nuclear incoherent scattering.(b) Ineleastic scan (ν = 0.97 × 10¹² Hz)
Part4
5.4

Ferroelectrics and Antiferroelectrics 5.4 Physical Properties of 43 Representative Ferroelectrics 917
4000
3500
3000
2500
2000
1500
1000
500
0
7
6
5
4
3
2
1
0175 200 225 250 275 300 325
κc κ
κ
T (°C)
f = 1 MHz
–1 c (10–4)
c –1 c
P
κ
Θ
Fig. 4.5-27 PbZrO3 (single crystal). κc and κ−1c versus T
to room temperature by relatively rapid cooling. Thishexagonal BaTiO3 also shows ferroelectric activity be-low −199 ◦C.
PbTiO3 (LB Number 1A-11). This crystal is ferroelec-tric below about 500 ◦C (Figs. 4.5-25, 4.5-26). Thespontaneous polarization is large (Fig. 4.5-26) andthus the pyroelectric coefficient is large, which makes
60
50
40
30
20
10
0
Ecrit (105 V m–1)
200 205 210 215 220 225 230
Ecrit
E
P
T (°C)
Fig. 4.5-28 PbZrO3. Ecrit versus T . Ecrit is the critical fieldof the antiferroelectric hysteresis loop
the crystal useful in infrared sensors. Solid solutionswith other perovskite-type oxides provide good dielec-tric and piezoelectric materials (see PZT, PLZT, and(PbTiO3)x(Pb(Sc1/2Nb1/2)O3)1−x below).
PbZrO3 (LB Number 1A-15). This crystal is antiferro-electric below about 230 ◦C (Fig. 4.5-27), exhibitinga typical antiferroelectric hysteresis loop (Fig. 4.5-28).Solid solutions of this substance are very important intechnological applications (see PZT and PLZT below).
Pb(Mg1/3Nb2/3)O3 (LB Number 1B-d4). This crystalexhibits a broad ferroelectric phase transition withan average transition temperature of −8 ◦C deter-mined by the maximum of the low-frequency dielectricconstant. A marked frequency dispersion of the
20
16
12
8
4
0
0.16
0.08
0–150 –100 –50 0 50 100
T (°C)
1002
1060
6001
HzkHzkHzkHzkHzMHz
δtanκ (10–3)
δtan
κ
κ
Fig. 4.5-29 Pb(Mg1/3Nb2/3)O3 (ceramic). κ and tan δ ver-sus T . Parameter: f
20
15
10
5
075
Ps (10–2 C m–2)
100 125 150 175 200 225 250T (°C)
x= 0.05 0.040.03
0.02
0.005
Fig. 4.5-30 Pb(Zr1−xTix)O3 (ceramic). Ps versus T . Pa-rameter: x
Part4
5.4

918 Part 4
dielectric constant occurs around the transition tem-perature. These is a typical behavior of a relaxor(Fig. 4.5-29).
Pb(Zr,Ti)O3 (LB Number 1C-a62). PbZrO3 is antiferro-electric, as described above, while a small addition ofPbTiO3 induces a ferroelectric phase (Fig. 4.5-30).
PZT (LB Number 1C-a63). Solid solutionsPb(Ti1−xZrx)O3 with x = 0.5–0.6 are commonly calledPZT. They have very large electromechanical couplingconstants and are widely utilized as piezoelectric elem-ents. Thin ceramic films are useful in memory devices(Fig. 4.5-31).
1000
800
600
400
200
0
Pr (10–2 C/m2)
κ
pi (10–4 C/(K m2))
– d31 (10–12 C/N)
x (PbZrO3)
100
80
60
40
20
0
45
35
25
15
4
3
2
10.3 0.4 0.5 0.6 0.7 0.8
d31
Pi
Pr
Fig. 4.5-31 Pb(Ti1−xZrx)O3 2% Zr(Mn1/3Bi2/3)O3 as anadditive (ceramic). κ, pi , d31, and Pr versus x. pi is the py-roelectric coefficient, d31 is the piezoelectric strain constant,and Pr is the remanent polarization (see Fig. 4.5-1)
0
35
30
25
20
15
10
5
0
Ps (10–2 C m–2)
–25 25 50 75 100 125125 150T (°C)
Fig. 4.5-32 (Pb0.92La0.08)(Zr0.40Ti0.60)0.98O3 (PLZT). Ps
versus T
PLZT (LB Number 1C-c66). The acronym PLZT meansLa-modified PZT. Hot-pressed ceramic PLZT is trans-parent and useful for optical switches and similar devices(Fig. 4.5-32).
(PbTiO3)x (Pb(Sc1/2Nb1/2)O3)1−x (LB Number 1C-b34).These solid solutions have very large electromechan-
x (PbTiO3)0.2 0.3 0.4 0.5 0.6 0.70.10
x = 0 corrsponds to Pb(Sc1/2Nb1/2)O3
T = 25 °C
k0.5
0.4
0.3
0.2
0.1
0
p
Fig. 4.5-33 (PbTiO3)x(Pb(Sc1/2Nb1/2)O3)1−x (ceramic).kp versus x. kp is the planar electromechanical couplingfactor
Part4
5.4

Ferroelectrics and Antiferroelectrics 5.4 Physical Properties of 43 Representative Ferroelectrics 919
8
6
4
2
8
6
4
2
104
105
6
4
2
103
6
4
2
102
8
8
100 100 200 300 400 500 600 700 800
κ
κ
T
T (°C)
T
κ
11
T11
f = 10kHz
Fig. 4.5-34 LiTaO3. κT11 and κT
33 versus T . f = 10 kHz
–100
1.0
0.8
0.6
0.4
0.2
00 100 200 300 400 500 600 700
T (°C)
Ps/Ps(0)
Fig. 4.5-35 LiTaO3. Ps/Ps(0) versus T . Ps(0) is the valueof Ps at 0 K (about 0.5 C m−2)
ical coupling factors, and are utilized for piezoelectricactuators and similar devices (Fig. 4.5-33).
LiNbO3 FamilyLiTaO3 (LB Number 2A-2). This crystal is ferroelectricbelow 620 ◦C. The coercive field is large. The crys-tal is useful for piezoelectric elements, for linear andnonlinear optical elements, and for SAW filters in com-munications technology (Figs. 4.5-34 and 4.5-35).
SrTeO3 FamilySrTeO3 (LB Number 4A-1). This crystal is ferroelectricbetween 312 and 485 ◦C (Figs. 4.5-36 and 4.5-37).
0
104
103
102
10
1100 200 300 400 500 600
κ
T (°C)
' '
'
κ T22 κ T
11
κ T33
Fig. 4.5-36 SrTeO3. κ versus T . f = 10 kHz
200
0.04
0.03
0.02
0.01
0320 360 400 440 480 520
T (°C)
Ps (C m–2)
Fig. 4.5-37 SrTeO3. Ps versus T
Part4
5.4
920 Part 4
d33 (relative)
0
3.5
3.0
2.5
50
40
30
20
10
0100 200 300 400 500 600
l33 (10–5 m)
T (°C)
l33
d33 (relative)
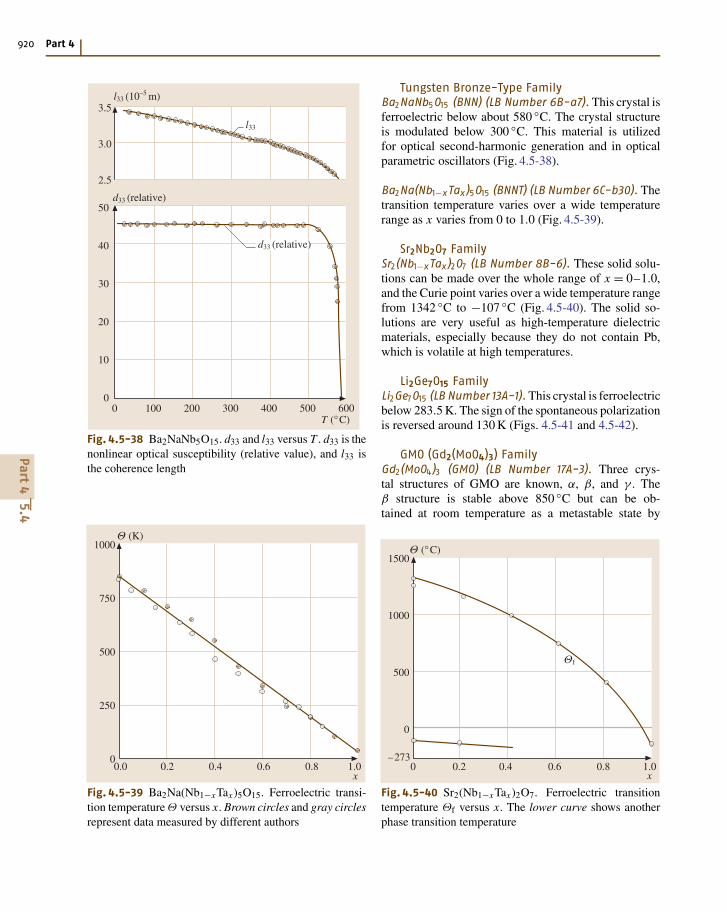
Fig. 4.5-38 Ba2NaNb5O15. d33 and l33 versus T . d33 is thenonlinear optical susceptibility (relative value), and l33 isthe coherence length
Θ (K)
x0.0
1000
750
500
250
00.2 0.4 0.6 0.8 1.0
Fig. 4.5-39 Ba2Na(Nb1−xTax)5O15. Ferroelectric transi-tion temperature Θ versus x. Brown circles and gray circlesrepresent data measured by different authors
Tungsten Bronze-Type FamilyBa2NaNb5O15 (BNN) (LB Number 6B-a7). This crystal isferroelectric below about 580 ◦C. The crystal structureis modulated below 300 ◦C. This material is utilizedfor optical second-harmonic generation and in opticalparametric oscillators (Fig. 4.5-38).
Ba2Na(Nb1−xTax)5O15 (BNNT) (LB Number 6C-b30). Thetransition temperature varies over a wide temperaturerange as x varies from 0 to 1.0 (Fig. 4.5-39).
Sr2Nb2O7 FamilySr2(Nb1−xTax)2O7 (LB Number 8B-6). These solid solu-tions can be made over the whole range of x = 0–1.0,and the Curie point varies over a wide temperature rangefrom 1342 ◦C to −107 ◦C (Fig. 4.5-40). The solid so-lutions are very useful as high-temperature dielectricmaterials, especially because they do not contain Pb,which is volatile at high temperatures.
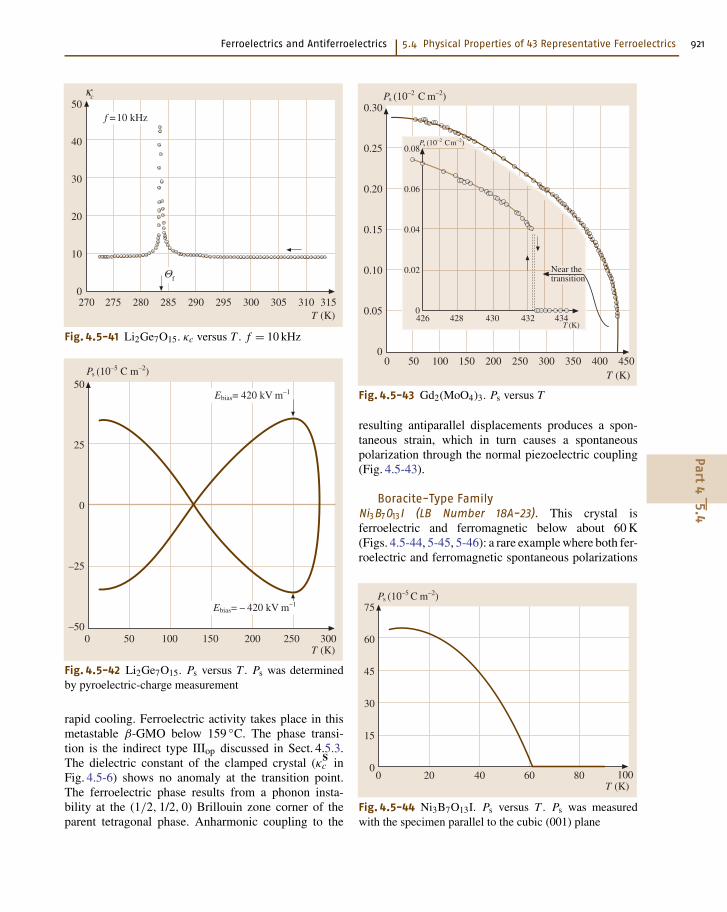
Li2Ge7O15 FamilyLi2Ge7O15 (LB Number 13A-1). This crystal is ferroelectricbelow 283.5 K. The sign of the spontaneous polarizationis reversed around 130 K (Figs. 4.5-41 and 4.5-42).
GMO (Gd2(MoO4)3) FamilyGd2(MoO4)3 (GMO) (LB Number 17A-3). Three crys-tal structures of GMO are known, α, β, and γ . Theβ structure is stable above 850 ◦C but can be ob-tained at room temperature as a metastable state by
Θ (°C)
x0 1.0
1500
1000
500
0
0.2 0.4 0.6 0.8–273
Θf
Fig. 4.5-40 Sr2(Nb1−xTax)2O7. Ferroelectric transitiontemperature Θf versus x. The lower curve shows anotherphase transition temperature
Part4
5.4
Ferroelectrics and Antiferroelectrics 5.4 Physical Properties of 43 Representative Ferroelectrics 921
κ
270 315
50
40
30
20
10
0275 280 285 290 295 300 305 310
c
Θf
T (K)
f =10 kHz
Fig. 4.5-41 Li2Ge7O15. κc versus T . f = 10 kHz
50
25
0
–25
–500 50 100 150 200 250 300
T (K)
Ps (10–5 C m–2)
Ebias= 420 kV m–1
Ebias= – 420 kV m–1
Fig. 4.5-42 Li2Ge7O15. Ps versus T . Ps was determinedby pyroelectric-charge measurement
rapid cooling. Ferroelectric activity takes place in thismetastable β-GMO below 159 ◦C. The phase transi-tion is the indirect type IIIop discussed in Sect. 4.5.3.The dielectric constant of the clamped crystal (κS
c inFig. 4.5-6) shows no anomaly at the transition point.The ferroelectric phase results from a phonon insta-bility at the (1/2, 1/2, 0) Brillouin zone corner of theparent tetragonal phase. Anharmonic coupling to the
T (K)0 450
0.30
0.25
0.20
0.15
0.10
0.05
0
Ps (10–2 C m–2)
50 100 150 200 250 300 350 400
426
Ps (10–2 Cm–2)
T (K)
0.08
0.06
0.04
0.02
0428 430 432 434
Near thetransition
Fig. 4.5-43 Gd2(MoO4)3. Ps versus T
resulting antiparallel displacements produces a spon-taneous strain, which in turn causes a spontaneouspolarization through the normal piezoelectric coupling(Fig. 4.5-43).
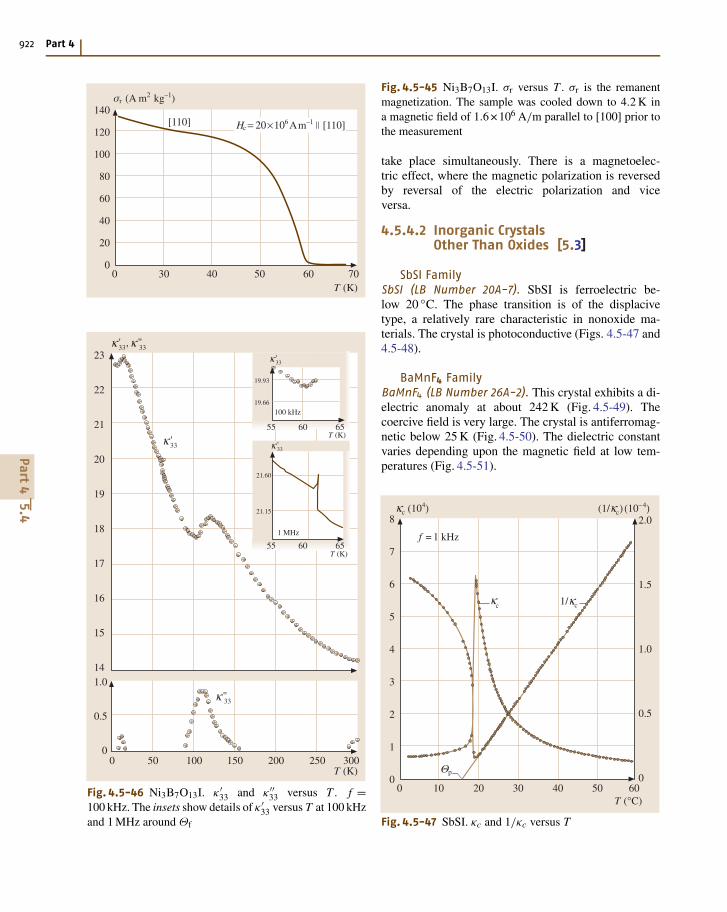
Boracite-Type FamilyNi3B7O13I (LB Number 18A-23). This crystal isferroelectric and ferromagnetic below about 60 K(Figs. 4.5-44, 5-45, 5-46): a rare example where both fer-roelectric and ferromagnetic spontaneous polarizations
0
75
60
45
30
15
020 40 60 80 100
T (K)
Ps (10–5 C m–2)
Fig. 4.5-44 Ni3B7O13I. Ps versus T . Ps was measuredwith the specimen parallel to the cubic (001) plane
Part4
5.4
922 Part 4
0 70
140
120
100
80
60
40
20
030 40 50 60
T (K)
σr (A m2 kg–1)
Hc = 20×106 Am–1 �� [110][110]
23
22
21
20
19
18
17
16
15
141.0
0.5
00 50 100 150 200 250 300
T (K)
' ''κ κ33
33'κ
33
33''κ
,
19.93
19.66
55
'33κ
60 65
100 kHz
T (K)
'33κ
21.60
21.15
1 MHz
T (K)
55 60 65
Fig. 4.5-46 Ni3B7O13I. κ′33 and κ′′
33 versus T . f =100 kHz. The insets show details of κ′
33 versus T at 100 kHzand 1 MHz around Θf
Fig. 4.5-45 Ni3B7O13I. σr versus T . σr is the remanentmagnetization. The sample was cooled down to 4.2 K ina magnetic field of 1.6 × 10⁶ A/m parallel to [100] prior tothe measurement
take place simultaneously. There is a magnetoelec-tric effect, where the magnetic polarization is reversedby reversal of the electric polarization and viceversa.
4.5.4.2 Inorganic CrystalsOther Than Oxides [5.3]
SbSI FamilySbSI (LB Number 20A-7). SbSI is ferroelectric be-low 20 ◦C. The phase transition is of the displacivetype, a relatively rare characteristic in nonoxide ma-terials. The crystal is photoconductive (Figs. 4.5-47 and4.5-48).
BaMnF4 FamilyBaMnF4 (LB Number 26A-2). This crystal exhibits a di-electric anomaly at about 242 K (Fig. 4.5-49). Thecoercive field is very large. The crystal is antiferromag-netic below 25 K (Fig. 4.5-50). The dielectric constantvaries depending upon the magnetic field at low tem-peratures (Fig. 4.5-51).
0
8
7
6
5
4
3
2
1
010 20 30 40 50 60
Θp
T (°C)
κc
f =1 kHz
2.0
1.5
1.0
0.5
0
(104) ) (10–4)κc(1/
κc κc1/
Fig. 4.5-47 SbSI. κc and 1/κc versus T
Part4
5.4

Ferroelectrics and Antiferroelectrics 5.4 Physical Properties of 43 Representative Ferroelectrics 923
0
25
20
15
10
5
05 10 15 20
T (°C)
Ps (10–2 C m–2)
Fig. 4.5-48 SbSI. Ps versus T
a
0 300
21
19
17
15
13
11
9
8.8
8.6
8.4
8.250 100 150 200 250
κ
aκ
cκ
cκ
T (K)
f = 100 kHz
Fig. 4.5-49 BaMnF4. κa and κc versus T
0
350
300
250
200
150
100
50
050 100 150 200 250 300
T (K)
(10–9 m3/mol)magn m
χχ
χ
⊥
��
��H bH b⊥
Fig. 4.5-50 BaMnF4. χmagn m versus T . χmagn m is themagnetic susceptibility, and χ⊥ and χ‖ are the magneticsusceptibilities measured perpendicular and parallel, re-spectively, to the b axis
0
12.095
12.090
12.085
12.080
12.075
12.070
12.06520 22 24 26
T (K)
κ a
f = 9.75 kHzH = 8.36 ×10⁴A/m
2.51 ×10⁵A/m
H = 0
Fig. 4.5-51 BaMnF4. κa versus T . Parameter: magneticfield H. f = 9.75 kHz
Part4
5.4
924 Part 4
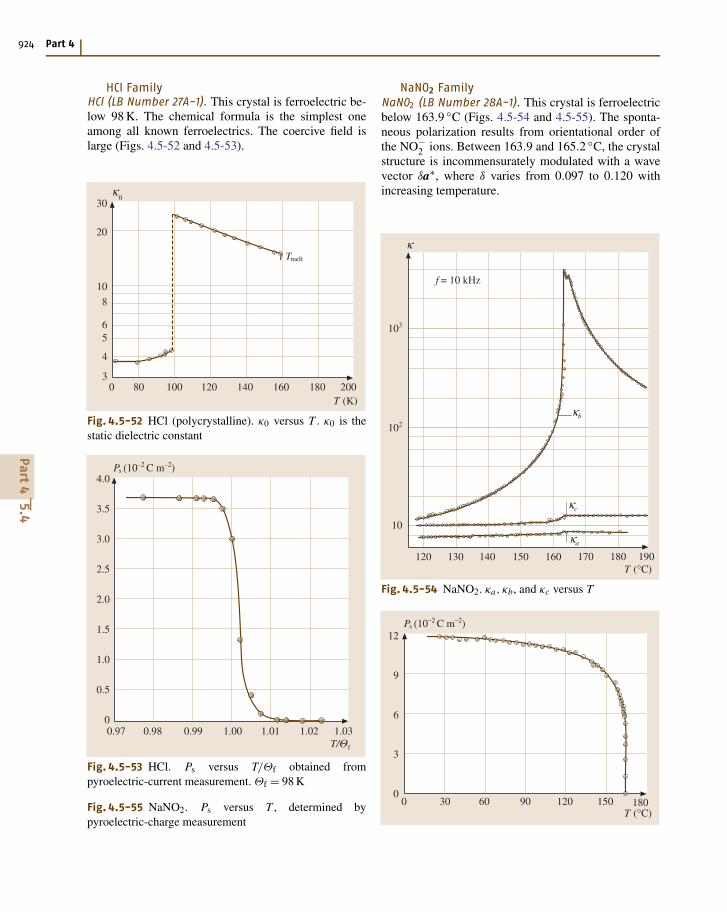
HCl FamilyHCl (LB Number 27A-1). This crystal is ferroelectric be-low 98 K. The chemical formula is the simplest oneamong all known ferroelectrics. The coercive field islarge (Figs. 4.5-52 and 4.5-53).
0
30
20
10
8
65
4
380 100 120 140 160 180 200
κ0
T (K)
Tmelt
Fig. 4.5-52 HCl (polycrystalline). κ0 versus T . κ0 is thestatic dielectric constant
4.0
3.5
3.0
2.5
2.0
1.5
1.0
0.5
00.97 0.98 0.99 1.00 1.01 1.02 1.03
T/ fΘ
Ps (10–2 C m–2)
Fig. 4.5-53 HCl. Ps versus T/Θf obtained frompyroelectric-current measurement. Θf = 98 K
Fig. 4.5-55 NaNO2. Ps versus T , determined bypyroelectric-charge measurement
NaNO2 FamilyNaNO2 (LB Number 28A-1). This crystal is ferroelectricbelow 163.9 ◦C (Figs. 4.5-54 and 4.5-55). The sponta-neous polarization results from orientational order ofthe NO−
2 ions. Between 163.9 and 165.2 ◦C, the crystalstructure is incommensurately modulated with a wavevector δa∗, where δ varies from 0.097 to 0.120 withincreasing temperature.
120 130 140 150 160 170 180 190
κ
103
102
10
f = 10 kHz
T (°C)
κb
κc
κa
Fig. 4.5-54 NaNO2. κa, κb, and κc versus T
0 18030 60 90 120 150
Ps (10–2 C m–2)12
9
6
3
0
T (°C)
Part4
5.4
Ferroelectrics and Antiferroelectrics 5.4 Physical Properties of 43 Representative Ferroelectrics 925
0 20025 50 75 100 125 150 175
II III I
70
60
50
40
30
20
10
0
κc
f = 100 kHz
T (°C)
Fig. 4.5-56 KNO3. κc versus T
10.0
7.5
5.0
2.5
0115.0 117.5 120.0 122.5 125.0 127.5 130.0
Ps (10–2 C m–2)
T (°C)
Fig. 4.5-57 KNO3. Ps versus T
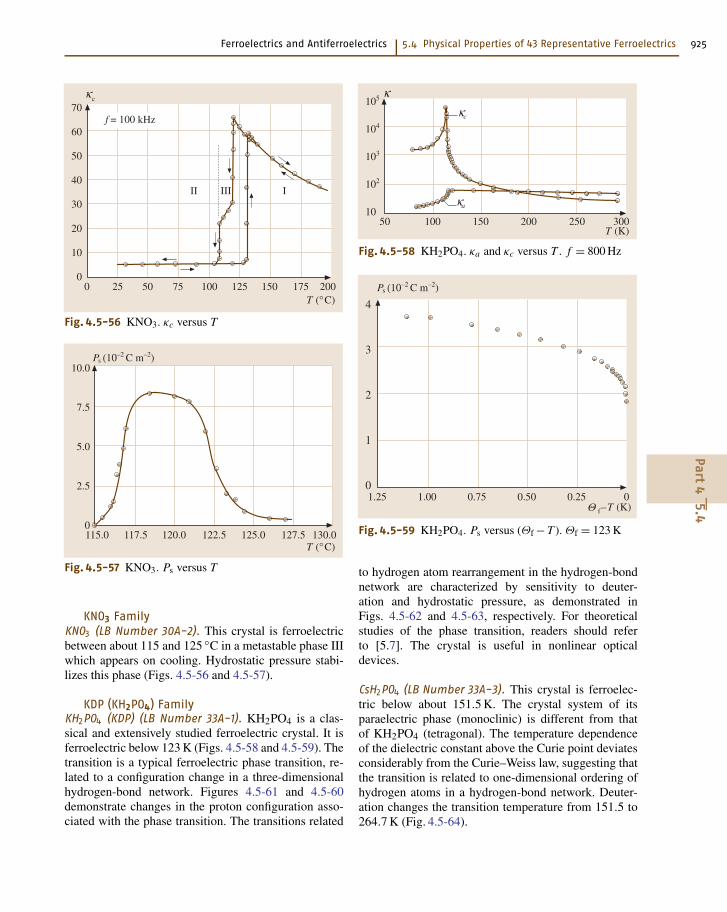
KNO3 FamilyKNO3 (LB Number 30A-2). This crystal is ferroelectricbetween about 115 and 125 ◦C in a metastable phase IIIwhich appears on cooling. Hydrostatic pressure stabi-lizes this phase (Figs. 4.5-56 and 4.5-57).
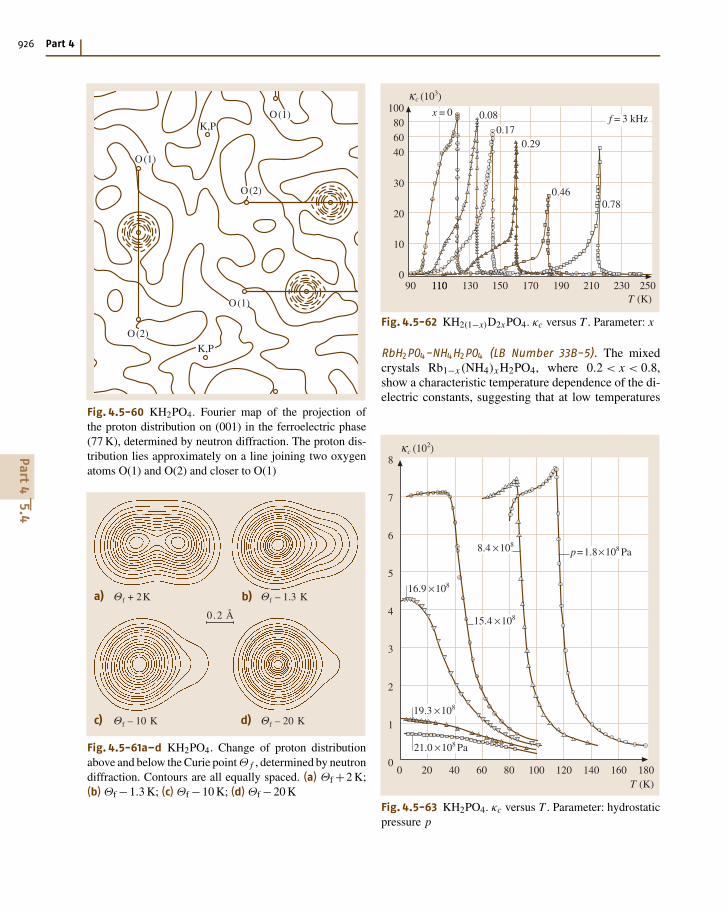
KDP (KH2PO4) FamilyKH2PO4 (KDP) (LB Number 33A-1). KH2PO4 is a clas-sical and extensively studied ferroelectric crystal. It isferroelectric below 123 K (Figs. 4.5-58 and 4.5-59). Thetransition is a typical ferroelectric phase transition, re-lated to a configuration change in a three-dimensionalhydrogen-bond network. Figures 4.5-61 and 4.5-60demonstrate changes in the proton configuration asso-ciated with the phase transition. The transitions related
105
104
103
102
1050 100 150 200 250 300
κ
T (K)
κc
κa
Fig. 4.5-58 KH2PO4. κa and κc versus T . f = 800 Hz
1.25
4
3
2
1
01.00 0.75 0.50 0.25 0
–T (K)fΘ
Ps (10–2 C m–2)
Fig. 4.5-59 KH2PO4. Ps versus (Θf − T ). Θf = 123 K
to hydrogen atom rearrangement in the hydrogen-bondnetwork are characterized by sensitivity to deuter-ation and hydrostatic pressure, as demonstrated inFigs. 4.5-62 and 4.5-63, respectively. For theoreticalstudies of the phase transition, readers should referto [5.7]. The crystal is useful in nonlinear opticaldevices.
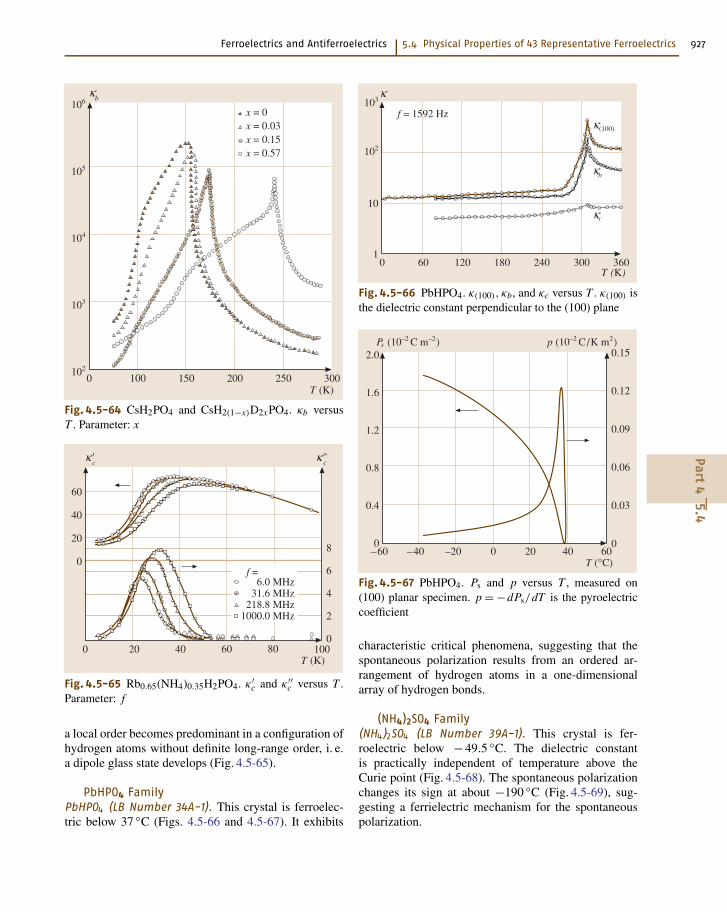
CsH2PO4 (LB Number 33A-3). This crystal is ferroelec-tric below about 151.5 K. The crystal system of itsparaelectric phase (monoclinic) is different from thatof KH2PO4 (tetragonal). The temperature dependenceof the dielectric constant above the Curie point deviatesconsiderably from the Curie–Weiss law, suggesting thatthe transition is related to one-dimensional ordering ofhydrogen atoms in a hydrogen-bond network. Deuter-ation changes the transition temperature from 151.5 to264.7 K (Fig. 4.5-64).
Part4
5.4
926 Part 4
K,PO(1)
O(2)
O(1)
O(1)
K,P
O(2)
Fig. 4.5-60 KH2PO4. Fourier map of the projection ofthe proton distribution on (001) in the ferroelectric phase(77 K), determined by neutron diffraction. The proton dis-tribution lies approximately on a line joining two oxygenatoms O(1) and O(2) and closer to O(1)
0.2 Å
a) b)
c) d)
fΘ + 2K fΘ – 1.3 K
fΘ – 20 KfΘ – 10 K
Fig. 4.5-61a–d KH2PO4. Change of proton distributionabove and below the Curie point Θ f , determined by neutrondiffraction. Contours are all equally spaced. (a) Θf +2 K;(b) Θf −1.3 K; (c) Θf −10 K; (d) Θf −20 K
90
100806040
30
20
10
0110110 130 150 170 190 210 230 250
T (K)
c (103)κx = 0 0.08
0.170.29
0.460.78
f = 3 kHz
Fig. 4.5-62 KH2(1−x)D2xPO4. κc versus T . Parameter: x
RbH2PO4-NH4H2PO4 (LB Number 33B-5). The mixedcrystals Rb1−x(NH4)xH2PO4, where 0.2 < x < 0.8,show a characteristic temperature dependence of the di-electric constants, suggesting that at low temperatures
0 18020 40 60 80 100 120 140 160T (K)
κ (102)c
p=1.8×10⁸ Pa8.4 ×108
15.4 ×10⁸
16.9 ×10⁸
19.3 ×10⁸
21.0 ×10⁸ Pa
8
7
6
5
4
3
2
1
0
Fig. 4.5-63 KH2PO4. κc versus T . Parameter: hydrostaticpressure p
Part4
5.4
Ferroelectrics and Antiferroelectrics 5.4 Physical Properties of 43 Representative Ferroelectrics 927
0
106
105
104
103
102
100 150 200 250 300T (K)
κb
x = 0x = 0.03x = 0.15x = 0.57
Fig. 4.5-64 CsH2PO4 and CsH2(1−x)D2xPO4. κb versusT . Parameter: x
0 100
60
40
20
08
6
4
2
020 40 60 80
cκ ' ''
cκ
T (K)
f =6.0 MHz
31.6 MHz218.8 MHz
1000.0 MHz
Fig. 4.5-65 Rb0.65(NH4)0.35H2PO4. κ′c and κ′′
c versus T .Parameter: f
a local order becomes predominant in a configuration ofhydrogen atoms without definite long-range order, i. e.a dipole glass state develops (Fig. 4.5-65).
PbHPO4 FamilyPbHPO4 (LB Number 34A-1). This crystal is ferroelec-tric below 37 ◦C (Figs. 4.5-66 and 4.5-67). It exhibits
κ
T (K)0 360
103
102
10
160 120 180 240 300
f = 1592 Hzκ
b
c
(100)
κ
κ
Fig. 4.5-66 PbHPO4. κ(100), κb, and κc versus T . κ(100) isthe dielectric constant perpendicular to the (100) plane
Ps (10–2 C m–2)
T (°C)–60 60
2.0
1.6
1.2
0.8
0.4
0
0.15
0.12
0.09
0.06
0.03
0–40 –20 0 20 40
p (10–2 C/K m2)
Fig. 4.5-67 PbHPO4. Ps and p versus T , measured on(100) planar specimen. p = −dPs/dT is the pyroelectriccoefficient
characteristic critical phenomena, suggesting that thespontaneous polarization results from an ordered ar-rangement of hydrogen atoms in a one-dimensionalarray of hydrogen bonds.
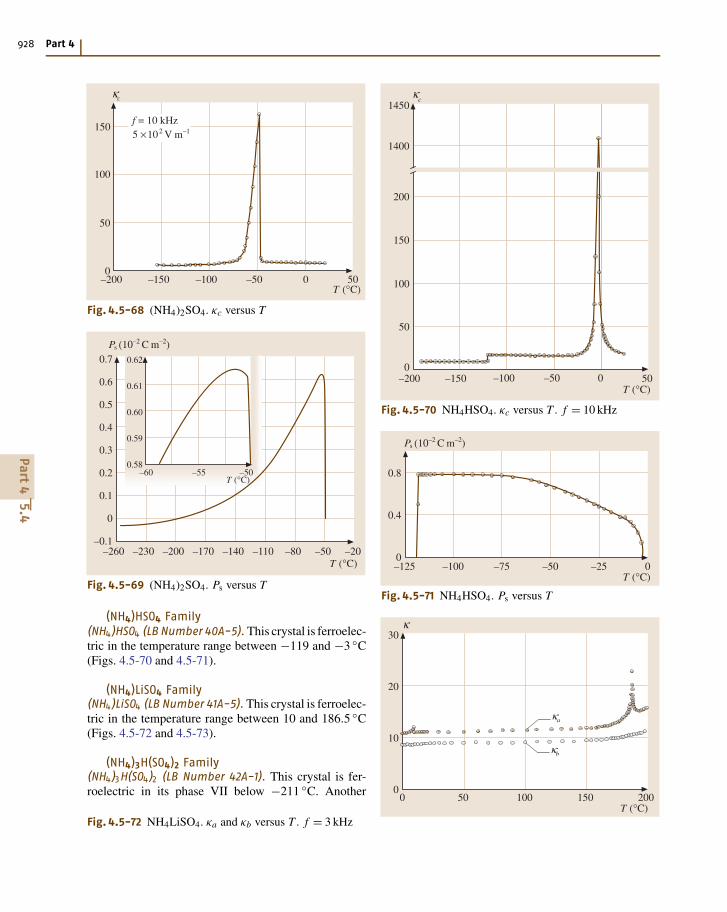
(NH4)2SO4 Family(NH4)2SO4 (LB Number 39A-1). This crystal is fer-roelectric below −49.5 ◦C. The dielectric constantis practically independent of temperature above theCurie point (Fig. 4.5-68). The spontaneous polarizationchanges its sign at about −190 ◦C (Fig. 4.5-69), sug-gesting a ferrielectric mechanism for the spontaneouspolarization.
Part4
5.4
928 Part 4
T (°C)–200 500
50
100
150
–150 –100 –50 0
5 ×10² V m–1f = 10 kHz
cκ
Fig. 4.5-68 (NH4)2SO4. κc versus T
0.7
0.6
0.5
0.4
0.3
0.2
0.1
0
–0.1–260 –230 –200 –170 –140 –110 –80 –50 –20
T (°C)
Ps (10–2 C m–2)0.62
0.61
0.60
0.59
0.58–60 –55
T (°C)–50
Fig. 4.5-69 (NH4)2SO4. Ps versus T
(NH4)HSO4 Family(NH4)HSO4 (LB Number 40A-5). This crystal is ferroelec-tric in the temperature range between −119 and −3 ◦C(Figs. 4.5-70 and 4.5-71).
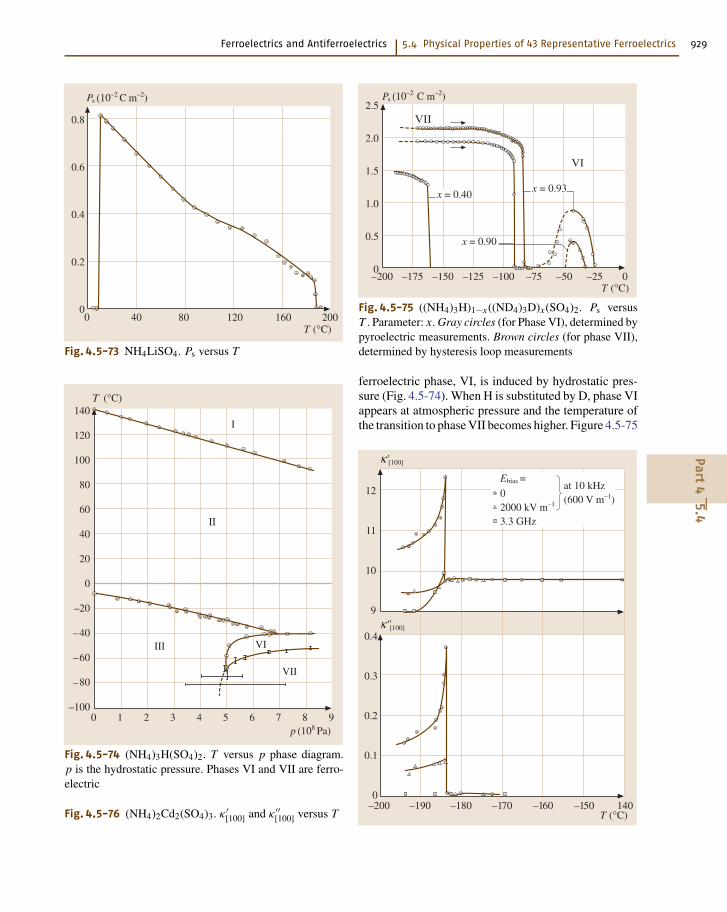
(NH4)LiSO4 Family(NH4)LiSO4 (LB Number 41A-5). This crystal is ferroelec-tric in the temperature range between 10 and 186.5 ◦C(Figs. 4.5-72 and 4.5-73).
(NH4)3H(SO4)2 Family(NH4)3H(SO4)2 (LB Number 42A-1). This crystal is fer-roelectric in its phase VII below −211 ◦C. Another
Fig. 4.5-72 NH4LiSO4. κa and κb versus T . f = 3 kHz
–200 50
1450
–150 –100 –50 0
1400
200
150
100
50
0
T (°C)
cκ
Fig. 4.5-70 NH4HSO4. κc versus T . f = 10 kHz
–125
0.8
0.4
0–100 –75 –50 –25 0
T (°C)
Ps (10–2 C m–2)
Fig. 4.5-71 NH4HSO4. Ps versus T
0 200
30
20
10
050 100 150
κa
κb
κ
T (°C)
Part4
5.4
Ferroelectrics and Antiferroelectrics 5.4 Physical Properties of 43 Representative Ferroelectrics 929
0
0.8
0.6
0.4
0.2
040 80 120 160 200
T (°C)
Ps (10–2 C m–2)
Fig. 4.5-73 NH4LiSO4. Ps versus T
0 91 2 3 4 5 6 7 8
(°C)T140
120
100
80
60
40
20
0
–20
–40
–60
–80
–100
p (108 Pa)
I
II
III VI
VII
Fig. 4.5-74 (NH4)3H(SO4)2. T versus p phase diagram.p is the hydrostatic pressure. Phases VI and VII are ferro-electric
Fig. 4.5-76 (NH4)2Cd2(SO4)3. κ′[100] and κ′′[100] versus T
–200 0
2.5
2.0
1.5
1.0
0.5
0–175 –150 –125 –100 –75 –50 –25
T (°C)
Ps (10–2 C m–2)
x = 0.40x = 0.93
x = 0.90
VI
VII
Fig. 4.5-75 ((NH4)3H)1−x((ND4)3D)x(SO4)2. Ps versusT . Parameter: x. Gray circles (for Phase VI), determined bypyroelectric measurements. Brown circles (for phase VII),determined by hysteresis loop measurements
ferroelectric phase, VI, is induced by hydrostatic pres-sure (Fig. 4.5-74). When H is substituted by D, phase VIappears at atmospheric pressure and the temperature ofthe transition to phase VII becomes higher. Figure 4.5-75
–200 140
12
11
10
9
–190 –180 –170 –160 –150
0.4
0.3
0.2
0.1
0
T (°C)
κ '[100]
Ebias =
02000 kV m–1
3.3 GHz
at 10 kHz(600 V m–1)
κ ''[100]
Part4
5.4

930 Part 4
80 94
0.8
0.6
0.4
0.2
082 84 86 88 90 92
Ps (10–2 C m–2)
T (K)
Fig. 4.5-77 (NH4)2Cd2(SO4)3. Ps versus T
–186
3
2
1
0–184 –182 –180 –178 –176 –174
f
T (°C)
Q12(103 m4 C–2)
Θ
Fig. 4.5-78 (NH4)2Cd2(SO4)3. Q12 versus T . Q12 is theelectrostrictive constant
shows temperature dependence of Ps for three valuesof x in ((NH4)3H)1−x((ND4)3D)x(SO4)2.
Langbeinite-Type Family(NH4)2Cd2(SO4)3 (LB Number 43A-13). This crystal is fer-roelectric below about −184 ◦C. The dielectric constantsare insensitive to temperature above the transition point(Fig. 4.5-76), and the spontaneous polarization does notdepend upon temperature (Fig. 4.5-77). The electrostric-tive constant Q12, however, exhibits an anomaly at thetransition point (Fig. 4.5-78).
4.5.4.3 Organic Crystals, Liquid Crystals,and Polymers [5.4]
SC(NH2)2 FamilySC(NH2)2 (LB Number 50A-1). This crystal exhibits atleast five phases, I, II, III, IV, and V (Figs. 4.5-79
0 300
104
103
102
10100 140 180 220 220
T (K)
κb
III
III
IV
V
f = 1 kHzE = 10 V m–1
Fig. 4.5-79 SC(NH2)2. κb versus T
165
6
5
4
3
2
1
0170 175 180 185 190 195 200
Ebias (106 V/m)
T (K)
V(Ferro-electric)
Inc.
I(Para-elec-tric)
δ = 1–9
III (δ= 1–8)
Method
Pyroelectric responseHysteresis loopsDielectric constantPolarization
Inc.
Fig. 4.5-80 SC(NH2)2. Ebias versus T phase diagram.The value of δ means that the phase is commensuratelymodulated with a vector of wavenumber δc∗. Inc., incom-mensurate phase
Part4
5.4

Ferroelectrics and Antiferroelectrics 5.4 Physical Properties of 43 Representative Ferroelectrics 931
90
3.0
2.5
2.0
1.5
1.0
0.5
0110 130 150 170
T (K)
Ps (10–2 C m–2)
Fig. 4.5-81 SC(NH2)2. Ps versus T for phase V
and 4.5-80). The crystal is ferroelectric in phase V(Fig. 4.5-81), and slightly ferroelectric with a verysmall spontaneous polarization in phase III. The crystalstructure is modulated commensurately or incommen-surately except for phases I and V, as indicated inFig. 4.5-80.
DSP (Ca2Sr(CH3CH2COO)6) FamilyCa2Sr(CH3CH2COO)6 (DSP) (LB Number 58A-1). This crys-tal is ferroelectric below about 4 ◦C (Fig. 4.5-82). TheCurie–Weiss constant is small (60 K). Critical slowing-down (see Sect. 4.5.3) takes place (Fig. 4.5-8).
–25 10
0.3
0.2
0.1
0–20 –15 –10 –5 0 5
T (°C)
Ps (10–2 C m–2)
12
3
–160
103
102
10
–120 –80 –40 0 40 80
f = 10 kHz
κb
κ
T (°C)
κcκa' '
Fig. 4.5-83 (NH2CH2COOH)3 · H2SO4. κa′ , κb′ , and κc′versus T . These quantities are referred to the unit cellvectors: a′ = a + c, b′ = −b, and c′ = −c
100
4.5
4.0
3.5
3.0
2.5
2.0
1.5
1.0
0.5
0125 150 175 200 225 250 275 300 325
T (K)
Ps (10–2 C m–2)
Fig. 4.5-84 (NH2CH2COOH)3 · H2SO4. Ps versus T . Ps
is parallel to the b axis. Gray circles: values determined bypyroelectric measurements. Triangles and brown circles:determined from hysteresis loop by different authors
Fig. 4.5-82 Ca2Sr(CH3CH2COO)6. Ps versus T . Thethree curves show the effect of annealing: 1, unannealed; 2,annealed at 330 ◦C for 60 h; 3, annealed at 330 ◦C for 60 hand at 390 ◦C for 5 h
Part4
5.4
932 Part 4
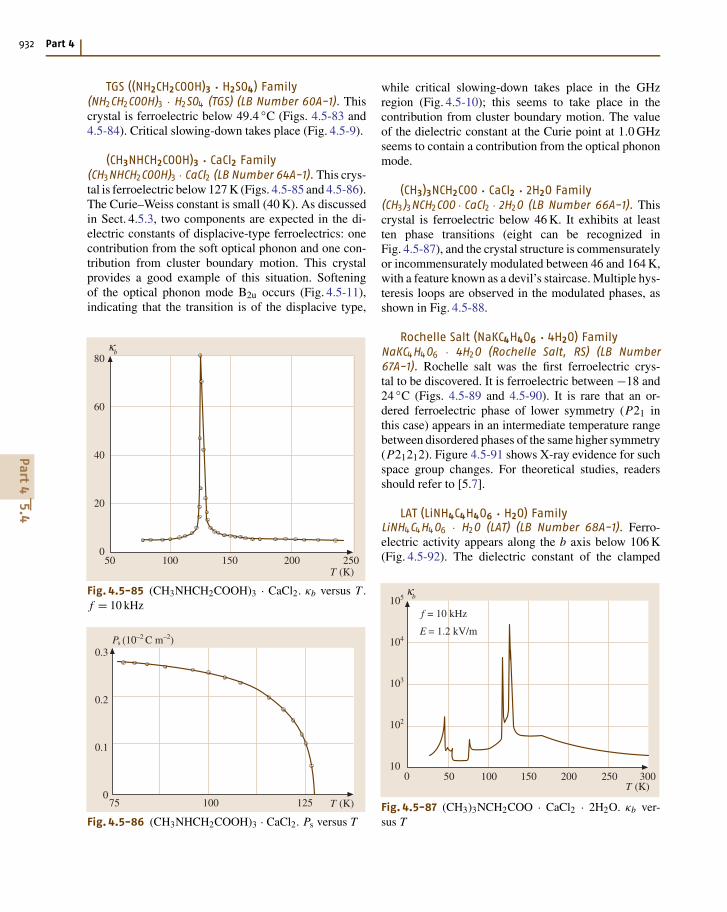
TGS ((NH2CH2COOH)3 · H2SO4) Family(NH2CH2COOH)3 · H2SO4 (TGS) (LB Number 60A-1). Thiscrystal is ferroelectric below 49.4 ◦C (Figs. 4.5-83 and4.5-84). Critical slowing-down takes place (Fig. 4.5-9).
(CH3NHCH2COOH)3 · CaCl2 Family(CH3NHCH2COOH)3 · CaCl2 (LB Number 64A-1). This crys-tal is ferroelectric below 127 K (Figs. 4.5-85 and 4.5-86).The Curie–Weiss constant is small (40 K). As discussedin Sect. 4.5.3, two components are expected in the di-electric constants of displacive-type ferroelectrics: onecontribution from the soft optical phonon and one con-tribution from cluster boundary motion. This crystalprovides a good example of this situation. Softeningof the optical phonon mode B2u occurs (Fig. 4.5-11),indicating that the transition is of the displacive type,
50
80
60
40
20
0100 150 200 250
κb
T (K)
Fig. 4.5-85 (CH3NHCH2COOH)3 · CaCl2. κb versus T .f = 10 kHz
75
0.3
0.2
0.1
0100 125
Ps (10–2 C m–2)
T (K)
Fig. 4.5-86 (CH3NHCH2COOH)3 · CaCl2. Ps versus T
while critical slowing-down takes place in the GHzregion (Fig. 4.5-10); this seems to take place in thecontribution from cluster boundary motion. The valueof the dielectric constant at the Curie point at 1.0 GHzseems to contain a contribution from the optical phononmode.
(CH3)3NCH2COO · CaCl2 · 2H2O Family(CH3)3NCH2COO · CaCl2 · 2H2O (LB Number 66A-1). Thiscrystal is ferroelectric below 46 K. It exhibits at leastten phase transitions (eight can be recognized inFig. 4.5-87), and the crystal structure is commensuratelyor incommensurately modulated between 46 and 164 K,with a feature known as a devil’s staircase. Multiple hys-teresis loops are observed in the modulated phases, asshown in Fig. 4.5-88.
Rochelle Salt (NaKC4H4O6 · 4H2O) FamilyNaKC4H4O6 · 4H2O (Rochelle Salt, RS) (LB Number67A-1). Rochelle salt was the first ferroelectric crys-tal to be discovered. It is ferroelectric between −18 and24 ◦C (Figs. 4.5-89 and 4.5-90). It is rare that an or-dered ferroelectric phase of lower symmetry (P21 inthis case) appears in an intermediate temperature rangebetween disordered phases of the same higher symmetry(P21212). Figure 4.5-91 shows X-ray evidence for suchspace group changes. For theoretical studies, readersshould refer to [5.7].
LAT (LiNH4C4H4O6 · H2O) FamilyLiNH4C4H4O6 · H2O (LAT) (LB Number 68A-1). Ferro-electric activity appears along the b axis below 106 K(Fig. 4.5-92). The dielectric constant of the clamped
105
104
103
102
100 50 100 150 200 250 300
f = 10 kHz
T (K)
E = 1.2 kV/m
κb
Fig. 4.5-87 (CH3)3NCH2COO · CaCl2 · 2H2O. κb ver-sus T
Part4
5.4

Ferroelectrics and Antiferroelectrics 5.4 Physical Properties of 43 Representative Ferroelectrics 933
2
1
0
15
10
5
030 40 50 60 70 80 90 100 110 120 130
E (105 V/m)
P (10–2 C/m2)
T (K)
Ps
Ec
P3
E5 E4
P2
E3, E4
P
E E1, E2
P1
Ps
P3
P2P1
E1
E2
E3E4E5E6
Ec
Fig. 4.5-88 (CH3)3NCH2COO · CaCl2 · 2H2O. Ps, Ec, Pi , and Ei versus T . Definitions of Pi (i = 1, 2, 3) and Ei areshown in the top figure
crystal(κ S
22
)shows no anomaly at the transition tem-
perature (Fig. 4.5-7), while the elastic compliances
104
103
102
10
1
–180 –160 –140 –120 –100 –120 –80 –40 –20 0 20 40 60
T (°C)
f = 1 kHz 900 Hz
κ11T
RS Deuterated RS
Fig. 4.5-89 NaKC4H4O6 · 4H2O (RS) and NaKC4H2D2O6
· 4D2O (deuterated RS). κT11 versus T
exhibit a pronounced anomaly (Fig. 4.5-93). These dataindicate that the ferroelectric phase transition is of theindirect type IIIac triggered by an elastic anomaly (seeSect. 4.5.3). The crystal is piezoelectric in the paraelec-
–30 40–20 –10 0 10 20 30T (°C)
Ps (10–3 C m–2)4
3
2
1
0
RS
Deuterated RS
Fig. 4.5-90 NaKC4H4O6 · 4H2O (RS) and NaKC4H2D2O6
· 4D2O (deuterated RS). Ps versus T
Part4
5.4

934 Part 4
0.07
0.06
0.05
0.04
0.03
0.02
0.01
0–20 –10 0 10 20 30
T (°C)
P 2s (10–4 C2 m–4)
7
6
5
4
3
2
1
0
I (050) (arb. units)
P 2s
I (050)
Fig. 4.5-91 NaKC4H4O6 · 4H2O. I(050) versus T . I(050) isthe integrated intensity of the X-ray (050) reflection, whichshould disappear in the space group P21212 below −18 ◦Cand above 23 ◦C. The solid line is P2
s normalized to fit toI(050)
tric phase and the elastic anomaly causes a dielectricanomaly in the free crystal (κb in Fig. 4.5-92 and κT
22in Fig. 4.5-7), but no dielectric anomaly in the clampedcrystal (κ S
22 in Fig. 4.5-7).
80
160
120
80
40
0280120 160 200 240
T (K)
κb
Fig. 4.5-92 LiNH4C4H4O6 · H2O. κb versus T
14
12
10
8
7
5
320
180
140
200
160
120
80
40
0
15
10
5
075 100 125 150 175 200 225 250
T (K)
Θ
s E44 (10–11 m2 N–1)
s E66 (10–11 m2 N–1)
s E55 (10–11 m2 N–1) (s55 – s (0)
55)–1 (109 N m–2)
s E44
s E66
s E55
II–I
(sE55 – sE
55(0))–1
(sD55 – sD
55(0))–1
Fig. 4.5-93 LiNH4C4H4O6 · H2O. sE44, sE
55, and sE66 ver-
sus T . sE44, sE
55, and sE66 are the shear components of the
elastic compliance tensor at constant electric field. The twostraight lines show
[sE
55 − sE55(0)
]−1and
[sD
55 − sD55(0)
]−1,
where sD55 is s55 at constant electric displacement,
sE55(0) = 18.0 m2 N−1, and sD
55(0) = 17.0 m2 N−1
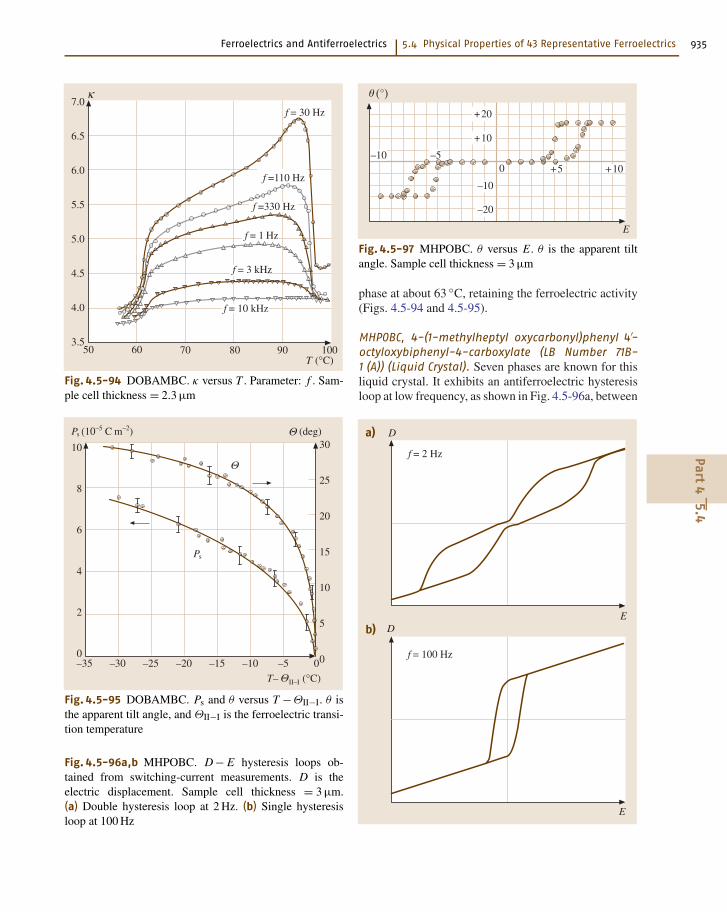
Liquid Crystal FamilyDOBAMBC, p-decyloxybenzylidene p′-amino 2-me-thylbutyl cinnamate (LB Number 71A-1 (A)) (LiquidCrystal). This liquid crystal is ferroelectric in the smec-tic C∗ phase between about 76 and 92 ◦C on heating. Oncooling, the C∗ phase is transformed into a smectic H∗
Part4
5.4
Ferroelectrics and Antiferroelectrics 5.4 Physical Properties of 43 Representative Ferroelectrics 935
7.0
6.5
6.0
5.5
5.0
4.5
4.0
3.550 60 70 80 90 100
T (°C)
f = 30 Hz
κ
f =110 Hz
f =330 Hz
f = 1 Hz
f = 3 kHz
f = 10 kHz
Fig. 4.5-94 DOBAMBC. κ versus T . Parameter: f . Sam-ple cell thickness = 2.3 µm
10
8
6
4
2
0
30
25
20
15
10
5
0–35 –30 –25 –20 –15 –10 –5 0
Ps (10–5 C m–2) Θ (deg)
Θ
Ps
(°C)ΘII–IT–
Fig. 4.5-95 DOBAMBC. Ps and θ versus T −ΘII−I. θ isthe apparent tilt angle, and ΘII−I is the ferroelectric transi-tion temperature
Fig. 4.5-96a,b MHPOBC. D − E hysteresis loops ob-tained from switching-current measurements. D is theelectric displacement. Sample cell thickness = 3 µm.(a) Double hysteresis loop at 2 Hz. (b) Single hysteresisloop at 100 Hz
θ (°)
E
+20
+10
0
–10
–20
–10 –5+5 +10
Fig. 4.5-97 MHPOBC. θ versus E. θ is the apparent tiltangle. Sample cell thickness = 3 µm
phase at about 63 ◦C, retaining the ferroelectric activity(Figs. 4.5-94 and 4.5-95).
MHPOBC, 4-(1-methylheptyl oxycarbonyl)phenyl 4′-octyloxybiphenyl-4-carboxylate (LB Number 71B-1 (A)) (Liquid Crystal). Seven phases are known for thisliquid crystal. It exhibits an antiferroelectric hysteresisloop at low frequency, as shown in Fig. 4.5-96a, between
D
E
a)
b) D
E
f = 2 Hz
f = 100 Hz
Part4
5.4

936 Part 4
100
80
60
40
20
040 60 80 100 120 140
T (°C)
x = 0.59
Ps (10–3 C m–2)
x = 0.65
x = 0.75
Fig. 4.5-98 ((CH2CF2)x(CF2CHF)1−x)n . Ps versus T . Pa-rameter: x. Thickness of specimen film = 50 µm
65 and 119.7 ◦C. The antiferroelectric behavior can bebest demonstrated by measuring the apparent tilt an-gle, as shown in Fig. 4.5-97. The hysteresis loop turnsinto a triple one between 119.7 and 120.6 ◦C, and intoa normal ferroelectric hysteresis loop between 120.6 and122.1 ◦C. The phase exhibiting the triple hysteresis loopis called “ferrielectric” by several authors.
Polymer Family((CH2CF2)x(CF2CHF) 1−x )n,Vinylidene fluoride–trifluoro-ethylene Copolymer, ((VDF)x (TrFE)1−x )n (LB Num-ber 72-2) (Polymer). Random polymers (CH2CF2)x(CF2CHF)1−x exhibit a ferroelectric hysteresis loop for
60
40
20
0
40
20
0–50 0 50 100
T (°C)
κ '
0.59
0.65
0.690.73
x = 1
x = 0
0.13
0.37
0.47
κ '
Fig. 4.5-99 ((CH2CF2)x(CF2CHF)1−x )n . κ′ versus T .Parameter: x. f = 1 kHz. Thickness of specimen film= 50 µm
x > 0.5 (Figs. 4.5-98 and 4.5-99). Ferroelectric activityis preserved up to the melting point for x > 0.8.
References
5.1 Y. Shiozaki, E. Nakamura, T. Mitsui (Eds.): Ferro-electrics and Related Substances: Oxides: Perovskite-Type Oxides and LiNbO3 Family, Landolt–Börnstein,New Series III/36 (Springer, Berlin, Heidelberg2001)
5.2 Y. Shiozaki, E. Nakamura, T. Mitsui (Eds.): Fer-roelectrics and Related Substances: Oxides: OxidesOther Than Perovskite-Type Oxides and LiNbO3 Fam-ily, Landolt–Börnstein, New Series III/36 (Springer,Berlin, Heidelberg 2002)
5.3 Y. Shiozaki, E. Nakamura, T. Mitsui (Eds.): Ferro-electrics and Related Substances: Inorganic CrystalsOther Than Oxides, Landolt–Börnstein, New SeriesIII/36 (Springer, Berlin, Heidelberg 2004)
5.4 Y. Shiozaki, E. Nakamura, T. Mitsui (Eds.): Ferro-electrics and Related Substances: Organic Crystals,Liquid Crystals and Polymers, Landolt–Börnstein,
New Series III/36 (Springer, Berlin, Heidelberg 2005)in preparation
5.5 J. Valasek: Piezoelectric and Allied Phenomena inRochelle Salt, Phys. Rev. 15, 537 (1920)
5.6 J. Valasek: Piezo-Electric and Allied Phenomena inRochelle Salt, Phys. Rev. 17, 475 (1921)
5.7 T. Mitsui, E. Nakamura, I. Tatsuzaki: An Introductionto the Physics of Ferroelectrics (Gordon and Breach,New York 1976)
5.8 F. Jona, G. Shirane: Ferroelectric Crystals (Dover Pub-lications, New York 1993)
5.9 B. A. Strukov, A. P. Levanyuk: Ferroelectric Phenom-ena in Crystals: Physical Foundations (Springer,Berlin, Heidelberg 1998)
5.10 M. E. Lines, A. M. Glass: Principles and Applicationsof Ferroelectrics and Related Materials (Clarendon,Oxford 1979)
Part4
5
Ferroelectrics and Antiferroelectrics References 937
5.11 Y. Xu: Ferroelectric Materials and Their Applications(North-Holland, Amsterdam 1991)
5.12 B. Jaffe, W. R. Cook Jr., H. Jaffe: Piezoelectric Ceram-ics (Academic Press, London 1971)
5.13 J. Zelenka: Piezoelectric Resonators and Their Appli-cations (Elsevier, Amsterdam 1986)
5.14 T. Ikeda: Fundamentals of Piezoelectricity (OxfordUniv. Press, Oxford 1990)
5.15 R. A. Cowley: Structural Phase Transitions (Consul-tant Bureau, New York 1980)
5.16 K. A. Miller, H. Thomas (Eds.): Structural Phase Tran-sitions I, Topics in Current Physics, Vol. 23 (Springer,Berlin, Heidelberg 1981)
5.17 M. Fujimoto: The Physics of Structural Phase Transi-tions (Springer, Berlin, Heidelberg 1997)
5.18 R. Blinc, A. P. Levanyuk (Eds.): IncommensuratePhases in Dielectrics, Modern Problems in Con-densed Matter Science 14 (Elsevier, Amsterdam1986)
5.19 F. J. Scott: Soft-mode spectroscopy: Experimentalstudies of structural phase transitions, Rev. Mod.Phys. 46, 83 (1974)
5.20 G. Shirane: Neutron scattering studies of struc-tural phase transitions, Rev. Mod. Phys. 46, 437(1974)
5.21 C. H. Wang: Raman and Brillouin scattering spec-troscopy of phase transitions in solids. In: Vibra-tional Spectroscopy of Phase Transitions, ed. byZ. Iqbal, F. J. Owens (Academic Press, Orlando 1984)pp. 153–207
5.22 J. M. Herbert: Ceramic Dielectrics and Capacitors,Electrocomp. Sci. Mon., Vol. 6 (Gordon and Breach,New York 1985)
5.23 B. E. Vugmeister, M. D. Glinchuk: Dipole glass andferroelectricity in random-site electric dipole sys-tems, Mod. Phys. 62, 993 (1990)
5.24 L. E. Cross: Relaxor ferroelectrics, Ferroelectrics 76,241 (1987)
5.25 S. Singh: Nonlinear optical materials. In: Handbookof Lasers with Selected Data on Optical Technol-ogy, ed. by R. J. Pressley (The Chemical Rubber Co.,Cleveland 1971) pp. 489–525
5.26 V. G. Dmitriev, G. G. Gurzadyan, D. N. Nikogosyan:Handbook of Nonlinear Optical Crystals, Springer Se-ries in Optical Science, Vol. 64, ed. by A. E. Siegman(Springer, Berlin, Heidelberg 1991)
5.27 P. Yeh: Introduction to Photorefractive NonlinearOptics (Wiley, New York 1993)
5.28 G. Rosenman, A. Skliar, A. Arie: Ferroelectric do-main engineering for quasi-phase-matched non-linear optical devices, Ferroelectr. Rev. 1, 263(1999)
5.29 N. Setter, E. L. Colla: Ferroelectric Ceramics (Birk-häuser, Basel 1993)
5.30 B. A. Tuttle, S. B. Desu, R. Ramesh, T. Shiosaki: Fer-roelectric Thin Films IV (Materials Research Society,Pittsburgh 1995)
5.31 C. P. Araujo, J. F. Scott, G. W. Taylor (Eds.): Ferro-electric Thin Films: Synthesis and Basic Properties(Gordon and Breach, New York 1996)
5.32 R. Ramesh (Ed.): Thin Film Ferroelectric Materialsand Devices, Electronic Materials Science and Tech-nology, Vol. 3 (Kluwer, Dordrecht 1997)
5.33 J. F. Scott: The physics of ferroelectric ceramic thinfilms for memory applications, Ferroelectr. Rev. 1, 1(1998)
5.34 D. Damjanovic: Ferroelectric, dielectric and piezo-electric properties of ferroelectric thin films andceramics, Rep. Prog. Phys. 62, 1267 (1998)
5.35 J. F. Scott: Ferroelectric Memories, Springer Series inAdvanced Microelectronics, Vol. 3 (Springer, Berlin,Heidelberg 2000)
5.36 R. M. White: Surface elastic waves, Proc. IEEE 58, 1238(1970)
5.37 G. W. Farnell, E. L. Adler: Acoustic Wave Propagationin Thin Layers. In: Physical Acoustics, Vol. 9, ed. byW. P. Mason, R. N. Thurston (Academic Press, NewYork 1972) pp. 35–127
5.38 A. A. Oliner (Ed.): Acoustic Surface Waves (Springer,Berlin, Heidelberg 1978)
5.39 K.-Y. Hashimoto: Surface Acoustic Wave Devicesin Telecommunications, Modeling and Simulation(Springer, Berlin, Heidelberg 2000)
5.40 J. M. Herbert: Ferroelectric Transducers and Sensors,Electrocomp. Sci. Mon., Vol. 3 (Gordon and Breach,New York 1982)
5.41 W. H. de Jeu: Physical Properties of Liquid CrystallineMaterials (Gordon and Breach, New York 1980)
5.42 J. W. Goodby, R. Blinc, N. A. Clark, S. T. Lagerwall,M. A. Osipov, S. A. Pikin, T. Sakurai, K. Yoshino,B. Zeks: Ferroelectric Liquid Crystals: Principles,Properties and Applications, Ferroelectrics and Re-lated Phenomena, Vol. 7 (Gordon and Breach, NewYork 1991)
5.43 G. W. Taylor (Ed.): Ferroelectric Liquid Crystals: Prin-ciples, Preparations and Applications (Gordon andBreach, New York 1991)
5.44 L. M. Blinov, V. G. Chigrinov: Electric Effects in Li-quid Crystal Materials (Springer, Berlin, Heidelberg1994)
5.45 A. Fukada, Y. Takanishi, T. Isozaki, K. Ishikawa,H. Takezoe: Antiferroelectric Chiral SmecticLiquid Crystals, J. Mater. Chem. 4, 997 (1994)
5.46 P. J. Collings, J. S. Patel (Eds.): Handbook of Li-quid Crystal Research (Oxford Univ. Press, Oxford1997)
5.47 S. T. Lagerwall: Ferroelectric and Antiferroelectric Li-quid Crystals (Wiley VCH, Weinheim 1999)
5.48 T. Furukawa: Ferroelectric Properties of Vinyli-dene Fluoride Copolymers, Phase Transitions 18, 143(1989)
5.49 D. K. Das-Gupta (Ed.): Ferroelectric Polymer andCeramic-Polymer Composites (Trans Tech Publica-tions, Aedermannsdorf 1994)
Part4
5

938 Part 4
5.50 H. S. Nalva (Ed.): Ferroelectric Polymers: Chemistry,Physics and Applications (Marcel Dekker, New York1995)
5.51 H. Kodama, Y. Takahashi, T. Furukawa: Effects ofAnnealing on the Structure and Switching Charac-teristics of VDF/TrFE Copolymers, Ferroelectrics 205,433 (1997)
5.52 N. A. Clark, S. T. Lagerwall: Submicrosecond BistableElectro-Optic Switching in Liquid Crystals, Appl.Phys. Lett. 36, 899 (1980)
5.53 A. D. L. Chandani, E. Gorecka, Y. Ouchi, H. Takezoe,A. Fukuda: Antiferroelectric Chiral Smectic PhasesResponsible for the Tristable Switching in MHPOBC,Jpn. J. Appl. Phys. 28, L1265 (1989)
Part4
5