spring 2001 keeping pace with our transportation …
TRANSCRIPT

INDIANAPOLIS REGION'SINDIANAPOLIS REGION'S
KEEPING PACE WITH OUR TRANSPORTATION NEEDS
Rideshare/Vanpool Programs Ready. . . . . . . . . . Page 1Airport Deployment Strategies Proposed. . . . . . Page 1Q & A . . . . . . . . . . . . . . . . . . . Page 2MPA MAP . . . . . . . . . . . . . . . . Page 3conNECTions 2001 . . . . . . . . Page 4MPO Profile . . . . . . . . . . . . . Page 5Knozone Prepares For Sixth Year . . . . . . . . . . . . . . Page 7Irons In The Fire. . . . . . . . . Page 9
W ith this issue, teMPO begins itsfifth year of reporting the
details, decisions and directions of theMPO’s regional transportation planningprocess. This publication’s mission hasremained constant since its first issue(Spring, 1997): to encourage informedpublic input and participation by shar-ing information on a variety of trans-portation-relate issues. Always, ourintention has been to translate the jar-gon and procedures of planning so thatthe average reader could get interested,informed and involved. To better meetthis goal in the future, we’re adding afew new features with this issue. Onpage 2, we begin a new column, calledQ & A, in which MPO staff memberswill directly address planning-relatedquestions posed to them at public meet-ings, by phone or via voice- or e-mail.Also in this issue, we present the firstinstallment in an on-going series onalternative modes of transportation gain-
In This Issue
Rideshare/Vanpool Programs Ready
T his is very much a cooperative project, resulting from a variety of past efforts,growing public demand for greater mobility choices, and long anticipated
regional needs,” says Stephanie Belch, MPO Senior Planner, of the new Rideshare andVanpool Programs being developed by the Indianapolis Public TransportationCorporation (IPTC/IndyGo), theIndiana Department of Transportation,and the MPO. “We need to initiatethese programs now to alleviate antic-ipated congestion caused by majorinterstate construction projects occur-ring over the next 10 years,” she explains,“ but the need to reduce single occupant vehi-cle use (SOV) throughout the region has beenlong recognized and well documented.”
Recommendations ReduxOver the last few years, a variety of efforts have
been made to improve regional mobility and offer alternatives
cont on page 3, see Five Years
cont on page 8, see Rideshare/Vanpool
“
S P R I N G 2 0 0 1
V O L U M E F I V E
I S S U E O N E
“
Airport Deployment Strategies Proposed
Our region’s intermodal freight system — the network of trucking routes, raillines and air shipping services that move goods in, around and through the
Indianapolis metropolitan planning area — is key to the present and future health ofour local economy,” asserts Sweson Yang,
MPO Chief Transportation Planner andthe planner-in-charge of the Airport
Deployment Study. “The purpose of theIntermodal Freight System Plan is to
make sure our region is preparedto meet the challenges, and reap
the benefits, of the anticipated growth of American commerce. And the AirportDeployment Study is a crucial part of that plan.”
As previously reported in teMPO (Summer 1997, Summer & Autumn 1998,Autumn 2000), the Intermodal Freight System Plan includes among its goals:
cont on page 14, see Airport Deployment

AQ
P A G E T W O
I n Q & A, members of your MPO staff answer questions posed to them via voicemail, e-mail, snail-mail or in-person. If you would like to submit a question to
Q & A, contact Mike Peoni at 317/327-5133 ([email protected]), fax it to: "Q & A, Attn: Mike Peoni" at 317/327-5103 or attend the monthly meetings of theCitizens Advisory Committee.
I’ve attended MPO meetings, read teMPO and CAC Minutes, andfollowed the regional transportation planning process in the media.But I still don’t understand which committee does what, or who Iwould contact to put in my two cents! What’s the difference betweenthe IRTC, CIRTA, CIRCL, IRTIP and all the other transportation-relat-ed groups I’ve read about? Shouldn’t there be a single contact pointfor all transportation-related issues?
-A frequent question, most recently posed by a reporter
There is, and it’s the MPO, your Metropolitan Planning Organization. The Indianapolis Department of Metropolitan Development (DMD) is the desig-
nated MPO with the responsibility for conducting the transportation planning processfor the Indianapolis Metropolitan Planning Area. The Department delegates this region-al responsibility as the MPO to the MPO transportation planning staff within theDMD-Planning Division to fulfill the MPO function in cooperation with theIndianapolis Regional Transportation Council's Citizens, Technical and Policy commit-tees. The City of Indianapolis participates as a member of these IRTC committees.
As we’ve said many times, the MPO bears the primary responsibility for conduct-ing the regional transportation planning process in a continuing, cooperative, compre-hensive way. These are the 3-C’s, and we live bythem. They, and our responsibility for heading upthis planning process, is mandated by federal law.When it comes to transportation planning, we’reyour best, first contact (317/327-5151) for allquestions and comments. If nothing else, we canpoint you in the right direction for further action.
Your question deserves a more completeanswer, though, because it touches on an issuewe deal with constantly. People often confuseour role and responsibilities with those of ourplanning partners, or even with some of ourplanning documents, as you have.
For the record IRTIP, which you mentionin your question, stands for IndianapolisRegional Transportation Improvement Program.IRTIP is a short-term planning document and represents one of the MPO’s core activi-ties. It is NOT an agency, committee, or any other group of people, but results fromthe planning efforts of the MPO and our planning partners. For a more complete
ACRO-NYMBLE
Here’s a list of the acronyms used inthis issue. Refer to it to keep your
understanding letter-perfect.AICP - American Institute of CertifiedPlanners
AVLS – Automatic Vehicle LocationSystem
CAC - Citizens Advisory Committee
CEC - Corporation for EducationalCommunication
CIRCL - Central Indiana RegionalCitizens League
CIRTA – Central Indiana RegionalTransit Alliance
conNECTions - Study of NorthEastCorridor Transportation
DEIS – Draft Environmental ImpactStatement
DMD - Department of MetropolitanDevelopment
DOT - Department of Transportation
DPW – Department of Public Works
FHWA - Federal HighwayAdministration
FTA - Federal Transit Administration
IIA - Indianapolis International Airport
IDEM - Indiana Department ofEnvironmental Management
INDOT - Indiana Department ofTransportation
IPTC/IndyGo - Indianapolis PublicTransportation Corporation
IRTC - Indianapolis RegionalTransportation Council
IRTIP - Indianapolis RegionalTransportation Improvement Program
ISSC – Indianapolis Senior ServicesCenter
ITS – Intelligent Transportation Systems
MDC – Metropolitan DevelopmentCommission
MIS - Major Investment Study
MPA - Metropolitan Planning Area
MPO - Metropolitan PlanningOrganization
NAFTA – North American Free TradeAgreement
RMTS – Regional Mass Transit Service
SOV – Single Occupant Vehicle
USEPA - United State EnvironmentalProtection Agency
cont on page 13, see Q & A
&
Mike Peoni, AICPMPO Manager/Master Planner
QUESTIONSANSWERS

INDIANAPOLIS METROPOLITAN PLANNING AREA
Boone
Morgan JohnsonShelby
Metropolitan Planning Area (MPA)(Projected Urbanization By The Year 2020)
MPO Modeling Area(Studied Because Of Its Proximity To, And Influence On, MPA Traffic)
Eagle
Pike
Lincoln
Wayne
Buck
Creek
Sugar
Creek
White
River
Warren
Washington
Perry FranklinDecaturGuilford
Lawrence
Delaw
are
Hancock
Washington
Hendricks
Pleasant
Clay
Washington
Center
Hamilton
Marion
Fall
Creek
Note: all roads on bound-ary lines are excludedexcept Marion County’seast and south county lines.
P A G E T H R E E
ing public attention and planning momentum throughout ourregion. The Rideshare and Vanpool Program is the first topiccovered. In addition, we ask for your input on proposedAirport Deployment Plan strategies, profile Senior
Transportation Programs in Marion County, update theconNECTions study of northeast corridor transportation, andmore! So, read on and keep pace with teMPO, now in its fifthyear.
Five years(from page 1)

P A G E F O U R
conNECTions 2001
I t’s been “in the works” for nearly three years; the subject oflocal television, radio, and newspaper coverage; the inspira-
tion of its own web site, toll-free hotline and public forumsand surveys; and, the best hope to-date for solving congestionand lack of mobility in our region’s busiest travel corridor. It is,of course, conNECTions – the study of Northeast Corridortransportation.
teMPO first covered conNECTions with a spe-cial issue in May/June, 1998. Since that time,transportation alternatives intended toincrease mobility and reduce congestionhave been considered and, in some cases,rejected out-of-hand because of highcost or unacceptable impacts to thenatural or human environment.Other potential options weredismissed only after computer-modeled travel simulationsproved them inefficient or inef-fective in addressing theregion’s current and projectedmobility issues. Throughout itall, teMPO has encouraged andfacilitated public involvement inthe study by serving both as 1)an information resource, withdetailed alternative descriptions,progress updates and illustrativemaps; and 2) sounding board,with public questions, suggestionsand criticisms reprinted in full fromthe various other outreach venues.
So, after all this effort andexpense, only one questionremains: Where doesconNECTions stand now?
“I get asked that everyday,” saysMike Peoni, AICP, MPOManager/Master Planner. “Many peo-ple think nothing’s happening withconNECTions because they’re nothearing about it as frequently as theyhave in the past,” Peoni explains.“That’s not the case, though. Rightnow, while our Draft EnvironmentalImpact Statement (DEIS) is beingreviewed by federal agencies, we’re con-serving our resources. Once they’ve
signed off on the document, as they must before we can pro-ceed, we’ll be able to make it public and all the media cover-age will start again.”
The schedule of public involvement for conNECTions’Draft Environmental Impact Statement was included in theSpecial Edition and Summer 2000 issue of teMPO.Subsequently, it was reported that the DEIS would be madeavailable for public review and comment in January, 2001, following review by the Federal Highway Administration(FWHA), the Federal Transit Administration (FTA) and theU.S. Environmental Protection Agency (EPA) (Autumn 2000teMPO) who received the document in November, 2000.
“That didn’t happen because the review is still underway,”Peoni notes. “That doesn’t mean there’s a problem with
anything the DEIS contains, only that the review is takinglonger than any of us expected.”
This delay will in no way shorten the publicreview and comment period. Area residents will
still have 45-days during which a PublicHearing on conNECTions’ DEIS will be held.
Following this process, all input and recommendations will be forwarded to
the study’s Policy Steering Committeefor consideration. “The public review
and comment period will prob-ably take place sometime thissummer,” Peoni estimates.“We’d all like to expedite thisprocess but, in so doing, we
can’t jeopardize its validity. ThePolicy Steering Committee willaddress the issue only when we’reall convinced of the soundness ofour findings.”
In an effort to keep the publicappraised, Peoni reported onconNECTions’ status at the Januarymeeting of the Citizens AdvisoryCommittee. There meeting atten-dees encouraged the MPO tomake the “ground rules” of reviewand comment known prior to thePublic Forum. They also suggest-ed ways in which the issuescould be presented to encourageinformed public participation,including:
• post study recommenda-tions in high-traffic areas, such asshopping malls and other public
“
cont on page 6, see conNECTions 2001

P A G E F I V E
cont on page 20, see MPO Profile
MPO Profile
Harry Fox, DirectorSenior TransportationPrograms
Meet Harry Fox, a transportationprofessional who is in it “for the
long haul”. Since1988, Harry has servedas Director of The Senior TransportationProgram – a CICOA (Area 8 Agency onAging)-funded initiative housed out ofthe Indianapolis Senior Services Center(ISSC). In this role, Harry writes grants,trains volunteers, administrates pro-grams and has even traveled to ournation’s capital to share his professionalinsights with transportation providers.The reason? “That’s simple,” he says,“Our only reason for doing what we dois to help keep people mobile, indepen-dent and involved.”
The Senior TransportationProgram started in 1978 at CICOAand has been sponsored since 1988 bythe ISSC whose 501 C3 status enabledfederal and state funding. Today, theprogram serves over 2000 clients andmakes between 43,000 – 44,000 passen-ger trips a year! The average client isfemale (80%), 75 or older, and livesalone. However, clients vary widely bydescription, situation and need. “Almosthalf of the people we serve belong to aminority,” Fox points out. “More thanhalf (60%) are at or below 150% of the
poverty level. And, a quarter of them are85 or older! The one thing all of ourclients have in common is that they havetrouble getting around. That’s where TheSenior Transportation Program comes in,offering four different types of service tomeet different mobility needs.”
These services include:
Taxi Discount ServiceStarted in 1978, this program
offers clients the psychological benefit ofknowing they’ll be able to travel my taxiwhenever necessary. It is a 24 hour,seven day a week service that uses dis-count coupons to expand client mobilityoptions. People can apply for the serviceby mail, or come to a taxis distributionsite or The Senior TransportationProgram office to get discount coupons($30 coupon maximum, per month).“It’s all about peace-of-mind,” Fox says.“If people don’t use their coupons, we’lleven refund their contribution. It’simportant that they have them on-hand,though, just in case.” Lastyear, $120,000 worth oftaxi discountcoupons wereredeemed.
Wheelchair TransportationThis 24/7 service, started in 1980,
is among the program’s most needed andover-taxed. “Unlike other Open Doortransportation programs, we offer“through the door” service,” says Fox.That means that our clients are helped
in and out of their homes, saving themthe discomfort of waiting outside for aride.” Most other wheelchair transportprograms are “to the curb” service.Maybe for this reason, demand farexceeds the program’s ability to providethis service. “We have a waiting list of40 people right now, and we’re alwaysunder-funded in this area,” notes Fox.“We could use another $80,000 rightnow to help the people who need us.”In 2000, Wheelchair Transportationtrips totaled more than 3,300.
Volunteer Medical TransportationAvailable during normal business
hours (8 AM – 5 PM, weekdays), thisservice is intended specifically for peoplewho have no other way to get to theirdoctor appointment. Volunteer driverspick up the client, bring them to thedoctor’s office and are then able to goabout their own business. Because of avoice pager provided by the program,
volunteers can be noti-
fied when theclient is ready to be
returned home. They don’tneed to wait around. In 1990, Fox
presented the specifics of this programwhich he introduced to the NationalCouncil on Aging in Washington D.C.“It sounds so simple, but making thiskind of service more responsive andconvenient helps it succeed,” heexplains. “It encourages both client com-fort and volunteer enthusiasm.”Approximately 5,000 Volunteer Medicaltrips were made last year.

P A G E S I X
locations• make the DEIS Executive Summary available on the
conNECTions web site (www.indygov.org/connections)• arrange a televised “public forum” with one of the local
TV stations,• present to neighborhood associations throughout the
corridor • continue to promote the topic to
the media• prepare area
residents for informedparticipation by distrib-uting the most recentconNECTions SpecialReport (May/June 2000teMPO) via direct mail orneighborhood associations.
Peoni assured thegroup that the MPO wouldimplement as many of the sug-gestions as possible, as well ascontinue its traditional effort ofmaking the DEIS document avail-able for review at public librariesand government offices throughoutthe region. In addition, the MPO willpromote public awareness andinvolvement in the review/commentperiod, and attendance of the publichearing, through display and classi-fied advertising in The IndianapolisStar and The Indianapolis Recorder. “Noone is more eager than I am to haveconNECTions’ public review period begin,” says Peoni. “Thestudy’s goal has always been to arrive at a locally preferred, fis-cally responsible solution. That’s only possible with the activeinvolvement of the public and elected officials.”
On the RightTrack
So, withconNECTionsDEIS still in fed-eral review, manymay wonder whythe three Co-chairs ofconNECTions’Policy SteeringCommittee are
now publicly endorsing the idea of a rail line to the airportbefore rail transit in the Northeast Corridor. As reported in theMarch 3 Indianapolis Star, Indianapolis Mayor Bart Peterson,State Senator Lukle Kenley (R-Noblesville) and INDOTCommissioner Cristine Klika say they are coming to believethat Indianapolis should begin light rail transit service with a
line from Downtown to IndianapolisInternational Airport, rather than from
Noblesville to Downtown as conNECTions’alternatives RB-1 and RB-4 propose. “Nodecisions have been made, but I thinkthere is a developing consensus that (anairport line) needs to be an importantpart of the (rail) discussion,” MayorPeterson is quoted as saying.
The paper further reports thatkey local officials believe it (light rail
to the airport) is vital togenerating thepublic supportand federal dollarsneeded to build aregional system.
Even SenatorKenley, whose dis-
trict in the northeastcorridor where traffic
problems first triggeredtalk of commuter train
service, is quoted as say-ing that light rail won’t
get off the drawing boardwithout the airport connec-
tion. INDOT CommissionerKlika agrees, but warns that
this late change of heart forthe Co-chairs could compli-
cate or delay an application forfederal approval unless local officials proceed cautiously.
“Certainly, nothing would ever be done without sufficientstudy and opportunity for public input,” Peoni notes. “Lightrail to the airport is a popular idea that we’ve heard suggestedmany times and have examined in concept. Unfortunately, theleg from downtown to the airport doesn’t lie within the corri-dor we were federally funded to study, so we haven’t yet beenable to evaluate this option. When we are, the public will be apart of it. Until then,” he assures,” the public will have theopportunity to review and comment on the alternatives thathave been studied.”
For more information on conNECTions current status, oron the possibility of rail transit to the airport, contact MikePeoni at 317/327-5133 or [email protected].
teMPO is published quarterly by your Metropolitan Planning Organization, part of the Department of Metropolitan Development. If you knowof anyone who would like to receive teMPO, or if youhave any questions concerning its publication, please call:
Mike Peoni at 327-5133Department of Metropolitan DevelopmentMetropolitan Planning Organization1841 City-County Building200 East Washington StreetIndianapolis, IN 46204teMPO was written and prepared for publication byWhitman Communications, Inc.
conNECTions 2001(from page 4)

Knozone Prepares
for Sixth Year
T he 2001 Ozone AwarenessCampaign will kick off its season
of helping to educate area residentsabout the regional ozone problem, andways to help solve it, this May. Ozone— a colorless pollutant formed whenthe emissions of vehicles, lawnmowersand industry react in the air around us— forms only in the presence of sun-light, especially during hot weather.High concentrations of ozone pollutionare more likely to develop as temper-atures rise in the late spring andsummer, presenting a seri-ous health risk for individ-uals with respiratory prob-lems. For this reason, theOzone Awareness Programis active only from Maythrough September.
“This is our sixthyear of using the KNO-ZONE campaign to battleour region’s ozone pollu-tion problem,” says KevinMayfield, MPO Planner.“Independent research,conducted late last year,tells us it’s a battle thatwe’re making progress onthrough increased publicawareness and voluntarycooperation.”
Research conductedin 1998 by the OpinionLaboratory at IndianaUniversity-PurdueUniversity at Indianapolis(IUPUI) documented a sig-nificant increase in 1) thepublic awareness of theozone problem, 2) the per-centage of Marion Countyresidents familiar with Nozone ActionDays — days in which special voluntarymeasures are recommended to reducethe formation of ozone pollutionthroughout the region (see adjacent
box), 3) the percentage of the publicwho took at least one voluntary step toreduce ozone pollution, and 4) thenumber of respondents who recognizedthat individual sources, such as automo-
biles and smallengines, are a major
contributor of ozonepollution.
Last year, an independent researchfirm was hired to conduct a telephonesurvey among the general public. Theobjectives of the survey were to 1) trackawareness of Knozone advertising, 2)
track behavioral changes among arearesidents, and 3) evaluate the program’seffect on area commuters.
Significant survey findingsinclude:
• Citizens are gradually beginningto understand that they share responsi-bility for ozone problems. Previously,they were slightly more likely to blameindustry.
• Awareness of Nozone ActionDays increased 8% over last year.
• Responsiveness to NozoneAction Days increased 2% for Marion
County but decreased 15% amongcommuters who drivemore than 50 miles aweek in Marion County.
• Postponing lawn mowing and gaspurchase/usage were themost frequently changedbehaviors.
• TV promotionranks the highest in recall,followed by radio, paintedbuses and newspaper.
“For the first time,the IndianapolisDepartment of PublicWorks (DPW) will con-duct the campaign, withsupport from the MPO, tobetter reflect the program’simplementing nature,”Mayfield said, noting thatthe DPW is an imple-menting agency while theMPO is a planning agency.“However, we expect tosee program componentsthat proved effective inthe past to be updatedand used again.” Suchcomponents couldinclude:
- an interactive school kit, whichis very popular with school systems insurrounding Metro area counties. In
cont on page 18, see Knozone
P A G E S E V E N
NOZONE Action Day Activities As in past years, the NOZONE symbol will appear on
TV and in the newspaper this spring and summer to indi-cate a NOZONE Action Day — days in which special vol-untary measures are recommended to reduce the forma-tion of ozone pollution. Those wishing to help reduce thepossibility of ozone pollution can do so by . . .
• filling gas tanks after 6 pm
• mowing lawns after 6 pm
• choosing in-store service rather than drive -thru lanes
• carpooling and/or combining errands to reduce car trips
• keeping cars tuned
• making short trips by bike or on-foot
• riding the bus, and enjoying Nozone Action Day discountedfares
• using water-based, rather than oil-based, paints and sol-vents
• avoiding the use of aerosolsFor bus route information, call IndyGo at 635-3344.
For information on carpooling, call the Indianapolis Rideshare Program at 327-RIDE.

P A G E E I G H Tcont on page 10, see Rideshare/Vanpool
to SOV use. One very public effort isconNECTions – the study of NortheastCorridor Transportation. This MajorInvestment Study (MIS) and DraftEnvironmental Impact Statement(DEIS), which began in 1998, is devel-oping locally preferred alternatives tothe traffic congestion and lack-of-mobilitythat currently plague our region’sbusiest travel corridor, which stretchesfrom Noblesville to downtownIndianapolis. The eight alternatives stillunder consideration include highway,bus and rail/bus transit options. Thepublic, through a variety of outreach
initiativesincluding
meetings, newscoverage, web sites, toll-free numbersand surveys, have indicated that theybelieve improving transit options andpersonal mobility is critical to both theirindividual futures and to that of theregion. Through the outreach initiativesof this study, many people have recog-nized that we can no longer continue tobuild ourselves out of congestion.
Another initiative, completed in
1999, is The Regional Mass TransitService (RMTS) Plan (Winter 1998teMPO) which spells out a variety oftransit solutions for the nine-countyregion. One of those proposed solu-tions is a Vanpool Program for CentralIndiana. The Central Indiana RegionalTransit Alliance (CIRTA), in conjunctionwith the Indianapolis MPO, is currentlyworking on a document that describesin detail how a Vanpool Program couldwork in the region.
In addition IPTC/IndyGo, thepublic transit provider inIndianapolis/Marion County, finalizedits 5-Year Implementation Plan last year(Winter 1999 and Autumn 2000teMPO). IndyGo’s plan emphasizes the
need to address regional mobility, notjust by providing conventional publictransit service, but also by offering avariety of options, including ridesharematching services, and car and vanpools. Significant recommendedimprovements in the first year ofIndyGo’s plan include 1) enhancingtransit routes, 2) implementing anAutomatic Vehicle Location (AVL)System, 3) expanding image develop-
ment programs, and 4) enhancing itsbus shelter program But like the RMTSPlan, many of these activities do nothave a dedicated funding source.
It is also important to note thatIndianapolis Mayor Bart Peterson is anavid supporter of improving publictransportation in Marion County. His“Peterson Plan”, first posted on theinternet during the 1999 mayoral cam-paign, includes among its recommendedtransportation initiatives, establishingvanpool programs, improving publictransportation routes, and working withthe business community to createemployee incentives for public trans-portation use.
In addition to these traditionaland/or governmental transportationorganizations, a couple of different
groups have formed in the region toaddress the limited mobility
options available to area residents.One such group that has beenactively involved in identifyingsolutions is the Central IndianaRegional Citizens League(CIRCL), which made quality-of-life issues in CentralIndiana, as impacted by cur-rent and future traffic conges-tion and vehicle-base pollu-tion, the subject of its CentralIndiana Transportation andLand Use Vision Plan. Thisplan, under the direction ofCIRCL’s 60-member steering
committee and input frommore than 20 months of citizensforums, investigated cost-effective, environmentally-sound land use andtransportation strategies for possibleincorporation into local and region-wideplanning. For more information on theVision Pan, or to request your own free,interactive CD-ROM, call CIRCL, toll-free, at 877-55-CIRCL.
“The reasons that justified thesepast recommendations still exist,” pointsout Elizabeth Johnson,Intergovernmental Relations Manager of
Rideshare/Vanpool(from page 1)

P A G E N I N E
Irons In The Fire
Special Neighborhood StudyThis study, intended to evaluate ways of improving the
livability of existing neighborhoods by considering the costsand benefits of retrofitting them with sidewalks, bicycle pathsand transit facilities, has progressed to the assessment phase.Since January, oversight committees have been selected andhave met twice to assess existing characteristics of theGlendale neighborhood as a first step to developing a list ofpreferred improvement projects. “Although Glendale waschosen for the study, we’re focussing on improvement recom-
mendations that could be utilized in all establishedneighborhoods,” says Stephanie Belch,
MPO Senior Planner and planner-in-charge of the study which is scheduledfor completion by year’s end. For more
information, contact her at317/327-5136 [email protected] or watch
for an in-depth articleon this study in the
next issue ofteMPO, due May 25th.
CensusImpacts
About ayear ago, every
household received a Censusform on or before March 31st.Five-sixths of all householdsreceived the short form, con-sisting of seven basic ques-tions. The remaining one-sixth of households, selectedat random, received the 53-
question long form, whichdealt with a greater variety ofrequested information, includ-ing transportation-related top-ics. Responses were due backby April 17th, 2000. Thosewho didn’t respond, receivedan in-person visit from aCensus Enumerator – all inthe interest of getting anaccurate count.
“Accuracy is crucial to the many planning efforts thatdepend on Census data,” says Andy Swenson, PrincipalPlanner - Information Resources and Policy Analysis withthe City of Indianapolis who served as primary liaison to theU.S. Bureau of the Census. “And Census 2000 has been ourmost accurate count ever.”
One such planning effort concerns redistricting. OnMarch 9,2001, the Census Bureau released redistricting datafor Indiana. This set of data, which provides total populationand voting age population (18 and up) by race and Hispanicethnicity, offers some surprising initial findings.
In 1999, the Census Bureau had estimated MarionCounty’s population at 810,000. The Census 2000 popula-tion count for Marion County was 860,454, an increase of7.94 percent over Census 1990 figures. In addition, theHispanic population has risen to an unexpected degree, from8,450 in 1990 to 33,290 in 2000. That’s an increase of 294%,meaning that there were 4 times as many Marion County residents who identified themselves as Hispanic in 2000 asthere were in 1990! The chart below shows total populationtrends in Marion County by township.
TOWNSHIP POP 1990 POP 2001 Change % Change
CENTER 182,140 167,055 -15,085 -8.28
DECATUR 21,092 24,726 3,634 17.23
FRANKLIN 21,458 32,080 10,622 49.50
LAWRENCE 94,548 111,961 17,413 18.42
PERRY 85,060 92,838 7,778 9.14
PIKE 45,204 71,465 26,261 58.09
WARREN 87,989 93,941 5,952 6.76
WASHINGTON 133,969 132,927 -1,042 -0.78
WAYNE 125,699 133,461 7,762 6.18
797,159 860,454 63,295 7.94
“We rely on basic Census population data to address cur-rent, and anticipate future, needs,” says Sweson Yang, AICP,MPO Chief Transportation Planner. “We use this data to securefederal appropriations, allocate transportation investments,develop accurate travel forecasts, and calibrate transportationsimulation models, like the one used in conNECTions.”
Additional housing data will be released in May, 2001and will be reported in future issues of teMPO. The release oftravel-specific data is anticipated in mid-2002. For moreinformation on Census 2000, or its impacts on our regionaltransportation process, contact Andy Swenson at 317/327-5132 ([email protected]) or Sweson Yang at317/327-5137 ([email protected]).
IndyGo. “And now, there’s even more evidence that we need todevelop transportation strategies to counteract new causes ofcongestion including dramatic population growth andINDOT’s scheduled construction along I-465, I-70 and I-65(Editor’s Note: The region’s interstate highways account foronly 3% of our transportation system’s roadway surface, butcarry approximately 40% of area traffic. Any reduction in theirservice capacity dramatically impacts the area’s traffic flow.).
Program Reasons, and Congestion, MountIn addition to the decade of congestion-inducing
construction projectsplanned along someof the area’s busiestinterstates, current airquality is an issue.According to ClearAir Act 9 (see relatedstory, page 7),Indianapolis/MarionCounty is designatedas a “maintenancearea” for the ozonepollution. It is antici-pated by area plan-ners that Madison,Hamilton, Hancock,Johnson and MorganCounties will soon share this designation. Reducing singleoccupant vehicle (SOV) trips would help reduce the region’slong-term congestion problem, as well as minimize the short-term congestion increases anticipated during interstate con-struction. In addition, Rideshare and Vanpool Programs wouldalso address present and future concerns regarding air quality.
Though compelling, the “negatives” of pollution andconstruction interruptions aren’t the best reasons to considersharing the ride. That honor belongs to a “positive”: growth.
The Indianapolis region is experiencing impressive pop-ulation growth, which in turn has increased the number ofvehicle miles traveled by commuters. Specifically, four coun-ties surrounding Marion County have experienced high ratesof population growth since the 1990 Census; this includesHamilton County, which has been the fastest growing countyin the 5-state region (Indiana, Illinois, Michigan, Ohio andKentucky), and the 27th fastest in the nation. The followingtable shows the growth rates of 4 counties in the Indianapolisregion as of July 1, 1999 (Source: Indiana Business ResearchCenter).
County Population Growth
Hamilton 58%
Hendricks 30.5%
Johnson 27.9%
Hancock 22%
Another important measure to consider is the number ofwork trips that originate outside of Marion County. The fol-lowing table shows the percentage of the workforce from eachof the nine counties that make up the IndianapolisMetropolitan Planning Area (MPA)that works outside its coun-ties of residence. The Percent of Workforce working in
MarionCounty (2ndcolumn) istaken from theRegional MassTransit ServicePlan (source:1990 Censusand ParsonsBrinckerhoff).Similar to thatdemographicis the percent-age of theworkforce thatworks outsideits county of
residence (not necessarily Marion County) and is shown in the3rd column.
County Percent of Workforce Percent of Workforceworking in working outside
Marion County County of Residence Boone 39% 54%
Hamilton 46% 55% Madison 10% 23% Hancock 53% 63% Shelby 27% 39%
Johnson 50% 56% Morgan 45% 58%
Hendricks 57% 64% Marion 73% 8%
(Source: 1990 Census)
“These numbers show that opportunities exist to targetcommuters and employers outside of Marion County to jumpstart effective Ridesharing and Vanpooling Programs,” Belch says.
Program SpecificsSimply stated, the purpose of the program is to promote
mobility options, reduce congestion, and reduce mobile source
P A G E T E N
Rideshare/Vanpool(from page 8)
cont on page 11, see Rideshare/Vanpool

P A G E E L E V E N
emissions in the Central Indiana region. IPTC/IndyGo, INDOTand the MPO, along with its various transportation planningpartners, are working together to achieve what many plans,
studies, and public commentshave indicated in the last
few years; That traveldemand strategies
must be devel-oped toaddress ourtransportationproblems.
Thiseffort, fundedthrough theCongestion
Mitigation/AirQuality program,
consists of establishingRideshare and Vanpool
Programs that will be man-aged by IPTC/IndyGo. Program components will include 1)new computer ride-matching software, 2) a guaranteed ridehome program (often seen as a barrier to successful rideshareprograms), 3) a vanpool program, and 4) a marketing cam-paign. Capital funding (purchase of 15-passenger vans) for aVanpool Program will complement the Rideshare Program.Vanpools can be formed from the enhanced RideshareProgram, from special marketing to employers and/or trans-portation corridors (such as I-69 to downtown Indianapolis),and from existing programs like the recently establishedIndiana Government Center Employee’s Carpooling Program.
“These programs are intended to build the “infrastruc-ture” for a longer term Travel Demand Management strategy,”Johnson explains. “With a strong marketing campaign andrideshare database in place, other facilities such as park andride lots and express transit routes can be added to what thisprogram creates.” It should also be noted that INDOT hasformed an Oversight Committee, Chaired by INDOT’s Chief ofEnvironment, Planning and Engineering Division JaniceOsadczuk, to meet regularly during the upcoming major inter-state construction projects. This Committee will includeINDOT, IndyGo, and MPO personnel and will attempt toanticipate and mitigate the traffic congestion caused by laneclosures on specific construction corridors.
The programs, as described, have been approved forfunding for three years to determine if they are effective inalleviating congestion, reducing ozone pollutants and improv-ing mobility. Proposed first year costs are as follows:
Rideshare Data Base Development $40,000 Vehicle (van) purchase/lease $150,000Development/Implementation of Guaranteed Ride Home Program $50,000 Promotional activities/materials $200,000 Web site creation/maintenance $15,000 Contract for annual evaluation of program performance $50,000 Project Management $75,000 Overhead/Administrative Costs $45,000 Total Estimated First Year Costs $625,000
• The Guaranteed Ride Home Program will be put intoplace to assure that participants in the Transportation DemandManagement Program will have a ride home in emergency sit-uations.
• The contract for an annual evaluation of the program(as described above) will be awarded to an independent orga-nization that will perform an objective evaluation of the pro-gram based on criteria that will be developed by a local over-sight committee.
Second year costs include all first year costs, plus:
Annual Operating Expense $645,000(assumes 3% increase over first year) Additional Vehicle (van) purchase/lease $150,000 Advanced Promotions $400,000(TV commercials) Develop/Implement ITS applications $55,000 Total Estimated Second Year Costs $981,000*
*Total reflects adjustment in INDOT’s share of funding from $2.3 million to
$1.75 million. (Line items do not total $981,000)
Rideshare/Vanpool(from page 10)
cont on page 12, see Rideshare/Vanpool

P A G E T W E L V E
• ITS applications refer to a statewide initiative that iscurrently underway to develop an architecture for the wide-spread deployment of transportation monitoring and enhance-ment technology. There are a number of potential applicationsfor the Transportation Demand Management Program that canbe developed and implemented to enhance the programs’overall effectiveness.
• Advanced Promotions (TV Commercials) will build onYear 1’s accomplishments by reaching a much wider audiencethrough television. A marketing tool that could be used is theconstruction along the I-465 and I-70 corridor scheduled tobegin this spring: by Year 2, the region will have felt the affectof the construction on their commutes and other trips, andmay be more willing to look at alternatives to their SOV. Thiswould help INDOT from a public relations perspective as wellas signal to our planning partners (especially the federal gov-ernment) that the state DOT is looking at alternatives to tradi-tional highway travel.
Third year costs include all second year costs, plus:
Annual Operating Expense $1,288,000(assumes 3% increase over second year) Additional Staff $90,000 Additional Vehicle (van) purchase/lease $197,000Additional Advanced Promotions $300,000 Total Estimated Third Year Costs $1,456,500*
*Total reflects adjustment in INDOT’s share of funding from$2.3 million to $1.75 million. (Line items do not total $1,456,500)
• It is assumed that, by the third year of the program, itwill have grown to a size that will warrant additional staff.
Overall program costs for the three-year period are:
Year Total Cost CMAQ CMAQ Local Match (State) (MPO) (IPTC)
2001 $625,000 $0 $500,000 $125,000 2002 $981,000 $684,800 $100,000 $196,200 2003 $1,456,500 $1,065,200 $100,000 $291,300 Total $3,062,500 $1,750,000 $700,000 $612,500
“When you consider how many regional needs Rideshareand Vanpool Programs address, and how many independentsources have recommended their development, I don’t thinkthe legitimacy of this investment can be questioned,” Johnsonsays. “They address long term air quality and mobility issuesfor our region and give us maximum ‘bang for our buck’.”Belch agrees. “This has made a lot of sense to a lot of peoplefor a long time,” she notes. “When INDOT’s repaving projectsbegin, people will wonder why we didn’t institute this pro-gram years ago.”
For more information on the Rideshare and Vanpoolprogram, contact Stephanie Belch at 317/327-5136([email protected]) or Elizabeth Johnson of IPTC/IndyGo at317/614-9216 ([email protected]).
Rideshare/Vanpool(from page 11)

description of the IRTIP, see the Winter 2000 teMPO.The other acronyms you list are some of the plan-
ning partners with whom we work. Most of these,including INDOT, DCAM, DPW, are implementingagencies and are, in this way, distinguishable from theMPO. Others include the City of Carmel, the HamiltonCounty Highway Department and IPTC/IndyGo. Again,we’re a planning agency, representing the transportationinterests of the entire region. Most of our planning part-ners are implementing agencies, representing the interestsof their own jurisdiction. Working with them, we planregional transportation system improvements. As imple-menting agencies, they implement improvements that aresupported by the Indianapolis Regional TransportationPlan and programmed for use of federal funds in theIndianapolis Regional Transportation ImprovementProgram (IRTIP).
Another distinction that can be made among com-mittees is their role in the transportation planningprocess. For example, the Indianapolis RegionalTransportation Council (IRTC) is a NOT an implement-ing agency, but is very active in the planning process. Infact, the IRTC, consisting of a Policy (elected officials)and Technical committee (engineers & planners) arereally the decision-makers of the process, not the MPO.Our job is to provide them with enough appropriateinformation upon which to base their decisions, includ-ing our recommendation and public input from theCitizens Advisory Committee (CAC) meetings.
The IRTC considers all input and decides whetheror not to endorse the MPO’s recommendation. It thenpasses its decision on to the Metropolitan DevelopmentCommission (MDC) for final approval. To date, theMDC has never contradicted the IRTC.
Other groups you mention may not have officialplanning, decision-making or implementing status with-in the transportation planning process, but can still bevalued among the MPO’s planning partners. Theseinclude not-for-profit organizations, such as the CentralIndiana Regional Citizens League (CIRCL) with whomthe MPO has collaborated on several initiatives includinglast year’s Regional Transportation Public Forum and theRegional Planning Guide currently in the works; and theCentral Indiana Regional Transit Alliance (CIRTA) whichconducted the recent Mass Transit Service Study andupon which the MPO sits.
I know it can be confusing, but use the decision-making chart shown here to help keep it all straight.And, remember, your first, best contact for transporta-tion-planning related issues is the MPO.
MPO TRANSPORTATION PLANNING
DECISION-MAKING PROCESSThe
Indianapolis MetropolitanPlanning Organization (MPO)
TheIndianapolis MetropolitanDevelopment Commission
Indianapolis RegionalTransportation Council (IRTC)
• Policy Committeeconsisting of elected officials andrepresentatives of public agencies
The IRTC includes LocalGovernments, such as:
• Town of Avon• City of Beech Grove• Town of Brownsburg
• City of Carmel• Town of Cumberland
• Town of Fishers• City of Greenwood• City of Indianapolis
• City of Lawrence• Town of New Whiteland
• Town of Plainfield• City of Southport• Town of Speedway• Town of Westfield• Town of Whiteland• Town of Zionsville
• Boone County• Hamilton County• Hancock County
• Hendricks County• Johnson County
& Public Agencies, including:• Federal Highway Administration
• Federal Transit Administration
• U. S. Environmental ProtectionAgency
• Indiana Department ofEnvironmental Management
• Indiana Department ofTransportation
• Indianapolis Department ofPublic Works
• Indianapolis Airport Authority
• Indianapolis Public TransportationCorporation/IndyGo
Indianapolis RegionalTransportation Council (IRTC)
• Technical Committeeconsisting of planners and engineers
who provide inter-agencycoordination
Citizens Advisory Committee
• Appointed Area Representatives• Appointed Special Interest
Representatives
MPO Staff
• Transportation Manager/ MasterPlanner
• Chief Planner• Principal Planner
• Senior Planner• Senior Planner
• Planner
Q & A(from page 2)
PAGE THIRTEEN

PAGE FOURTEEN
- to recommend improvements tothe freight transportation system thatwill make Indianapolis businesses morecompetitive in global markets;
- to suggest a priority list of pro-jects for inclusion or rescheduling in theIndianapolis TransportationImprovement Program (IRTIP) andRegional Transportation Plan; and,
- to identify steps to establish aneffective intermodal freight planningprocess.
To achieve these goals, in 1998the plan recommended focusing on theunique concentration of resources in thevicinity of the Indianapolis InternationalAirport and the CSX Avon Yard to fur-ther define the area’s implementationstrategies. The Airport DeploymentStudy is a follow-up to the original planstudy and helps to better define oppor-tunities for increasing the region’sfreight handling capabilities and increas-ing capacities around the airport.
“Though the airport vicinity is
only part of our freight handling system,it is unique among intermodal trans-portation development areas,” Yangexplains. “The area employs more than10,000 and is one of the IndianapolisMPA’s largest employment centers.”
Between 1990 and 1997, morethan 5,000 jobs were created and morethan $1.4 billion was invested in newbusiness in the airport vicinity. Over thenext 20 years, it is estimated that nearly$2 billion in public and private invest-ments will be made at the airport andits surrounding vicinity, generatingapproximately 16,000 more jobs.
In addition,
the airport vicinity encompassesone of the largest rail classification yardsbetween St. Louis/Chicago and the eastcoast, one of the largest package freightairport hubs in the U. S. and the junc-tion of several major interstate high-ways, including I-70, I-65, I-74, and I-69. These facilities, together with majorfreight transportation providers includ-ing Federal Express, CSX Railroad andmultiple large trucking and warehousedistribution activities, make this area akey location for logistics-dependentbusinesses wanting to reach regional,national and international markets.
For these reasons, the Airport
Development Area was named a “freightpriority Zone” and was recommendedfor several high-priority improvementprojects, including the improvement ofSix Points Road from the new inter-change north of I-74, and the realign-ment/widening of I-70 from Six PointsRoad to the I-465 interchange in a waythat permits airport taxi aprons to theairport property south of I-70 – animportant consideration in the proposedFederal Express facility expansion. Also,for these reasons, the IntermodalFreight System Plan recommendedundertaking the Airport Deployment
Study to:• promote the
Indianapolis Airportarea as an inter-modal transportationdistrict with value-added services andworld-class infra-structure
• prepare inter-modal freight trans-
portation strategiesfor the airport area
that 1) prioritizeinfrastructure
projects forfunding andimprovementand 2)define com-
plementaryIntelligent Transportation
Systems (ITS) and transportation man-agement initiatives, and…
• coordinate airport-area invest-ment among public and private stake-holders.
“The study team assessed currentconditions and found that the shippingresources in the IndianapolisInternational Airport and CSX-AvonYard vicinity are extensive,” Yang noted.“However, there are growing congestionand access problems. The team’s assess-ment was followed with the develop-ment of a list of improvement alterna-
Airport Deployment(from page 1)
cont on page 16, see Airport Deployment

P A G E F I F T E E N
The Airport Deployment Study team used the following key freight and logistical trend information todevelopment its list of preferred strategies: From national to global markets
Increasing domestic, NAFTA and global trade, the out-sourcing of shipping services for comparative economicadvantage and the emergence of global trade blocsand city-state trade areas all suggest that therewill be an increased need for shipping servicesin the region’s future. These trends suggest anincrease in freight traffic and congestion alongtrade corridors and at ports, airports and bor-der crossings. Also, there are like-ly to be changes in the loca-tion of high volume lanesand economies of scalefor freight carriers, aswell as greaterdemand for global
trade infra- and info-structure. So,Indianapolis is wellpositioned to grow as amajor interior “passthrough” city.From a manufacturing to aservice economy
Manufacturing employment is declining,while production is on the rise. Employmentgrowth is seen in service, information and high-tech industries, including e-commerce and e-business. These trends suggest there will be moresmall shipments of light, high-value freight mov-ing longer distances in the future. There will begreater demand for shipping reliability and speedand for package and air freight services. Carrier consolida-tion may also be required to drive down the cost of operat-ing high-value transport services. From “push” to “pull” logistics systems
Here there is a customer-driven shift toward special-ized products and services, manufacture-to-order goods and
time-definite delivery. This means that, in the future, manu-facturers will operate with lower inventory levels and lessslack production capacity, creating greater dependence ontransport services. Also, there will need to be closer integra-tion and coordination of shippers’ and carriers’ operationsand greater demand for reliable, flexible, responsive and
economical door-to-door freight services.From modal fragmentation to cross-modalcoordination
The trend here is toward increasing cross-modal coordination for door-to-door service. Forthe freight shipping industry, this means better
and more complex freight services will rely onthe rapid development and
adoption of emerging tech-nologies to trace ship-ments and manage vehi-cles. Also, there willprobably be an
increase in carrier con-centration and consoli-
dation among high-ser-vice, low-cost transport
providers and value-addedlogistics and information man-
agers.From system development to system opti-mization
Trends indicate an increase “spot capacity”from new infrastructure projects, limited capacityincreases from larger trucks, trains and planesand significant increases in operational capacityfrom information technology (IT)-enabled
freight transportation systems. These trends suggest theimportance of investing in operations research techniquesfor shippers in the future as well as the high expectationsthe industry has for IT in scheduling, routing, dispatching,highway and traffic management, shipment tracing andstowage and terminal management.

P A G E S I X T E E N
tives which were then pared down topreferred strategies using key freightand logistical trend information (seeside bar, page 15).
Proposed StrategiesThe following strategies have been
proposed by the Airport DeploymentStudy team:
The Airport Deployment Studyteam used a 5-prong framework to helpguide strategy development under theheadings of 1) Economic Development,2) Logistics Patterns and ModalOptions, 3) Operations, 4)Infrastructure, and 5) Policy &Organization. This framework yieldedthe following proposed strategies.:Economic Development• Focus Workforce Training And
Recruitment Efforts- cooperative programs with universi-ties and technical colleges- coordination with state and localworkforce development and trainingprograms.
• Expand Employee Transportation-To-Work Options- worker shuttles- transit and bus service (coordi-nate with regional study)
• Develop CoordinatedPlan For
Land Use- develop through on-goingagency/industry cooperation- coordinate with Central Indiana"visioning" effort
• Target Economic Development Efforts- Nurture, grow and attract business-es that gain competitive advantage inthis district- coordinate with IndianapolisRegional Economic Development
PartnershipLogistics Patterns and Modal
Options • Expand Rail/Truck Intermodal
Options (near-term)- focus on eastbound traffic to main-tain/grow intermodal- market direct marketing for AvonYard district to attract intermodal railclients- use policy/financial incentives toencourage shippers to use rail, andencourage CSX to focus more on itsIndianapolis market- practice on-going freight rail advo-cacy (maintain potential rights-of-way,encourage competition)- conduct terminal study for AvonYard to explore specific markets and
services, and like-
ly effects of current rends on futureneeds
• Expand Rail/Truck IntermodalOptions (long-term)- promote increased competition asNorth American rail system evolves infuture mergers- increase number of lass 1 carriersserving the Indianapolis market- support grants of trackage rights tocompeting carriers- explore need for expanded regionalintermodal capacity to meet post-merger volumes
• Explore Rail/Air Intermodal Options- potential for small package move-ments by Amtrak- Midwest high speed rail corridorcould enable competitive rail serviceand further expand delivery options
• Achieve a better balance of freightflows--aggregate freight movementsinto larger shipments, especially forrail as do the shippers councils in theColumbus, Ohio - attract private e-logistics firm orother automated clearinghouse systemprovider, such as www.getloaded.comor the Planned Maine Department ofTransportation site.
Airport Deployment(from page 14)
cont on page 17, see Airport Deployment

PAGE SEVENTEEN
• Improve Processing Of International Freight- prepare for potential I-69 corridor extension toMexico- expand U.S. customs and related support ser-vices- expand foreign trade zone designation- provide information to facilitate internationalshipments, as Tradepoint of Columbus, Ohio does- explore potential for shifting trade processingfunctions from international border crossings toIndianapolis, as is done at the Kansas CityInternational Trade Processing Center
Operations (near-term)• assign law enforcement personnel to manage traf-
fic at airport entrance• use INDOT portable message signs foe dynamic
traffic controlOperations (long-term)• coordinate with on-going regional Intelligent
Transportation Systems (ITS) deployment efforts(such as INDOT)- Regional Advanced Traffic Management System(ATMS)- Regional Advanced Traveler Information System(ATIS)
• investigate additional airport area specific ITS sys-tems- airport area corridor management systems- airport area Incident Management (IM)plan/program- Highway Rail Intersection (HRI) monitoring
• integrate airport-area its operations with regionalsystem- incorporate airport-area considerations and sys-tems into regional Traffic Management Center(TMC), or- establish separate TMC for airport, with com-munication links to regional TMC
Operations – Freight Specific (near-term)• upgrade fixed signage along established truck
routesOperations – Freight Specific (long-term)• upgrade public sector system, including roadside
inspection, enforcement, virtual weigh stations,electronic permitting and clearance system as partof statewide CVO plan
• upgrade private sector systems, including trucking
Airport Deployment(from page 16)
cont on page 18, see Airport Deployment

1999, more than 20,000 were distributed to third graders inIPS, township school districts, and surrounding counties topping 1998’s distribution total of 12,500.
- an interactive web site featuring opportunities to register for “Nozone Action Day” notification and to post yourown questions at www.knozone.com
- a toll-free information line at 1-888-JDA-KNOW- on-going radio and television ads,
sponsored by Cinergy Corporation - educational brochures and newspa-
per advertising underwritten by Cinergy aswell as other local corporate citizens inter-ested in ensuring the continued growth ofozone pollution awareness.
Again, nearly 200 members of theIndianapolis Chamber of Commerce willjoin the DPW in participating in the KNO-ZONE program and spreading awareness of
ozone pollution. “Defining the problem and empowering people to help solve it is what the KNOZONE Campaign is allabout,” explains Mayfield. For more information on the OzoneAwareness Program, contact Kevin Mayfield at 327-3135([email protected]) or Rick Martin of the DPW at317/327-2269 or ([email protected]).
P A G E E I G H T E E N
Y o u r M P O s t a f f. . includes these people who would be happy to address your comments or questions on
any aspect of the transportation planning process:Stephanie Belch • Senior Planner 317/327-5136Steve Cunningham • Senior Planner 317/327-5403Mike Dearing • Principal Planner 317/327-5139Kevin Mayfield • Planner 317/327-5135Michael Peoni, AICP• Manager/Master Planner 317/327-5133Sweson Yang, AICP • Chief Transportation Planner 317/327-5137For more information on our regional transportation planning process, visit the MPO web site atwww.indygov.org/indympo.
Knozone (from page 7)
compute-aided dispatch(CAD), and automated gate systemsat airport/Avon Yard
Infrastructure• Midfield terminal project
- relocation of airportentrance- I-70 realignment- Separation of major passen-ger and freight destinations
• major infrastructure pro-jects- new highway corridors- existing highway widen-ings
• "Spot" infrastructureimprovements- intersection geometrics (tightcurves, height restrictions)- turning lanes
Policy and Organization• strengthen organization structure
- establish private/public freightstakeholders committee withinIndianapolis MPO to advise theRegional Transportation Council onfreight-related issues
- establish interagency commission todevelop and advocate freight improve-ment plans, market freight transporta-tion services, and attractbusiness/manufacturing interests
• identify zonal funding strategies; pre-pare for TEA-21 reauthorization
- IRTIP/federal-aidhighway funding, includingSTP, CMAQ, NHS IntermodalConnectors
- special federal fund-ing sources, including TEA-21
borders and corridors program andU.S. Department of Treasurygrants (customs facilities)- bonding- tax increment financing
- public/private part-nerships“These strategies are intended
to achieve stated study goals and to sus-tain/expand the area’s current shippingperformance,” says John Kaliski ofCambridge Systematics, the consultantshelping to conduct the study. In 1997,the airport vicinity shipped $97 billionin inbound and outbound goods — anincrease of $14 billion in just four years!In addition, air freight shipments were
found to be more likely to contain high-value goods. “Though trucking is still theregion’s dominant freight shipping mode,other modes offer unique business advan-tages,” says Kaliski. “For example, par-cel/mail handles a high percentage ofvalue goods, while rail and air offer long-distance shipping advantages, such aseconomy and speed.”
Yang agrees. “Every type of freighthandling should play a part in ourregion’s future economic health,” hesays. “Our role in tomorrow’s globaleconomy, and the employment andquality-of-life that comes with it,depends on our ability to handle freightefficiently, economically and through avariety of modes. That’s why it’s every-one’s business how we plan to preparefor this role.”
For more information on theAirport Deployment Study, contactSweson Yang at 317/327-5137([email protected]) or John Kaliski at617/354-0167 ([email protected]). Or,to express your opinion of the proposedstrategies, use the Strategy Assessmentform found on page 19.
Airport Deployment(from page 17)
P A G E N I N E T E E N
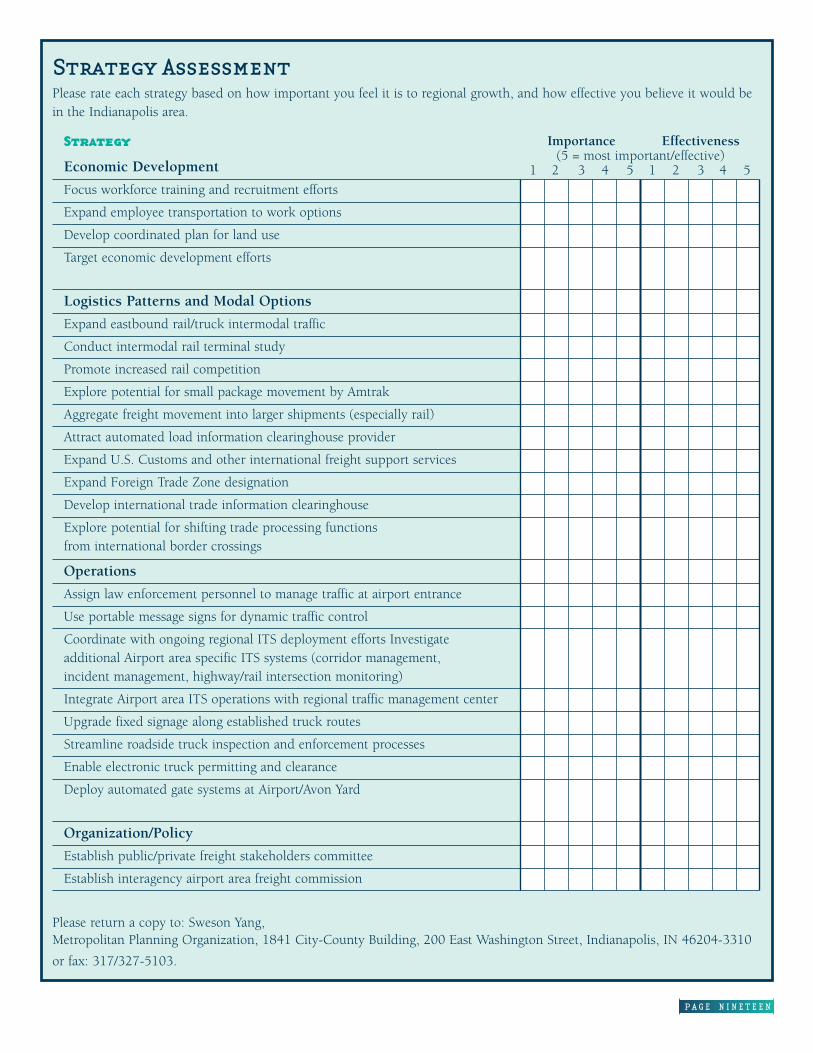
Strategy Assessment
Please rate each strategy based on how important you feel it is to regional growth, and how effective you believe it would bein the Indianapolis area.
Strategy
Economic Development
Focus workforce training and recruitment efforts
Expand employee transportation to work options
Develop coordinated plan for land use
Target economic development efforts
Logistics Patterns and Modal Options
Expand eastbound rail/truck intermodal traffic
Conduct intermodal rail terminal study
Promote increased rail competition
Explore potential for small package movement by Amtrak
Aggregate freight movement into larger shipments (especially rail)
Attract automated load information clearinghouse provider
Expand U.S. Customs and other international freight support services
Expand Foreign Trade Zone designation
Develop international trade information clearinghouse
Explore potential for shifting trade processing functions from international border crossings
Operations
Assign law enforcement personnel to manage traffic at airport entrance
Use portable message signs for dynamic traffic control
Coordinate with ongoing regional ITS deployment efforts Investigate additional Airport area specific ITS systems (corridor management, incident management, highway/rail intersection monitoring)
Integrate Airport area ITS operations with regional traffic management center
Upgrade fixed signage along established truck routes
Streamline roadside truck inspection and enforcement processes
Enable electronic truck permitting and clearance
Deploy automated gate systems at Airport/Avon Yard
Organization/Policy
Establish public/private freight stakeholders committee
Establish interagency airport area freight commission
Please return a copy to: Sweson Yang, Metropolitan Planning Organization, 1841 City-County Building, 200 East Washington Street, Indianapolis, IN 46204-3310
or fax: 317/327-5103.
Importance Effectiveness(5 = most important/effective)
1 2 3 4 5 1 2 3 4 5

P A G E T W E N T Y
Metropolitan Planning Organization1841 City-County Building200 East Washington StreetIndianapolis, IN 46204-3310
Printed on paper with recycled content
Shopping Shuttle ServiceStarted in 1993, this popular
program now serves 18 different livingcomplexes with once-a-week, round tripservice to grocery stores and shoppingmalls. “Most people take the ability torun these types of errands for granted,’Fox says. “But our clients really valuebeing able to take care of themselves inthis way.” Plans are in the works toexpand Shopping Shuttle Service intothe Fountain Square area through GoodShepherd, Sacred Heart and St. Patrick’sCatholic Churches, and Fox hopes tosoon involve some Lawrence Townshipsenior centers and apartment communi-ties.
When asked what his biggest chal-lenge is in administering these service,Fox responds with one word: volun-teers. “They are the life blood of our
service,” he says. “and we do everythingwe can to encourage their continuingcommitment.” As proof, Fox points outthat seven of his 30 current volunteerswill receive their 10-year service awardin 2001 or 2002 – a long time for manywho start their volunteer service afterthey retire. “I want people to know thatour drivers can pick their own days andtimes, that we reimburse for mileage,and that we provide secondaryauto insurance for them up to$1,000,000,” Fox explains.“We appreciate theirhelp, and we showit.”
All SeniorTransportationProgram ser-vices are operat-ed as entitle-
ment programs. To qualify for service,clients need only be 60 years of age orolder and live within Marion County.For more service information, or toapply as a client or volunteer, contactHarry Fox at 317/263-6281 or [email protected], or visit The SeniorTransportation Program web site atwww.seniortransportation.org.
MPO Profile (from page 5)

INDIANAPOLIS REGION'SINDIANAPOLIS REGION'S
KEEPING PACE WITH OUR TRANSPORTATION NEEDS
Bike Route Map Ready. . . . . Page 1IndyGo Initiatives . . . . . . . . Page 1Q & A . . . . . . . . . . . . . . . . . . . Page 2MPA MAP . . . . . . . . . . . . . . . . Page 3IRTIP Amendments. . . . . . . . Page 3Interstate Construction . . Page 4DP Owners Manual . . . . . . . . Page 5Pedal & Park Partner . . . . . Page 7Bike Map Bullets. . . . . . . . Page 10Irons In The Fire. . . . . . . . Page 17CAC Survey . . . . . . . . . . . . . Page 23
Summer Sizzles
Like August in Indiana, the topic ofregional transportation planning has
never been hotter, or more varied, thanin this issue of teMPO. Check it out!
Here, you’ll find the scoop on thenew Marion County Bike Route Map,IndyGo’s new alternative transportationinitiatives, the proposed RegionalTransportation Authority, new amend-ments to the Indianapolis RegionalTransportation Improvement Program,INDOT’s interstate construction schedule,a free publication from the Division ofPlanning that puts names, numbers, available information and documents atyour fingertips, and a program thatencourages greenway trail use while offer-ing area cyclists convenience and securityat some of the season’s hottest events.
It’s all here, plus new Census data,a conNECTions update, details from thefinal Special Neighborhood Study workshop, and a whole lot more! Want to know more? No sweat. Chillout with teMPO!
In This Issue
BIKE ROUTE MAP READY
It’s been a very long time in coming, but we think people will find the end resultworth the wait,” says Mike Dearing, MPO Principal Planner and planner-in-charge
of the Indianapolis Regional Bicycle & Pedestrian System Plan since 1996. “Our newBike Route Map reflects the best thinking of ourPhase Five planning partners, including IndyGreenways, a XX-member study review committee, representatives of the CentralIndiana Bicycling Association (CIBA), theIndiana Bicycle Coalition (IBC) and the general public.”
As previously reported in teMPO(Autumn, 2000), Phase Five of theIndianapolis Regional Bicycle & PedestrianSystem Plan has been in the works sincemid-1999. Its purpose was to 1) develop anetwork of routes that fills in betweenexisting greenways and the axis system
cont on page 8 , see Bike Route Map Ready
S U M M E R 2 0 0 1
V O L U M E F I V E
I S S U E T W O
“
IndyGo Initiatives
As reported in the Winter 2000 issue of teMPO, (2000 Work Program Re-Cap), theIndianapolis Public Transportation Corporation (IPTC/IndyGo) completed the
development of its 5-year ImplementationPlan in 2000.
The document, prepared with funding from the Metropolitan PlanningOrganization, is a formalenhancement/expansion plan to systemat-ically program future IndyGo operationalimprovements. Its purpose is to identifyspecific strategies for achieving the corporation’s overall goal of increasing theregion’s transit ridership (and decreasing the region’s reliance on single occupantvehicles) by 1) better meeting the changing travel needs of existing and potential cus-
cont on page 14, see IndyGo Initiatives
AQ
P A G E T W O
I n Q & A, members of your MPO staff answer questions posed to them via voicemail, e-mail, regular post or in-person. In this issue, Mike Peoni answers ques-
tions about the proposed Regional Transportation Authority (RTA).
I’ve heard a lot recently about a Regional TransportationAuthority (RTA) being formed? Some people are strongly for it;others are just as strongly against it. I don’t know enough to feeleither way. What is an RTA? What would it do? Whose idea is it?Wasn’t the formation of an RTA proposed, and defeated, in the late‘90’s? Why are we hearing about it again? Is the MPO for or againstit, and why? Finally, would it have taxing authority like somepeople say?
composite of questions asked, andissues raised, in-person and in“Letters to the Editor” appearingin The Indianapolis Star
The RTA is a big issue and an important one for the future of our regionaltransportation system. I’m glad to have the chance to answer these questions directlyand to give you the perspective of transportation planners and engineers who areresponsible for meeting the area’s current, and anticipating the area’s future, travelneeds.
Transportation planning throughout our region is overseen by the MPO incooperation with the Indianapolis Regional Transportation Council (IRTC). TheIRTC is composed of Policy, Technical and Citizens Committees. The IRTC-PolicyCommittee is made up of elected officials fromthroughout the MPO study area, whichincludes all of Marion County and portions ofsurrounding counties expected to be urbanizedby the Year 2025.
Late last year, the IRTC-PolicyCommittee asked the MPO to re-examine thedesirability of establishing an RTA as a meansof promoting transit throughout the region.There was an attempt to establish an RTA in1997. That attempt did not succeed when theIndianapolis City-County Council failed topass an ordinance to establish an RTA. TheIRTC raised the issue again in 2000 because 1) transportation is a regional issue; 2) as ourcommunities continue to grow both in popula-tion and employment, traffic congestion will worsen; 3) limited right-of-way makesit difficult, if not impossible, for us to continue to expand our highways and “build
ACRO-NYMBLE
Here’s a list of the acronyms used inthis issue. Refer to it to keep your
understanding letter-perfect.AICP - American Institute of CertifiedPlanners
AVL – Automatic Vehicle Location
CAC - Citizens Advisory Committee
CIBA – Central Indianan ByclingAssociation
CIRCL - Central Indiana RegionalCitizens League
CIRTA – Central Indiana RegionalTransit Alliance
CN – Construction (IRTIP code)
conNECTions - Study of NorthEastCorridor Transportation
DEIS – Draft Environmental ImpactStatement
DMD - Department of MetropolitanDevelopment
HUD – (Department of) Housing &Urban Development
IBC– Indiana Bicycle Coalition
IIA - Indianapolis International Airport
INDOT - Indiana Department ofTransportation
IPTC/IndyGo - Indianapolis PublicTransportation Corporation
IRTC - Indianapolis RegionalTransportation Council
IRTIP - Indianapolis RegionalTransportation Improvement Program
ITS – Information Technology System
LA – Land Acquisition (IRTIP code)
MDC – Metropolitan DevelopmentCommission
MPA - Metropolitan Planning Area
MPO - Metropolitan PlanningOrganization
MSA – Metropolitan Statistical Area
Q & A – Question and Answer
RFL – Ready For Letting (IRTIP code)
RMTS – Regional Mass Transit Service
RTA – Regional Transit Authority
SOV – Single Occupant Vehicle
TE – Transportation Enhancement(IRTIP code)
cont on page 21, see Q & A
&
Mike Peoni, AICPMPO Manager/Master Planner
QUESTIONSANSWERS

IRTIP Amendments
As previously reported in teMPO,The Indianapolis Regional
Transportation Improvement Program(IRTIP) documents federally-fundedtransportation improvement projectsproposed for our region using availabledollars within a three-year time frame.As such, it is constantly amended toreflect the newly recognized needs andshifting priorities of the MPO’s planningpartners.
“The MPO’s job is to consider theinterests of all of our planning partnersand make sure that the IRTIP serves thebest interest of our regional transporta-tion system as a whole,” says MikeDearing, MPO Principal Planner, andplanner-in-charge of the IRTIP. Beforeprojects can be considered for inclusionin the IRTIP, they must first appear inthe Regional Transportation Plan.
An important aspect of gettingthose projects approved for implemen-tation is providing the opportunity forthe public to review and comment onthem. In May 2000, the MPO startedrunning display advertising in theCity/State section of The IndianapolisStar in conjunction with its traditionalclassified notices to promote awarenessand review of IRTIP amendments. The ad announcing the amendmentsdiscussed here ran in the August 24 and27 issues of The Indianapolis Star andthe August 31 issue of The IndianapolisRecorder.
In addition, Dearing regularlyappears at the MPO’s monthly CitizensAdvisory Committee (CAC) meeting topresent information on newly proposedamendments. He did so at the August 28CAC meeting to discuss the followingamendments requested by the IndianaDepartment of Transportation (INDOT)and Johnson County:
Requested by INDOTAdd two Transportation
Enhancement (TE) funded projects to pro-gram year 2002 in the 2002-2004 IRTIP:
• The Construction (CN) phasefor the Old Northside Gateways Projecton Central Avenue from 12th Street to15th Street in Indianapolis. The cost ofthe CN phase is $200,000 ($160,000federal, $40,000 local match).
• The CN phase for the FallCreek Trail from the Monon Trail toKeystone Avenue (Phase 1) inIndianapolis. The CN cost is$1,645,000 ($1,309,000federal, $336,000 localmatch).
Also, add to program year2001 of the 2001-2003 IRTIP
P A G E T H R E E
INDIANAPOLIS METROPOLITAN PLANNING AREA
Boone
Morgan JohnsonShelby
Metropolitan Planning Area (MPA)(Projected Urbanization By The Year 2020)
MPO Modeling Area(Studied Because Of Its Proximity To, And Influence On, MPA Traffic)
Eagle
Pike
Lincoln
Wayne
Buck
Creek
Sugar
Creek
White
River
Warren
Washington
Perry FranklinDecaturGuilford
Lawrence
Delaw
are
Hancock
Washington
Hendricks
Pleasant
Clay
Washington
Center
Hamilton
Marion
Fall
Creek
Note: all roads onboundary lines areexcluded exceptMarion County’s eastand south county lines.
cont on page 22, see IRTIP Amendments

P A G E F O U R
cont on page 6, see Interstate Construction
Interstate Construction
The Spring, 2001 issue of teMPO included the cover storyRide-Share/Vanpool Programs Ready which detailed, in
part, the many reasons ride-share programs are now beingactively proposed as part of the regional transportationplanning process. Among these reasons are 1) the publicsupport for improved transit options and personalmobility voiced during the conNECTions study ofNortheast Corridor transportation andreflected in the Central Indiana RegionalCitizen League’s (CIRCL)Transportation and Land Use VisionPlan, 2) the emphasis placed onaddressing the need for regionalmobility in IPTC/IndyGo’s 5-yearImplementation Plan through avariety of services including ride-share matching and car/van pools,3) Mayor Bart Peterson’s avid supportfor improving public transportation systemsthroughout the region as first described duringthe 1999 mayoral campaign in the “PetersonPlan”, and 4) the recommendations of the RegionalMass Transit Service Plan, completed in 1999, whichdetails transit solutions for the nine-county region, includ-ing van pool programs.
“We need to initiate these programs now to alleviateanticipated congestion caused by major interstate constructionprojects occurring over the next 10 years,” MPO SeniorPlanner Stephanie Belch was quoted as saying. ElizabethJohnson, Intergovernmental Relations Manager for IndyGo,agreed. “The reasons that justified these past recommenda-tions still exist,” she said, And now, there’s even more evidence that we need to develop transportation strategies tocounteract new causes of congestion including dramatic population growth and INDOT’s scheduled construction alongI-465, I-70 and I-65.” An Editor’s Note in the same articleexplained that our region’s interstate highways account foronly 3% of our transportation system’s roadway surface, butcarry approximately 40% of area traffic. Any reduction in theirservice capacity will dramatically impact the area’s traffic flow.
Since its publication, a number of teMPO readers havecontacted the MPO seeking more information on the INDOTconstruction schedule alluded to in the article. Here, then, isthe timetable for reconstruction/expansion projects along theregional interstate system as provided by Brad Steckler ofINDOT, back in the spring of this year. The years indicatedfor all projects are tentative, Steckler notes.
The following are long-range, “planned”works, that are not yet “programmed”:
Where When
I-465 from Fall Creek (just north of East 56th Street) to US 421 (Michigan Road) 2010-2012
I-465 from just south of I-70 (East Side) toSR 67 (Southwest Side) 2018-2023
I-70 from Airport Expressway (West Side) toI-65 (Downtown) 2025
I-70 from South Split with I-65 to North SplitWith I-65 (all Downtown) 2014
I-70 from North Split with I-70 (Downtown)To I-465 (East Side) 2014

DP Owner’s Manual
It’s kind of a tour book,” says BobWilch, Pricipal Planner of the Division
of Planning Owner’s Manual for which heis primarily responsible. In it, we try toprovide the most up-to-date and usefulinformation we can concerning everyaspect of the preparation of theCity/County’s Comprehensive Plan andthe administration of zoning ordinances.That’s why we update it annually,” henotes. “With the publication ofour new Fourth Edition, peopleshould have no problem easilyaccessing the information, ser-vices, documents and contactsthey need.”
The Division of Planning isone of six divisions of theDepartment of MetropolitanDevelopment (DMD). The DMDis responsible for the orderlydevelopment of Marion County.In 2000, the Current Planningportion of the AdministrativeServices Division was combinedwith the Division of Planning.The Division of Planning’s prima-ry responsibilities are both thepreparation of the ComprehensivePlan for Indianapolis/MarionCounty and the maintenance andadministration ofIndianapolis/Marion CountyZoning Ordinances.
The Comprehensive Plan incorpo-rates a wide variety of components,including recommendations on trans-portation, parks, land use, zoning, eco-nomic development, and public facilities.Similarly, there are many components tothe City’s zoning ordinances such as pri-mary land use districts, secondary zoningdistricts, and administrative/enforcementsections. These components are adminis-tered through the MetropolitanDevelopment Commission and the Boardof Zoning Appeals.
The Division of Planning analyzescommunity conditions, makes projec-tions, and recommends plans for privateand public projects. Division staff devel-ops plans for the improvement of streets,changes in land use, protection of naturalresources, and the expenditure of publicmoney. Residents, business owners, citydepartments and others are involved inthese efforts as planning partners.
The “Owners Manual” was original-ly developed as an aid to City employees
and agencies dealing with the City andcontinues to serve this purpose. However,it now also facilitates public participationin the planning process and anyone whofinds it useful may receive a copy. Itsoverall purpose is to provide all interestedparties with information on 1) the ser-vices and products the Division can pro-vide, and 2) how to obtain them.
The Owners Manual is organizedinto six major sections. They are, in orderof appearance, :
IntroductionThis section contains the Owner’s
Manual Table of Contents, a list of document charts and maps the Manualcontains, an organizational chart for the Department of MetropolitanDevelopment, brief instructional text onusing the manual, and a map showingselected planning jurisdictions.
History of CommunityDevelopment in Indianapolis
This section presents a time-line of important communitydevelopment events inIndianapolis, such as when theCommon Council of Indianapolispassed the City’s original ZoningOrdinance (1922), when theButler-Tarkington NeighborhoodAssociation, arguably the city’sfirst, was established (1956), whenthe City’s first OfficialThoroughfare Plan was adopted(1958), and when Mayor BartPeterson and Congresswoman Julia Carson broke ground for Fall Creek Place - the result of a $4 million Home Ownership Zonegrant from HUD.
Functions of the DivisionThis section includes a brief
description of the services providedby the ten sections of the Divisionof Planning, a list of past projects,and descriptions of procedures
used to request services or obtain information from the section.
Division DocumentsThis section lists the maps, docu-
ments and computer information offeredby the Division of Planning. Availabledocuments include Maps (base, census,district, planning and land use, regionalcenter and transportation), Plans (adoptedland use, park, park-related and parkmaster), and Reports (census, housing,transportation and others). Also included
P A G E F I V E
cont on page 24, see Owner’s Manual
“

P A G E S I X
teMPO is published quarterly by your Metropolitan Planning Organization, part of the Department of Metropolitan Development. If you knowof anyone who would like to receive teMPO, or if youhave any questions concerning its publication, please call:
Mike Peoni at 327-5133Department of Metropolitan DevelopmentMetropolitan Planning Organization1841 City-County Building200 East Washington StreetIndianapolis, IN 46204teMPO was written and prepared for publication byWhitman Communications, Inc.
Interstate Construction(from page 4)
For more information on INDOT’s regional interstatereconstruction/ expansion project schedule, contact BradSteckler at [email protected]. For more informa-tion on Ride-Share and Vanpool programs, contact StephanieBelch at 317/327-5136 ([email protected]) or ElizabethJohnson of IPTC/IndyGo at 317/635-3344.
Where WhenI-70 from just east of I-465 (East Side to SR 9) 2014
I-65 from I-70 North Split (Downtown) to38th Street (Northeast Side) 2020
I-65 from Raymond Street to I-70 South Split (Downtown) 2012
I-65 from I-465 (South Side) to Raymond Street 2019
I-65 from Greenwood to Southport Road 2014
I-65 from Southport Road to I-465 (South Side) 2010
I-69 from I-465 (Northeast Side) to SR 238 2009
I-69 from SR 238 to SR 9 2012
The following are short-range, “programmed”projects, in various stages of active develop-ment:
Where When
I-465 at SR 37 (Southwest Side) Interchange Modification 2006
I-465 from I-65 to Southeastern Avenue (Southeast Side): Let (for construction) 1999
I-465 from Southeastern Avenue to US 52/Brookville Road (Southeast Side): Let 2000
I-465 from US 52 to just south of I-70 (East Side): Let 1998
I-465 from just south of I-70 to SR 67/Pendleton Pike (East Side): Let Phase 1 2001
Let Phase 2 2005
I-465 from SR 67 to just north of 56th Street (East Side): Let Phase 1 2000
Let Phase 2 2002
I-465 from just north of 86th Street to 79th Street (Northwest Side) 2003
Where When
I-465 from 79th Street to just north of I-65 (Northwest Side) 2004
I-465 from just north of I-65 to just south of I-65 (Northwest Side) 2008
I-465 from just south of I-65 to just south of SR 67 (West Side) 2004-2008
I-70 from SR 267 to I-465 (West Side) 2004
I-65 from 38th Street to I-465 (Northwest Side): Let 2000

Pedal & Park
Partners
I t’s a program that fits well within ourregional transportation plan,” says
Mike Peoni, MPO Manager/MasterPlanner. “When The GreenwaysFoundation contacted us aboutour possible participation, wewere happy to encourage theirinitiative and support their effortsin a meaningful way. After all,Pedal & Park supports a lot ofour mutual goals.”
For the first time ever, thePedal & Park program offeredarea cycling enthusiasts “free-wheeling fun” at events locatedalong the Indy Greenways TrailSystem throughout Summer,2001. The program, started several years ago by TheGreenways Foundation, offeredcyclists FREE, secured bicycleparking at major events, thanksto a subsidy from the MPO. “Thatwas new this year,’ says TomOlsen, President of TheGreenways Foundation, “and it’smade quite a difference both tothe users and to the volunteerswho helped run the program.”
The Pedal & Park Programoffered free, monitored bikeparking at the Broad Ripple ArtFair (May 12 & 13), the Day AtThe Depot (June 2), the IndianaState Fair (August 8 –19) andPenrod Arts Fair (September 8).At each event, the MPO paid a $1parking fee for each bike checkedat the fenced and supervised‘bike corral’ which was continu-ously monitored by volunteersfrom partner organizations,including The GreenwaysFoundation, Indy Parks Greenways, TheCentral Indiana Bicycling Association(CIBA) and the Indiana BicycleCoalition (IBC) who shared in the program proceeds.
“We’re proud to be associated withthe program,” Peoni said. “Our sponsor-ship allowed us to encourage alternativemodes of travel while helping ourgreenways and bicycle planningpartners.” As part of its program spon-
sorship, the MPO underwrote all park-ing fees to a maximum of $2,500, plusprovided tents for volunteers use, bike-related literature for distribution, andcommunications/public relations
support prior to all Pedal & Parkevents. As a result, the program was featured in The Indianapolis Star and onWISH-TV, Fox-59 and WIBC Radio.
“The $2,500 fee maximum may notsound like much to some people, but it
gave us something to shoot for,” saidOlsen who pointed out that the sumrepresented more than triple the feescollected last year. “Our volunteerpartners appreciate both the revenueand program awareness the MPOsponsorship brought us.”Approximately $1,500 has been paidout in parking fees this year throughscheduled events, the largest beingthe State Fair. “Despite the extremeAugust heat, people bicycled to theFair, particularly on the weekends,when we were accommodatingabout 100 people a day,” Olsennoted.
The MPO has invited Pedal &Park volunteer organizations to addother greenways-adjacent events toextend the season and maximizetheir financial benefit from thesponsorship. “We want the program to do well and as manyregional cyclists as possible to takeadvantage of the free parking service,” Peoni said.
The purpose of the Pedal &Park Program is to encourage use ofnon-motorized transportation alter-natives, promote use of the IndyGreenways, disperse relevant recre-ational literature and raise funds forthe partnering not-for-profit organi-zations. It also facilitates efforts tominimize traffic congestion andparking hassles at popular events,like the State Fair and Penrod, andsupports Knozone awareness onNozone Action Days.
For more information onPedal & Park Program, including future volunteer opportunities, call317/297-1283 or 317/710-0739, orvisit the Indy Greenways web site atwww.indygreenways.org.
P A G E S E V E N
“

P A G E E I G H Tcont on page 9, see Bike Route Map Ready
mapped out for Marion County duringprevious phases, and 2) develop a new,comprehensive bike route map toreplace the one produced in 1987. Alsoincluded in the project isthe design of route signage and other systemfacilities for use through-out Marion County. Theinvestigation of pedestri-an route issues, originallyto be included in PhaseFive, was postponed onthe recommendation ofthe management team,which felt they could notbe properly addressedwithin the scope, sched-ule and budget of thisphase. Pedestrian routeissues are tentativelyscheduled to beaddressed by the MPO inits 2002 Annual UnifiedWork Program.
“Our new mapreflects our attempt toidentify bicycle routesthat encourage real-lifebicycle usage, such ascommuting to work,recreational travel andrunning errands, whilealso tying into the exist-ing trails of IndyGreenways,” Dearingsays. To do this, plannersand the public identifiedimportant destinationsthat needed route accessas “Primary Nodes.” The proposed bikeroutes connecting these nodes are theresult of computer-modeling, five publicinput meetings, and a school projectwhich encouraged local students towork with the same information plan-ners were using.
“We worked with the Center forInteractive Learning and Collaboration
(formerly, the Corporation forEducational Communication) to assessthe current demand and future potentialof non-motorized transportation amongour region’s young people,” notesDearing. “We were delighted with the
response and just recently receivedword that our school tie-in would beused as a national model for educationaloutreach by U.S. Department ofTransportation.
Other Phase Five planning part-ners contributing to the route develop-ment process, and to the map itself,
include the Indiana Bicycle Coalition(IBC), Central Indiana BicycleAssociation (CIBA), the IndianaDepartment of Transportation (INDOT),elected officials from neighboring com-munities and the engineering firm of
HNTB, primary projectconsultants.
More than a Map“The new map is
more than just a direc-tional tool.” Dearing says,“It’s a way of encouragingpeople to start thinkingabout cycling as a meansof getting around MarionCounty.”
Ray Irvin of IndyParks Greenways agrees.“We made sure to includethings like proposed green-ways trails to show ourlong range commitmentto the bike route system,”he says. “By the time wereprint this map, we’llhave to change some ofthose proposed trails toexisting because they willhave been built. Updatingthe map, like developingthe system, is a process,not an event.”
That fact is one reason the map tookmonths to develop. “Weknew we needed to createthe map in a way thatcould be easily updatedevery few years, to reflectfurther development onthe route system,” Dearing
explains. “Our communications consul-tant recommended creating the map inAdobe Illustrator because it supportsboth print and web production and iseasily altered. Standard map-makingsoftware, such as Map Info, isn’t. It canonly be imported into print and webmedia as a closed file (such as a jpeg)
Bike Route Map Ready(from page 1)

P A G E N I N E
which prevents alteration. We were unable to find any currentmap sources for Marion County that could be translated toIllustrator, so we had to create our own layers from scratch.”The up side? “We were able to incorporate the most-up-to-the-minute information,” says Irvin. “We evenupdated greenways maps that were justproduced earlier this year.”
The result reflects a ‘less is more’philosophy that lends itself to ‘at-a-glancerecognition. “We knew we wanted a verygraphic, user-friendly look to the newmap,” explains Joe Whitman of WhitmanCommunications, Inc, the firm contractedto create the map, as well as the BikeRoute logo. “So, early on, we had todecide on the type of information toinclude, and omit. Marion County isroughly a 20-mile square — a much largerarea than other bike route maps cover.That, in part, determined the level ofdetail we could show.”
Dearing explains. “The old mapattempted to show every street in thecounty. As a result, a lot of people hadtrouble following it. Too many fine, blackand white lines,” he notes. “The new bikeroute map isn’t intended as a comprehen-sive county street map. We show enoughstreets to orient the user, but not so manyas to confuse or obscure the other infor-mation we’re presenting. New map layersare color-coded for easy identification andinclude primary and secondary bikeroutes, both existing and proposed greenways trails, parks and golf courses,waterways, streets and interstates, and railcorridors. “The information shown is ofinterest to casual bike riders and cyclingenthusiasts alike,” Dearing says, “ andincludes signed routes, frequent recre-ational destinations, and present andfuture trails.” (For a better idea of howthe new Marion County Bike Route Maplooks, turn to pages 12 - 15 in this issue).
In addition to the graphics shown within the countyboundary, the new map includes a variety of related informa-tion. “Mike and I attended the Pro Bike/Pro Walk Conferencein Philadelphia last September,” Whitman notes. “There, wewere able to review bike route maps from around the countryto see what types of information they included.” From this
survey, and the input of planning partners, the study team wasable to determine which information would be most appreciat-ed by the map’s eventual users.
Included in this information are Riding Tips stressingsafety; a listing of bike-related organizations with phone
numbers and web addresses; directionsfor riding On-Path, On-Street and On-Guard; directions for using the map; theState Bike Code and parts of the City BikeCode; important street signs with which tobe familiar; and, a greeting fromIndianapolis Mayor Bart Peterson who isan enthusiastic supporter of cycling forboth recreation and transportation. “Weare also happy to feature cycling photog-raphy from members of CIBA and theIBC,” Whitman says.
The map, as a product of Phase Fiveof the Indianapolis Regional BicycleSystem Plan, is scheduled for print production in late summer, 2001. It willbe available to the public in October atthe City-County Building, public libraries,park facilities, area bike shops and severalother locations. In addition, it will be fea-tured on the Indy Parks Greenways website a www.indygov.org/parks/greenways.
For more information on the MarionCounty Bike Route Map, contact MikeDearing at 317/327-5139 [email protected].
Bike Route Map Ready(from page 8)

P A G E T E N
Bike Route Map
Side One – Northern Marion County
The actual map is 26.5”H x 39”W and 4-color. It folds down to approximately 9”H x4.5” W. When unfolded, each side shows slightly more than half of Marion County,
repeating the roughly three-mile mid-section that contains the downtown circle for easyorientation. The bottom half of Marion County appears by flipping the map horizontally, on its shorter axis, for easy handling in transit.
More information aboutBicycling in Marion Countyis available from these organizations.
In his greeting, Mayor Petersonsays Marion County has 327 milesof bike routes!
This is the cover of the map, withphotography taken near the board-walk along Waterway Boulevardand Fall Creek. It appears here atthe bottom of the sheet, because ofhow the map folds. Note the BIKEROUTE sign design. It is similar tothat of signage that will appear onall Primary Bike Routes.
These illustrated tips give the basics ofsafe bicycle operation. Some werereprinted with permission from MetroRegional Services of Portland Oregon.
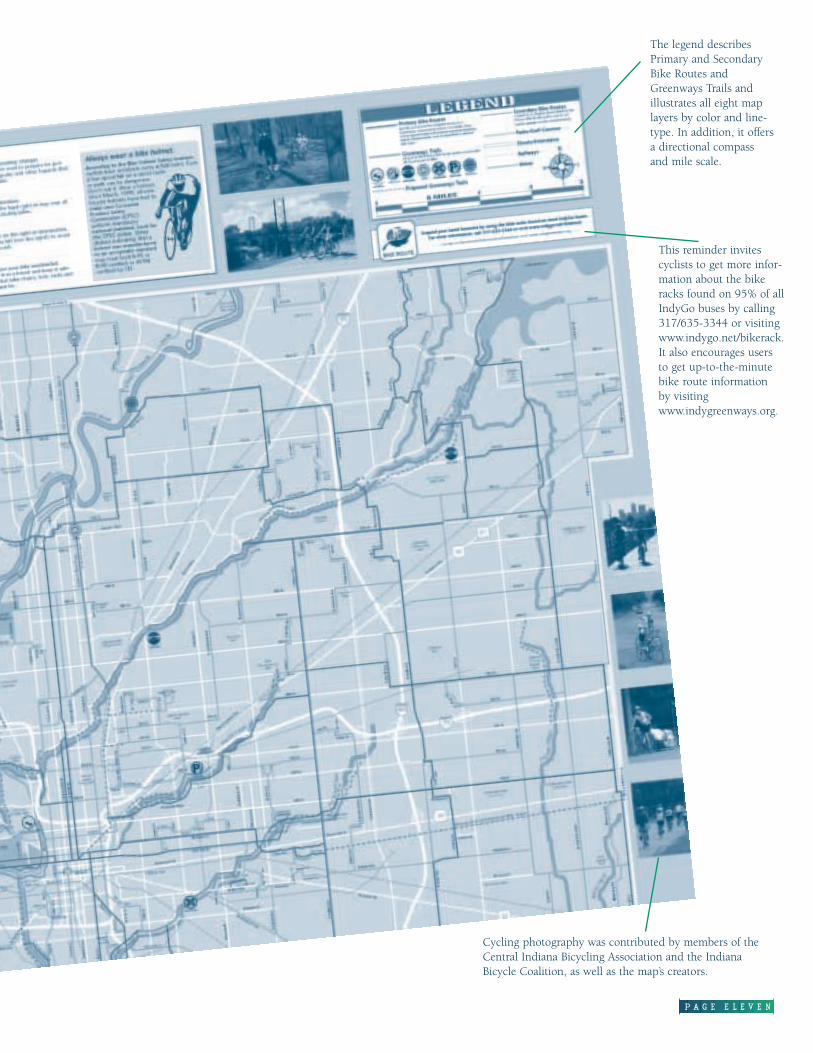
P A G E E L E V E N
The legend describesPrimary and SecondaryBike Routes andGreenways Trails andillustrates all eight maplayers by color and line-type. In addition, it offersa directional compassand mile scale.
This reminder invitescyclists to get more infor-mation about the bikeracks found on 95% of allIndyGo buses by calling317/635-3344 or visitingwww.indygo.net/bikerack.It also encourages users to get up-to-the-minutebike route information by visiting www.indygreenways.org.
Cycling photography was contributed by members of theCentral Indiana Bicycling Association and the IndianaBicycle Coalition, as well as the map’s creators.

P A G E T W E L V E
Bike Route Map
Side Two – Southern Marion County
The actual map is 26.5”H x 39”Wand 4-color. It folds down to
approximately 9”H x 4.5”W. Whenunfolded, each side shows slightlymore than half of Marion County,repeating the roughly three-mile mid-section that contains the downtown circle for easy orientation.The bottom half of Marion Countyappears by flipping the map horizontally, on its shorter axis, for easy handling in transit.
This feature gives operating tips forcycling in three different scenarios:on a trail, on a city street, and withinmotorized traffic where inattentivedrivers may pose a threat.
This copy block identifies theMetropolitan Planning Organizationand Indy Parks Greenways as pub-lishers of the map. It also suggestssafety tips for use of both the mapand the route network and identifiescriteria used for identifying primaryroutes. Those wishing to downloadsections of the map are directed towww.indygreenways.org.
This section gives highlights of both the State Bike Codeand new City Bike Code Amendments. For a completereview of SECTION 1. Chapter 431, ARTICLE VI, of the“Revised Code of the Consolidated City and County,” visitwww.indygov.org/counsel/municode.

PAGE THIRTEEN
Cycling photography was contributed by members ofthe Central Indiana Bicycling Association and theIndiana Bicycle Coalition, as well as the map’s creators.
The legend describesPrimary andSecondary Bike Routesand Greenways Trailsand illustrates all eightmap layers by colorand line-type. In addi-tion, it offers a direc-tional compass andmile scale.
This reminder invites cyclists to get more information about the bike racks found onmost IndyGo buses by calling 317/635-3344 or visiting www.indygo.net/bikerack. Italso encourages users to get up-to-the-minute bike route information by visitingwww.indygreenways.org.
These nine road signs are among the mostcritical for cyclists to recognize at-a-glance.

PAGE FOURTEEN
tomers, 2) expanding IndyGo’s servicearea to encompass the entire region, and 3) incorporating new technologiesand initiatives to improve operationalefficiency/economy and customer perceptions.
“Most of the initiatives proposedin our plan contribute to our goal ofexpanding, diversifying and improvingservice to meet the unique travel needsof the region’s population,” says Roland
Mross, IPTC/IndyGo Director ofMarketing and Service Development.“That’s why we introduced 40,000hours of flexible, “on-demand” serviceto complement our fixed route operation in 2000, before ourImplementation Plan was even complet-ed,” he points out. “It’s also why weintroduced economical, efficient paratransit services like the 86th StreetRoute, Dial-a-Ride and Flexride.”
The initiatives proposed by theplan, however, encompass a wide rangeof transportation-related issues, includingcustomer conveniences, seasonal servicesand the possibility of becoming a regionaltransit provider. (For more informationon regional transit efforts, see Q & A,page 2 of this issue.) Each is scheduled
to begin during one of the next fiveyears. To review the initiatives scheduledfor this year, see the box at left.
“But this is just the beginning,”says Elizabeth Johnson, IndyGoIntergovernmental Relations Manager.As further evidence of IndyGo’s pro-active posture, she notes the SpecialNeighborhood Study of the Glendalearea on which IndyGo has served asMPO’s planning partner in considering avariety of alternative transportationoptions. “The goal is improving mobility,”
she says, “and it’s natural for the publictransit provider to be a part of any program that does that, even if it doesn’tinvolve buses.” (For further informationon the Special Neighborhood Study, seeIrons In The Fire, page 17, or teMPO’sSpecial Edition, June 2001.)
Recently, other IndyGo initiativesaimed at addressing the region’s needfor transportation alternatives havegained wide spread attention in thelocal media. Whether proposed in the5-Year Implementation Plan, or pre-dating it, these initiatives send out a clear message that regional transportation planners are looking atcomplementary, non-traditional effortsto offer integrated travel options totransportation system users.
Examples include:
Bike-To-BusThis program is jointly sponsored
by IndyGo, the Bicycle Action Projectand the Governor’s Council on PhysicalFitness and Sports. IndyGo has invested$600 - $900 per bus to equip 95% ofits fleet (about 110 buses) with bikeracks. Each rack holds two bikes andfeatures quick release, convenient load-ing and unloading. (For more informa-tion on these racks, see teMPO, Summer
1999.) The racksaccommodate
all types ofjuvenile andadult-sizedbikes andnever contactthe bikeframe, therebyreducing the
potential for damage. “The bikeracks proved to bea hit when theywere tested onRoute 10, back inthe summer of
1999,” notes MikeDearing, MPO Principal
Planner and planner-in-charge of bicycleand pedestrian programs. “Other transitsystems in major metropolitan areas arealso incorporating them, includingthose in Portland, Pittsburgh, Chicagoand Seattle.
The program kicked off onFriday, August 3, with local cyclingenthusiasts ranging in age from 27 to70, riding to the State House to catchan IndyGo bus. The event was coveredby local television stations and TheIndianapolis Star under the heading,“Transportation Alternative.” Since thattime, a growing number of cyclists havestarted to use the IndyGo bike racks ona daily basis. “Having bicycle racks onbuses allows more people to have accessto IndyGo’s fixed-route service,” saysDearing. “Someone may not live within
cont on page 15, see IndyGo Initiatives
IndyGo Initiatives(from page 1)

P A G E F I F T E E N
a comfortable walking distance to a busstop, but bicycling there may be anacceptable alternative. And the same canbe true at the other end of the trip,” heexplains. “More people than ever aremaking a commitment to their own fit-ness and mobility, and to cleaning upthe region’s air.”
Access-To-Jobs/FlexrideOn September 12, 1999
IndyGo initiated a new transit programto transport passengers between thecity’s Enterprise Community andemployers in and around theIndianapolis International Airport (IIA)and the Park 100 area. “We’re veryproud to be offering this much neededservice for the benefit of passengersand area businesses alike,” saidShannon Joseph, IndyGoMarketing Manager, at thetime. Prior to Access-to-Jobs, many AirportZone employers,including hotels, ware-house facilities andmanufacturers hadtrouble finding suit-able applicantsbecause of lack oftransportation. “We don’t know how biga constituency we can ultimately serve,but it’s great to know we’re making adifference in people’s lives from dayone,” Shannon said.
Originally intended to serve welfarerecipients as well as low income andunder-employed persons, the program’starget area for drawing constituents wasthe city’s Enterprise Community, roughlyaligned with Center Township. TheRoute 9 Airport Zone Service Route,which started September 12,1999, operated from 5:30 AM to 11 PM sevendays a week, arriving at 30-minuteintervals during peak travel times, 60-minute intervals off-peak. Additionallate night service, available on-call, wasscheduled to start later that year.
Now in its third year of a five yearfederal appropriation (subject to annualreview), the Access-to-Jobs Programprovides an estimated 7,400 rides withan expanded service area defined by 46th Street to the north,Mitthoeffer/I-70/I-465 to theeast, Troy Avenue to thesouth and TibbsAvenue to the west.“Because of theprogram’ssuccess,
we are confidentof the government’s continued support,”says Roscoe Brown, IndyGo ProgramDirector. “This has met a very real needin a cost-effective manner, helping thepublic and area’ businesses alike. Thereis no down-side here.” For more infor-mation on the Access-To-Jobs Program,call Roscoe Brown at 317/613-FLEX (3539).
Ride-Share Program“It’s a whole lot cheaper to take a
car off the road than it is to put downthe pavement needed for that car,” saidMike Peoni in an August 13 article inThe Indianapolis Star. Headlined “City ToLaunch Ride-Sharing Effort”, the storyreported details on a new IndyGo
program to encourage ridesharing andvanpooling in the Indianapolis metro-politan area. Under a $3 million, three-year contract, URS Corporation of San
Francisco will develop and
promote theprogram, as it
has in SouthFlorida andAtlanta. Currently,
25,000 Atlantacommuters partici-
pate in the ride-shar-ing program.
Can it work here?“It can, if we target the right
companies,” says Thomas Cerny of URS.“Firms with 100 or more employeeswho work similar hours, such as manufacturers, are key to the program’ssuccess. We promote the benefits ofride-sharing to these companies, includ-ing higher employee retention and asavings in parking,” he explains.Employees are encouraged to participatewith guarantees of free rides home, incase of emergencies such as a sick childor unexpectedly being asked to worklate. In addition, participants enjoy savings in vehicle operation, repair and
IndyGo Initiatives(from page 14)
cont on page 16, see IndyGo Initiatives

P A G E S I X T E E N
maintenance, in addition to the promiseof eventually shorter travel times(because of reduced congestion).
“Census 2000 data suggests therewill be huge initial resistance for peopleto get out of their cars,” acknowledgesElizabeth Johnson, IntergovernmentalRelations Manager. (See Irons In the Fire,this issue). “But that doesn’t mean weshouldn’t start planning for the futurenow,” she says. “And this city’s futurehas to embrace a variety of alternativetransportation options.”
Peoni concurs. “Buying up therights-of-way for highway expansion hasbecome too expensive. We are literallyrunning out of room,” he says. “I thinkarea residents are willing to try alterna-tives to the single occupant vehicle likecarpooling or light rail. Until now, theyjust haven’t had many opportunities.”
IndyGo plans to start workingwith URS on its Rideshare Program asearly as this fall. In several years, theprogram could accommodate as many as10,000 participants and offer a variety ofmobility options, including ride-matchingand vanpool services organized by company or geographic area.
“Initiatives like these, and all ofthe strategies proposed in our 5-YearPlan relate directly to improving customer service, operational efficiency,and the way IndyGo is perceived bypotential customers and regional deci-sion-makers,” says Mary Lynn Ricks,IndyGo Public Affairs Director. “That’sbecause they were developed by listeningto our customers and attendees at neigh-borhood meetings around the city. Wewill continue to encourage public inputin IndyGo’s implementation process,”she says. “Our customers are really thebest improvement planners we have.”
For more information on IndyGo’salternative transportation initiatives or5-Year Plan, call Roland Mross at317/635-2100.
(from page 15) IndyGo’s 5-Year Implementation Plan
(2001-2005) proposed these improve-
ments for its first year:
Enhance Routes - Review recommendations from the Indianapolis TransitSystem Review of October, 1999. IndyGo now has 36 fixed bus routes. Threeof those routes carry 28% of IndyGo’s riders. Six routes carry 50%! As part ofroute enhancement, IndyGo will attempt to identify/implement lower costoptions for serving riders along poorly performing routes, expand AM/PMCommuter Express Service, expand Access-to-Jobs service using a new $1 million grant and $1 million local match, assess/improve daily operations,
and enhance Open-Door Service for seniorsand the disabled to improve responsiveness.
Implement Advanced Technology -Acquire/deploy Automatic Vehicle Location(AVL) system hardware and software to
aid IndyGo’s dispatch and communica-tions, and train
AVL manage-ment/opera-tion personnel.
ExpandPublic RelationsProgram -Increase partici-pation in neigh-borhood meetings,expand marketingservices to increasepublic awareness,and increase publicrelations staff.
Establish A Downtown Circulator System - Establish a permanent circulator that will connect major downtown destinations; serve downtown residents, commuters and visitors; and improve bus operations/congestion.
Establish A Downtown Transit Center - Construct a downtown transitcenter that will enable IndyGo to streamline its existing fixed route service, andenhance the level of passenger service and amenities.
Position IndyGo To Provide Regional Transit Service - Expand regionaltransit services through programs like Commuter Assistance.
Enhance Bus Shelter Program - Establish a bus shelter design to be consistently used that will provide opportunities to post useful information andmaximize advertising revenues.
Increase Seasonal Route Services - Enhance transit service offered forColts, Pacers and Race events
PAGE SEVENTEEN
cont on page 18, see Airport Deployment
Irons In The Fire
Klika Departs INDOTIndiana Department of Transportation Commissioner,
Cris Klika, surprised many when she resigned her post onTuesday, August 14, to stay at home with her young daughter,Piper. “I’ll miss my many friends and colleagues,” Klika said, “but this is the right choice, right now, for my family.”
Klika hadbeen withINDOT for 13years, the lasttwo asCommissioner.As such, sheoversaw thestate’s 11,000miles of highwayand worked withplanning partnerslike the MPO toprogram alternativemodes of travelinto transportationsystems. “We’ll defi-nitely miss Cris and thefocus she brought to thejob,’ says Mike Peoni,MPO Manager/MasterPlanner.
In the Autumn1999 issue of teMPO,Klika cited an internalfocus for her tenure asCommissioner with personalgoals being 1) keeping INDOT’s best people despite the allureof private sector salaries, and 2) improving the INDOT plan-ning process. The former she hoped to achieve by offeringextreme job satisfaction and the ability to serve the public andinfluence policy; the latter she characterized as “performancebased budgeting” required to insure that INDOT continued toget “maximum bang for every buck.” Prior to Klika’s appoint-ment, INDOT’s annual construction budget had doubled from$350 to $700 million (out of a total agency budget of $1.1 bil-lion). “I want to relate our budget investments back to the per-formance of our transportation system,” she said at the time,”because that’s what the public cares about and comments on.”
Klika often used a circular model to demonstrate howshe saw INDOT’s working relationship with the public.“INDOT puts its efforts into improving our transportation
system, which serves the public, who gives us feed back onhow we’re doing, so we can make more improvements,” she’dsay. During Klika’s term as Commissioner, INDOT wasinvolved with building trails, pedestrian and bike route sys-tems (see related story, page one), traffic-calming techniquesand other quality-of-life issues. “All of these efforts are inresponse to the diverse perspectives and interests of the publicwe serve,” Klika says.
Cris Klika’s last day asINDOT
Commissioner wasSeptember 7. J.Bryan Nicol, a former INDOTDeputyCommissionerunder Klika andmost recentlyDeputy Chief-of-Staff for GovernorO’Bannon hasbeen appointed tosucceed her.teMPO will profileMr. Nicol in afuture issue.
Census DataAs reported
in the Spring 2001issue of teMPO,further Census2000 data was
released in June andJuly of this year. Andy
Swenson, Principal Planner -Information Resources and Policy Analysis with the City ofIndianapolis, who served as primary liaison to the U.S. Bureauof the Census, has made this information available and accessi-ble to area residents and decision-makers alike at a variety ofvenues, including the June Citizens Advisory Committee meeting. There, Swenson reported the following on populationgrowth in our Metropolitan Statistical Area (MSA) since 1990:
• The Indianapolis MSA population grew by 16.44%since 1990.
• Of the nine counties in the MSA, Hamilton Countygrew the fastest, both in real numbers (73,804) and percentageincrease (67.7%).
cont on page 18, see Irons In The Fire

P A G E E I G H T E E N
• Marion County grew by only 7.9% for the same period.However, because of its larger starting population, that increasetranslates into 63,285 new residents – about the same asadding two Greenwoods over the last 10 years!
• Hendricks Co. was the second fastest growing bypercentage (37.5%) and real number increase (28,376);Johnson Co. was third (30.8%, 27,110).
• Marion County’s population diversity increaseddramatically over the last ten years.
• Marion County’s Hispanic populationgrew about 300% since 1990; AfricanAmericans increased about 20%.
• White and minority residents are moving to thesame areas, in about the sameproportions.
• The county’s fastestgrowing residential areas arenot currently well served bypublic transportation.
• Areas well-served bytransit maintained their population base overthe last 10 years. These areas generally have ahigher population density than other MarionCounty neighborhoods.
• Overall, Marion County’s averagepopulation density has remained constant.
“Community characteristics informa-tion, such as which neighborhoods grew thefastest, and age/race/ethnicity of the MSA’snearly 200,000 newest residents, is used ingrant-writing, as a basis for marketing studies,and for forecasting purposes,” Swenson says.“This information is also crucial to the MPO fortransportation planning, but the special trans-portation data set, gathered from the Census’long form questionnaire, will not be processedand released until late 2003.”
Still, some transportation-specific censusfindings have been reported in the local pressthat have a direct bearing on the efforts oftransportation planners to incorporate alter-native travel modes into our regional system(See IndyGo Initiatives, page 1, this issue). TheAugust 13 issue of The Indianapolis Starreported the following from the Census2000 Supplementary Survey:
• Indiana ranks 8th among states with the highest percentage of workers traveling to work by personal car, truckor van. More than nine out of every ten Hoosiers do so.
• Of those who do, eight out of every ten commute towork alone. This earned Indiana 10th place in the “solitary
drive” category.• Nearly three out of four Indiana commuters
can get to work in less than 30 minutes. This ranksIndiana in 20th place nationally in commute times,right behind Rhode Island — a state so small that it
can be traversed in about an hour. • For Hoosiers who currently
rely on public transit systems, thenews is not as good. Just over a thirdof them can get to work in thirtyminutes.
“That’s why we’re increasingand enhancing our alternativemobility options,” says Mike Peoni,AICP, MPO Manage/Master Planner,“and why IndyGo is implementingits 5-Year Plan(see related story, page
one). “We don’t want area residentsseeking mobility options to have tosacrifice time or convenience.”
For more information on Census2000, or its impacts on our regional trans-portation process, contact Andy Swenson
at 317/327-5132 ([email protected]).
Special Neighborhood StudyFollow-Up
The Special Neighborhood Study of theGlendale Area, subject of teMPO’s June, 2001Special Edition, concludes this month withthe release of its final report which will provide facility recommendations and designguidelines for the study area, as well as otherestablished neighborhoods throughout theIndianapolis region. The purpose of this prototype study was to consider strategies forimproving neighborhood access to pedestrian,bicycle and transit facilities. Study findingswill also contribute to the MPO’s regionalpedestrian and bicycle plans.
“The Special Neighborhood Study of theGlendale Area reflects the MPO’s general
mission to plan/coordinate improvements to the
Irons In The Fire(from page 17)
cont on page 19, see Irons In The Fire

P A G E N I N E T E E N
regional transportation system, including the accommodation ofalternative travel modes,” explains Mike Peoni, AICP, MPOManager/Master Planner. “The study also addresses more specificMPO goals, such as improving air quality through reducedautomotive emissions andaddressing mobility as a quali-ty-of-life issue.”
The one-mile squarearea around Glendale Mallwas selected for study becauseof its sizeable population,busy thoroughfares, multiplebus routes, variety of retailand entertainment destina-tions, proximity to greenwaycorridors, and absence ofexisting walking, bicyclingand transit facilities. This areais bound by Olney andPrimrose Streets on the eastand west and 65th and 56thStreets on the north andsouth. During the course ofthe study, a variety of mobili-ty-enhancing options wereconsidered.
As part of the evaluationprocess the MPO, its planningpartner IndyGo and StorrowKinsella Associates, a landplan-ning and design firm, invitedall who live or work in themile-square study area toattend three NeighborhoodWorkshops held in theGlendale Mall CommunityRoom where they could participate in the planning process andcommunicate directly with team members. The first Workshop,held on May 10, included presentations on how walk-ableaccess to local destinations, such as stores, parks and schools,and to IndyGo bus routes for longer commutes, can improvequality-of-life. Using large maps and aerial photographs, teammembers described the study’s timeline and objectives for atten-dees. Slide presentations also showed what other communitieshave done to improve mobility. In addition, those present weresurveyed for their suggestions for improving sidewalks, calmingtraffic and introducing bike and transit facilities.
Since the publication of teMPO’s June Special Edition,the study’s remaining workshops have been conducted.Seventy-six attendees at the Second Neighborhood Workshop,held July 12, worked with the MPO and its planning anddesign team to develop a variety of complementary conceptsfor making the Glendale area more pedestrian- and bicycle-
friendly, and better served bypublic transit. In addition,members of the public volunteered comments, suggestions, critiques and concerns for consideration.
“That meeting was part ofour ‘visioning phase’ whereactual walking, biking, busingand traffic-calming possibilitieswere considered,” saysStephanie Belch, the MPOSenior Planner in charge of thestudy. “During our third andfinal workshop, we reviewedthe ‘Big Idea’ (a walk-able,bicycle-friendly, less automo-bile-defined neighborhood withnorth-south and east-westregional access by bicycles and transit), plus specific recommendations and implementation ideas.”
At the third and finalNeighborhood Workshop, heldon Wednesday, August 22, from4 - 8 PM, the framework of recommended solutions andimplementation strategies thatresulted from the preceding twosessions, as well as study teamanalysis, was reviewed.Attendance approached 200
persons.“The framework vision plan we presented is a composite
of seven systems that work together for bicycle, pedestrian,public transit mobility and accessibility for the Glendale-areaneighborhoods,” explains Meg Storrow, project consultant.These seven systems include the Glendale Block, PublicTransit, Parkway, Green Streets, Off-Street Paths, Traffic-Calming and Sidewalks. (see visual, page 20).
Irons In The Fire(from page 18)
cont on page 20, see Irons In The Fire

P A G E T W E N T Y
At time of publication, the results from the ThirdNeighborhood Workshop, and a summary from the Study’sFinal Report were not yet available. Look for this informationin future issues of teMPO, or contact Stephanie Belch, MPOSenior Planner at 317/327-5136 ([email protected]).
ConNECTions On-CueAs promised, the Draft Environmental Impact Statement
for the Study of Northeast Corridor Transportation will be avail-able for public review and comment within the next 30 days,now that the federal review and revision phase has been com-pleted. Area residents will have a minimum of 60-days in whichto review and comment on the document’s findings concerningthe impact eight proposed transportation options will have onour regional and human environment. These options includehighway expansion, and bus and rail-bus transit systems.
Copies of the entire document will be available for
review at government offices, public libraries throughoutMarion County and in the municipal offices of neighboringcommunities in Hamilton, Hancock, Johnson, Hendricks andBoone Counties located within the MPO study area (Call MikePeoni at 317/327-5133 for exact locations.) In addition, anExecutive Summary of the Draft Environmental ImpactStatement will be available on both the MPO and conNECTionsweb sites (www.indygov.org/indympo, www.indygov.org/con-nections).
The MPO will make the availability of this informationknown, and promote participation in the review process,through display and classified advertising in the local press,media advisories to local television and radio stations andnewspapers, direct mail sent to neighborhood associations, andits monthly Citizens Advisory Committee meetings which arebroadcast on WCTY, the government access channel (Channel16, COMCAST & Time Warner).
Irons In The Fire(from page 19)

PAGE TWENTY ONE
ourselves out of congestion”; and, 4) there is still region-wide support for the establishment of an RTA and/or thedevelopment of a Regional Mass Transit Service Plan.
As a result of the Policy Committee’s request, a 13-member RTA sub-committee was formed to workwith MPO Staff, which included representativesfrom Southport, Lawrence, Cumberland,Plainfield, Westfield, Carmel, Greenwood,IndyGo and the City of Indianapolis. This groupmet nine times over seven months and conclud-ed that the establishment of an RTA would pro-vide our region with its best opportunity to havea good road system and a good transit system –a combination that would help promote betterair quality, a stronger economy and better quali-ty-of-life.
RecommendationOn June 13, 2001, the RTA Sub-committee
recommended to the Policy Committee theestablishment of an RTA as allowed by IndianaLaw (Indiana Code 36-9-3). That enabling legis-lation called for the Indiana Department ofTransportation (INDOT) to designate the RTA’splanning district, which it did as “all of Marion,Hamilton, Madison, Hendricks, Shelby, Johnson,Morgan, Hancock and Boone Counties and allmunicipalities within. In so doing, INDOT onlydefined the boundaries in which an RTA couldbe formed. It is still the choice of each munici-pality whether or not to join the RTA.
The MPO supports the establishment of anRTA as proposed because it could function as achampion of transit as part of the solution toregional congestion. It would provide a forumfor the region to work together and would haveincreased lobbying power and the ability toleverage state and federal funding opportunities.As a group of communities dedicated to work-ing together to identify and developtransit opportunities, an RTAgives transit its best chance ofmaking a valuable contributionto our regional transportationsystem.
As proposed, an RTA does not:• replace or duplicate the MPO planning functionThe MPO has a different study area and is federally
mandated to plan for all aspects of our regional transporta-tion system. The RTA focuses on transit only.
• eliminate the need for roadway improvementsThe Indianapolis regional Transportation Plan has
prioritized $3.2 billion dollars of roadway expansion pro-jects over the next 23 years. Of this amount, $2.7 billionwill be spent on improving the interstate system and other
state facilities.
• have taxing authorityAdditional legislation would be
required to give the RTA this authority.• have the power of eminent domainThat power is not granted to the RTA in Indiana Code
36-9-3, the enabling legislation.
Current StatusThe Policy Committee agreed with the recommenda-
tion and instructed the sub-committee to work with legisla-tive bodies within their respective communities to facilitatethe formation of an RTA. The sub-committee’s intention hasbeen to have Indianapolis/Marion County take the lead inestablishing an RTA by ordinance. Other counties andmunicipalities could then join the RTA via resolution.
The RTA proposal (Proposal No.330, 2001)was introduced to the Indianapolis/MarionCounty City-County Council on June 25,
2001, and was referred to the Rules andPublic Policy Committee. It was dis-cussed by the Committee at its August7, 2001, meeting. Some members ofthe Committee expressed serious concerns with the proposal, most of
which pertained to the issue of taxingauthority. There was much debate aboutthe language of the enabling legislationand whether or not it, in fact, grants taxingauthority. In the opinion of the RTA Sub-Committee and the City’s legal counsel, the RTA does not have taxingauthority. Further, an amendment to the
proposal was introduced andintended to underscore this fact.
At press time, this issueremains before the Rules andPublic Policy Committee, andthe MPO will continue to work
with the Committee to address any of its questions andconcerns. For more information on the RegionalTransportation Authority, contact Mike Peoni at 317/327-5133 ([email protected]).
Questions & Answers(from page 2)

PAGE TWENTY TWO
and to program year 2002 of the 2002-2004 IRTIP:
• The preparation of the FinalEnvironmental Document for theconNECTions study of the NortheastCorridor with work to commence in2001 or 2002 with a total cost of$933,834 ($747,067 federal, $186,767state match).
• Protective Buying for anInterchange Modification project at I-70and Mt. Comfort Road with acquisitionto commence in 2001 or 2002 with atotal cost of $1,275,000 ($1,020,000 infederal funds and a $255,000 statematch).
Requested by Johnson CountyInclude the following Group I
Urban STP funded project to pro-gram year 2002 in the 2002-2004IRTIP. Note that the project was
previously approved for funding, buthas experienced delays.
• The Land Acquisition (LA)phase and the Construction (CN) phasefor the Intersection Improvement pro-ject on Smith Valley Road at PetermanRoad/Berry Road. The cost of the LAphase is $509,850 ($407,880 federal,$101,970 local match). The cost of theCN phase is $600,000 ($480,000 feder-al, $160,000 local match).
“As the IRTIP amendment processgoes, this slate of proposed amendmentsis comparatively small,” notes Dearing.
Upon the approval of the TechnicalCommittee of the Indianapolis RegionalTransportation Council (IRTC), they willbe presented for approval to the IRTC-Policy Committee on September 12, andthe Indianapolis MetropolitanDevelopment Commission onSeptember 19. For more information onthese amendments, or to express yourcomments, contact Mike Dearing at317/327-5139 ([email protected]).
IRITP Amendments (from page 3)

PAGE TWENTY THREE
CAC Meeting Survey
Once upon a time, the Citizens Advisory Committee (CAC)met on a quarterly basis to advise the MPO and, by exten-
sion, the Indianapolis Regional Transportation Council (IRTC) ona variety of transportation-related subjects. By attending only fourregularly scheduled meetings a year, plus the occasional, specialmeeting called to address unanticipated issues, CAC members andall interested parties could keep abreast of the regional transporta-tion planning process and make their opinions known.
That all changed in the Fall of 1998 with the start of theconNECTions study of Northeast Corridor Transportation (see
related story, page 20). It was decided at that time that the CACshould meet on a monthly basis to provide timely input into whatwas (and still is) considered one of the most important and far-reaching transportation studies to impact regional mobility. Sincethat time, CAC meetings have been held on the fourth Tuesday ofthe month, eleven times a year (never in December). Now, withthe imminent release of conNECTions’ Draft Environmental ImpactStatement, the MPO is wondering whether or not people want toreturn to the relative leisure of a quarterly meeting schedule.
“We’re really looking for people’s input on this,” says MikePeoni, AICP, MPO Manager/Master Planner. “CAC meetings are oneof our best ways to educate the public, and to gather their input,”he explains, “but sometimes there just aren’t enough ‘hot’ topics toflesh out a monthly agenda. On the other hand, monthly meetingshave given us the opportunity to respond to public requests forinformation and to report on a wider array of issues that impactour regional transportation system,” he acknowledges.
Currently, only four CAC meetings are penciled in for 2002(see 2002 Meeting Schedule at right). “We can always call addi-tional meetings if the need arises,” Peoni says. “Or, if people reallywant them, we’re happy to continue planning a full year ofmonthly meetings, as we have been.”
So, what do you think? If you’re one of the 50 – 100 peoplewho regularly attend the monthly CAC meetings, or one of thethousands who watch them on WCTY-TV (Channel 16, Comcastand Time Warner) or read about them in CAC Minutes, let ushear from you. Use the attached response card below or contactMike Peoni directly at 317/327-5133 ([email protected]).
CAC SURVEYPlease fill out this survey and fax it to 317/327-5103 or mail it to:Mike Peoni, Metropolitan Planning Organization, 1841 City-CountyBuilding, 200 East Washington Street, 46204-3310. 1. I want Citizens Advisory Committee meetings ���� on a monthly basis ���� on a quarterly basis, or as needed
2. If there are fewer CAC meetings, I think the information pre-sented at them will be:���� more germaine to the transportation planning process.���� more limited to just a few transportation planning initiatives.
3. I currently participate with the Citizens Advisory Committeeby (please check all that apply)���� attending monthly meetings. ���� watching meetings on WCTY-TV (Ch. 16, Comcast
& Time Warner).���� reading about the meetings in CAC Minutes.(Optional)
Name _______________________________________________
Address ______________________________________________
City________________________ State _____ Zip ___________
February 28at 9:00 a.m.
June 6at 9:00 a.m.
August 29at 9:00 a.m.
October 31at 9:00 a.m.
March 13at 9:00 a.m.Ste. 2501, CityCounty Bldg.in Indianapolis
June 12at 9:00 a.m.Ste. 2501, CityCounty Bldg. inIndianapolis
September 11at 9:00 a.m.Ste. 2501, CityCounty Bldg. inIndianapolis
November 13at 9:00 a.m.Ste. 2501, city
County Bldg. inIndianapolis
January 22
February 26 at 6:30 p.m. CONFIRMED
March 26
April 23
May 21 at 6:30 p.m. CONFIRMED
June 25
July 23
August 27at 6:30 p.m. CONFIRMED
September 24
October 22at 6:30 p.m.CONFIRMED
November 26
February 1Submit new projects for 2003-2005 IRTIP
February 81st quarter IRTIP amendmentdeadline
March 20 MDCapproval of IRTIPamendments
May 172nd quarter IRTIP amendmentdeadline
June 19MDC approval of2003-2005 IRTIP& 2002-2004amendments
June 28Deadline to send2003-2005 IRTIPto INDOT
August 93rd quarter IRTIP amendmentdeadline
September 18MDC approval of IRTIP amendments
October 114th quarter IRTIPamendment deadline
October 31MPO call for sub-mittal of new localprojects for the2003-2005 IRTIP- due date isJanuary 31, 2003
November 20MDC approval of IRTIP amendments
2002 IRTC and CAC Meetings & IRTIP Schedule
TechnicalCommittee
PolicyCommittee
CitizensAdvisoryCommittee(CAC)
IndianapolisRegionalTransportationImprovementProgram (IRTIP)Schedule
Indianapolis Regional Transportation Council (IRTC)
Please note that all meeting locations, dates and times are subject to change.

PAGE TWENTY FOUR
Metropolitan Planning Organization1841 City-County Building200 East Washington StreetIndianapolis, IN 46204-3310
in the back of the Owners Manual is anorder form to make the ordering by mailof any desired documents more conve-nient.
Information RequestsThis section lists the Division’s
most frequently asked questions. Thislist, compiled by staff members over theyears, features the names and telephonenumbers of the person best qualified toanswer each question. Examples include“How do I obtain census information forMarion County and elsewhere inIndiana?” (Andy Swenson, 327-5132),“Who should I contact to report a zoningviolation in my neighborhood? (Mayor’sAction Center, 327-4622), and “What isthe future of the rail line in my neighbor-hood?” (Steve Cunningham, 327-5403).
Glossary of Planning andCommunity Development-Related Terms and Acronyms
This section, like teMPO’s own Acro-nymble, provides definitions for many ofthe terms planners use. In this case, how-ever, the listing goes on for 35 pages!
There is no cost associated withreceiving your own Division of PlanningOwner’s Manual. To request one, call 327-5151 or request in-person or by mail atDepartment of Metropolitan develop-
ment, Division of Planning, 1841 City-County Building, 200 East WashingtonStreet, Indianapolis, IN 46204. Most ofthe information contained in the Owner’sManual is also available on-line at theDivision of Planning web site (www.indygov.org/dmdplan). For moreinformation on the Owner’s Manual, or toreport errors or suggest changes, contactBob Wilch at 317/327-5115 ([email protected]).
Owner’s Manual (from page 5)
Y o u r M P O s t a f f. . includes these people who would be happy to address your comments or questions on
any aspect of the transportation planning process:Stephanie Belch • Senior Planner 317/327-5136Steve Cunningham • Senior Planner 317/327-5403Mike Dearing • Principal Planner 317/327-5139Kevin Mayfield • Planner 317/327-5135Michael Peoni, AICP• Manager/Master Planner 317/327-5133Sweson Yang, AICP • Chief Transportation Planner 317/327-5137For more information on our regional transportation planning process, visit the MPO web site atwww.indygov.org/indympo.
Printed on paper with recycled content

INDIANAPOLIS REGION'SINDIANAPOLIS REGION'S
KEEPING PACE WITH OUR TRANSPORTATION NEEDS
NECT Options & Impacts . . . . . . . . Page 1
Midwest Regional Rail System . . . Page 1
Q & A. . . . . . . . . . . . . . . . . . . . . . . . . Page 2
MPA MAP . . . . . . . . . . . . . . . . . . . . . Page 3
2002-2004 IRTIP Amendments . . . Page 4
Neighborhood Study Extended . Page 5
Sound Walls . . . . . . . . . . . . . . . . . . Page 7
Irons In The Fire. . . . . . . . . . . . . . Page 9
coMPOnents . . . . . . . . . . . . . . . . . Page 10
IndyGo IndyWorks . . . . . . . . . . . Page 13
Fall Follow-up Feast
I n honor of Autumn, this issue ofteMPO celebrates the fruits of the
past year’s labor – a bumper crop ofregional transportation planning initia-tives, as varied as they are rooted in theneeds of our transportation systemusers. Some, planted years ago, are nowbeing followed-up with official publicreview and comment periods (NECTOptions & Impacts). Others are still har-vesting input to share with study deci-sion-makers and the elected officialswho serve on the Indianapolis RegionalTransportation Council with whom yourMPO shares its recommendations (IRTIPAmendments, Neighborhood StudyExtended). Still others offer further infor-mation on subjects of past interest nowincluded as ingredients in the region’stransportation recipe (Sound Walls,IndyWorks). As always, you’ll find thesesubjects, and more, in teMPO!
In This Issue
NECT Options & Impacts
A s previously reported in teMPO (Summer, 2001), the Draft Environmental ImpactStatement (DEIS) for the conNECTions Study of Northeast Corridor Transportation
has been completed and made availablefor public review and comment. OnSeptember 28, a notice of the document’s availability was publishedin the Federal Register by the U. S.Environmental Protection Agency(EPA). More than 275 copies of thefull document were distributed toagencies and organizations interested in the project, includingthe Indiana Department ofEnvironmental Management, the FederalHighway and Transit Administrations, and the SpinnakerCove and Eastwood Neighborhood Associations.
This report offered findings on the impacts that eight proposed transportationoptions are likely to have on the region’s human and natural environments. Theseoptions, intended to reduce traffic congestion and increase mobility throughout the
cont on page 16, see NECT Options & Impacts
A U T U M N 2 0 0 1
V O L U M E F I V E
I S S U E T H R E E
Midwest Regional Rail System
I f you think passenger rail service is a thing of the past, think again.According to a nine state, multi-agency high speed rail initiative, and the
majority of Hoosiers expressing comments at seven Indiana-based public meetingsheld throughout the summer, rail is not only here to stay; it’sthe wave of the future.
The Midwest Regional RailInitiative is a cooperative, multi-agency effort to develop anine-state, 3,000 mile regionalpassenger system. The statesinvolved, including Illinois,Indiana, Iowa, Michigan.Minnesota, Missouri, Nebraska, Ohio and Wisconsin, would be partnered with ahigh speed rail provider yet to be determined whose long-distance trains would
cont on page 14, see Regional Rail System

AQ
P A G E T W O
I n Q & A, members of your MPO staff answer questions posed to them via voicemail, e-mail, regular mail or in-person. In this issue, Mike Peoni addresses the
nature of the MPO’s planning responsibilities, the importance placed on publicinput, and how that input impacts the transportation planning process.
The MPO always makes a big deal about encouraging publicparticipation in its planning studies, but I’m wondering how reala contribution I can make. I know transportation budgets are setyears in advance, so how can my ideas and suggestions get funded?
— asked in a private one-to-oneconversation at a public meeting.
The focus of the MPO’s work is typically directed toward major transportationimprovement projects that involve the use of federal funds for implementation.
The MPO is the primary transportation planning agency in the greaterIndianapolis Metropolitan Area. That’s what we do; we plan. We don’t implementconstruction projects ever. Rather, we work with transportation decision-makers andimplementing agencies to coordinate the process for the entire region: gatheringinformation and technical findings, providing analysis, offering a system-wide perspective on project needs, priorities and impacts. The MPO conducts studies toanalyze transportation system needs in an objective and comprehensive manner inorder to help elected officials set priorities so that the federal dollars available to thisarea are spent where they are most needed. Projects are implemented by state andlocal jurisdictions such as the Indiana Department of Transportation and theIndianapolis Department of Public Works.
As the region’s primary planning agency,one of the MPO’s core responsibilities is thedevelopment of the Indianapolis RegionalTransportation Plan. With the help of trans-portation planners, engineers, elected officialsand the public, this Plan ensures that facilitiesand services required to support the mobilityneeds of our community and its future growthare anticipated and available. As our longest-range planning tool, this document identifiestransportation projects needed over the next20+ years. Keep in mind, however, that our 20years start today.
However, because the long-range planningnature of this document, it has always been achallenge to get the public interested, investedor involved in its development. Short-term, implementation decisions are easier torelate to. They just seem more real to most people. Most may not realize that no
ACRO-NYMBLE
Here’s a list of the acronyms used inthis issue. Refer to it to keep your
understanding letter-perfect.AICP - American Institute of Certified
PlannersCAC - Citizens Advisory CommitteeCIBA – Central Indiana Bicycling
Association CIRCL - Central Indiana Regional
Citizens LeagueCIRTA – Central Indiana Regional
Transit Alliance CMAQ – Congestion Mitigation & Air
QualityCN – Construction (IRTIP code)conNECTions - Study of Northeast
Corridor TransportationDEIS – Draft Environmental Impact
StatementDMD - Department of Metropolitan
DevelopmentEPA –Environmental Protection AgencyFHWA – Federal Highway
AdministrationFY – Fiscal Year (IRTIP code)HHPA– Hoosier Heritage Port AuthorityIBC – Indiana Bicycle CoalitionIIA - Indianapolis International AirportINDOT - Indiana Department of
TransportationIPTC/IndyGo - Indianapolis Public
Transportation CorporationIRTC - Indianapolis Regional
Transportation CouncilIRTIP - Indianapolis Regional
Transportation Improvement Program ITS – Information Technology System LA – Land Acquisition (IRTIP code)MDC – Metropolitan Development
CommissionMPA - Metropolitan Planning AreaMph – miles per hourMPO - Metropolitan Planning
OrganizationMRRS – Midwest Regional Rail SystemMSA – Metropolitan Statistical AreaNECT – Northeast Corridor
TransportationPE – Preliminary Engineering
(IRTIP code)Q & A – Question and AnswerSTP – Surface Transportation ProgramTE – Transportation Enhancement
(IRTIP code)
cont on page 12, see Q & A
&
Mike Peoni, AICPMPO Manager/Master Planner
QUESTIONSANSWERS

P A G E T H R E E
I N D I A N A P O L I S M E T R O P O L I T A N P L A N N I N G A R E A
Boone
Morgan JohnsonShelby
Metropolitan Planning Area(Projected Urbanization By The Year 2020)
coNECTions Study Area
Glendale Neighborhood Study Area
MPO Modeling Area(Studied Because Of Its Proximity To, And Influence On, MPA Traffic)
Eagle
Pike
Lincoln
Wayne
Buck
Creek
Sugar
Creek
White
River
WarrenWashington
Perry FranklinDecaturGuilford
Lawrence
Delaw
are
Hancock
Washington
Hendricks
Pleasant
Clay
Washington
Center
Hamilton
Marion
Fall
Creek
Note: all roads onboundary lines areexcluded exceptMarion County’s eastand south county lines.

P A G E F O U R
Road to Buck Creek in Cumberland. The project will be doneas part of the added travel lanes project. The PE cost is $50,000($40,000 federal, $10,000 local match).• Preventative Bridge Maintenance at various locations includingI-65 northbound and southbound structures over Dr. MartinLuther King Jr. Street, I-65 northbound and southbound overClifton Street, I-65 northbound and southbound over W. 71st
Street & Bushes Run, the ramp to northbound I-65 over BushesRun, and thesouthbound I-65ramp to 71st
Street overBushes Run . The PE cost is$50,000($40,000 federal,$10,000 Statematch). The CNcost is $450,000($360,000 federal,$90,000 Statematch.• Purchase of twoadditional vans inprogram year2002 for the“Hoosier Helper”van program on I-465. The totalcost is $80,000with $64,000being federalCongestionMitigation & AirQuality (CMAQ)funds (Stateapportionment)and $16,000 being
State match.
Requested by he IndianapolisDepartment of Parks and Recreation
Include the following project using Group I Urban SurfaceTransportation Program (STP) Funds in program year 2002 ofthe 2002-2004 IRTIP:• Add the Pre-scoping Study for the Pennsy Bicycle/PedestrianTrail to Fiscal Year (FY) 2002. This study was programmed inFY 2001, but has experienced a delay in initiation. The cost ofthe study is $25,000 with $20,000 being federal funds; $5,000local match.
cont on page 6, see IRTIP Amendments
2002-2004 IRTIP Amendments
At the October 23rd meeting of the Citizens AdvisoryCommittee (CAC), MPO Principle Planner Mike Dearing
presented newly proposed amendments to the 2002-2004 TheIndianapolis Regional Transportation Improvement Program(IRTIP). As previously reported in teMPO, the IRTIP documentsfederally-funded transportation improvement projects proposed for our region using available dollarswithin a three-year time frame. As such, it isconstantly amended to reflect the newlyrecognized needs and shifting priorities ofthe MPO’s planning partners.
An important aspect of gettingthose projects approved for implementa-tion is providing the opportunity for thepublic to review and comment on them.In May, 2000, the MPO started runningdisplay advertising in the City/Statesection of The Indianapolis Star inconjunction with its traditionalclassified notices to promoteawareness and review of IRTIPamendments (see coMPOnents,page 10). The ads and clas-sified notices announcingthe following amendmentsran in the October 22 and23 issues of TheIndianapolis Star and theOctober 26 issue of TheIndianapolisRecorder.
Requested theIndianaDepartment ofTransportation(INDOT) Add the follow-ing projects toprogram year 2002 in the 2002-2004 IRTIP: • The Construction (CN) phase for the IntelligentTransportation System (ITS) Communications System on I-74from 0.15 mile east of I-465 to London Road. The project willbe done as part of the I-74 rehabilitation project. The cost ofthe CN phase is $325,000 ($293,000 federal, $32,000 Statematch).• The Preliminary Engineering (PE) phase for a Streetscapingproject on US 40 (Washington Street) from German Church

Neighborhood
Study Extended
The Special Neighborhood Study ofthe Glendale Area which was the
subject of a teMPO Special Edition(June, 2001) and again featured in theSummer, 2001 issue (Irons In The Fire)has been extended beyond its scheduledSeptember completion date to accom-modate continuing interest and input.The purpose of the study is to identifyeffective strategies for increasing mobilityoptions within established neighborhoods.The study contract with consultantsStorrow Kinsella Associates, a landplan-ning and design firm, was extended tothe end of February 2002, with a draftreport due by the end of December andpresented to the Study ReviewCommittee for approval the followingmonth. Public comments will be includedand addressed in the final report.
The Metropolitan PlanningOrganization (MPO) made theannouncement via Media Advisory to 30+news sources on Thursday, October 11,resulting in radio, television and printcoverage. The Indianapolis Star ran a fol-low-up story on Wednesday, October 17,which stressed the MPO’s informationoutreach program and encouragedGlendale area residents to schedulegroup presentations on study findings.The study extension was also discussedat the October 23rd Citizens AdvisoryCommittee meeting. Additional presen-tations have been given to the Fairfield-Sylvan Neighborhood Association(October 17th), and several schools,churches and interested parties atNorthminster Presbyterian Church(November 20th).
The one-mile square areaaround Glendale Mall was selected forstudy because of its sizeable population,busy thoroughfares, multiple bus routes,many popular destinations, proximity togreenway corridors, and absence ofexisting walking, bicycling and transitfacilities. This area is bound by Olney
and Primrose Streets on the east andwest and 65th and 56th Streets on thenorth and south. When completed, thestudy will serve as a planning prototypewith the procedures used to conduct it,as well as its eventual facility recommen-dations and design guidelines, beingemployed elsewhere in the region. Studyfindings will also contribute to theMPO’s regional pedestrian and bicycleplans.
The Special NeighborhoodStudy has relied on informed public
participation to developa variety of comple-mentary concepts formaking the Glendalearea more pedestrian,bicycle, and transitfriendly. With its planning partner
IndyGo, and project consultant StorrowKinsella Associates, the MPO hostedthree Neighborhood Workshops over thespring and summer where hundreds ofGlendale Area residents voiced their sug-gestions and concerns about walking,biking, busing and traffic-calming strate-gies. At the most recent of these, held onAugust 22 in the Community Room ofGlendale Mall, attendees reviewed specific recommendations for theGlendale Block, Public Transit, QuietStreets, Kessler Boulevard, Off-StreetPaths, Traffic-Calming, Sidewalks, BikeWays and Landscape and Urban ForestExtension.
“It’s a lot of information todigest,” says Stephanie Belch, MPOSenior Planner-in-charge. “We extendedthe study in order to give all interestedparties the opportunity to review thedraft recommendations in detail andexpress their opinions.” The MPO con-tinued its outreach program to churchesand schools that may be affected bysome of the study’s eventual recommen-dations, as well as to anyone within theStudy Area who requested a presenta-tion. “We tried to schedule a special presentation for any group that asked forone,” Belch notes. Also during thestudy’s extension, transportation engi-neers conducted additional traffic impactanalyses on recommendations concerningKessler Boulevard and several of thequiet street options.
The draft report, which incor-porates the study’s recommendations,findings and public comments, will bepresented to the Study ReviewCommittee in early January. It will thenbe made available for 30 days of publicreview and comment before going to theTechnical and Policy Committees of theIndianapolis Regional TransportationCouncil (IRTC). Ultimately, the study’srecommendations will be taken to theMetropolitan Development Commission(MDC) for approval.
Once approved by the MDC,the report will be made available to theappropriate implementing agencies,including the Department of PublicWorks (DPW), IndyGo and IndyGreenways. Actual implementation ofrecommendations will be the responsi-bility of the implementing agencies andwill be subject to available funding andcommunity acceptance criteria. TheMPO will monitor implementation status to evaluate the usefulness of thestudy and the viability of its recommen-dations.
For more information on theSpecial Study of the Glendale Area, con-tact Stephanie Belch at 317/327-5136([email protected]).
P A G E F I V E

For Indianapolis Parks GreenwaysInclude the following project using TransportationEnhancement (TE) Funds in program year 2002 of the 2002-2004 IRTIP:• Add the Construction phase for the Monon Rail Trail project(phases 4 and 5) from Fall Creek to 10th Street. The cost ofthe project is $1,250,000 with $1,000,000 being federal TEfunds and $250,000 being local match.
For the City of IndianapolisInclude the following projects using $2,000,000 ofTransportation Enhancement (TE) Funds as part of the Section6, Paragraph E2 of the Road Transfer Agreement betweenINDOT and the City of Indianapolis. The agreement reimbursedthe City for assuming the responsibility for the maintenance ofthe former the State Jurisdiction roadways inside of I-465 withthe exception of the Interstates. Note that the total cost ofthese two projects will be $2,500,000.• Add to 2002 the Construction (CN) phase for the preparationand installation of bicycle route signs on the primary bicycleroutes identified on the MarionCounty Bicycle Route Map.The cost of project is$500,000 ($400,000 federal,$100,000 local match);• The remaining $1,600,000of federal TE funds will beused for the PreliminaryEngineering (PE) phase,
the Land Acquisition (LA) phase and the CN phase for thedevelopment of the abandoned Penn Central rail corridor foran off-road bicycle/pedestrian trail on the east side ofIndianapolis. The PE and LA phases are being programmed inFY 2002. The approximate total cost of the PE phase is$250,000 ($200,000 federal, $50,000 local match) and theapproximate total cost of the land acquisition phase is also$250,000 ($200,000 federal, $50,000 local match). The CNphase is being programmed in 2003 with a total cost of$1,500,000 ($1,200,000 federal, $300,000 local match).
Dearing invited public comment on these amendmentsduring the CAC meeting and after, via phone (317/327-5139),e-mail ([email protected]) or mail (Mike Dearing,Principal Transportation Planner, Indianapolis MetropolitanPlanning Organization, 200 East Washington Street, CityCounty Building, Suite 1841, Indianapolis, IN 46204). Uponcompletion of the comment period, these amendments and allgathered input were presented to the Technical Committee ofthe Indianapolis Regional Transportation Council onNovember 1, 2001 and the IRTC Policy Committee onNovember 14, 2001 for approval. For more information onthe IRTIP amendment process, or on possible implementationof the amendments described here,contact Mike Dearing using thecontact information above.
P A G E S I X
IRTIP Amendments(from page 4)

Sound Wall
Pros & Cons
W ith the release of theconNECTions’ Draft
Environmental Impact Statement (DEIS)for public review and comment (seerelated story, page 1), there will berenewed discussion of the study’s eightpotential transportation strategies andtheir environmental impacts. Four of
these (H1A, H3, H5 and H6) involvehighway expansion which have raisedpublic concerns regarding traffic noise.
In the natural environment,increased highway noise can affect thehabitat conditions of resident wildlife,possibly causing changes in migration,hibernation and mating habits. In thehuman environment, increased highwaynoise can account for the levels of aggra-vation and stress reported by area resi-dents whose subdivisions, once wellbuffered from minimal sound intrusion,now suffer the affects of minimized right-of-way and maximized around-the-clocktraffic noise.
The residents of Avalon Hills in the Northeast Corridor have long registered their complaints over risingnoise levels, 24/7 traffic and the effectsboth have on their quality-of-life. Evenbefore conNECTions started to addressthe problems of congestion and lack-of-mobility in the region’s busiest travel corridor, these people were asking forrelief through sound barriers or noise
walls. When conNECTions narrowed itslist of potential transportation strategiesto eight, half of which involved increas-ing highway traffic-handling capacity, therequests for sound walls intensified.
“We certainly understand theproblems and appreciate the conditionsthat have people concerned,” says MikePeoni, MPO Manager/Master Planner. “The issue of sound walls is often raisedat our monthly Citizens Advisory
Committee meetings bylong-time residents whohave felt the effects ofincreasing highway noisefirst hand. But it’s impor-tant for people to under-stand that sound walls canonly do so much and thattheir use can often create asmany problems as theysolve.”
A sound solution?Transportation planners
share the goal of protectingarea residents from the negative effects oftraffic noise. However, they recognizewalls of any kind can be barriers to thegood as well as the bad, as likely to holdthings in as well as keepthings out. For example,walls that cut noise may alsoblock sunlight and obstructviews. Sound walls that runeast to west create a perma-nently shaded north sidewith the potential for chron-ic snow and ice build-up.Reflected heat and glare mayalso be problems. And, noisebarriers that block wind canalso create turbulence and stagnant air.
Another issue raised by the useof sound walls is driver stress. Unlesssound walls are placed very far apart,they can ricochet sound, and create amonotonous tunnel effect which measur-ably increases driver stress. This is whypotential sound wall installations need tobe evaluated carefully using, and why the
Indiana Department of Transportationbases its decisions on state and federalguidelines (see side bar, Want To KnowMore?, page eight). Of greater generalconcern is the well documented perfor-mance limitations of sound walls. Somepeople who request them have unrealis-tic ideas about what they can accom-plish. Highway traffic, measured from100 feet away, registers about 75 decibelson average. Because decibels are a loga-rithmic measurement, adding 10 decibelsdoubles a sound level. Sound walls areconsidered effective when they reducenoise by 10 decibels.
Another troubling aspect ofnoise barriers’ relative effectiveness is thatthey are proven to protect only a smallarea within their ‘noise shadow.’ Testsdone in Colorado Springs have shownthat sound walls significantly reducenoise “only at locations within about 20yards from the wall” – basically, the right-of-way. Also, reflecting noise from a wall’sshadow side may increase noise levels inthe opposite direction. And, as noted earlier, parallel walls ricochet sound,reducing their effectiveness from 10 deci-bels to a barely discernible 4-decibels.
“There are alternatives to the traditional sound wall,’ Peoni notes, “butnone offer a perfect solution. Forinstance earth mounds or berms are a little more effective in reducing sound,and more natural, but they require amuch wider right-of-way, therebyincreasing the required acquisition andimpact on neighboring residential areas.
P A G E S E V E N
DID YOU KNOW?Minnesota has the country’s mostextensive noise wall program and
receives about 600 calls requestingretrofits each year!
It will take an estimated 17 years for Minnesota to fund its top 48
highest priority noise wall projects.
DID YOU KNOW?The first noise walls in America
were built in 1968 along Californiainterstates.
According to the Federal HighwayAdministration, more than 1,300
linear miles of noise wall have beenbuilt along new freeways since
1968. The cost: nearly $2 billion inmostly federal dollars.
cont on page 8, see Sound Wall

Planted greenwalls are another naturaloption that help mitigate air pollutionlike berms,” says Peoni, “ but a 100-foot
band of dense trees and shrubs reducesthe noise level by five decibels or less.”
The most effective sound barri-ers, and those that require the leastamount of space are solid walls about afoot thick. Such barriers have the two-foldbenefit of blocking or deflecting soundwaves while also obstructing the view ofthe road. Studies have shown that visuallyremoving the sound source reduces theperception of noise and its accompanyingstress levels. But what about when thesight of the wall itself causes stress?
In its most recent figures, theFHWA estimates that America has a totalsound wall surface area of 80 millionsquare feet. Due in part to an aggressiveconcrete lobby, the vast majority of thatarea is blank concrete, even though manymaterials would serve as well. Brick,stone, metal, wood,plastic and laminatedglass have all been usedsuccessfully, since thindense, walls (concrete)and thicker, lighter ones(alternative materials)deflect sound equally.Other options includecomposite materials,such as aluminum onwood, rubber-coatedlead, porous concrete orplastic backed by crumb rubber, whichabsorb rather than deflect sound.
Cost of construction material isalways a consideration, but not necessari-
ly a limitation. Even when concrete ischosen, aesthetically pleasing installa-tions are possible. Precast concrete pan-els, the common choice because of theireconomy and versatility, can be textured,
colored while cast, stained inplace, or molded to appearlike surrounding materials,such as structural brick. Inone outstanding Arizonaexample, transportation plan-ners worked with artists andarchitects to cast southwest-ern imagery into sound wall
panels along the seven-mile PimaExpressway. Reusable rubberform-liners were layered,resulting in an ever-changingvariety of textures and sym-bols. The result: sound wallsthat are not only effective, butbeautiful, reflecting theindigenous character of theirlocale and serving as a sourceof pride for the travelers who pass themon a daily basis.
Successful installation examplesand material innovations notwithstand-ing, sound walls are not the best way tocontrol traffic noise. The best way wouldbe to control it at its source — throughauto engine and muffler improvements –rather than trying to wall off the listener.Failing that, rubberized pavement
(asphalt mixed with recycled tires), low-noise tire designs and even the noise-cancellation technology now being usedin Japan, all offer benefits. So would
slowing down traffic to reduce its decibellevels or increasing reliance on publictransit where noise reduction is easierand more cost-effective.
“We might suggest that INDOTconsider evaluating sound walls in a cer-tain location, but that’s as far as we cantake it,” says Peoni, of his planningagency. “It’s still up to the implementingagency to study the effectiveness andeconomy offered by these tools.”
For general information onsound walls, browse the web atwww.fhwa.dot. gov/environment/noise,www.dot.state.mn.us/govrel/position-
statements/ noisewal.html andwww.nonoise.org. For sound wallinformation specific to the State of
Indiana, see the box on this page.………………………………………Facts contained in this article came from ASound Solution? by Kim Sorvig in the April, 2001issue of Planning Magazine. They are reprintedhere with his permission. Mr. Sorvig is co-author of Sustainable Landscape Construction: AGuide to Green Building Outdoors and a con-tributing editor to Landscape Architecture.
P A G E E I G H T
Sound Wall(from page 7)
Want To Know More?If you would like to know moreabout sound walls and their implementation in the Hoosier State,visit the Indiana Department ofTransportation web site atwww.ai.org/dot/index.html. Thereyou can search the Access Indiananetwork of related sites and findmore than 6,000 documents offeringgeneral and technical information onINDOT application guidelines, studies and projects. Be sure toSEARCH under both “sound, walls”and “noise,walls” and include thecomma between your search words.
DID YOU KNOW?Noise wall projects along existinghighways, ineligible for federalfunding, are usually built with
state, county or municipalresources.
DID YOU KNOW?Noise walls usually offer, at best, a10 decibel reduction in noise level.
Beyond about 200 feet, noise protection comes mainly from
distance, not sound walls.
DID YOU KNOW?Walls protect only a small area withintheir “sound shadow”, significantly
reducing noise only at locations within 20 yards of the wall.
Parallel walls, unless very far apart,cause sound to ricochet, dropping theireffectiveness from about 10 to 4 decibels
– a barely discernable reduction.

P A G E N I N E
Irons In The Fire
Pedal & Park PreviewWe’re definitely interested in again sponsoring the Pedal &Park Program in 2002,” says Mike Peoni, MPOManager/Master Planner. “Pedal & Park supports a lot of ourestablished goals and our sponsorship of the program allowsus to encourage alternative modes of travel and use of ourgrowing greenways network.”
Peoni made his intention to continue the relationshipknown to Tom Olsen, President of The GreenwaysFoundation, during a meeting at the City-County Building, onWednesday, October 17. The Greenways Foundation foundedthe program in 1998 to offer parking for a fee in volunteer-runBicycle Corrals at the Indiana State Fair, where it was called“Moo-non To The Fair.” Bike Corral parking was extended toother greenway-adjacentsummer events in 2000. In2001, the not-for-profit organization approached theMPO about the possibility ofsponsorship. Related expenditures were alsoreviewed during the meeting.
As part of its programsponsorship, the MPOunderwrote all parking feesfor the year to a maximumof $2,500. Actual funds paidout totaled just over $1,100,with proceeds being dispersed to volunteer bicycle organiza-tions in proportion to their program efforts. At $1 perparked bike, 2001 Pedal & Park events earned the followingtallies for their participating partners: Broad Ripple Art Fair- $200, Day At The Depot - $100, The Indiana State Fair -$709, and Penrod - $97. “We wish it could have beenmore,” says Olsen, “but the MPO has indicated its willingnessto fund additional Pedal & Park events next year. They’veeven raised the sponsorship maximum to $4,000 to give ussomething to shoot for.” The guaranteed daily minimum wasalso raised to $60.
In addition to 2001 parking fees paid, the MPO purchased tents for use as volunteer and literature shelters;developed and produced bike-related literature; and lentmedia and public relations support which resulted in multiple articles in The Indianapolis Star, WIBC drive-time features and remote broadcasts by WISH-TV, Channel 8. Inaddition, Pedal & Park events were included in a variety oflocal broadcast community calendars. “This was really abuilding year for us,” Olsen says, “and I don’t think we can
overestimate the benefits of increased awareness. In addition to its continuing Pedal & Park sponsorship,
the MPO supported a variety of other cycling initiatives thisyear, including sponsorship of the Indiana BicycleCoalition’s Statewide Bicycle Conference, and funding thedevelopment and production of the new Marion CountyBike Route Map (see story below).
For more information on Pedal & Park Program,including future volunteer opportunities, call 317/297-1283 or
317/710-0739, or visit the Indy Greenways web site atwww.indygreenways.org.
Mayor Unveils New Bike MapOn Thursday, October 4, Indianapolis Mayor Bart Peterson, inconjunction with the Metropolitan Planning Organization, intro-duced the new Marion County Bike Route Map at a 1:30 Press
Conference held in White RiverPark. The event was covered byvarious print and broadcastnews sources, including TheIndianapolis Star which ran astory that noted the map was thefirst update of the county’s bikeroute system in 15 years. That327-mile network is now depict-ed on the map which showsinterconnected primary and secondary street routes andexisting and proposed greenwaytrails. Safety tips, state and
city/county biking codes and contact numbers/addresses of biking-related organizations are also featured.
“Since that press conference, we’ve distributed about10,000 maps,” says Mike Dearing, the MPO Principle Plannerin charge of the bike route plan development and map project.“Clearly, this is something that people have been very eager toget and use.” Transportation planners intend the expandedroute network, and the map, to aid cyclists looking for a alter-native to driving. “We’ve made every effort to identify bicycleroutes that encourage real-life bicycle usage, such as commutingto work, recreational travel and running errands, while alsotying into the existing trails of Indy Greenways,” Dearingexplains. Maps are now available at no cost from local bicyclingorganizations, supermarkets, bike stores, libraries, parks andCity/County government offices. In addition, Indy Greenwaysand the MPO plan to post the map in down-loadable form ontheir web sites (www.indygreenways.com,www.indygov.org/indympo). For more information about theMarion County Bike Route Map, contact Mike Dearing at317/327-5139 or [email protected].

I M P O R T A N T
For more information on transportation planning,
call 327-5151 or visit www.indygov.org/indympo.
The Metropolitan Planning Organization (MPO) invites your input on
the Draft Environmental Impact Statement (DEIS) for conNECTions — the
study of Northeast Corridor Transportation. Environmental impact information on the congestion-reducing, mobili-
ty-increasing strategies under consideration is available, toll-free,
at 1-877-NEC-LINK, on the web at www.indygov.org/connections, or by
reviewing the complete DEIS at government offices and public libraries
throughout the Northeast Corridor.
I M P O R T A N T
For more information on transportation planning,
call 327-5151 or visit www.indygov.org/indympo.
The Metropolitan Planning Organization (MPO) invites your input on
proposed amendments to the 2002-2004 Indianapolis Regional
Transportation Improvement Program (IRTIP), which documents federally-
funded projects in our region.
These amendments involve trail construction, bike route signage, road-
way and bridge maintenance, and new Hoosier Helper vehicles.
For more information, see our classified ad in today’s paper or attend
the Citizens Advisory Committee meeting on Tuesday, October 23.
I M P O R T A N T
For more information on transportation planning, call 327-5151 or visit www.indygov.org/indympo.
The Metropolitan Planning Organization (MPO) invites your input onproposed amendments to the 2001-2003 and 2002-2004 IndianapolisRegional Transportation Improvement Program (IRTIP), which documentsfederally-funded transportation improvements for our region.
These amendments, requested by the Indiana Department ofTransportation and Johnson County, include trail construction, intersectionimprovements and final environmental document preparation forconNECTions. See our classified ad in today’s paper for more information.
P A G E T E N
I M P O R T A N T
For more information on transportation planning,
call 327-5151 or visit www.indygov.org/indympo.
The Indianapolis Metropolitan Planning Organization (MPO) invites you to
the August Citizens Advisory Committee meeting on Tuesday, August 28, at
6:30 PM.This month’s agenda includes amendments to the Indianapolis Regional
Transportation Improvement Program (IRTIP) and an update on the
Glendale Special Neighborhood Study
.Join us in Room 107 of the City-County Building, 200 East Washington,
downtown Indianapolis.
coMPOnents
One of the most important components of the MPO’stransportation planning process is public input – the
voiced suggestions, concerns and reactions of the people whoactually use the regional transportation system. Without it,MPO planners and their consultants are less likely to recom-mend strategies that will be embraced by the community.
To encourage public awareness and informed participa-tion in the regional transportation planning process, the MPOincludes display advertising among its various outreach efforts,as well as media advisories, news and community affairs stories, web access, direct mail and in-person presentations.The ads listed below are examples that appeared in local publications over the last three months. To stay informed onMPO activities and further opportunities for your involvementin the regional transportation planning process, look for
ads featuring this format in the City and Statesection of The Indianapolis Star and Section A of The Indianapolis Recorder.

I M P O R T A N T
For more information on transportation planning, call 327-5151 or visit www.indygov.org/indympo.
The Metropolitan Planning Organization (MPO) invites yourparticipation in Public Hearings for conNECTions — the studyof Northeast Corridor Transportation. These hearings concern information contained in the study’sDraft Environmental Impact Statement, now available for pub-lic review and comment. They will take place at Broad RippleHigh School on Thursday, November 15, from 3:30 – 6 PMand 7 - 9:30 PM. Join us.
P A G E E L E V E N
I M P O R T A N T
For more information on transportation planning,
call 327-5151 or visit www.indygov.org/indympo.
The Metropolitan Planning Organization (MPO) invites your
input on the Draft Environmental Impact Statement (DEIS) for
conNECTions – the study of Northeast Corridor Transportation.
This document reports on the likely environmental impacts of
eight highway, bus or rail/bus options being considered for our
region’s busiest travel corridor. Environmental impact information
on these congestion-reducing, mobility-increasing strategies is
available, toll-free, at 1-877-NEC-LINK, or on the web at
www.indygov.org/indympo or www.indygov.org/connections.
The complete DEIS is also available for public review and com-
ment at government offices and public libraries throughout the
Northeast Corridor.
I M P O R T A N T
For more information on transportation planning,
call 327-5151 or visit www.indygov.org/indympo.
The Metropolitan Planning Organization (MPO) invites
your input on the Draft Environmental Impact Statement
for conNECTions — the study of Northeast Corridor
Transportation.
This document reports on the likely environmental
impacts of eight transportation options being considered
for our region’s busiest travel corridor, including highway
expansion, expanded bus service, and bus/rail transit sys-
tems.Review this document at government offices and public
libraries throughout the Northeast Corridor or, in
Executive Summary form, at www.indygov.org/connec-
I M P O R T A N T
For more information on transportation planning, call 327-5151 or visit www.indygov.org/indympo.
The Metropolitan Planning Organization (MPO) wants your input on theSpecial Neighborhood Study of the Glendale Area. To accommodate continuing public interest and participation, theMPO is extending this study to better evaluate public reaction to con-cepts for making this and other established neighborhoods more pedes-trian-, bicycle- and transit-friendly.To schedule a Special Neighborhood Study presentation for your group,call 317/327-5136 or 317/639-3420.
I M P O R T A N T
For more information on transportation planning,
call 327-5151 or visit www.indygov.org/indympo.
The Metropolitan Planning Organization (MPO) invites you to the Citi-
zens Advisory Committee meeting on Tuesday, October 23, at 6:30 PM.
Our agenda includes an informal discussion of conNECTions’ Draft
Environmental Impact Statement and public review process. New IRTIP
Amendments and the Glendale Special Neighborhood Study will also be
discussed. Join us in the Public Assembly Room (Room 230) of the City-County
Building, 200 East Washington, downtown Indianapolis.

transportation project can be imple-mented with federal funds without firstappearing in the Regional Plan. For thisreason, the Plan’s development repre-sents the first, best opportunity for thepublic to influence what gets done toand for our regional transportation sys-tem. This is why the MPO establishedthe Citizens Advisory Committee in1994; to gather input on projects at theplanning stage.
A second core activity for the MPOis the preparation of the IndianapolisRegional Transportation ImprovementProgram (IRTIP). In preparing the IRTIP,the MPO uses a project selection criteriato help reconcile the projects submittedfor consideration by the implementingagencies with available federal dollarswithin a three year time frame. TheIRTIP documents federally-funded pro-jects programmed for our region usingavailable dollars within a three-year timeframe. Before projects can be consideredfor inclusion in the IRTIP, they must firstappear in the Regional TransportationPlan. The easiest way to think about therelationship between the Plan and theIRTIP is to remember that the Plan iden-tifies transportation system needs, whilethe IRTIP identifies funding to imple-ment projects that satisfy identifiedneeds when implementing agencies areready to move ahead and federal fund-ing is available. The Plan places potentialprojects into the pipeline for futurefunding consideration, while the IRTIP
commits to them now. The IRTIP is botha planning and programming tool.Again, any project implemented withfederal funds must first appear in boththe Plan and the IRTIP.
Because of the short-term, imple-menting nature of the IRTIP, its pro-jects often attract more
public attention and build greater aware-ness than Plan projects. The MPOencourages this input by advertising theIRTIP’s frequent proposed amendmentsand by presenting them to the CAC for
review and comment on a regular basis.(Opportunities for the public to reviewand comment on updates of the RegionalTransportation Plan are also advertised.)
These are just a few of the waysthat the MPO seeks out, and listens, towhat the public has to say. Our recom-mendations are always based, in part, onpublic input. We listen by taking com-munity comments regarding plan recom-mendations into consideration alongwith our technical findings and evalua-tive analysis. We listen by passing yourcomments on to the appropriate imple-menting agencies. And, we listen byinvestigating issues raised during thestudies we conduct as part of our UnifiedPlanning Work Program. Recent exam-ples include the Bicycle Route Plan/UserMap (2000 Program) and the PedestrianSystem Plan, Special NeighborhoodStudy and the Central Indiana RegionalCommunity League’s Regional PlanningGuide (2001 Program).
In short, gathering, considering andpassing along your comments and ideasis a big part of what we do. So, publicinput counts and we make every effort tolisten. If you want to be heard, keep talk-ing to us. The phone numbers and e-mailaddresses of every MPO staff member areincluded in each issue of teMPO.
How can you affect budgets thatare set at least a year in advance? Bymaking yourself heard to us, to yourelected officials, to implementing agen-cies with jurisdiction over your con-cerns, as early and as often as possible.That’s the best way to participate in theregional transportation planning processand the only way to effectively influenceproject recommendations and futureimplementation funding. Once a need oropportunity is identified, it can becomea part of the Indianapolis RegionalTransportation Plan and, eventually, befunded through the IndianapolisRegional Transportation ImprovementProgram. So, keep talking. We’re listen-ing and the IRTIP (see story, page 4) andpublic-inspired studies (pages 5, 6, 9, 10and 13) are proof.
Y o u r M P O s t a f f. . includes these people who would be happy to address your comments or questions on
any aspect of the transportation planning process:Stephanie Belch • Senior Planner 317/327-5136Steve Cunningham • Senior Planner 317/327-5403Mike Dearing • Principal Planner 317/327-5139Kevin Mayfield • Planner 317/327-5135Michael Peoni, AICP• Manager/Master Planner 317/327-5133Sweson Yang, AICP • Chief Transportation Planner 317/327-5137For more information on our regional transportation planning process, visit the MPO web site atwww.indygov.org/indympo.
P A G E T W E L V E
Questions & Answers(from page 2)

PAGE THIRTEEN
IndyWorks Wonders
The Summer 2001 issue of teMPOfeatured a cover story on new IndyGo
initiatives drawing attention and winningkudos from local media sources and thepublic alike. Included among these arethe Access-To-Jobs/Flexride and Ride-Share Programs offering new, untraditionaltransit options beyond big bus, fixed-route service, and the new bike racks nowfound on nearly all of the transitprovider’s 230 buses. Another newregional transit initiative that’s gainingattention from employers and employeesalike region-wide is IndyWorks – thecommuter benefits package.
IndyWorks is a joint offeringfrom IndyGo, the region’s transit provider,and WageWorks of San Mateo, California,whose team members helped write thenew federal commuter benefits tax lawand offer services to employers like GE,Disney, Bank of America and the State of Illinois.
“IndyWorks addresses a realneed in the area,” says Shannon Joseph,IndyGo Marketing Director. “It helpscompanies get their employees to work,and increases workforce reliability, forabsolutely no cost.” In addition workerretention, due to increased compensation,increases. Other program benefits includetax savings for employer and employeealike, and environmental improvements.“When employees are stressed, businesssuffers. It’s that simple,” Joseph explains.“That’s why we created IndyWorks. Now,employees can ride the bus for less, helpsave the environment, and stop payinghigh parking fees. In short, traffic congestion is your enemy,” he notes.“IndyWorks is your friend.”
IndyWorks saves participatingemployers and their employees both timeand money by providing transportation-related discounts on everything from busrides to parking fees. Employees canenroll through a link on their company’sweb site or, toll-free, over the phone.
There is no required annual commitment.Employees can enroll in real time, anytime, and choose from a variety ofcommuter choices, vanpool services andparking fee discounts. Once selected andconfirmed, the actual transit pass is delivered directly to the employee. No distribution, voucher or claim formhassles.
Employees can even save if theirtransit or parking options are not availablefor home delivery through IndyWorks.They simply specify their monthly commute expenditures at the time of
enrollment, then submit documentation ofmonthly expense directly to IndyWorks. And IndyWorks is just as convenient foremployers. This full service commuterbenefits plan handles the payroll adjust-ment details without forms, vouchers oradministrative burden to participatingcompanies. Employers simply decidewhich benefits to offer and identify eligible employees. Then, throughWageWorks, IndyWorks provides amonthly payroll adjustment file that sum-marizes each employee’s participation in
IndyWorks InquiriesHere are commonly asked questionsabout the IndyWorks CommuterBenefits Program:
Q: What kinds of transit and parkingare available from IndyWorks?
A: Thanks to the partnership ofIndyGo and WageWorks, IndyWorkscommuter options include passes forriding buses, trains, subways, ferries,streetcars and other forms of masstransportation, as well as commutervanpools. IndyWorks also covers paidparking at or near an employee’s placeof work or at a transit station park-and-ride lot.
Q: Does IndyWorks use commuterchecks or vouchers?
A: No. With IndyWorks, participatingemployees receive home delivery ofthe same pass they would buy at theIndyGo Transit Store. Participatingcompanies avoid the extra cost ofobtaining and distributing vouches,while employees avoid the bother oftraveling to a special location toexchange vouchers for transit passes.
Q: Is any additional paperwork need-ed?
A: When an employee selects a pass,no receipts or other substantiation isrequired If a desired transit is notavailable, the employee reports theexpense by submitting receipts direct-ly to IndyWorks using programenvelopes. There are no additionalforms to fill out.
Q: Can employees makes changes totheir benefits on-line?
A: Yes. Employees can purchase tran-sit on a one-time-only basis, or sub-scribe to receive a pass on a regularbasis. Participating employees are notlimited to a single annual enrollment.
cont on page 20, see IndyWorks
DID YOU KNOW?Almost nine out of ten American
workers believe commuter
assistance benefits would be a useful
employer benefit, according to the
2001 Zylo Report.
DID YOU KNOW?The average IndyWorks participant
can save up to $350 in taxes annually.
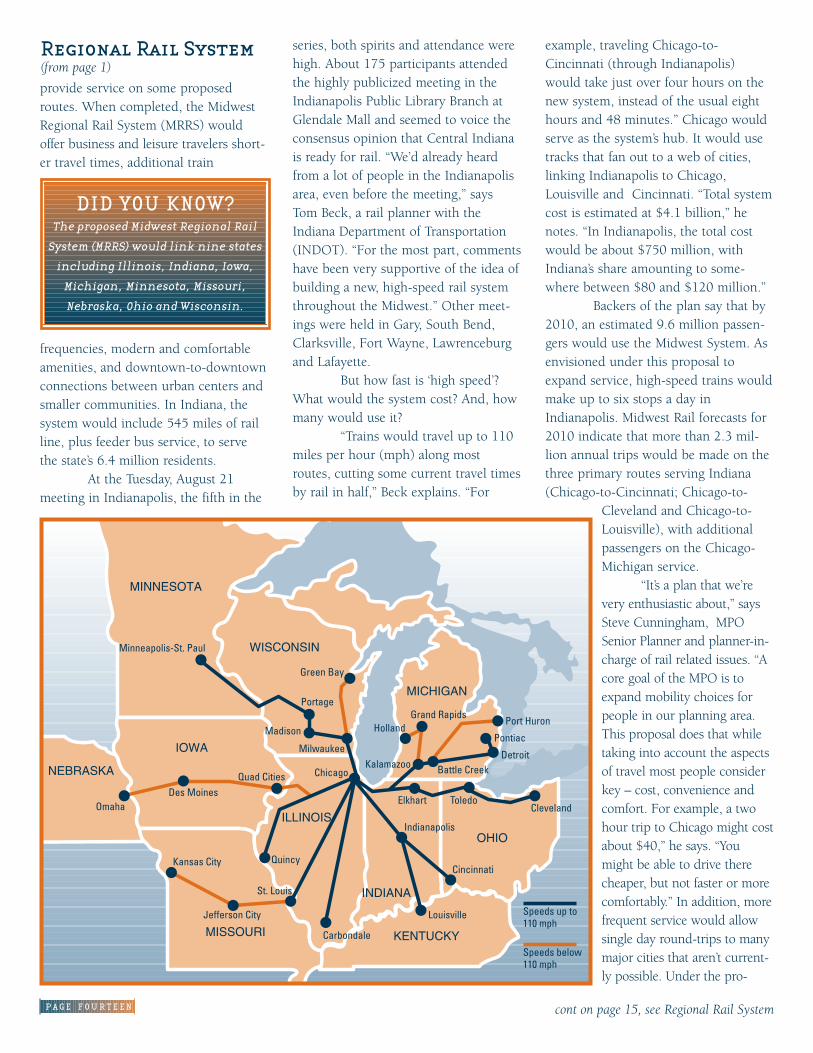
PAGE FOURTEEN
provide service on some proposedroutes. When completed, the MidwestRegional Rail System (MRRS) wouldoffer business and leisure travelers short-er travel times, additional train
frequencies, modern and comfortableamenities, and downtown-to-downtownconnections between urban centers andsmaller communities. In Indiana, thesystem would include 545 miles of railline, plus feeder bus service, to servethe state’s 6.4 million residents.
At the Tuesday, August 21meeting in Indianapolis, the fifth in the
series, both spirits and attendance werehigh. About 175 participants attendedthe highly publicized meeting in theIndianapolis Public Library Branch atGlendale Mall and seemed to voice theconsensus opinion that Central Indianais ready for rail. “We’d already heardfrom a lot of people in the Indianapolisarea, even before the meeting,” saysTom Beck, a rail planner with theIndiana Department of Transportation(INDOT). “For the most part, commentshave been very supportive of the idea ofbuilding a new, high-speed rail systemthroughout the Midwest.” Other meet-ings were held in Gary, South Bend,Clarksville, Fort Wayne, Lawrenceburgand Lafayette.
But how fast is ‘high speed’?What would the system cost? And, howmany would use it?
“Trains would travel up to 110miles per hour (mph) along mostroutes, cutting some current travel timesby rail in half,” Beck explains. “For
example, traveling Chicago-to-Cincinnati (through Indianapolis)would take just over four hours on thenew system, instead of the usual eighthours and 48 minutes.” Chicago wouldserve as the system’s hub. It would usetracks that fan out to a web of cities,linking Indianapolis to Chicago,Louisville and Cincinnati. “Total systemcost is estimated at $4.1 billion,” henotes. “In Indianapolis, the total costwould be about $750 million, withIndiana’s share amounting to some-where between $80 and $120 million.”
Backers of the plan say that by2010, an estimated 9.6 million passen-gers would use the Midwest System. Asenvisioned under this proposal toexpand service, high-speed trains wouldmake up to six stops a day inIndianapolis. Midwest Rail forecasts for2010 indicate that more than 2.3 mil-lion annual trips would be made on thethree primary routes serving Indiana(Chicago-to-Cincinnati; Chicago-to-
Cleveland and Chicago-to-Louisville), with additionalpassengers on the Chicago-Michigan service.
“It’s a plan that we’revery enthusiastic about,” saysSteve Cunningham, MPOSenior Planner and planner-in-charge of rail related issues. “Acore goal of the MPO is toexpand mobility choices forpeople in our planning area.This proposal does that whiletaking into account the aspectsof travel most people considerkey – cost, convenience andcomfort. For example, a twohour trip to Chicago might costabout $40,” he says. “Youmight be able to drive therecheaper, but not faster or morecomfortably.” In addition, morefrequent service would allowsingle day round-trips to manymajor cities that aren’t current-ly possible. Under the pro-
cont on page 15, see Regional Rail System
Regional Rail System(from page 1)
Minneapolis-St. Paul
OmahaDes Moines
Kansas City
Carbondale
LouisvilleJefferson City
St. Louis
Quincy
Indianapolis
Cincinnati
ClevelandToledoElkhart
Kalamazoo
Grand RapidsHolland
Battle CreekDetroit
Port Huron
Pontiac
Quad Cities
Portage
Speeds up to 110 mph
Speeds below 110 mph
Madison
Green Bay
Chicago
Milwaukee
DID YOU KNOW?The proposed Midwest Regional Rail
System (MRRS) would link nine states
including Illinois, Indiana, Iowa,
Michigan, Minnesota, Missouri,
Nebraska, Ohio and Wisconsin.

posed plan, for instance, the Chicago-to-Cincinnati run (throughIndianapolis) would have a total of 6trains in each direction; currently, ithas one. “With this system, highquality rail transportation becomesan option for people who cannotor choose not to drive,”Cunningham asserts.
As proposed, the MidwestRegional Rail System would featureADA-compliant stations with weather-protected platforms; intermodal linksincluding airport, bus, taxi and limou-sine connections; and, restaurants, spe-cialty shopping, business support ser-vices and entertainment facilities in larg-er stations. On-board amenities mightinclude fax and telephone communica-tions, power and modem hook-ups ateach seat, open seating, airline-stylebusiness class seating, and audio/visualmonitors for news, entertainment andinformational programming
To some, the best proposed fea-ture of the system is its self-sufficiency. “Most forms of transit rely on some sortof government subsidy to meet operat-ing costs,” Beck points out. “Since
they’re meeting the needs of the segmentof the population who are transit-depen-dent, this is viewed as a valid investmentof tax dollars. However, the proposedhigh-speed rail system is envisioned tobe self-supporting,” he says. “After capi-tol costs are spent to construct the highspeed network and to purchase vehicles,revenues are forecast to meet or exceedestimated operating costs.”
For more information on theMidwest Regional Rail System, contactTom Beck of INDOT at 317/232-1478([email protected]) or SteveCunningham of your MPO at 317/327-5403 ([email protected]).
Regional Rail System(from page 14)
P A G E F I F T E E N
DID YOU KNOW?The proposed MRRS includes
545 miles of rail line in Indiana
alone, and 3,000 miles total!
Common Regional Rail QuestionsWill trains travel at 110 mph?According to federal safety regulations, 110mph is the maximum speed passengertrains are allowed to travel on rail segmentsthat have at-grade crossings. To travel above110 mph, the corridor would need to becompletely grade separated (a very expen-sive and unlikely proposition). Trains willnot ravel at this maximum speed over theentire length of the corridors. Most likelythey will reach 110 mph for only short dis-tances along the corridor. Conditions suchas track curvature or travel though urbanareas might be reasons why trains wouldtravel at lower-than-maximum speeds.
How will the location of station stops be decided?Because of the importance of reducing over-all trip time, there will be a need to keep thenumber of station stops to a minimum.Population and ridership levels will be keyfactors in selecting stop locations. It is esti-mated that only communities with morethan 50,000 residents will be able to gener-ate enough ridership to justify a high-speedtrain stop. Depending on demand, smallercommunities might be designated as limitedstops where a reduced high-speed schedulewould operate. It is likely that residents ofsmaller communities would have access tohigh-speed stops via continued conventionaltrain service and/or connector bus service.
What will fares be?In preparing a business strategy to deter-mine the viability of a Midwest system, aticket pricing strategy was proposed thatwould allow projected revenues to meetand possibly exceed projected costs. Ticketsprices were planned to be very competitivewith the existing lowest discount airfarerates between cities. For example, a roundtrip ticket between Indianapolis andChicago would probably be in the $75 -$90 range. Pricing would be done accord-ing to a formula that would maximize rider-ship and revenues. Along with competitivepricing, a primary selling point would beimproved on-board amenities, such as extraleg room, improved food and beverage ser-vice, and the additional flexibility to useelectronic equipment, conduct on-boardbusiness meetings or to just relax and enjoythe ground level view. Also, rail serviceoffers the benefit of downtown-to-down-town service – a key consideration formany business and discretionary travelers.
DID YOU KNOW?MRRS forecasts for 2010 indicate over
2.3 million annual trips would be
made on the three primary routes
serving Indiana.

region’s busiest travel corridor, include highway expansion, newand expanded bus service, and rail/bus transit systems.
Copies of the full report were available for review at: • Indianapolis MPO Office, Suite 1841 of the City-CountyBuilding located at 200 East Washington Street in Indianapolis.Phone: 317/327-5151. • INDOT Hearings Examiner, Room N901, Indiana GovernmentCenter North, 100 North Senate Avenue, Indianapolis. Phone: 317/232-6601.• Hamilton County Auditor, 33 North 9th Street, L21,Noblesville. Phone: 317/776-8400.• Development Engineer’s Office, Indiana Department ofTransportation district office, 32 South Broadway, Greenfield.Phone: 317/462-7031• Any public library within the Northeast Corridor study area,which stretches from downtown Indianapolis northeast toNoblesville.
An Executive Summary of DEIS findings was also avail-able for review on two MPO web sites: www.indygov.org/connec-tions and www.indygov.org/indympo. In addition, a hard copyof the Executive Summary could be requested by contactingMike Peoni at 317/327-5133 or [email protected] on the study’s options and their environmentalimpacts could also be accessed by calling the conNECTions HotLine, toll-free, at 1-877-NEC-LINK (1-877-632-5465).
Area residents will had until 5 PM, Thursday, November 29,2001 to review and comment on the document’s findings.Comments were to be submitted in writing to John Myers ofParsons Brinckerhoff, 47 South Pennsylvania Street, Suite 600,Indianapolis, IN 46204 or faxed to his attention at 317/972-1708.
To encourage public participation in this review process,the Metropolitan Planning Organization (MPO) made the avail-ability of the Draft Environmental Impact Statement knownthrough display and classified advertising, media advisories,direct mail and its monthly Citizens Advisory Committee meetings, which are broadcast on WCTY, the government accesschannel (Channel 16, Comcast and Time Warner).
In addition, the Indiana Department of Transportation(INDOT) conducted Public Hearings on Thursday, November15th in the small auditorium at Broad Ripple High School. Thefirst session took place from 3:30 to 6:00 PM; the second from7:00 to 9:30 PM. Both included an Open House display and discussion area hosted by the MPO; informational presentationsfrom the MPO, transportation engineers from ParsonsBrinckerhoff and INDOT; and more than an hour of public comment time. Attendance at the Public Hearings was also pro-moted through display and classified advertising, media advi-sories and live presentations.
The purpose of the conNECTions Study, which started inmid-1998, is to identify locally preferred, financially feasiblestrategies for mitigating the effects of traffic delays and lack ofmobility that frustrate rush hour travelers in the NortheastCorridor. Throughout the course of the study, the public hasbeen encouraged to work with the team members from the MPOand Parsons Brinckerhoff to develop a list of travel options forconsideration. A series of evaluative steps, including computer-modeling and cost-benefit analysis, was used to cut the originallist of 14 options down to eight. Following a federal review andrevision phase, the DEIS findings on the eight options summa-rized here were made available for public review and comment.
Highway Option 1A is a ‘no-build’ option, meaning that itreflects improvements already in the 2025 Indianapolis RegionalTransportation Plan, excluding any I-69/State Road 37 corridorprojects. This option is for comparison purposes and helps plan-ners answer the question, “What happens if we do nothing?”
Highway Option 3 is a basic highway expansion option thatwould increase I-465’s traffic-handling capacity by enlarging it to8 “through” lanes in the Northeast corridor. In addition, I-69, US 31 and State Road 37 would also be expanded.
Highway Option 5 is an intermediate 465 expansion option thatwould increase the number of “through” lanes to 10. I-69, US31, State Road 37 and, possibly, I-70 would also receive addi-tional travel lanes.
NECT Options & Impacts(from page 1)
P A G E S I X T E E N cont on page 17, see NECT Options & Impacts
No Build
Added Lanes,2 to 4
Added Lanes,4 to 6
Upgrade To Freeway
WESTFIELDNOBLESVILLE
FISHERS
LAWRENCE
DOWNTOWNINDIANAPOLIS
CARMEL
US 31 & 146th ST.INTERCHANGE
I-465 & 56TH ST.INTERCHANGE
AUTH
ORITY
RA
IL CO
RRID
OR
PORT
US
31
SR 32
146th St
116th St
MASSACHUSETTS Ave
PENDLETON PikeUS 36
96th St
38th St
I-70
I-70
I-65
I-65 I-74
I-465
SR 37
I-69
I-69
SR 238
MER
IDIA
N S
t
KEY
STO
NE
Ave
ALLIS
ONVI
LLE
RdI-465
SR 3
7
H-1AA L T E R N A T I V E

Highway Option 6 would widen 465 to 12 “through” lanes, aswell as add lanes to I-69, US 37, possibly I-70, and State Road 37which would be improved as a limited access freeway. Of allhighway options under consideration, this one comes closest tomeeting our future transportation needs, but also has the greatestenvironmental impacts.
“H” Environmental ImpactsGenerally speaking, the highway expansion options have thegreatest direct impact on future land uses, requiring between 105and 220 acres of new right-of-way. This acquisition will affectexisting office, vacant land, retail, agricultural and industrial landuse. H6 would require almost 100 acres more than H3 or H5,including 38 acres of residential land. H3 and H5 would affectless than five residential acres.
There would be proximity and relocation impacts alongthe corridor for all highway expansion options, ranging from 8 to11 residential displacements for H3 and H5 to 95 residential displacements for H6. All would also involve noise and visualimpacts to the degree that vegetation is removed.
The highway expansion options would create the greatestimpact to area wetlands along existing corridors of all alternativebeing considered. Expansion along existing right-of-way, as in
NECT Options & Impacts(from page 16)
PAGE SEVENTEEN
cont on page 18, see NECT Options & Impacts
WESTFIELDNOBLESVILLE
FISHERS
LAWRENCE
DOWNTOWNINDIANAPOLIS
CARMEL
AUTH
ORITY
RA
IL CO
RRID
OR
PORT
US
31
SR 3
7
SR 32
146th St
116th St
MASSACHUSETTS Ave
PENDLETON PikeUS 36
96th St
38th St
I-70
I-70
I-65
I-65 I-74
I-465
SR 37
I-69
I-69
SR 238
MER
IDIA
N S
t
KEY
STO
NE
Ave
ALLIS
ONVI
LLE
Rd
I-465
I-69 6 Lanes
I-465 8 LanesI-69 8 Lanes
I-69 10 Lanes
S.R. 37 6 Lane Expressway
Improvements from H1A
H-3A L T E R N A T I V E
I-65
S.R. 37 6 LaneExpressway
I-69 6 LanesS.R. 37 6 Lane Freeway
I-69 10 LanesI-465 10 LanesI-70 10 Lanes
I-69 12 LanesI-70 12 Lanes
Improvements From H1A
WESTFIELDNOBLESVILLE
FISHERS
LAWRENCE
DOWNTOWNINDIANAPOLIS
CARMEL
AUTH
ORITY
RA
IL CO
RRID
OR
PORT
US
31
SR 3
7
SR 32
146th St
116th St
MASSACHUSETTS Ave
PENDLETON PikeUS 36
96th St
38th St
I-70
I-70
I-65 I-74
I-465
SR 37
I-69
I-69
SR 238
MER
IDIA
N S
t
KEY
STO
NE
Ave
ALLIS
ONVI
LLE
Rd
I-465
H-5A L T E R N A T I V E
S.R. 37 4 Lane Freeway
S.R. 37 6 Lane FreewayI-69 6 LanesI-70 6 Lanes
S.R. 37 8 Lane Freeway
I-70 12 Lanes
I-69 12 Lanes with CD LanesI-465 12 Lanes with CD Lanes
I-69 14 Lanes with CD LanesI-70 14 Lanes with CD Lanes
Improvements From H1A
WESTFIELDNOBLESVILLE
FISHERS
LAWRENCE
DOWNTOWNINDIANAPOLIS
CARMEL
AUTH
ORITY
RA
IL CO
RRID
OR
PORT
US
31
SR 3
7
SR 32
146th St
116th St
MASSACHUSETTS Ave
PENDLETON PikeUS 36
96th St
38th St
I-70
I-70
I-65
I-65 I-74
I-465
SR 37
I-69
I-69
SR 238
MER
IDIA
N S
t
KEY
STO
NE
Ave
ALLIS
ONVI
LLE
Rd
I-465
H-6A L T E R N A T I V E

P A G E E I G H T E E N
cont on page 19, see NECT Options & Impacts
H3 and H5, would minimize impacts to about 20 acres. H6would affect 46 acres. Highway expansion alternatives cross several creek corridors which are potential habitat areas for theIndiana Bat and increase impervious areas which can affect waterquality of streams receiving stormwater run-off. Flood plains arealso affected. Alternative H6 would have the greatest impactunder all scenarios.
The highway expansion options raise fewEnvironmental Justice concerns which guard against dispropor-tionately high and adverse effects being placed on low incomeand minority populations. The widening of I-70 in alternativesH5 & 6 would impact a maximum of seven low-income andminority area residences around Center Township. AlternativesH3, H5 and H6 would also require strip acquisitions along parklands for the expansion of I-465.
Bus Option 1 offers improved and expanded express and localservice within Marion County.
Bus Option 2 builds on the benefits of Bus Option 1 by expanding express service into Hamilton County.
“B” Environmental ImpactsEnvironmentally speaking, bus-related options would require little land acquisition since most service is provided on existingstreets. Therefore, land use impacts would be minimal. OptionB1 is likely to create 264 new jobs; B2, 338. These alternativeswould not affect existing neighborhood boundaries or posemajor residential displacement impacts. All transit-based alterna-tives would improve access and mobility for low-income andminority populations that are transit-dependent.
Options B1 and B2 would not affect the existing visualsetting or pose major negative impacts to wetlands, endangeredspecies, floodplains, farmlands, parklands or historic or archeological resources. They impact water quality least of allalternatives under consideration by minimally increasing impervious areas for the construction of park and ride lots.
Rail/Bus Option 1 proposes commuter rail service betweenNoblesville and downtown Indianapolis using the HoosierHeritage Port Authority (HHPA) rail corridor – the same corridorused by the State Fair train. Buses would carry commuter railpassengers to and from park & ride facilities and rail stations.Commuter rail service provides higher travel speeds over long distances with few stops.
Rail/Bus Option 4 offers the same commuter rail service asRail/Bus Option 1, plus light rail service between 465 and down-
Express BusRoute
Express BusOn ReservedLanes
Enhanced LocalBus Service
Park & Ride Lot
WESTFIELDNOBLESVILLE
DOWNTOWNINDIANAPOLIS
PORT
US
31
SR 3
7
SR 32
146th St
116th St
I-465
MASSACHUSETTS Ave
PENDLETON PikeUS 36
96th St
I-70
I-70
I-65
I-65 I-74
I-465
SR 37
I-69
I-69
SR 238
MER
IDIA
N S
tCO
LLEG
E Ave
CARMEL
AUTH
ORITY
RA
IL CO
RRID
OR
FISHERS
38th StLAWRENCE
KEY
STO
NE
Ave
ALLIS
ONVI
LLE
Rd
B-1A L T E R N A T I V E
Express BusRoute
Express BusOn ReservedLanes
Park & Ride Lot
WESTFIELDNOBLESVILLE
LAWRENCE
DOWNTOWNINDIANAPOLIS
PORT
US
31
SR 3
7
SR 32
146th St
116th St
I-465
MASSACHUSETTS Ave
PENDLETON PIKEUS 36
96th St
38th St
I-70
I-70
I-65
I-65 I-74
I-465
SR 37
I-69
I-69
SR 238
MER
IDIA
N S
t
KEY
STO
NE
Ave
ALLIS
ONVI
LLE
Rd
COLL
EGE A
ve
CARMEL
AUTH
ORITY
RA
IL CO
RRID
OR
FISHERS
B-2A L T E R N A T I V E
NECT Options & Impacts(from page 17)
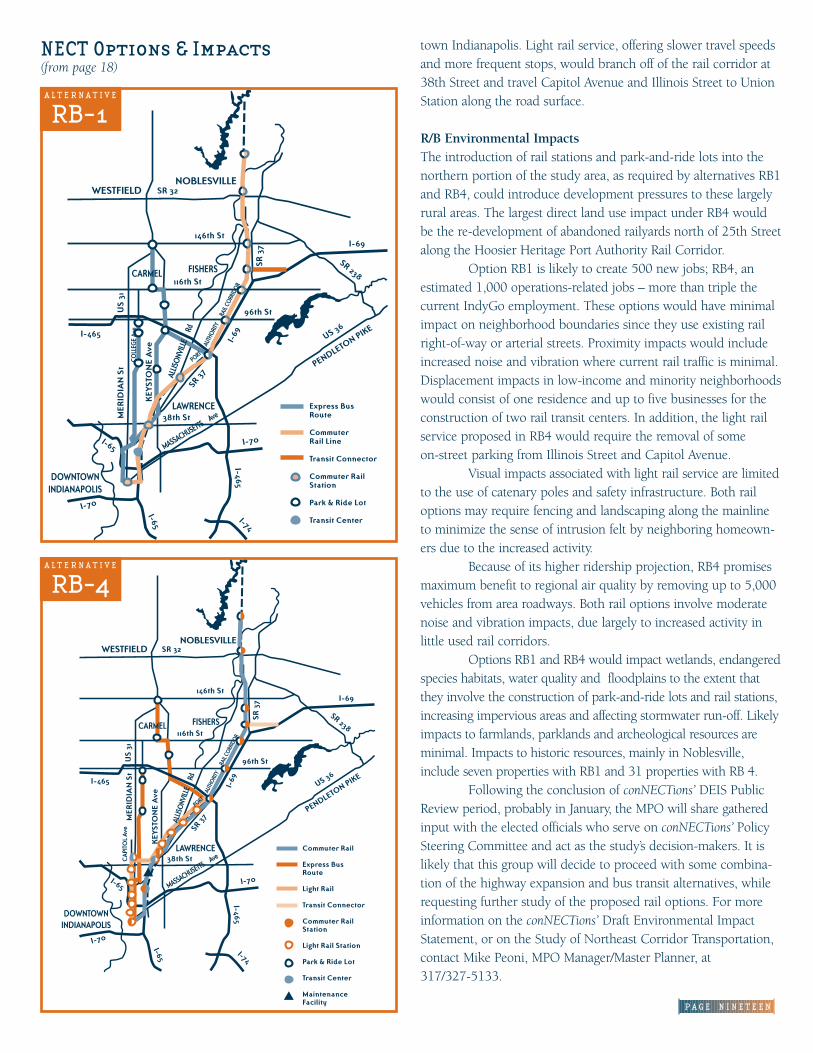
P A G E N I N E T E E N
town Indianapolis. Light rail service, offering slower travel speedsand more frequent stops, would branch off of the rail corridor at38th Street and travel Capitol Avenue and Illinois Street to UnionStation along the road surface.
R/B Environmental ImpactsThe introduction of rail stations and park-and-ride lots into thenorthern portion of the study area, as required by alternatives RB1and RB4, could introduce development pressures to these largelyrural areas. The largest direct land use impact under RB4 wouldbe the re-development of abandoned railyards north of 25th Streetalong the Hoosier Heritage Port Authority Rail Corridor.
Option RB1 is likely to create 500 new jobs; RB4, an estimated 1,000 operations-related jobs – more than triple thecurrent IndyGo employment. These options would have minimalimpact on neighborhood boundaries since they use existing railright-of-way or arterial streets. Proximity impacts would includeincreased noise and vibration where current rail traffic is minimal.Displacement impacts in low-income and minority neighborhoodswould consist of one residence and up to five businesses for theconstruction of two rail transit centers. In addition, the light railservice proposed in RB4 would require the removal of some on-street parking from Illinois Street and Capitol Avenue.
Visual impacts associated with light rail service are limitedto the use of catenary poles and safety infrastructure. Both railoptions may require fencing and landscaping along the mainlineto minimize the sense of intrusion felt by neighboring homeown-ers due to the increased activity.
Because of its higher ridership projection, RB4 promisesmaximum benefit to regional air quality by removing up to 5,000vehicles from area roadways. Both rail options involve moderatenoise and vibration impacts, due largely to increased activity in little used rail corridors.
Options RB1 and RB4 would impact wetlands, endangeredspecies habitats, water quality and floodplains to the extent thatthey involve the construction of park-and-ride lots and rail stations,increasing impervious areas and affecting stormwater run-off. Likelyimpacts to farmlands, parklands and archeological resources areminimal. Impacts to historic resources, mainly in Noblesville,include seven properties with RB1 and 31 properties with RB 4.
Following the conclusion of conNECTions’ DEIS PublicReview period, probably in January, the MPO will share gatheredinput with the elected officials who serve on conNECTions’ PolicySteering Committee and act as the study’s decision-makers. It islikely that this group will decide to proceed with some combina-tion of the highway expansion and bus transit alternatives, whilerequesting further study of the proposed rail options. For moreinformation on the conNECTions’ Draft Environmental ImpactStatement, or on the Study of Northeast Corridor Transportation,contact Mike Peoni, MPO Manager/Master Planner, at 317/327-5133.
RB-1A L T E R N A T I V E
RB-4A L T E R N A T I V E
NECT Options & Impacts(from page 18)

the plan. WageWorks performs all of thecalculations to ensure compliance withIRS rules and to maximize tax savings forboth the participating company andemployee.
How much can be saved? The average participating
employee will save about $350 per year,because they will not owe personalincome tax, Social Security or Medicaretax on wages or employer contributionsused to purchase transit throughIndyWorks. It adds up to a savings ofabout 40% of every pre-tax dollar spent.
Similarly, employers would notowe payroll taxes on wages or contribu-tions going toward IndyWorks benefits.
On average, they would save $70 peryear per participating employee.
All participating companiesalso have the option of contributingto an employee’s commuter bene-fits just like a 401(K) plan,either on a matching,lump sum or percentagebasis. For example, manycontribute the first$60/mo. of each employ-ee’s transit costs. Although nocontribution is required, it’s a taxsmart way to retain employees byincreasing their compensation.Employer contributions (withinspecified dollar limits) are com-
pletely deductible and not subject toincome or payroll taxes. Plus, withIndyWorks, they’re convenient. The planautomatically incorporates employer
contributions into the plan and payrolladjustment calculations.
“It’s never been easierfor local employers to offer their
people commuter benefits,’ saysJoseph. Participating companies cancontrol IndyWorks through their exist-ing web browser. There is no new software to buy, no required employeetraining, no information technology project to install. Authorized personnelcan add or subtract employees, monitorplan utilization and get financial/activity
reports anytime. “Any way IndyWorkscan help companies achieve programawareness and utilization goals by adver-tising the program to employees via e-mail, direct mail and collateral literature,” Joseph notes.
For more information about theIndyWorks Commuter Benefits Plan, con-tact Shannon Joseph at 317/614-9314.
Metropolitan Planning Organization1841 City-County Building200 East Washington StreetIndianapolis, IN 46204-3310
IndyWorks (from page 13)
Printed on paper with recycled contentP A G E T W E N T Y
teMPO is published quarterly by your Metropolitan Planning Organization, part of the Department of Metropolitan Development. If you knowof anyone who would like to receive teMPO, or if youhave any questions concerning its publication, please call:
Mike Peoni at 327-5133Department of Metropolitan DevelopmentMetropolitan Planning OrganizationCity-County Building200 East Washington Street, Suite 1841Indianapolis, IN 46204teMPO was written and prepared for publication byWhitman Communications, Inc.
DID YOU KNOW?IndyWorks employers save an average
of $70 in reduced payroll taxes per
year per participating employee.

INDIANAPOLIS REGION'SINDIANAPOLIS REGION'S
KEEPING PACE WITH OUR TRANSPORTATION NEEDS
Long Range Transportation Plan. Page 1
ITS Evolution . . . . . . . . . . . . . . . . . Page 1
Q & A . . . . . . . . . . . . . . . . . . . . . . . . . Page 2
MPA/Study Area Map . . . . . . . . . . . Page 3
TMS Update . . . . . . . . . . . . . . . . . . . Page 4
Downtown Parking . . . . . . . . . . . . Page 5
Regional Trail and Greenways Network . . . . . . . . . . . Page 7
MPO Profile . . . . . . . . . . . . . . . . . . Page 9
SR 431 Preffered Alternative. . Page 11
Snow Plan Facts . . . . . . . . . . . . . . Page 12
Irons In The Fire . . . . . . . . . . . . . Page 13
Notes & Quotes . . . . . . . . . . . . . . . Page 19
Winter Wrap-Up
This combined Special Edition andWinter Issue reports further devel-
opments on a number of topics previ-ously covered in teMPO, while alsopeeking ahead to developing stories thatwill be more fully developed in 2002.Highway improvements, transit, airportactivities, Intelligent TransportationSystems, parking places, snow removalprograms, proposed regional bike andpedestrian facilities, and more, are allcovered here — reflecting the diversemodal strategies that now characterizetransportation planning in CentralIndiana. Also included here are thefavorite transportation-related web sitesof your MPO staff in Q & A, statusreports on a variety of study and plan-ning initiatives in Irons In The Fire and
In This Issue
Long Range Transportation Plan
Indiana has something of which few other U.S. states can boast – a project-specificstatewide Long Range Transportation Plan, thanks to the efforts the Indiana
Department of Transportation (INDOT) and its various planning partnersthroughout the state. “It’s been three years in the making,” says SteveSmith, Manager of INDOT’s Long Range Transportation Section andthe person responsible for leading the plan development. “As faras I know, only Indiana and Oregon now have a plan thatidentifies cost-feasible highway projects for the nextquarter-century. Most other state’s only have a poli-cy statement in place or identify projectsonly for the next 6 - 10 years, at most.But the benefits of planning 25 yearsahead are undeniable.”
MPO Manager/Master Planner MikePeoni couldn’t agree more. “Before now,when preparing our long-range RegionalTransportation Plan, we didn’t know upfront howmuch money INDOT was willing to spend in ourarea because they didn’t have a project-specific long
cont on page 16, see Long Range Transportation Plan
SPECIAL EDITION
&
W I N T E R 2 0 0 1
V O L U M E F I V E
I S S U E F O U R
ITS Evolution
When I think about what we’ll eventually have, I feel like our ITS is in its infancy,” says Mark Newland, ITS Program Director for the Indiana
Department of Transportation (INDOT). “But when I consider how many waysadvanced technology is already helping to manage our traffic
flow, and how rapidly new technologies are beingincorporated into our system, I can’t believe howfar we’ve come.”
ITS stands for Intelligent TransportationSystems — a variety of evolving technologies now being
employed along Indiana’s highways to help ease congestion andincrease traveler safety. INDOT uses these technologies, under thesystem name TrafficWise to detect congestion as it occurs and todetermine its cause. The system then speeds information totravelers, dispatchers and emergency response professionals,
cont on page 14, see ITS Evolution
“
0cont on page 3, see Winter Wrap-Up

AQ
P A G E T W O
In Q & A, members of your MPO staff answer questions posed to them via voicemail, e-mail, regular mail or in-person. In this issue, Mike Dearing, MPO
Principal Planner and the planner-in-charge of overseeing the MPO’s web site(www.indygov.org/indympo) discusses the best places to browse for current trans-portation planning information.
I first got involved with the MPO and transportation plan-ning a few years ago when I attended a neighborhood presenta-tion on the Northeast Corridor Study. To my surprise, I not onlyfound the information to be understandable, I actually thoughtit was interesting. Soon after, I started regularly attending theCitizens Advisory Committee (CAC) meetings or, at least, watchingthem on TV (Channel 16, WCTY - Government Access Channel). Ialso read CAC Minutes, even when I’ve attended the meeting , andhaven’t missed a copy of teMPO in three years. I even keep them ina binder for reference.
But, now, I’d like to know more. Can you recommendsources of transportation information other than the MPO that Ican access? No offense meant. I’ve always found the MPO to beforthcoming and totally on the up-and-up, but I’d like to broadenmy sources and perspectives.
— e-mail request following the October CAC meeting
No offense taken. We wish more peopleshared your interest in the trends, facts, figuresand issues that we work with every day.
Since your e-mail tells me you’re comput-er-literate, I’d suggest the internet as the bestplace to gather the types of information you’relooking for. It is an invaluable tool, literally theworld’s biggest, most up-to-date library andmost of the city, county, state and federal docu-ments that concern transportation planning areavailable on-line. Even as professional trans-portation planners, we browse the net on a reg-ular basis and our favorite sites are accessible byanyone with an interest in moving people andgoods in, through and around our region.
Here are just a few MPO staff favorites:
www.ai.prg/dot/index or www.in.gov/dot (Indiana Department of Transportation)
www.cfte.org/index (Center for Transportation Excellence, a non-partisan policyresearch center - benefits of public transit and light rail)
ACRO-NYMBLE
Here’s a list of the acronyms used inthis issue. Refer to it to keep your
understanding letter-perfect.
AICP - American Institute of CertifiedPlanners
ATMS - Advanced Traffic ManagementSystem
CAC - Citizens Advisory CommitteeCBD - Central Business DistrictCIRCL - Central Indiana Regional
Community LeagueCMS - Congestion Management SystemconNECTions - Study of NorthEast
Corridor TransportationDEIS - Draft Environmental Impact
StatementDMD - Department of Metropolitan
DevelopmentDMS - Dynamic Message SignDOT - Department of TransportationEA - Environmental AssessmentFHWA - Federal Highway AdministrationFONSI - Finding Of No Significant
ImpactFTA - Federal Transit AdministrationHPMS - HIgh Performance Monitoring
SystemIIA - Indianapolis International AirportIDEM - Indiana Department of
Environmental Management IMS - Infrastructure Management SystemINDOT - Indiana Department of
TransportationIPTC/IndyGo - Indianapolis Public
Transportation CorporationIRTC - Indianapolis Regional
Transportation CouncilIRTIP - Indianapolis Regional
Transportation Improvement Program ISTEA - Intermodal Surface
Transportation Efficiency Act (of 1991)ITS - Intelligent Transportation SystemLOS - Level-Of-ServiceMDC - Metropolitan Development
CommissionMECA - Metropolitan Emergency
Communications AgencyMIS - Major Investment StudyMPA - Metropolitan Planning AreaMPO - Metropolitan Planning
OrganizationNPS - National Park ServiceQ & A - Question and AnswerROW - Right-Of-WayTAZ - Traffic Analysis ZoneTMC - Traffic Management enterTMS - Traffic Monitoring SystemUSDOT - United States Department of
Transportation USEPA - United State Environmental
Protection AgencyVMS - Variable Message Sign
cont on page 10, see Q & A
&
Mike DearingMPO Principal Planner
QUESTIONSANSWERS

P A G E T H R E E
I N D I A N A P O L I S M E T R O P O L I T A N P L A N N I N G A R E A
Boone
Morgan JohnsonShelby
Metropolitan Planning Area (MPA)(Projected Urbanization By The Year 2020)
MPO Modeling Area(Studied Because Of Its Proximity To, And Influence On, MPA Traffic)
Eagle
Pike
Lincoln
Wayne
Buck
Creek
Sugar
Creek
White
River
Warren
Washington
Perry FranklinDecaturGuilford
Lawrence
Delaw
are
Hancock
Washington
Hendricks
Pleasant
Clay
Washington
Center
Hamilton
Marion
Fall
Creek
Note: all roads onboundary lines areexcluded except MarionCounty’s east and southcounty lines.
an MPO Profile, only our second thisyear, featuring another non-professional
transportation advocate—one of hun-dreds of private citizens whose insightsand advocacy benefit both the regionaltransportation system and the MPO’s
planning process. It’s a hot line-up that’scool to read. So enjoy, and Happy NewYear from your MPO!
Winter Wrap-Up(from page 1)

P A G E F O U R
“To effectively help meet user needs, we needed to under-stand the challenges they confront when performing their jobs,”says Jeff Siegel, AICP, HNTB’s primary project consultant.“Through five months of meetings, workshops and visioningand technical documents, we learned from their insights, con-cerns and frustrations.”
In developing tools to meet user needs, MPO staff mem-bers identified twelve important potential system applications.These applications were then evaluated using GIS priorityassessment and application feasibility measurement whichreflects an objective evaluation of application development
efforts with consideration to level of effort and importance tothe organization. This process yielded a simplified cost vs. ben-efit analysis which the MPO staff re-evaluated to provide moreinsight to implementation decisions.
“MPO staff members have dedicated tasks, which fulfillthe overall mission of the MPO,” explains Mayfield. “This work-ing environment needs a system that serves dedicated applica-tions while sharing data sets.”
As a result of the evaluation process, the twelve suggestedpotential system applications were placed in the following rec-ommended implementation order:
1. Transportation Plan2. Quick Map3. Improvement Programming
cont on page 6, see TMS Update
TMS Update
I n 1996-97, the Indianapolis MPO developed a regionalTransportation Monitoring System (TMS) to provide a tool
for conducting the Indianapolis regional transportation plan-ning process and to comply with the Intermodal SurfaceTransportation Efficiency Act (ISTEA) of 1991. The goal of thesystem was to provide a comprehensive compilation of avail-able transportation, traffic, and related data while satisfyingthe intent of the regulations outlined in ISTEA.
The TMS was developed as a geographic database thatsupports and updates the region’s transportation data collec-tion and storage systems. The TMS was also designed to makethe database available to users to search, display, and analyzeregional transportation information. The overall database hasthe power to reference current and historical transportationinformation by roadway segment, intersection, and transitroute.
“The TMS is one of the basic tools of transporta-tion planning,” says Kevin Mayfield, MPO Planner andprimary department coordinator of the TMS Update.“We use it practically everyday and so do our plan-ning partners. That’s why it makes sense to keepit updated and to improve it as much as possi-ble, giving us the right tool for the job.”
In the fall of 2001, the IndianapolisMPO selected HNTB’s Technology Group toassist in the development of a TMSEnhanced User System, an update andenhancement of the current system cus-tomized to the specific needs of TMS users.The project’s goal is to develop the TMSinto a more user-friendly and easily updat-ed system that aids the MPO and membersof the Indianapolis Regional TransportationCouncil (IRTC) in doing their work.
Creating an Enhanced User SystemAt a preliminary project scoping meeting, MPO staff and
select members of the IRTC identified system usability, data main-tenance/management, and accessibility as priority issues on which
the enhancementproject shouldfocus. They alsoanswered ques-tions about MPObusiness practicesto help prioritizefurther TMSdevelopment.
teMPO is published quarterly by your Metropolitan Planning Organization, part of the Department of Metropolitan Development. If you knowof anyone who would like to receive teMPO, or if youhave any questions concerning its publication, please call:
Mike Peoni at 327-5133Department of Metropolitan DevelopmentMetropolitan Planning OrganizationCity-County Building200 East Washington Street, Suite 1841Indianapolis, IN 46204teMPO was written and prepared for publication byWhitman Communications, Inc.
P A G E F I V E
Regional Trails and
Greenways Network
Think of us as bikers without bor-ders,” says Tom Olsen, President of
The Greenways Foundation, an advoca-cy group that promotes the develop-ment and use of trails and greenwaysfor both recreational and transportationuse and is now initiating discussions ona coordinated regional greenways sys-tem. “Indy Greenways has done an out-standing job of planning and imple-menting a network of accessible trailsand greenways throughout MarionCounty that helps joggers, cyclists andpedestrians get to where they need togo. . . and to enjoy getting there. TheGreenways Foundation would like totake a leadership role in coordinating aregional effort to extend these samebenefits throughout our nine countyarea,” he says. “We’re only in the veryearly talking stages now, but I’ve beenpleased with the enthusiastic responsewe’ve already received.”
On Thursday, December 6, Olsenmet with Mike Peoni and Mike Dearingof the Metropolitan PlanningOrganization to discuss the MPO’spotential interest in supporting the ini-tiative. “As the region’s primary trans-portation planner, we seek out opportu-nities to increase mobility options whileenhancing quality-of-life throughout thearea,” says Mike Peoni. “Multi-modalstrategies help accomplish both of thesegoals. That’s why we’re again sponsoringThe Greenways Foundation’s Pedal &Park Program in 2002 and why we’revery interested in actively supportingtheir efforts to hold a charette on thesubject of a coordinated trails andgreenways system in early spring.”
A charette is basically a “meetingof the minds” held among people whohave a common interest – in this case,that of developing a regional greenwayssystem. “We’ve settled on a date for thecharette of Thursday, April 18th,” Olsennotes. He also explains that the charette
could involve Rory Robinson of theNational Park Service who hasexpressed a willingness to work on theproject, plus an invited list of partici-pants that would include planners andengineers from the nine-county area, aswell as elected officials and representa-tives of not-for-profit organizations suchas the Hoosier Rails-To-Trails Counciland Rail Corridor Development, Inc.Invitations will be in the mail by thefirst week of February.
“Subsequent charettes should beopen to interested members of the pub-lic,” Olsen notes, “but we think it makessense to use the first one to get the per-spectives of people who would beresponsible for implementing an eventu-al greenways/trails system throughoutthe various jurisdictions.” These juris-dictions include Hamilton, Madison,Marion, Hancock, Shelby, Johnson,Morgan, Hendricks and Boone Countiesand municipalities contained therein. “Itwould be an opportunity to network, toshare our issues and concerns, and tohelp this idea reach critical mass.”
Mike Dearing, the MPO PrincipalPlanner responsible for cycling- andpedestrian–related matters, agrees.“When we were identifying newMarion County bike routes, anddesigning our Users Map, we benefit-ed from the input of a diversegroup of qualified partici-pants, including planners,engineers, elected officials,even school children. Weplan on handling the develop-ment of Marion County’s pedestrianroute plan exactly the sameway right this year. The moresharing of ideas there is, the moreour product improves. . . and themore enthusiastic our con-stituency becomes.”
How quickly will aregional trail and greenwayssystem develop? “At thispoint, it’s too early to tell,”says Peoni. “We’re just
beginning to assess the level of interestamong our planning partners in neigh-boring counties. However, some havealready shown an eagerness to share intrail and greenways benefits, such asCarmel in Hamilton County with theirextension of the Monon Trail.”
“We also have implementationmodels from other areas to help guideour efforts,” Olsen points out.“Southeastern Michigan around AnnArbor and Detroit, the St. Louis-areaand Cleveland, Ohio have all beenwhere we are now. We can learn fromtheir past efforts how best to get a trailsand greenways system to spread seam-lessly through our region.”
For more information on theregional greenways system initiative,contact Tom Olsen at 317/297-1283([email protected]) or Mike Dearingat 317/327-5139 ([email protected]).
“
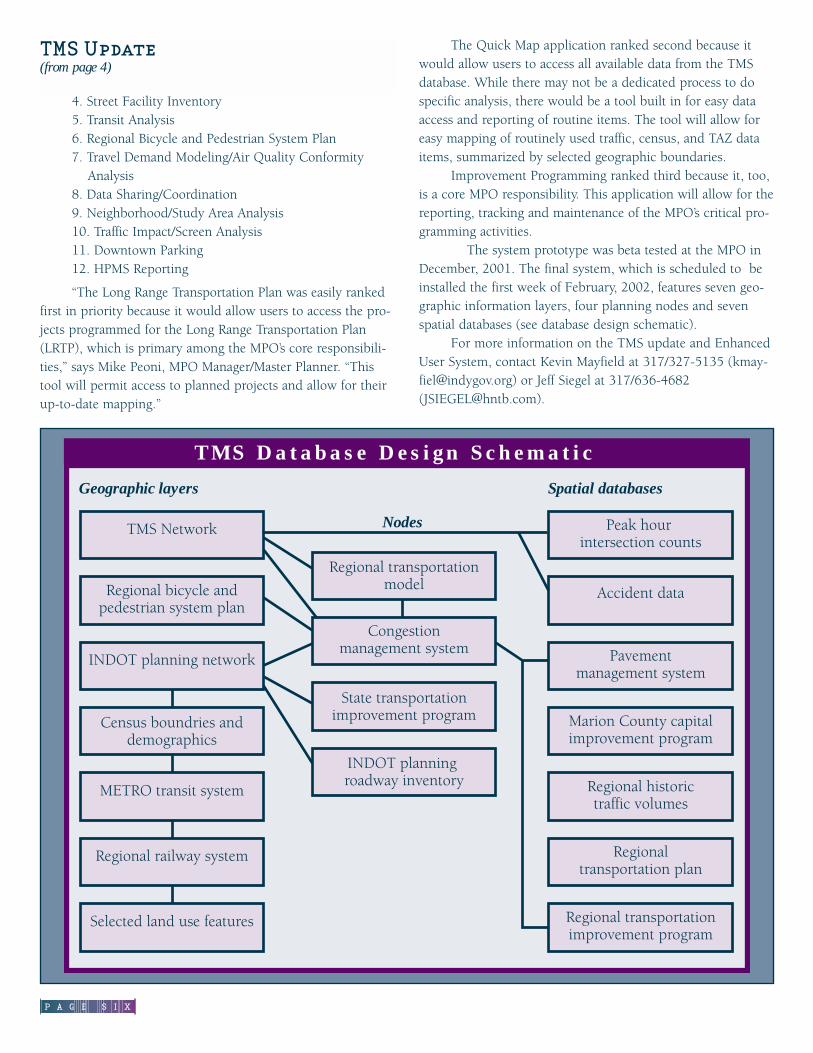
P A G E S I X
4. Street Facility Inventory5. Transit Analysis6. Regional Bicycle and Pedestrian System Plan7. Travel Demand Modeling/Air Quality Conformity
Analysis8. Data Sharing/Coordination9. Neighborhood/Study Area Analysis10. Traffic Impact/Screen Analysis11. Downtown Parking12. HPMS Reporting
“The Long Range Transportation Plan was easily rankedfirst in priority because it would allow users to access the pro-jects programmed for the Long Range Transportation Plan(LRTP), which is primary among the MPO’s core responsibili-ties,” says Mike Peoni, MPO Manager/Master Planner. “Thistool will permit access to planned projects and allow for theirup-to-date mapping.”
The Quick Map application ranked second because itwould allow users to access all available data from the TMSdatabase. While there may not be a dedicated process to dospecific analysis, there would be a tool built in for easy dataaccess and reporting of routine items. The tool will allow foreasy mapping of routinely used traffic, census, and TAZ dataitems, summarized by selected geographic boundaries.
Improvement Programming ranked third because it, too,is a core MPO responsibility. This application will allow for thereporting, tracking and maintenance of the MPO’s critical pro-gramming activities.
The system prototype was beta tested at the MPO inDecember, 2001. The final system, which is scheduled to beinstalled the first week of February, 2002, features seven geo-graphic information layers, four planning nodes and sevenspatial databases (see database design schematic).
For more information on the TMS update and EnhancedUser System, contact Kevin Mayfield at 317/327-5135 ([email protected]) or Jeff Siegel at 317/636-4682([email protected]).
TMS Update(from page 4)
TMS Network
Regional bicycle and pedestrian system plan
INDOT planning network
Census boundries and demographics
Regional transportation model
Congestionmanagement system
State transportationimprovement program
INDOT planning roadway inventory
METRO transit system
Regional railway system
Selected land use features
Peak hour intersection counts
Accident data
Pavementmanagement system
Marion County capitalimprovement program
Regional historictraffic volumes
Regionaltransportation plan
Regional transportationimprovement program
Geographic layers
Nodes
Spatial databases
T M S D a t a b a s e D e s i g n S c h e m a t i c
P A G E S E V E N
Downtown Parking
Whether you’re heading downtownfor a special event, or do so on
a regular basis to work, shop orsocialize, the best place tofind plenty of parking at abargain price may be theinternet. The City ofIndianapolis, your MPOand IndianapolisDowntown, Inc., now main-tain sites that feature parkinginformation.
Everyday From the MPO’s homepage
at www.indygov.org/indympo,you can access parking informa-tion gathered during the Year2000 update of the ParkingAdequacy Study of the CentralBusiness District (CBD), alsoknown as the Regional Center.This is the twelfth annual update ofa parking study first conducted in1987. These updates note and quan-tify significant changes occurring indowntown parking adequacy.
“The purpose of our annu-al updates is to track general park-ing supply and demand trends andto give us a better understandingof parking needs within the MileSquare Area and the largerRegional Center,” says SwesonYang, AICP, MPO ChiefTransportation Planner and plan-ner-in-charge of the ParkingAdequacy Study. “Our 2000 updateindicates that overall parking seemsadequate in the Mile Square with atotal surplus of 5,300 spaces.”
Updates are conducted usinga computer model that is main-tained by the Department ofMetropolitan Development –Planning Division to mon-itor changes in parkingsupply and demand (seebox, this page).Information on new
development is added, when available,from the Regional Center Zoning Reviewprocess. The model groups 101 down-
town city blocks into five districts(see map) and compares park-
ing space supply anddemand for each. It alsoaccounts for additionalparking available in thefringe area around theIndianapolis Regional
Center.In 1987, the study
indicated there was a deficitof 5,200 parking spaces in the
Mile Square. Taking intoaccount adjacent fringe areaparking, the deficit was 2,000.The following year, construc-tion of several parking garages
for the Pan Am Games yielded anet surplus of 6,700 parkingspaces in the Regional Center and2,500 in the smaller Mile Square.These figures serve as baselinesfor the subsequent annual year-end updates.
Downtown parking haseased since 1987. By the end of2000, the Mile Square achieved asurplus of 5,300 spaces as aresult of two factors. First, theconstruction of more than 15,600new parking spaces over the lastthirteen years, mostly in the formof multi-level garages, added tothe supply. Secondly, office vacan-cy rates rose from around 7% in1987 to 14.2% at the end of 2000(sources: Coldwell Banker, Surveyof Office Vacancy in the UnitedStates and F.C. Tucker Company,Inc. Real Estate Study). So, eventhough a significant amount ofoffice space has been introduced
to the market since 1987, thedemand for parking has
not kept pace. The officevacancy rate would haveto drop to reduce thecurrent surplus of
spaces. The theoretical “break-even
point” for the current parking supply inthe Mile Square is below a vacancy rateof 0%, exclusive of the surplus of spacesin the State Capitol district. For this rea-son, there is no deficit of parking spaceswith the existing land use demand andthe supply of parking spaces in down-town Indianapolis.
According to the 2000 analysis, theState Capitol (SC) District continues tohave a surplus of approximately 2,700spaces
Based on office employment fig-ures, the Northeast (NE) Quadrant con-tinues to have the highest demand forparking spaces in the Mile Square. Thisdemand was partially satisfied by the
cont on page 8, see Downtown Parking
Supply & Demand
The Parking Adequacy Study ofthe Regional Center determines park-ing Supply and Demand using bothpractical and theoretical information.
Supply is determined by thenumber of actual available parkingspaces multiplied by the effective sup-ply ratio (approximately 90% - 100%of total depending on facility types) toaccount for turnover delay.
Demand is determined by multi-plying the square footage of each landuse by a “demand ratio,” which repre-sents the number of spaces requiredper 1,000 gross square feet of build-ing, according to the type of land use.The Indianapolis downtown averagedemand ratio is 1.74 spaces per 1,000gross square feet of all land use types,excluding vacant spaces. This reflectsparking demand on a typical weekdaywithout major events at the RCADome/Convention Center or ConsecoFieldhouse.
Parking Adequacy is the com-parison of the Supply and Demandnumbers, noting the surplus or deficitin the various areas that make up theRegional Center.

P A G E E I G H T
construction of a 1,200 and a 700 carparking garage by Bank One, locatedbetween New Jersey and East Streetsand on Pennsylvania Street near OhioStreet, respectively. However, a parkingdeficit of 2,100 spaces was recorded inthe NE Quadrant at the end of 2000.This demand will be partially satisfiedby the new supply of parking spacesbeing prepared on the oldMarket Square Arena site andwithin the Bank One Tower.
The Northwest (NW)Quadrant registered a parkingsurplus of 2,300 spaces at theend of 2000.
The Southwest (SW)Quadrant, which lost so muchparking supply in the early ‘90’sto accommodate demolition asso-ciated with the construction ofCircle Centre Mall, and gained somuch parking demand due tothe addition of more than750,000 square feet of retailspace, posted a surplus of about400 spaces in 2000. The openingof Express Park at 80 N.Pennsylvania (Block 056) with682 spaces and the 390-cargarage adjacent to the EmmisBroadcasting at 40 MonumentCircle contributed to the surplus.The Faris renovation project at15 W. South Street (Block SW01)will add 523 more spaces.
The Southeast (SE)Quadrant is experiencing somemajor changes. The IndianapolisCapital Improvement Board built a2,632-space parking garage on VirginiaAvenue (Blocks 083 and 084) to accom-modate the new Conseco Fieldhouseand Anthem office complex. New com-mercial lots with 215 spaces have beenadded in Block 097 at 365 S. Meridian.And, Eli Lilly has met all necessary zon-ing requirements for constructing an
employee parking garage of 1,552spaces. On a normal weekday without aspecial event, the SE Quadrant has asurplus of 1,900 parking spaces.
Special EventThings can change when special
events bring even more people thanusual downtown to increase demand forconvenient parking. But there’s stillplenty to go around if you know whereto look! Try Indianapolis Downtown,
Inc.’s web site, www.indydt.com/event-parking, which is also accessible fromthe City’s homepage (www.indygov.org).There you’ll find brand new information(January 17, 2002 posting!) on the bestbargains in parking during sold-outConseco Fieldhouse Events. Theseinclude the following:
FREE• Meters after 6 PM on weekdays,
and all weekend long
Downtown Parking(from page 7)
Y o u r M P O s t a f f. . includes these people who would be happy to address your comments or questions on
any aspect of the transportation planning process:Stephanie Belch • Senior Planner 317/327-5136Steve Cunningham • Senior Planner 317/327-5403Mike Dearing • Principal Planner 317/327-5139Kevin Mayfield • Planner 317/327-5135Michael Peoni, AICP• Manager/Master Planner 317/327-5133Sweson Yang, AICP • Chief Transportation Planner 317/327-5137For more information on our regional transportation planning process, visit the MPO web site atwww.indygov.org/indympo.
cont on page 20, see Downtown Parking

P A G E N I N E
MPO Profile
Meet Linda Minter, a neighborhood activist and advo-cate whose dedication to the people, places and
potential of the area in which she has lived and worked forthe last fifteen years prompted her participation in theregion’s transportation planning process.
“I was originally asked toattend meetings of the MPO’sCitizens Advisory Committee(CAC) to represent the OakhillCivic Association by its then-President, Litdell Nichols. Thatwas back in early 1998, justabout the time the CAC starteddedicating a lot of attention tothe conNECTions study ofNortheast Corridor transporta-tion and to finding ways to
reduce congestion and increase mobility. Living within thatcorridor, we were interested in knowing what impacts, orbenefits, the strategies under consideration might mean forthe Martindale-Brightwood community.” Since that time,Linda has become a regular attendee and, in 2000, wasnamed to the CAC as a member. “I got hooked,” she says, “I was finding out too much good information not to keepcoming back.”
That information serves her well in her current job asMartindale-Brightwood Neighborhood Coordinator, a posi-tion she’s held since April 1999. Now, from her office at2855 N. Keystone Ave in the new Genesis Building, Lindaaddresses the needs and interests of residents in the areabound by 30th Street on the north, Sherman Drive on theeast, I-70 and Massachusetts Avenue on the south and theMonon Trail on the west through a variety of social serviceprograms. “We’re all about improvement, enhancement andgrowth,” she says, referring to programs that not only aidindividuals, but revitalize neighborhoods. As proof ofprogress, she points out that Martindale-Brightwood is oneof only two Indianapolis neighborhoods to receive a grantfrom the Annie E. Casey Foundation (the other is theSoutheast Umbrella Organization - SUMO) which workswith residents, civic groups, public and private leaders andfaith-based organizations to promote programs, activitiesand policies that support family-oriented environments.
“Our roster of services is constantly growing andchanging, but will always reflect the priorities of the peoplewe serve,” states Minter. “Those priorities include meetingthe specific needs of youths and seniors, providing someshort-term emergency assistance, and job-training.” Other
issues of neighborhood interest or concern include vacanthousing, crime trends, area beautification, commercial/retaildevelopment and, yes, transportation planning.
“Our interest in working with the MPO didn’t endwith the Public Hearings on conNECTions’ DraftEnvironmental Impact Statement (DEIS) in November,”Minter says. “There are a number of on-going transporta-tion-related issues that directly impact the quality-of-life inmy neighborhood. One is the constant noise and vibrationcaused by truck traffic along residential streets, like RalstonAvenue between the 2300 to 2500 blocks. That’s an area ofbrand new homes,” she notes. “Those same trucks can hard-ly maneuver the intersection at 25th and Keystone. Whenthey try, traffic is backed up.”
Other issues of interest to Minter and her neighborsinclude the Keystone Enterprise Park which is currentlyplanned to have only one major entrance/exit, the area’spoor transit service, and the high traffic volumes onKeystone Avenue – long a source of neighborhood frustra-tion.
“It’s probably just a matter of time before Keystone iswidened,” Minter says. “Given its traffic volumes, it proba-bly should be. But, through my participation and that of myneighbors, we can make sure it’s done in a way that mini-mizes its impact on an area we love, where our children aregrowing up, and where a lot of us plan to grow old.”
This mother of five with two still at home practices thepower of participation. “I listen. I learn. And I let peopleknow what I think. How else are you going to change thingsfor the better?”
Martindale Brightwood Neighborhood
Linda Minter
CAC Member/Good Neighbor

P A G E T E N
www.fhwa.dot.gov (Federal HighwayAdministration)
www.fta.gov.org (Federal Transit Administration)
www.i69indyevn.org (I-69 to Evansville)
www.indygo.net (IndyGo)
www.indygreenways.org (Indy Greenways)
www.state.in.us/index.html (Access Indiana)Use this for accessing all state agencies, the
Indiana General Assembly concerning legislative activity, andto access the Indiana Code.
www.in.gov/dot/trafficwise (Intelligent TransportationSystems -ITS)
www.in.gov/dot/publications/longrange (INDOT’s 2000 –2025 Statewide Long Range Plan)
www.state.in.us/dot/multi-modal/ithp.htm (Multi-modalDivision at INDOT - aeronautics, rail, transit, scenic byways,and bicycle/ped)
[email protected] (Surface Transportation PolicyProject, - a non-profit organization working to ensure a diver-sified transportation system.)
www.statelib.lib.in.us (Indiana State Library)
ww.epa.gov/oar (US EPA’s Office of Air and Radiation).
http://search.bts.gov/ntl (US DOT’s National TransportationLibrary search engine)
If any teMPOreaders have other trans-portation-related sites torecommend, please e-mailthem to me and we’llcompile a list for a futureissue of teMPO. Contactme, Mike Dearing, at317/327-5139 or [email protected].
Questions & Answers(from page 2)

SR 431 Preferred
Alternative
Among the highway projects includ-ed in the Indiana Department of
Transportation’s (INDOT’s) 2000-2025Long Range Plan (see related story, page1) is the proposed improvement of StateRoad (SR) 431 (Keystone Avenue) from96th Street to US 31 in Clay Townshipand the City of Carmel. INDOT, with itsconsultants at Parsons TransportationGroup (PTG), conducted anEnvironmental Assessment (EA)
of the 4.7-mile corridor as afirst sttep toward helping to reducetraffic congestion and improve motoristsafety.
The EA found that:• Four of the eight intersections in
the 4.7 stretch of highway are currentlyfunctioning at deficient levels of service(E or F). Levels of service range from A(free-flowing traffic with no congestion)to F (extremely heavy traffic conges-tion). Under INDOT standards, D is theminimum acceptable level of service.
• If no improvements are made,five of the eight intersections are pro-jected to function at level of service Fby the year 2025.
• Seven of the eight segments ofthe roadway have crash rates thatexceed the statewide average.
• Significant growth in population,employment and residential/commercialdevelopment is projected to continue inthe City of Carmel and Clay Townshipand surrounding communities, resultingin increased demands on SR 431.
Based on these findings,INDOT considered a variety of strate-gies for improving SR 431 (see box,page 18) before arriving at a PreferredAlternative that includes the followingelements:
• Widening the roadway from fourto six lanes from 98th Street to US 31by adding one travel lane in each direc-tion within the 44-foot grassy medianthat separates traffic. The roadwaywould be widened to eight lanesbetween 96th and 98th Streets.
• Reconfiguring five of the nineintersections to add turn lanes (96th,
116th, 126th and 131st Streets andCarmel Drive).
• Wideningand rehabilitating
the twinbridges overCool Creek to
accommodate theadded lanes.
• Closing the median atthe 99th Street intersection to
restrict turning movements to rightturns only.
• Installing concrete medians on96th Street at the SR 431 intersection toeliminate left-turn movements into andout of the adjacent commercial properties.
The Preferred Alternative wouldsignificantly reduce traffic congestionwith relatively few impacts on the sur-rounding natural and human environ-ments. With the recommendedimprovements, all eight intersectionswould meet or exceed INDOT’s mini-mum standards for traffic flow.Without the improve-ments (The No-Action Alternative),five of the eightintersec-tions
would function at the lowest level ofservice (F).
Traffic volumes are projected toincrease with or without the recom-mended improvements. Compared withmaking no improvements, the PreferredAlternative would have little or no effect
P A G E E L E V E N
cont on page 22, see SR 431 Alternative

“
P A G E T W E L V E
Snow Plan Facts
Even if we end up getting no snow this winter, we have to beready. . . just in case,” says Pat Carroll, Administrator of
Maintenance Services for the Indianapolis Department of PublicWorks (DPW). “When the flakes start falling is no time to figureout who, what, where, when and how much.”
Whether or not we find ourselves adrift in the white stuffsome time soon, we have the comfort of knowing that snowremoval plans for the 2001-2002 season were already well inplace last fall, when the City’s snow phone (327-SNOW) and website (www.indygov.org/dpw/snow) went on-line. That November1st activation date was the result of a planning process thatinvolved the DPW and Local 725 of the American Federation ofState, County and Municipal Employees (AFSCME), as well as other City Departments.“We’re trying to guard against surprises, so itmakes sense to get relevant input from all theplayers,” explains John Burkhardt, Manager ofDPW’s Traffic Operations Section, who provid-ed input for this story.“This year, that addedup to some significantchanges in our thinking.
Included among those changes for the2001-2002 snow removal plan:
• Further consolida-tion of routes resultingin average routes ofapproximately 60–65miles vs. 75 miles orhigher in the past.
• Greater con-centration onestablished highpriority routessuch as WashingtonStreet, Madison Avenue, Meridian Street, 38th Street, 82nd Street,86th Street, Keystone Avenue, Binford Boulevard. and ShadelandAvenue.
• Experimentation with agricultural based pre-treated saltproducts generally in the mile-square downtown area. These envi-ronmentally
friendly products spread better, activate faster and eliminateliquids.
• Addition of four smaller one-ton trucks equipped withplows for smaller common areas and narrower downtown alleysand residential areas.
The City’s snow fighting operations are directed from theSnow Operations Center at 1725 S. West Street. Operations arecoordinated by radio through the DPW Dispatch Center at the
Metropolitan Emergency Communications Agency (MECA) andthrough the use of Snowfighter software, which allows for graphi-cal plotting of the plowed and unplowed snow routes and permitsreal time input from each of the DPW garages. This software inter-faces with the City’s Infrastructure Management System (IMS) andprovides up-to-date summaries of labor, material and vehicle costs.
Labor DPW has over 350 individuals, from every DPW
Operations section, performing as office assistants, semi-skilledlaborers, snow drivers, heavy equipment operators, supervisorsand managers available for normal and extended (12 hours) snowfighting shifts, if necessary. In addition, DPW has 25 on-call con-tractors available for plowing residential areas during heavy snow-storm activity. When contractors are called out for residentialplowing, the Department of Metropolitan Development (DMD)supplements the DPW staff with field inspectors.
MaterialThe City’s salt barns hold approxi-mately 20,000 tons of salt and arecurrently at 100% capacity. Thesesalt barns are located at or near theMartin Luther King, 21st andSherman, and West Street City
garages; at 65th and BinfordBoulevard (northeast side); on
Lafayette Road at Trader’s Point(northwest side); near TibbsAvenue and Southport Road
(south side); at Five Points near I-74 and I-465 (southeast side).
VehiclesDPW has 85 snow
trucks equipped withplows and salt spread-
ers. There are anadditional 30 Solid
Waste trucks equipped withplows, if the weather becomes progressively worse. White RiverEnvironmental Partners (WREP), the private consortium thatmanages the waste water treatment and collection system, alsoprovide a limited number of vehicles and drivers. In addition, on-call contractors have 117 pickup trucks with plows and morethan 250 heavier pieces of equipment for plowing and hauling.
“Our people are highly motivated and trained in the newestsnowfighting techniques each year,” explains Steven Quick, AFC-SME Local 725 President. “How we deploy them to maximize thebenefit of their efforts is always a joint decision between labor andmanagement and reflects a great, on-going partnership.”
For additional information on the City’s 2001-2001 SnowPlan, call Pat Carroll DPW Administrator, Maintenance Services,at 327–2954 ([email protected]).

PAGE THIRTEEN
Irons In The Fire
conNECTions’ DEIS Public HearingsAs previously reported in teMPO (Fall, 2001), the
conNECTions study of Northeast Corridor Transportationreleased its Draft Environmental Impact Statement (DEIS)on September 28 for sixty daysof public review and comment.As part of that process, theIndiana Department ofTransportation (INDOT) con-ducted Public Hearings onThursday, November 15th atBroad Ripple High School. Thefirst session, held from 3:30 to6:00 PM, drew about 70 atten-dees and was covered with alive remote broadcast byChannel 13, WTHR. TheGovernment Access Channel,WCTY (Channel 16 onComcast and Time-Warner)also taped the session for re-broadcast. The second session,held from 7:00 to 9:30 PM,attracted more than 200 atten-dees and was the subject ofdrive time features by WIBCRadio the following day. Bothsessions were promotedthrough advertising and articlesin The Indianapolis Star, TheNoblesville Ledger andSoutheastern Hamilton CountyTopics.
The purpose of the PublicHearings was to gather com-ments on various aspects of theDEIS which offered findings onthe impacts that eight proposedtransportation options are likelyto have on the region’s humanand natural environments.These options, intended toreduce traffic congestion andincrease mobility throughoutthe region’s busiest travel corridor, include highway expan-sion, new and expanded bus service, and rail/bus transitsystems. Those wishing to express an opinion to the group
on the findings of the DEIS were asked to register before theHearings, but impromptu speakers were accommodated inthe casual atmosphere. Those attending also had the oppor-tunity to tape their comments on a recorder stationed out-side the auditorium, or to voice them directly to members ofthe MPO staff who hosted an Open House throughout the
day featuring detailed maps andinformative displays.
Each of the PublicHearings began with introduc-tory remarks by Rickie G.Clark, Jr., Hearings Officer atINDOT. Brief presentations fol-lowed by Mike Peoni of theIndianapolis MetropolitanPlanning Organization, whogave an overview of the needfor the study; John Myers ofParsons Brinckerhoff, projectconsultants, who described thetransportation options underconsideration; and, CaronKloser of HNTB Corporation,who addressed environmentalissues. In both of the Hearings,the majority of the time wasspent on public comment,which ranged from the general-ly critical to the highly support-ive, including:
. . . the region must lookfor alternatives to the singleoccupant car to mitigate ourtraffic problems. And, we haveto do it before our quality-of-life is irreparably damaged.
. . . I don’t sense thatthere was any thought given tothe amount of traffic congestionthat would be caused by a railline that would intersect dozensof streets between Castletonand downtown.
. . . the DraftEnvironmental Impact Statement
makes clear that Avalon Hills has kind of severe highwaynoise problems. These will become intolerable if I-465 iswidened which will move the traffic closer to existing homes.We need a commitment to noise abatement measure.
cont on page 21, see Irons In The Fire
PAGE FOURTEEN
such as State Police and trained medicalpersonnel. This rapid flow of informa-tion enables roadside assistance to arrivemore quickly, clearing congestion-caus-ing incidents faster than ever before.Whether they are flat tires or hazardousmaterial spills.
TheoryNot so long ago, talk of INDOT’s
Advanced Traffic Management System(ATMS) was more theory than practice,”Newland notes. ATMS refers to specifictechnologies employed by the umbrellaIntelligent Transportation System, whichcoordinates its various components.“My predecessor at INDOT, Dan Shamo,used to talk about the “3-N trio” ofcommon-sense guidelines that recom-mended the use of these systems toskeptical transportation planners,” saysNewland.
The first “N” was “Know what’sgoing on.” Though its starts with a “k”instead of an “n”, the point of thisguideline is that the quicker potentialtraffic problems are recognized, thequicker they can be solved. As an exam-ple, Mr. Shamo used tocite the following ruleof thumb for INDOTplanners: If 465 isshut down for 30minutes, it takes 90
min-
utes - 3 times as longer - for traffic to getup and running again. Total interrup-tion: 2 hours!
The second “N” that recommendsITS use is “Nip the problem in the bud.”
The idea is to rectify a problem assoon as possible to minimize the impactof any resulting delay. Examples hereinclude the Hoosier Helper Programwhich INDOT has always concentratedexclusively on its highways. “It justmakes sense to continue doing that,”says Sweson Yang, MPO ChiefTransportation Planner and planner-in-charge of ITS-related issues. “Interstatesrepresent only 3% of all Indiana road-ways, yet carry about 40% of our traffic.Higher usage of highways makes main-taining traffic flow even more criticalthere.”
The third “N’ Shamo used to citeis “Notify the public.” When a trafficproblem has been identified that can’tbe immediately fixed, the next bestthing to do is try to minimize theamount of traffic delayed by it. This canbe done by informing drivers of upcom-ing travel conditions which allows themto choose an alternative route.
“We’ve come a long way sinceINDOT employed its first ATMS strate-gy,” Newland says. “But every technol-ogy we’ve installed since still puts thatoriginal theory into practice.”
Practice Still chief among the ATMS
strategies INDOT relies on are theHoosier Helpers — good Samaritanswho continuously travel a prescribedcircuit from 5 AM - 8 PM looking fortravelers in distress and who aided morethan 10,000 Indiana motorists in 2000— the last full year for which figures areavailable. The freeway assistance patrols,are a key component of the TrafficWiseSystem. By providing them with up-to-the-minute traffic information,TrafficWise helps the emergency vans dotheir job of minimizing the impact oftraffic-delaying incidents, such as flattires or empty gas tanks. In return, the
Hoosier Helpers feed field informationdirectly into the TrafficWise InformationSystem, via cell phones and laptop com-puter links, enabling it to keep trafficmoving safely and efficiently by inform-ing drivers of current highway condi-tions.
Other ways TrafficWise collectsand disseminates information includeoverpass sensors which determine theaverage speed, volume and lane occu-pancy of the traffic that passes below;speed sensors embedded in the pave-ment; Dynamic Message Signs (DMS,also called Variable Message Signs orVMS) which alert drivers to upcomingconditions; closed-circuit cameras (likethe 120 Marion County will eventuallyhave in place) that permit visual high-way monitoring; advisory radio (AM530/1610), alphanumeric pagers and,eventually, live video on the web. “All ofthe collection technologies report trafficslow downs or interruptions to INDOT’sTraffic Management Center (TMC),”Newland notes, “which then uses thevarious dissemination technologies toinform travelers so they have the option
cont on page 15, see ITS Revolution
ITS Revolution(from page 1)

of choosing an alternate route.”These technologies have proven so
successful that they’ve encouraged rapidgrowth within the TrafficWise system.“Right now, we have 11 dynamic mes-sage signs at work in 9 locations withinthe Indianapolis MPA,” Newland notes.“Next spring, we’ll start new installa-tions that will bring the total to 23 in18 locations.” Another sign of success isthe new Traffic ManagementCenter/State Police Post at 21st Streetand Post Road that will be sent out forbid in February and completed by late2003. “This will be a fairly unique facil-ity, but we’ve studied a similar installa-tion in Michigan and are reallyimpressed with all of the opportunitiesfor synergy,” he says. “After all, ouroffice is the highway. We have that incommon with the State Police and wehave complementary information sys-tems.”
511 Traveler InformationSystem
One INDOT ITS innovation is sonew that Newland hesitates to talkabout it – the 511 Traveler InformationSystem. “ We are just barely in the plan-ning stage,” he says. “Once it’s up andrunning, though, this system will revo-lutionize travel nationwide.”
The Federal HighwayAdministration (FHWA) has designated511 as the travelers equivalent of 911. Ifyou’re in need of assistance, no matterwhere you’re traveling, you can dial 511and receive pertinent transportation-related information. “Eventually, weenvision our system as offering traveltimes along specific routes, destination-specific route recommendations, travelhighlights, transit schedules, everythinga traveler could want, but that’s a longway off,” Newland says.
The first step is applying for$100,000 in seed money which theFHWA is making available to every statefor 511 system planning purposes.
INDOT’s application will be filed inearly 2002 and Newland feels goodabout the direction it maps out. “We’veworked cooperatively with theWisconsin and Illinois DOT’s for sometime,” he says, “and it makes sense todo so on 511, as well.”
The proposed Indiana-Illinois-Wisconsin joint venture would pool theplanning money for all three states todesign and implement a “gateway” sys-tem along the Gary/Chicago/Milwaukeetravel corridor. The system would behoused in Illinois and would include acentral computer into which all threeparticipating states would feed currenttravel information on an on-going basis.This computer would be the system’sbrain which would respond to requestsfor information. When operational,the system would serve as a templatefor others employed throughouteach state.
“That’s about as much aswe know so far,” saysNewland. Specific issues, likehow effective the systemwould be in rural areas, orwhether or not cellular phonecompanies might make travel-er-assistance calls toll-free,still need to be worked out.“We’re pretty much out in frontof this technology,” Newlandnotes. Right now only one state,Kentucky, has a 511 system in oper-ation.
“The ITS technology in develop-ment, and currently in use, is truly cut-ting-edge,” Newland says. “When ourTrafficWise system is complete, our website will provide real time informationon highway conditions in theIndianapolis region, the Gary area andthroughout the state, including currenttravel times and live video feeds.” Inaddition, drivers will be able to sub-scribe to a paging service that warns ofupcoming traffic tie-ups. “INDOT cur-rently operates Traffic ManagementCenters in Indianapolis and Gary,”
Newland states. “If needed, either facili-ty could manage the other’s system.”INDOT is also a partner in a similar sys-tem in southern Indiana outside ofLouisville.
“I’ve heard the benefits of ITS onthe regional traffic flow described asequivalent tothat of adding atraffic lane ineach direction,but I think itsgreater,” saysNewland.“It
offersnot only convenience and safety, butpeace-of-mind that we’re planning nowto maintain our mobility and quality-of-life in the future.”
For more information onTrafficWise and INDOT’s use of ITStechnologies, visit the TrafficWise website at www.in.gov/dot/trafficwise Or,contact Mark Newland at INDOT(317/232-5523) or Sweson Yang at317/327-5137 ([email protected]).
ITS Revolution(from page 14)
P A G E F I F T E E N

range plan of their own. Instead, we had to identify all of theneeds on the state system within our planning area andINDOT would pick the projects they were willing to fund.Having a State Plan in place will be a great help to us and, I’msure, to the state’s other eleven MPOs.”
In the Intermodal Surface Transportation Efficiency Actof 1991 (ISTEA), federal transportation legislation required thepreparation of a statewide plan, but did not specify its form orlevel of detail. Between 1993 –1995, INDOT developed amulti-modal policy plan that addressed highway, bicycle,pedestrian, transit, rail and air issues. It also incorporatedwater-based transportation information provided by a sisteragency. The new Statewide Transportation Plan is a combina-tion of this Policy Plan and a 2001 update of the 1995Highway System Plan.
The purpose of the Plan is to identify highway improve-ment project priorities throughout the state from border toborder. This was accomplished by assessing infrastructure
needs based on population growth, number of household andemployment forecasts, as well as current and anticipated traveland development trends. Once the assessment was complete,INDOT and its planning partners developed a list of recom-mended improvements intended to maintain a good level ofservice throughout the state’s highway system despite project-ed traffic increases. INDOT reconciled the list of recommend-ed improvements with fiscal resources anticipated to be avail-able during the implementation period. In this way, theStatewide Transportation Plan, now in its draft form, recom-mends only cost-feasible’ improvements.
“Part of the assessment job was classifying our variousstate roadways into three categories,” says Smith. “The first,Category 1, identifies statewide mobility corridors that carrythe highest volume of traffic and connect communities withpopulations of 25,000 or more. In our current plan, thisaccounts for approximately 20% of all state roadways. Ofcourse, this percentage will change as populations shift orincrease and communities grow.
Long Range Transportation Plan(from page 1)
P A G E S I X T E E N
cont on page 17, see Long Range Transportation Plan
Category 2 or Regional Corridors, which account foranother 20% of all state roadways, connect communities withpopulations of 5,000 – 25,000 and connect to Category 1roadways. Category 3 roadways provide lower speed traveland serve adjacent land uses, making up the remaining 60%of state roads.
“Once we developed improvement project recommenda-tions working with transportation planners and engineers fromthroughout the state, we offered all of our planning partners,including the general public, the opportunity to review andcomment on what we’ve put together,” Smith notes. “That wasan extensive process that continues to this day.”
Public Input ProcessTo build awareness among, and encourage participation
and input from, its various professional and public planningpartners in the development of its Long Range TransportationPlan, INDOT relied on informative literature, personal presen-tations, and special events. In August, during the Indiana StateFair, informational brochures concerning the Plan’s develop-ment and participation opportunities were handed-out tomore than 1,500 fair-goers. The same brochure was sent outas direct mail to 1,200 elected officials, special interest groupssuch as the Hoosier Environmental Council and the IndianaBicycle Coalition, as well as Indiana’s transportation engineersin all of Indiana’s 92 counties.
Between September 5 and September 20, INDOT heldpublic meetings in each of its six districts, soliciting commentson proposed improvement projects. (NOTE: sessions plannedfor September 11 were cancelled due to the terrorist attacks.)Two sessions were held at each location to accommodate thegreatest number of attendees and those with specific schedul-ing needs. The first was held at 2:30 – 4:30; the second from5:30 – 7:30. A total of 383 participants attended. In addition,
INDOT made presentations to all twelve state MPOs to insurethe draft plan reflected local priorities as well as a “big picture”perspective.
“INDOT made its presentation of the draft Plan to us onNovember 1, 2001,” Peoni remembers. “These are people weknow real well and work with all the time but, still, we werevery impressed with the effort. Among other things, this docu-ment helps us insure the comprehensive and coordinatednature of our regional planning process and aids us in satisfy-ing air quality conformity regulations.”
“Working with the MPO’s on their air quality analysiswas a big impetus in getting a statewide, project-specific plandone,” Smith notes. “They really can’t plan to stay within airquality guidelines with any degree of certainty without know-ing the types of roadway projects, such as highway laneexpansions or new roadway alignments. INDOT is planning toimplement. Clearly, changes we’re making to a regional trans-portation system impacts that region’s air quality.” For this rea-son, the Long Range Transportation Plan will be updated everytwo years. MPO’s with air quality maintenance issues, such asMarion County’s, are required to update their own regionalplans every three years.
INDOT willaccomplish itsbiannual Planupdatesusinginformationfrom theProgramDevelopment Process(PDP) conducted in eachof its six districts (Crawfordsville, FortWayne, Greenfield, LaPorte, Seymour,Vincennes). Through this process, theywill work with transportation plannersand programmers to identify shiftingimprovement priorities and newly recog-nized needs. “It’s basically the same waywe worked together to develop the draftPlan,” Smith says. “We’re going to contin-ue getting input from the people who live,work and travel in their own areas every-day.”
For more information on thecontents of the draft Long RangeStatewide Transportation Plan or howit was developed, contact SteveSmith of INDOT at 317/232-5646([email protected]). Or, review the document in detailon the web at www.in.gov/dot/publications/longrange/index.html.
PAGE SEVENTEEN
“The development of the INDOT Long-
Range Plan has really highlighted the
benefits of working cooperatively with
the state’s twelve MPOs to focus our
limited transportation dollars on those
improvements that will provide the
greatest benefit for our travelers.”
— J. Bryan Nicol
INDOT Commissioner
Long Range Transportation Plan(from page 16)

P A G E E I G H T E E N cont on page 19, see INDOT’s Long Range Plan
The INDOT 2000-2025 LongRange Plan lays out a strategy for thefuture of the state highway system,which is intended to provide Hoosierswith the highest level ofmobility and safety possi-ble, and to meet the needsof economic developmentand quality-of-life into thenext quarter of a century.The Long Range Plan pro-vides an update of the1995 Statewide MultimodalTransportation Plan, enti-tled Transportation inIndiana: Multimodal PlanDevelopment for the 1990’sand Beyond. The 1995 mul-timodal policy provides afoundation for developingmore detailed plans forspecific travel modes. Thishighway plan document isintended to extend theplanning period for high-way improvements fromthe initial five years of the1995 Plan to a 25-yearplanning horizon. Thisextended planning periodprovides INDOT and itsplanning partners, includ-ing the state’s 12Metropolitan PlanningOrganizations and other key transporta-tion stakeholders, a long range vision ofhow the state’s jurisdictional highway
system will develop in the future.INDOT divides the state into six
districts known as Crawfordsville, FortWayne, Greenfield, LaPorte, Seymour
and Vincennes. In addition, it works incooperation with 12 federally mandatedMetropolitan Planning Organizations
with urban populations greater than50,000. These MPOs are primarilyresponsible for transportation planningin the urbanized areas of Anderson,
Bloomington, Evansville,Fort Wayne, Indianapolis,Kokomo, Lafayette,Louisville, Muncie,Northwest Indiana, SouthBend-Elkhart and TerreHaute.
A total of approximate-ly 509 projects are pro-grammed into the 2000 –2025 Statewide Long RangePlan. About ninety of thoseprojects are currently slatedfor the Indianapolis MPAand are represented here.Because the Plan is still indraft form, the number andtype of projects it includesmay change before it isapproved in February, 2002.
For more informationon the Indianapolis MPAprojects identified inINDOT’s 2000 – 2025 LongRange Plan, contact SteveSmith, INDOT Manager ofLong Range TransportationPlanning Section at 317/232-5646([email protected]) or
Mike Peoni, MPO Manager/MasterPlanner, at 317/327-5133([email protected]).
INDOT’s Long Range Plan for the MPO Planning Area
Project # Route Project Type Length Phase Cost (000) Description District149 36 Added Travel Lanes 3.37 1 $21,112 0.22 mile east of Post Rd to 0.2 mile east of Oaklandon Rd Greenfield150 36 Added Travel Lanes 2.03 1 $15,255 0.18 mile west of I-465 to 0.22 mile east of Post Rd (Phase Greenfield151 36 Added Travel Lanes 2.1 1 $10,707 0.2 mile east of Oaklandon Rd to 0.18 mile east of CR 750N Greenfield92 40 Added Travel Lanes 2.2 1 $12,653 Raceway Rd to Research Dr Crawfordsville155 40 Median Construction 1.83 1 $12,152 Grassy Creek to Buck Creek (1.57 mi W to 0.26 mi E of Mario Greenfield158 52 Added Travel Lanes 1.25 1 $11,858 I-465 to Post Rd Greenfield207 65 Added Travel Lanes 5.28 1 $73,496 Kessler Blvd to 0.5 mile north of I-465 (West Leg) Greenfield169 70 Added Travel Lanes 0.64 1 $1,743 EB I-70 from the Pine St on ramp to the 5th lane on EB I-70 Greenfield170 70 Interchange Modification 0.5 1 $11,200 At Mt. Comfort Rd, 7.7 miles west of SR 9 Greenfield190 70 Added Travel Lanes 2.23 1 $18,780 5.7 km east of SR 267 to 1.1 km west of I-465 Greenfield191 70 Added Travel Lanes 1.12 1 $28,170 1.1 km west of I-465 to 0.72 km east of I-465 (West Leg) Greenfield192 70 New Interchange Construction 2 1 $36,223 At Six Points Rd Greenfield226 70 Added Travel Lanes 4 1 $25,830 0.5 mile west of SR 267 to 3.5 mile east of SR 267 Crawfordsville31 135 Added Travel Lanes 1.9 1 $7,450 CR 700N (Stones Crossing Rd) to Smith Valley Rd Seymour101 421 Added Travel Lanes 2.01 1 $13,300 0.89 mile north of I-465 to 0.65 mile north of SR 334 (Phas Crawfordsville714 421 Added Travel Lanes 1.05 1 $9,602 0.16 mile south of I-465 to 0.89 mile north of I-465 (Phase Crawfordsville174 465 Interchange Modification 1.5 1 $24,650 At 86th St (West Leg) Greenfield175 465 Interchange Modification 1 1 $27,654 At 56th St / Shadeland Ave (East Leg) (Phase II) Greenfield206 465 Interchange Modification 3.5 1 $67,000 At I-70 (East Leg) (Phase I) Greenfield

206 465 Interchange Modification 3.5 1 $67,000 At I-70 (East Leg) (Phase I) Greenfield208 465 Reconstruction 1.52 1 $38,000 1.08 miles S of I-74 to 0.44 mile N of I-74 (East Leg) (Int Greenfield209 465 Reconstruction 1.56 1 $31,390 0.44 mile N of I-74 to 0.5 mile N of US 52 (East Leg) (Inte Greenfield120 31 New Interchange Construction 2.01 2 $17,400 At SR 38 Greenfield121 31 New Interchange Construction 0.87 2 $11,431 NB US 31 Mainline at 146th St Greenfield139 32 Added Travel Lanes 1.6 2 $8,766 2.58 km west of US 31 to US 31 Greenfield104 36 Added Travel Lanes 6.1 2 $13,750 0.96 mile east of SR 267 (Dan Jones Rd) to I-465 Crawfordsville156 40 Added Travel Lanes 2.36 2 $23,237 Franklin Rd to Grassy Creek (1.57 miles west of Marion/Hanc Greenfield159 52 Added Travel Lanes 3.12 2 $19,652 Marion / Hancock County Line to CR 500W Greenfield160 52 Added Travel Lanes 3.1 2 $18,370 1.33 miles east of I-465 to Marion / Hancock County Line Greenfield298 52 Median Construction 0.7 2 $2,458 Gem Rd to Sugar Creek, 7.6 miles east of I-465 to 8.3 miles Greenfield162 67 Added Travel Lanes 0.97 2 $4,109 Thompson Rd to I-465 Greenfield167 69 Added Travel Lanes 6.02 2 $190,000 I-465 to 6.02 miles north of I-465 Greenfield203 69 Added Travel Lanes 5 2 $30,000 SR 37 to SR 238 Greenfield96 70 Interchange Modification 1 2 $12,150 At SR 267 Crawfordsville32 135 Added Travel Lanes 4.07 2 $10,700 SR 144 to Stones Crossing Rd Seymour675 267 Added Travel Lanes 0.4 2 $3,550 0.1 mile north of I-74 to 0.5 mile north of I-74 Crawfordsville172 431 Added Travel Lanes 4.2 2 $47,000 96th St to US 31 Greenfield176 465 Interchange Modification 1.5 2 $24,000 At 71st St, 1.02 miles north of I-65 (West Leg) Greenfield177 465 Interchange Modification 0.5 2 $12,360 At SR 37 (South Leg) Greenfield193 465 Added Travel Lanes 2.14 2 $46,857 0.26 mile north of 10th St to 0.58 mile north of I-74 (West Greenfield194 465 Added Travel Lanes 1.35 2 $49,940 0.9 km north of I-70 to 0.9 mile north of US 40 (West Leg) Greenfield195 465 Added Travel Lanes 1.86 2 $36,281 0.57 mile north of US 40 to 0.26 mile north of 10th St (Wes Greenfield196 465 Added Travel Lanes 3.15 2 $44,327 0.58 mile north of I-74 to 0.3 mile south of I-65 (West Leg Greenfield197 465 Added Travel Lanes 2.45 2 $56,215 1.3 km east of SR 67 to 0.9 km north of I-70 (West Leg) (Ph Greenfield681 465 Added Travel Lanes 0.6 2 $15,000 0.3 mile south of I-65 to 0.3 mile north of I-65 (West Leg) Greenfield716 465 Interchange Modification 0.5 2 $8,936 At I-70 (East Leg) (Phase II) Greenfield118 31 New Interchange Construction 0.95 3 $3,362 NB SR 431 Mainline at 146th St Greenfield128 31 New Interchange Construction 0.39 3 $4,574 Southern Section US 31 Mainline at 146th St Greenfield129 31 New Interchange Construction 1.68 3 $93,305 At 151st St, 2.5 miles south of SR 32 & 161st St, 1.5 miles Greenfield130 31 New Interchange Construction 1.1 3 $22,996 At 136th St, 4.28 miles north of I-465 Greenfield131 31 New Interchange Construction 1.52 3 $35,072 At 126th St, 2.83 miles north of I-465 Greenfield132 31 New Interchange Construction 0.57 3 $16,289 At 116th St, 1.78 miles north of I-465 Greenfield133 31 New Interchange Construction 1.17 3 $26,964 At 106th St, 0.79 mile north of I-465 Greenfield204 32 Added Travel Lanes 2.4 3 $6,546 US 31 to Moontown Rd Greenfield153 37 Added Travel Lanes 10.8 3 $106,000 I-69 to 10.79 miles north of I-69 at end of dual lanes Greenfield472 37 Added Travel Lanes 3.11 3 $7,775 SR 144 to Smith Valley Rd Seymour617 37 Added Travel Lanes 1.4 3 $8,228 Edgewood Ave to I-465 Seymour618 37 Added Travel Lanes 2.57 3 $5,756 Bluff Rd to Edgewood Ave Seymour619 37 Added Travel Lanes 2.78 3 $6,241 Smith Valley Rd to Bluff Rd Seymour161 65 Added Travel Lanes 0.9 3 $18,485 Raymond St to I-70 South Split Greenfield215 65 Added Travel Lanes 1.4 3 $8,300 I-465 Northwest Connector to 0.5 mile north of SR 334 Greenfield216 65 Added Travel Lanes 3.6 3 $26,660 Greenwood Rd to Southport Rd Greenfield217 65 Added Travel Lanes 2.8 3 $25,650 Southport Rd to I-465 (South Leg) Greenfield219 65 Added Travel Lanes 2.6 3 $90,700 I-65/70 from the South Split to the North Split Greenfield335 65 Added Travel Lanes 4.9 3 $31,270 SR 44 to Whiteland Rd Seymour614 65 Added Travel Lanes 5 3 $30,930 Whiteland Rd to Greenwood Rd Seymour214 70 Added Travel Lanes 5.1 3 $31,720 0.6 mile east of Post Rd to 0.5 mile east of Mt. Comfort Rd Greenfield225 70 Added Travel Lanes 6 3 $106,890 I-65 North Split to I-465 (East Leg) Greenfield254 70 Added Travel Lanes 8 3 $51,310 0.5 mile east of Mt. Comfort Rd to 0.8 mile east of SR 9 Greenfield108 74 New Interchange Construction 1 3 $9,000 At Hendricks County North-South Corridor (CR 1000E) Crawfordsville205 74 Interchange Modification 0.5 3 $4,071 At Post Rd Greenfield105 421 Added Travel Lanes 2.7 3 $15,000 121st St to 146th St Crawfordsville178 465 Interchange Modification 1.5 3 $106,675 At US 31 (North Leg) (US 31 Freeway Upgrade) Greenfield200 465 Added Travel Lanes 3.3 3 $85,090 US 421 to west of US 31 (North Leg) Greenfield201 465 Added Travel Lanes 7.3 3 $200,000 East of US 31 (North Leg) to 0.43 km north of Fall Creek Rd Greenfield220 465 Added Travel Lanes 2.8 3 $33,190 0.5 mile north of 86th St (West Leg) to US 421 (North Leg) Greenfield134 31 New Interchange Construction 2.17 4 $56,653 At SR 32 Greenfield135 31 New Interchange Construction 1.01 4 $24,493 At 191st St, 1.59 miles north of SR 32 Greenfield218 65 Added Travel Lanes 3.1 4 $24,415 I-465 (South Leg) to Raymond St Greenfield189 70 New Interchange Construction 0.5 4 $12,000 At German Church Rd Greenfield146 267 New Road Construction 2.1 4 $4,746 SR 67 to SR 267 south of I-70 Crawfordsville147 334 TSM 1.07 4 $7,048 Zionsville Rd to US 421 Crawfordsville223 65 Added Travel Lanes 5.5 5 $75,000 I-70 North Split to 38th St Greenfield224 70 Added Travel Lanes 5.7 5 $75,000 Airport Expressway to I-65 South Split Greenfield221 465 Added Travel Lanes 7.7 5 $53,900 I-65 to 1.3 km east of SR 67 (South Leg) Greenfield222 465 Added Travel Lanes 9.8 5 $49,000 I-70 (East Leg) to I-65 (South Leg) Greenfield
Project # Route Project Type Length Phase Cost (000) Description District
INDOT’s Long Range Plan(from page 18)
P A G E N I N E T E E N

P A G E T W E N T Y
$1• Circle Centre Garages at 48 W.
Maryland St., 49 W. WashingtonSt., 26 W. Georgia St. and 100 S.Illinois St.
Must purchase at least $20 worth ofmerchandise from Circle Centre
Or, leave before event ends or stay atleast 1 hour after event end forregular parking rates.
The regular rate for Circle Centreparking is $10, if the precedingconditions are not met. However,Circle Centre rarely enforces thispolicy during Conseco Fieldhouseevents.
$2• Virginia Avenue Garage at 200 S.
Virginia Avenue - Top floor only• Lilly Lot at southeast corner of
Delaware and South Streets$3• Union Station at 301 S. Meridian St.• Express Parking Garage at 20 N.
Pennsylvania St.
• Penn Park Garage at 35 N.Pennsylvania St.
• Anthem/Contractor’s Lot at 201 S.Delaware St.
• Central MSA Lot at 301 E.Washington St.
• MSA South lot at 302 E.Washington St.
$5• Merchants Garage at 31 S.
Meridian St.• Born’s Lot at 230 S. Meridian St.• 239 S. Meridian St.• South of Union Station at 365 S.
Meridian St.• Express Lot #500 at 500 S.
Meridian St.• Express Lot #405 at 405 S.
Pennsylvania St.• Penn and South at 449 S.
Pennsylvania St.• Circle Block at 25 Illinois St.• LaRosa Lot at 101 S. Alabama St.• Barnes & Thornburg Lot at 15 E.
Washington St.
“Whether under average workdayor special event conditions, our down-
town Parking Adequacy is probably inthe best shape it’s been in the fifteenyears we’ve been doing the study,” notesYang. “We can’t guarantee there will bea place open for you right out front, butthere’s always going to be one withinwalking distance.” For more informa-tion on downtown parking, contactSweson Yang at 317/327-5137([email protected]) or Byron Brown ofIndianapolis Downtown, Inc. at317/237-2222 ([email protected]).
Downtown Parking(from page 8)
REGIONAL CENTER NUMBERING SYSTEM
For Use With The Parking Model
MILE SQUARE PARKING
SPACES

PAGE TWENTY ONE
. . . It’s the trucks.You can build 42 lanes across 465;it’s not going to make a bit of difference unless you keeptrucks off off them. Cars don’t make noise; trucks do.
In addition to the Public Hearings, the public wasencouraged to review the full DEIS at the MPO office, allpublic libraries within the Northeast Corridor study area,the office of the INDOT Development Engineer - GreenfieldDistrict, Office of the Hamilton County Auditor, and theINDOT Hearings Examiner’s office, Room N901 of theIndiana Government Center. Resulting comments could beforwarded to John Myers of Parsons Brinkerhoff. AnExecutive Summary of the DEIS was available for review onboth the MPO and conNECTions web sites(www.indygov.org/indympo, www.indygov.org/connections)where comments could also be submitted. In addition, theconNECTions Hot-line (1-877-NEC-LINK) also directedusers to call the MPO directly to voice opinions. The com-ment period ended 5 PM, Thursday, November 29th.
All comments received by that time have since beenpassed along to the Study’s Policy
Study Steering Committee which isco-chaired by Indianapolis Mayor
Bart Peterson, State Senator LukeKenley, and INDOT
Commissioner J. Bryan Nicol.The committee met on
Wednesday, January 16thto consider this input as
well as the findings ofthe DEIS. Its deci-
sions on how toproceed
with
conNECTions will be reported in future issues of teMPO.For more information, contact Mike Peoni at 317/327-5133 ([email protected]).
Glendale Special Neighborhood Study StatusThe public input phase of the Special Neighborhood
Study of the Glendale Area officially ended November28th following a two-month extension past its scheduledSeptember completion to accommodate continuing publiccomment and to further analyze potential recommenda-tions. The purpose of the study is to identify effectivestrategies for increasing mobility options within estab-lished neighborhoods. Study consultants Storrow KinsellaAssociates, a landplanning and design firm, turned over afinal report to the MPO in January in which public com-ments were included and addressed.
This report will go to the project’s Study ReviewCommittee in early 2002 and, pending approval, will thenbe posted on the MPO’s web site (www.indygov.org/indym-po) as part of the 30-day review and comment period. Formore information on the Special Neighborhood Study ofthe Glendale Area and eventual implementation of itsstrategies, contact Stephanie Belch, MPO Senior Planner,at 317/327-5136 ([email protected]).
INDOT Bike StudyMike O’Loughlin, INDOT’s State Bicycle Coordinator,
reports that the Indiana Trails Study is now available uponrequest. This document, based on a study conducted byThe Epply Institute throughout 2001, reports on severalexisting trails. Information includes numbers and types ofusers and reactions from the owners of adjacent proper-ties. Look for a summary of findings to be posted onINDOT’s web site in early 2002 (www.state.in.us/dot/stud-ies). For more information on the Indiana Trails Study, con-tact Mike O’Loughlin at 317/232-5653
Irons In The Fire (from page 13)
cont on page 24, see Irons In The Fire

on the air quality, farmland, groundwater, wetlands or historic and archeo-logical resources of the area.Implementing the Preferred Alternativewould also result in no residential orcommercial displacements.
Environmental impacts associatedwith the Preferred Alternative include:
Land Acquisition: For permanentright-of-way to build the PreferredAlternative, INDOT would need to buyabout 0.39 acres of commercial property(nine parcels), about 0.17 acres of resi-dential property (six parcels), and 0.25acres of church property (three parcels).For temporary right-of-way during con-struction, INDOT would need about0.20 acres of commercial land (sixparcels) and about 0.07 acres of resi-dential property (three parcels).
Noise: Of the 213 noise-sensitivereceivers (residential dwellings andchurches) evaluated along SR 431, 129are currently experiencing noise impactsor noise levels that exceed 66 decibels(dBA). Implementing the Preferred
Alternative would result in noiseimpacts at 172 receivers – 43 more thanexisting conditions and 15 more thanthe No-Action Alternative. The increasesin predicted noise levels, however,would be small, ranging from 0.8 to 1.7
dBA. (Noise-level increases of less than3 dBA are normally not perceptible tothe human ear.)
Although it was determined thatthere are three locations along SR 431where noise barriers would be feasibleand cost-effective, all of the receivers atthese locations fell under the no impactcategory or were on the borderlinebetween no impact and minor impactwhen taking into consideration theseverity of impacts for noise abatementmeasures. Based on these results, theinstallation of noise barriers at these isnot recommended.
Access: The closing of the medianat the 99th Street intersection wouldrestrict turning movements to rightturns only. In addition, the concretemedians on 96th Street at the SR 431intersection would eliminate left-turnmovements into and out of the adjacentcommercial properties.
Visual: The Preferred Alternativewould result in only minor visualimpacts, reducing the current 44-footgrassy median by more than half to addtravel and turn lanes. Inside shoulderswould also be replaced by curbs andgutters.
INDOT invited public reaction toits Environmental Assessment of SR431, including its Preferred Alternative,during a 45-day Review and Commentperiod which began November 6 andended December 21. During this peri-od, the full document was available forreview at Carmel-Clay Public Library,Carmel City Hall in the Department ofCommunity Services, and at the officesof The Parsons Transportation Group.The consultants were responsible forgathering public comment via phone,
SR 431
As part of INDOT’s SR 431 EnvironmentalAssessment, the following alternatives were considered anddismissed as stand-alone solutions to the problem.
Transportation System Management This alternative involved steps intended to increase the
efficiency of the existing roadway without adding throughlanes, such as computerized signal timing and coordinationwhich would provide minimal improvements to traffic con-gestion. With this alternative, five out of the eight intersec-tions would still function at level of service F.
Adding turn lanes at intersections and coordinating sig-nal timing would improve efficiency more than signal coordi-nation alone or a No-Action Alternative, but would still leavefive of the eight intersections at unacceptable levels of service(E or F), indicating extremely heavy traffic congestion.
Travel Demand ManagementThe effect of ridesharing, flexible work schedules and
telecommuting on traffic volumes or congestion levels in thecorridor would be insignificant.
Mass TransitCurrently, mass transit is not available in Hamilton
County. In addition, studies show that Hamilton Countytrips are dispersed among numerous points of origin anddestination. Such a dispersed ridership would make masstransit operation economically unfeasible.
Widen to six lanes with new travel lanes on the out-side
This option would bring service improvements similar tothose of the Preferred Alternative, but would require acquisi-tion of a substantial amount of land. It would have majorimpacts on residential areas and environmental resources.
Upgrade to Urban Freeway StandardsThis option would require 30 to 40 feet of additional
right-of-way on each side. In addition, grade-separated inter-changes (cross streets elevated to go over SR 431) wouldrequire a major amount of additional land. Impacts to resi-dential and commercial properties, as well as environmentalresources, would be substantial. As a result, this alternativewas dropped from further consideration.
PAGE TWENTY TWO
SR 431 Alternative(from page 11)
cont on page 23, see SR 431 Alternative

fax, regular mail and e-mail. In addi-tion, a formal Public Hearing was heldon December 6 from 6–9 PM in thecafeteria at Clay Junior High School,5150 E. 126th Street.
Based on the results of the EA andthe outcome of the Public Hearing,INDOT and the Federal Highway
Administration (FHWA) will issue afinding that will determine the nextsteps for the project. If the FHWAdetermines that the PreferredAlternative has no significant impact onthe environment, a Finding of NoSignificant Impact (FONSI) will beissued and the project can move intofinal design and construction. However,if FHWA deems the project to present
significant impacts, more extensiveanalysis in the form of anEnvironmental Impact Statement (EIS)will be required.
For more information on the SR431 project, contact Brad Steckler orJim Juricic at INDOT (317/232-5137 or317/232-5305, respectively) or SteveCunningham, MPO Senior Planner, at317/327-5403 ([email protected]).
PAGE TWENTY THREE
SR 431 Alternative(from page 22)
Notes & Quotes
ClarificationsSometimes, after preparing an
article for teMPO, we find thatour source information wasinaccurate, that the facts uponwhich a story was based havechanged since going to press,or that we simply got it wrongthe first time around. In any ofthese cases, we’re happy toclarify.
In the Fall issue ofteMPO, our article on the pro-posed Midwest Regional RailSystem may have confused some read-ers concerning Indiana’s financial com-mitment to the project. The estimatedcost for the entire nine-state system is$4.1 billion, approximately 80% ofwhich will be federally funded.Indiana’s portion of the system willcost $750 million of which the state
will pay between $80 to $120 million.Indiana’s financial commitment doesnot equal the federally unfunded 20%($150 million) because he cost of
routes leading to primary out-of-statedestinations are shared with neighbor-ing states (e.g. the cost of the routefrom Indy to Cincinnati would beshared with Ohio). These facts wereclarified prior to the teMPO articlebeing re-printed, with permission andin-full, in a recent issue of The South
Side Times.Hope this clears things up and
gets us all back on-track!In the same issue of teMPO,
Acro-Nymble identified ITS asstanding for “InformationTechnology Systems.”Although that acronyn iscommonly used in the busi-ness world, ITS usually means“Intelligent TransportationSystems” when it comes tothe work of the MPO and itsplanning partners.
Also in the Fall issue,the map on page 17 repre-
senting conNECTions’ Alternative H-5mis-identified SR 37 north of 116thStreet as a 6-lane freeway. That deci-sion has not yet been made; that por-tion of SR 37 could become either a 6-lane freeway or 6-lane expressway.
coMPOnents
To encourage public awareness of, andinformed participation in, the regional transporta-tion planning process, the MPO includes displayadvertising among its various outreach efforts.Featuring consistent use of the “iMPOrtant” for-mat to build awareness and recall, these adsappear in the City & State section of TheIndianapolis Star, The Indianapolis Recorder andother regional publications. The following ad,which appeared in early-to-mid December,solicited responses from qualified professional transportationplanning partners interested in working with the MPO.
“The development process of the 2000-2025
Long-Range Plan balanced the detailed local
knowledge and insight of Indiana’s MPOs
with INDOT’s statewide perspective on the
overall improvement program.”
— J. Bryan Nicol
INDOT Commissioner
I M P O R T A N T
For more information on transportation planning,
call 327-5151 or visit www.indygov.org/indympo.
The Indianapolis Metropolitan Planning Organization (MPO) is soliciting
statements of qualifications for professional planning and/or engineering
services. Included among the activities for which qualified providers are needed
are the update/enhancement of the TMS and CMS; multi-modal planning
for rail, bicycle and transit; computer modeling; community involvement;
environmental justice activities; and, transportation study preparation.
For more information, see our notice in today’s classified section.

Metropolitan Planning Organization1841 City-County Building200 East Washington StreetIndianapolis, IN 46204-3310
Printed on paper with recycled contentPAGE TWENTY FOUR
Bike Route SignsThe City of
Indianapolis will fabri-cate and install signsalong all 167 miles of pri-mary bike routes androute intersectionsthroughout Marion County.That amounts to 1,257signs in all! Installation loca-tions were recommended bythe MPO staff. The work should be completed by late Spring,2002. For more information, contact Mike Dearing, MPOPrincipal Planner at 317/327-5139 ([email protected])
Best Practices PraiseThe Indianapolis MPO is again receiving national
attention for an aspect of its transportation planning process.Its distance learning projects, conducted with the Center forInteractive Learning and Collaboration (CICL) over the “Vision
Athena” videoconferencing network, hasbrought real world transportation-relatedstudies into Indiana’s public schools.Examples include students working with theMPO to identify proposed bike route locationsand students investigating strategies for mitigat-ing traffic congestion and mobilityproblems in the region’s fastestgrowing Northeast Corridoras part of the MPO’sconNECTions study. It alladds up to greater projectawareness, increased publicparticipation and fresh, innova-tive perspectives. And that adds upto a “Best Practices” designation inPublic Involvement from the UnitedStates Department of Transportation(USDOT). The case study will beincluded in a Best Practices publica-tion now being developed by theUSDOT for distribution to MPOs andother agencies nationwide.
SR 431 Alternative(from page 11)