sports over ip: dynamics and...
TRANSCRIPT
Sports over IP: Dynamics and Perspectives by
Emmanuel Blain
Ing. Dipl., Ecole Polytechnique (2008)
Submitted to the Engineering Systems Division in Partial Fulfillment of the Requirements for the Degree of
Master of Science in Technology and Policy
at the
Massachusetts Institute of Technology
June 2010
© 2010 Massachusetts Institute of Technology. All rights reserved
Signature of Author...................................................................................................................................... Technology and Policy Program, Engineering Systems Division
May 7, 2010 Certified by ......................................................................................................................................................
Charles H. Fine Chrysler LFM Professor of Management and Engineering Systems
Thesis Supervisor Accepted by .....................................................................................................................................................
Dava J. Newman Professor of Aeronautics and Astronautics and Engineering Systems
Director, Technology and Policy Program

2
3
Sports over IP: Dynamics and Perspectives
By Emmanuel Blain
Submitted to the Engineering Systems Division on May 7, 2010 in Partial Fulfillment of the Requirements for the Degree
of Master of Science in Technology and Policy
Abstract
Technological advances are allowing the use of the Internet Protocol and the Internet infrastructure mainly built by cable and telecom operators for broadcasting purposes in the U.S. This disruption raises a business issue for the existing value chain, as new entrants are upsetting the existing value chain for video delivery. This thesis will focus on the implications of online video delivery for Sports content in the United States. The general question that is addressed in this thesis is:
How would a shift toward Internetbased delivery systems influence the current value chain for Sports broadcasting?
Case studies will first show that the broadcasting industry is prone to disruption, and that online video delivery has the potential to upset the existing value chain, and the business models associated with it.
The question can be then divided into three sub‐categories, which deal with the technical issues, regulatory needs, and business model changes that Sports over IP may cause – which are explored in separate chapters in the second part of this thesis.
In the last part of the thesis, a system dynamics model is used to study the technological and regulatory conditions under which the market will tip towards predominance of broadcasters by content owners in the post‐disruption value chain. Building the model with the standard procedure (described in the thesis) will give insights on what the main dynamics are, and how interrelations and feedbacks among those main dynamics can influence the whole system.
Thesis supervisor: Charles H. Fine Title: Chrysler LFM Professor of Management and Engineering Systems

4
To Pauline, for her understanding, patience and love.
5
Acknowledgements
This thesis is the conclusion of a fantastic two‐year‐long journey. And like other journeys, it is the people that I met and shared with that made this experience meaningful.
First, I would like to thank all the Technology and Policy Program staff, in particular Sydney Miller and Ed Ballo, for their help and availability during those two years. I would like to thank all the teachers of the program, and the students and friends who journeyed with me in Cambridge.
I would like to thank warmly all the members of the Communications Futures Program who accepted to give me some of their precious time; more specifically Bill Lehr and Dave Clark, who helped me think about the policy implications of Sports over IP, Steve Bauer for the technical part, and Marie‐José Montpetit and Henry Holtzmann who helped me think about piracy implications and business models. I would like to give special thanks to Natalie Klym, who has introduced me in the CFP, helped me forge the music case study, and above all, has always been available and willing to help me. Without her, my two years at MIT would have been very, very different.
I would also like to thank all the people that gave me feedback on my Systems Dynamics model, and accepted to devote lots of time when I needed it; in particular Kawika Pierson and Prof. P.J. Lamberson. I also owe a great debt to Chintan Vaishnav, who has helped me tremendously in the modeling process.
I am immensely grateful to thank Prof. Charles Fine, who has agreed to supervise my work. Dear Professor Fine, these two years have been the most exciting of my professional life. Not only have you given me the chance to work on a topic that is at the heart of my interests; you also have been a continuous source of motivation and inspiration for this project. Now I know myself what it is to have the benefit of standing on the shoulders of giants.
This journey has not only been an intellectual one, but also a personal one, far away from my roots. My biggest thanks go to my family; and particularly to my fiancée, Pauline. Two years ago, I had to risk a lot for MIT to happen; yet all I have met when the time came for me to make my decision has been support and encouragement. Words cannot describe how grateful I am to you, Pauline. It is you that allowed me to realize this dream. Thank you. This work contains all the energy that you gave me day after day during those two years. And it is for you.
6
Table of contents
Introduction .............................................................................................................................................. 10
Chapter 1. Sports broadcasting: from over‐the‐air to the Web .......................................... 14
I. 1939‐1970: The development of a business model..................................................... 14
II. 1970‐1985: The acceleration and the development of cable networks............ 18
III. 1985‐2005: The explosion of the offering and the advent of Internet............. 22
Chapter 2. Music over IP: how the Internet has already disrupted other sectors of entertainment and media. ................................................................................................................... 29
I. A brief history of the transition to “Music over IP”...................................................... 30
II. Post‐disruption developments: 2000‐2010...................................................................... 35
Chapter 3. Technical Challenges associated with the development of Web TV........... 45
I. Distinction between Web TV and IPTV................................................................................. 45
II. Development of Web TV ............................................................................................................ 47
III. What do we need to achieve Sports over IP ? ................................................................. 51
IV. The broadband incentive problem ...................................................................................... 58
Chapter 4. Early implementations and challenges of Sports over IP ............................... 61
I. Value chain dynamics for traditional Sports broadcasting .......................................... 62
II. Why Sports over IP is a disruption to the traditional cable TV model .............. 69
III. 3 different business models ................................................................................................ 77
Chapter 5. Sports broadcasting: regulatory challenges and opportunities of IP‐based delivery systems...................................................................................................................................... 84
I. Premises for regulating Sports broadcasting ................................................................. 85
II. How cable regulation history led to imperfect competition .................................. 88
III. The protection offered by the Sports Broadcasting Act is no longer adequate in today’s broadcasting landscape.............................................................................................. 95
IV. The shift to IP‐based delivery systems is an opportunity to create new competition........................................................................................................................................... 99
7
Chapter 6. The System Dynamics Standard Method............................................................. 105
I. Problem statement ..................................................................................................................... 105
II. Justification of the use of System Dynamics................................................................... 106
III. The System Dynamics Standard Method ....................................................................... 108
Chapter 7. System Dynamics model for Sports over IP ....................................................... 111
I. Boundaries of the model .......................................................................................................... 111
II. Presentation of the key loops ............................................................................................... 114
III. Full System Dynamics Model .............................................................................................. 125
Chapter 8. System Dynamics findings and policy recommendations ........................... 127
I. System Dynamics Findings...................................................................................................... 127
II. Policy recommendations ........................................................................................................ 140
References............................................................................................................................................... 144
Appendix: Full description of the System Dynamics model used ………………………. 150

8
List of figures
Figure 1‐1: Delivery model for Major League Baseball in 1970 ......................................... 16
Figure 1‐2: Delivery model for Major League Baseball in 1985 ......................................... 20
Figure 1‐3: number of unique viewers for the MLB All‐Star Game, from 1972‐2008............................................................................................................................................................... 23
Figure 1‐4: Delivery model for Major League Baseball in 2005 ......................................... 26
Figure 2‐1: RIAA yearly music sales revenue for physical and digital goods ............... 37
Figure 3‐1: Delivery network for cable television and Internet ......................................... 52
Figure 4‐1: A simplified value chain for sports broadcasting.............................................. 62
Figure 4‐2: Disruptive Technology S‐Curve ................................................................................ 71
Figure 4‐3: Viewers per event S‐curve .......................................................................................... 73
Figure 4‐4: Events per dollar spent S‐curve................................................................................ 75
Figure 4‐5: Quality S‐curve ................................................................................................................. 77
Figure 4‐6: New value chain for Sports broadcasting............................................................. 83
Figure 5‐1: Weighted average cable Price and the CPI........................................................... 93
Figure 5‐2: Weighted Average Cable Price by Basis for Finding Effective Competition............................................................................................................................................................... 94
Figure 5‐3: Annual television revenues or the Major League Baseball ........................... 98
Figure 7‐1: Reference modes for Television rights ............................................................... 115
Figure 7‐2: The TV rights escalation loop ................................................................................. 116
Figure 7‐3: Reference modes for willingness to pay for TV content ............................. 117
Figure 7‐4: The cable success loop............................................................................................... 118
Figure 7‐5: Reference modes for Web TV market share..................................................... 120
Figure 7‐6: The design for competition between cable TV and Web TV ..................... 122
Figure 7‐7: Reference modes for Pirate Web TV.................................................................... 123
Figure 7‐8: The piracy control loop ............................................................................................. 124
Figure 7‐9: Full sports market view............................................................................................. 125

9
Figure 7‐10: Full dynamics of product adoption view......................................................... 126
Figure 8‐1: Relative attractiveness for cable TV and Web TV (base case).................. 128
Figure 8‐2: Installed base for cable TV and Web TV (base case) .................................... 129
Figure 8‐3: Total league revenues and its components (base case) .............................. 131
Figure 8‐4: Normalized gap between the customer reservation price and the average price of TV content (base case) ............................................................................................ 132
Figure 8‐5: Installed base for pirate Web TV (base case) .................................................. 133
Figure 8‐6: Table for effective goal for piracy control (base case)................................. 135
Figure 8‐7: Installed base for Pirate Web TV in the case of low, medium and highest possible levels of control from the content owner’s part. ........................................ 136
Figure 8‐8: Installed base for Pirate Web TV in the case of low, medium and high reservation prices. ..................................................................................................................... 137
Figure 8‐9: Attractiveness of cable TV and Web TV in the case of small leagues .... 139
Figure 8‐10: Market share of Web TV and cable TV in the case of small leagues .... 139
List of tables
Table 2‐1: Estimated revenue share for a $0.99 song sold on iTunes. The item “Wholesale cost” represents the amount transferred back to music labels. ....... 39
Table 2‐2: Breakdown of the cost of a typical major‐label release for a new album with a list price of $15.99 (Institute of Music Retail, 2004) ....................................... 39
Table 3‐1: Usage of television and Web TV services in 2008‐2009.................................. 49
Table 3‐2: Monthly time spent using television and Web TV services in 2008‐2009............................................................................................................................................................... 49
Table 3‐3: Top U.S. Online Video Properties* by Unique Viewers as of January 2009 (Source: comScore Video Metrix)........................................................................................... 50
Table 4‐1: List of principal cable TV channels available as of January 2010. ............... 68
Table 5‐1: Weighted average cable Price and the CPI (SOURCE: NCTA) ........................ 92
10
Introduction
Over the past two decades, the Internet and web technologies have transformed the
entertainment and media industries. The iTunes Music Store, launched in 2003, has
become the largest music retailer in the US, while the Amazon Kindle and Google
Books are set to fundamentally change the way people access and read books. Those
two industries have seen major disruptions, and the locus of value chain control has
shifted very quickly.
Likewise, TV is moving onto the Web. However, due to the large investments
required by television and TV’s close links to the Internet infrastructure itself, the
shift toward Internet‐based delivery systems seems to be taking place at a
significantly lower speed than other media. TV is perhaps the last remaining pillar of
the old media business that has not transitioned on the Internet. Yet, for numerous
reasons, it seems likely to fall. At this juncture, while the transition of TV to the web
is in seeming slow motion, studying the transition process seems timely.
Sports will be the focus of the study, as it has often fostered innovation and
technological shifts in the television world, and this “star” type of content does not
depend directly from broadcasters.
The thesis will therefore address the following question:
How would a shift toward Internetbased delivery systems influence the current value chain for Sports broadcasting?

11
More specifically, is the shift toward an Internet‐based delivery system desirable for
the sports and broadcasting industry as a whole? What will be the impacts on the
consumer? Are we looking at another war on Digital rights management and piracy
control? How is this change likely to upset the current set of regulations that govern
sports content creation on one side and broadcasting on another? What will be the
main dynamics at stake, and what are the policy levers likely to be key in this shift?
Relevance
This work is primarily addressed to stakeholders of the sports broadcasting value
chain – team owners, league commissioners, producers, broadcasters, carriers,
advertisers – as well as policymakers involved in broadcasting and Internet
regulation in the United States. However, this study has also a broader impact, and
can be taken as a practical case aiming at giving insights in the broader context of
the disruption of the broadcasting industry – and the existing entertainment and
media complex – by the Internet.
Television – even when narrowed down to broadcasted sports – represents a multi‐
billion dollar industry, as well as a communication medium accessed by 99% of the
U.S. population, for four hours per day on average.1 The potential shift of sports
programming to the Internet could have an important impact socially, economically,
and legally. The fact that the Internet is upsetting the whole television industry
could have huge repercussions on the economic model of broadcasting, advertising,
12
and the accessibility (both at a technical level and at an economical level) of the
broadcasts.
Given the trans‐disciplinary nature of the problem – which has ramifications in the
technical infrastructure, the business models and the existing regulations – the
Technology and Policy setting that will be used for the thesis is compelling. The
specific methodology used in this thesis will allow acknowledging for the
interdependencies between those different classes of problems, rather than treating
them separately.
Structure of the thesis
This thesis can be divided into three parts, which correspond to three different
stages of the reflection on Sports over IP.
First, two case studies in chapters 1 & 2 will look respectively at the history of
Sports broadcasting and the disruption of the music industry with the development
of Internet delivery channels in the last 10 years. These case studies will set the
foundations for the analysis, as well as give a little bit of perspective that will be
useful for the rest of the study.
Then, chapters 3, 4 & 5 will look more specifically at three separate categories of
issues associated with the development of Sports broadcasting over the Web:
respectively, the Internet and broadcasting infrastructure and broadband incentive
problem, the economic issues associated with the need for new business models,
and finally the potential threats associated with the regulatory context in which the

13
Internet disruption is taking place. Each of these chapters will use specific
frameworks and will build on the previous case studies, to try to generate three sets
of recommendations for each category of issues.
Finally, in chapters 6, 7 and 8, a System Dynamics model, built on the analysis done
in the previous chapters, will be presented and used to unify the work done in the
bulk of the analysis of chapters 3, 4 and 5. This model will help understand better
the interplay between all the stakeholders, the potential issues that could arise in
the future, and the conditions under which the new models associated with the
broadcasting of sports on the Web could be successful.
14
Chapter 1. Sports broadcasting: from over‐the‐air to the Web
The history of sports on U.S. television is tightly interwoven with the development
and success of the major television networks and media empires. While sports
played a significant role in the initial development of television in the United States,
they have been following the evolution of television from its beginning, driving
innovation and historically being controlled by the predominant players on the
market at any given time. Sports indeed acted as a catalyst when the cable TV began
to overtake over‐the‐air (OTA) TV during the 1970s, and cable networks have since
increasingly been broadcasting major sports events. Today, sports could play again
that catalyst role, as the apparition of Web television is disrupting the traditional
television business models.
I. 1939‐1970: The development of a business model
a. Television perspective
According to pioneering sports television director Harry Coyle, "Television got off
the ground because of sports. Today, maybe, sports needs television to survive, but
it was just the opposite when it first started."2 The first televised sporting event was
a college baseball game between Columbia and Princeton in 1939, covered by one
camera providing a point of view along the third base line. But the first show to
actually become a regular sports broadcast was NBC's Gillette Cavalcade of Sports,
which premiered in 1944 with the Willie Pep vs. Chalky White Featherweight

15
Championship bout. 3
In their early years, broadcasted sports would not attract enough eyeballs to
generate attractive advertising revenues – there were indeed only 190,000 TV sets
in use in 1948. Instead, broadcasters were looking toward the future of the over‐
the‐air television, and aired sports as a means of boosting demand for television as a
medium. They believed their strategy would eventually pay off in advertising
revenues. Sports did indeed draw viewers, and although the stunning acceptance
and diffusion of television cannot be attributed solely to sports, the number of sets
in use in the U.S. reached 10.5 million by 1950. According to Coyle, “When we (NBC)
put on the World Series in 1947, heavyweight fights, the Army‐Navy football game,
the sales of television sets just spurted."4
The central role of sports on early television programs can be explained by different
factors. First, sports competitions were readily available to broadcast, contrary to
other kinds of programs that required new ideas, actors and studios. Second,
technical and economic factors made sports attractive to the developing medium.
Early television cameras were heavy and cumbersome and needed bright light to
produce even an acceptable picture. Outdoors sports with fixed angles of view, like
baseball, complied perfectly with these constraints. This made sports inexpensive to
produce, a primary concern when the audience was small and not yet generating
large advertising revenues.
The initial broadcast technology, television over‐the‐air (OTA), used radio waves to
send content to the U.S. households. Since radio bandwidth was a scarce and

16
valuable resource, the Federal Communications Commission (FCC) heavily
regulated OTA TV broadcasting. In the 1970s, only the 54 to 88 megahertz and 174
to 220 megahertz were available for OTA television broadcasting. Given that a single
television network would take 6MHz of bandwidth this would only leave room for
12 analog TV channels. Due to other major barriers to entry – broadcasting
television at the national scale required enormous investments that were only
affordable for big media companies; three major national TV networks dominated
the national market: NBC, ABC and CBS.
b. The fan experience in 1970
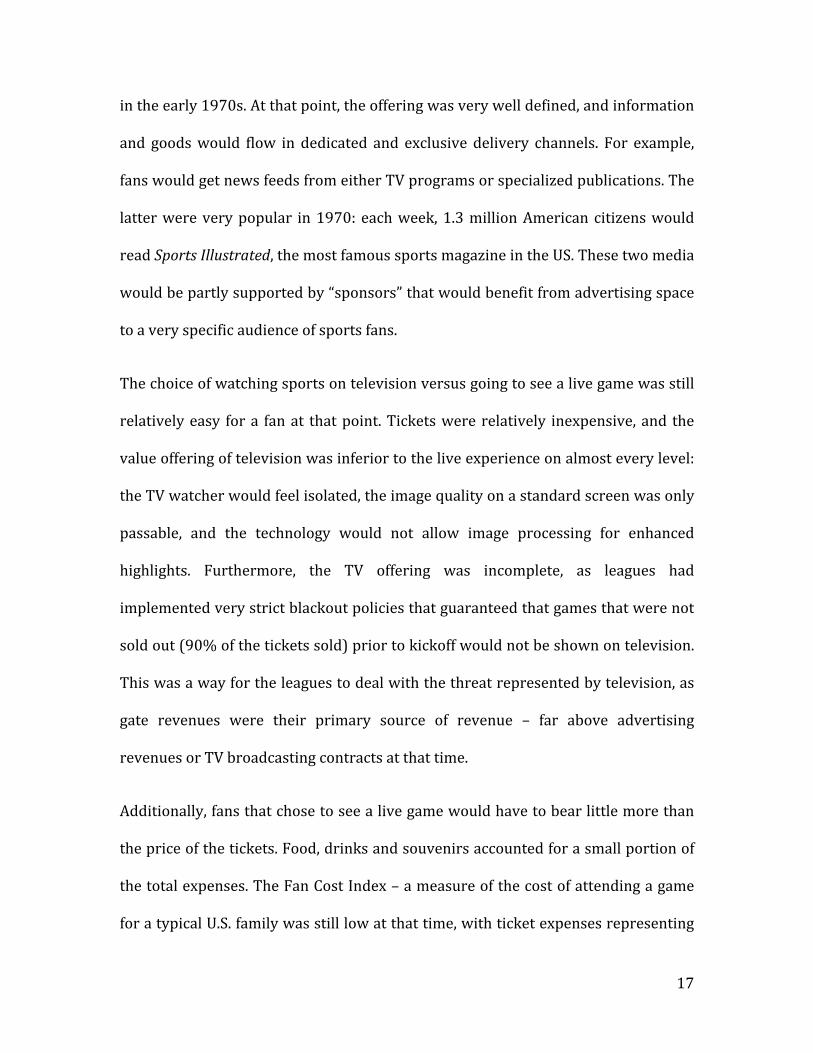
Figure 11: Delivery model for Major League Baseball in 1970
The figure above represents the delivery channel (or value chain) for a baseball fan
17
in the early 1970s. At that point, the offering was very well defined, and information
and goods would flow in dedicated and exclusive delivery channels. For example,
fans would get news feeds from either TV programs or specialized publications. The
latter were very popular in 1970: each week, 1.3 million American citizens would
read Sports Illustrated, the most famous sports magazine in the US. These two media
would be partly supported by “sponsors” that would benefit from advertising space
to a very specific audience of sports fans.
The choice of watching sports on television versus going to see a live game was still
relatively easy for a fan at that point. Tickets were relatively inexpensive, and the
value offering of television was inferior to the live experience on almost every level:
the TV watcher would feel isolated, the image quality on a standard screen was only
passable, and the technology would not allow image processing for enhanced
highlights. Furthermore, the TV offering was incomplete, as leagues had
implemented very strict blackout policies that guaranteed that games that were not
sold out (90% of the tickets sold) prior to kickoff would not be shown on television.
This was a way for the leagues to deal with the threat represented by television, as
gate revenues were their primary source of revenue – far above advertising
revenues or TV broadcasting contracts at that time.
Additionally, fans that chose to see a live game would have to bear little more than
the price of the tickets. Food, drinks and souvenirs accounted for a small portion of
the total expenses. The Fan Cost Index – a measure of the cost of attending a game
for a typical U.S. family was still low at that time, with ticket expenses representing
18
the lion’s share of the cost.5
II. 1970‐1985: The acceleration and the development of cable networks
a. Television overview
Between 1970 and 1985, broadcasted sports increased their role as central piece in
the television offering, and experienced impressive growth. In 1970, the networks
paid $50 million to broadcast the National Football League (NFL), $2 million for the
National Basketball Association (NBA) and $18 million for Major League Baseball
(MLB). In 1985 those figures had risen to $450 million, $45 million and $160 million
respectively.6 Just as sports had played a central role in the development of over‐
the‐air television in the previous decades, the development of major broadcasting
networks and the development of alternative modes of content delivery produced
this ten‐fold increase in 15 years.
As television coverage quality improved, the supply and demand for broadcasted
sports was increased and diversified. The development of cable and satellite
networks during the 1970s provided new broadcasting spaces that welcomed the
increased content. Indeed, while bandwidth and air time were scarce resources in
the dominant over‐the‐air networks, cable networks allowed the creation of
numerous inexpensive additional channels. WGN, WTBS, and HBO, were among the
first cable channels to broadcast national sports events. ESPN, the first cable

19
channel to be completely dedicated to sports, was created in 1979. By 1986, it was
reaching 37 million subscribers.7
As a reaction to cable TV’s successes, the legacy television networks saw the
broadcasting of big time sports as the hallmark of institutional supremacy in
broadcasting. CBS, NBC and ABC bid increasingly large amounts of money to
maintain control over the broadcasting rights for major sports leagues, while video
recording (the VCR), newly empowered independent stations, and cable providers
presented new challenges. Rising fees for rights to major sporting events were not,
in themselves, a problem for the networks. Since they still retained the vast majority
of the U.S. viewing audience, and hence, a dominant share of advertising revenues,
their margins were sufficiently high so that they could afford these increasing fees,
while the cable and independent channels often could not.
To remain aggressive and to make the most of their expensive contracts with the
major sports leagues, the networks began broadcasting more sports. But spots on
sports shows would have been easier to sell had there been fewer of them on the
market. The three networks together showed 1,500 hours of sports in 1985, double
what they programmed in 1960. With about 8 minutes of commercials an hour, the
addition of even relatively few hours of programming had a noticeable effect on the
supply‐and‐demand balance of the commercial spot market, driving advertising
prices down to a significant degree.
20
b. The fan experience in 1985
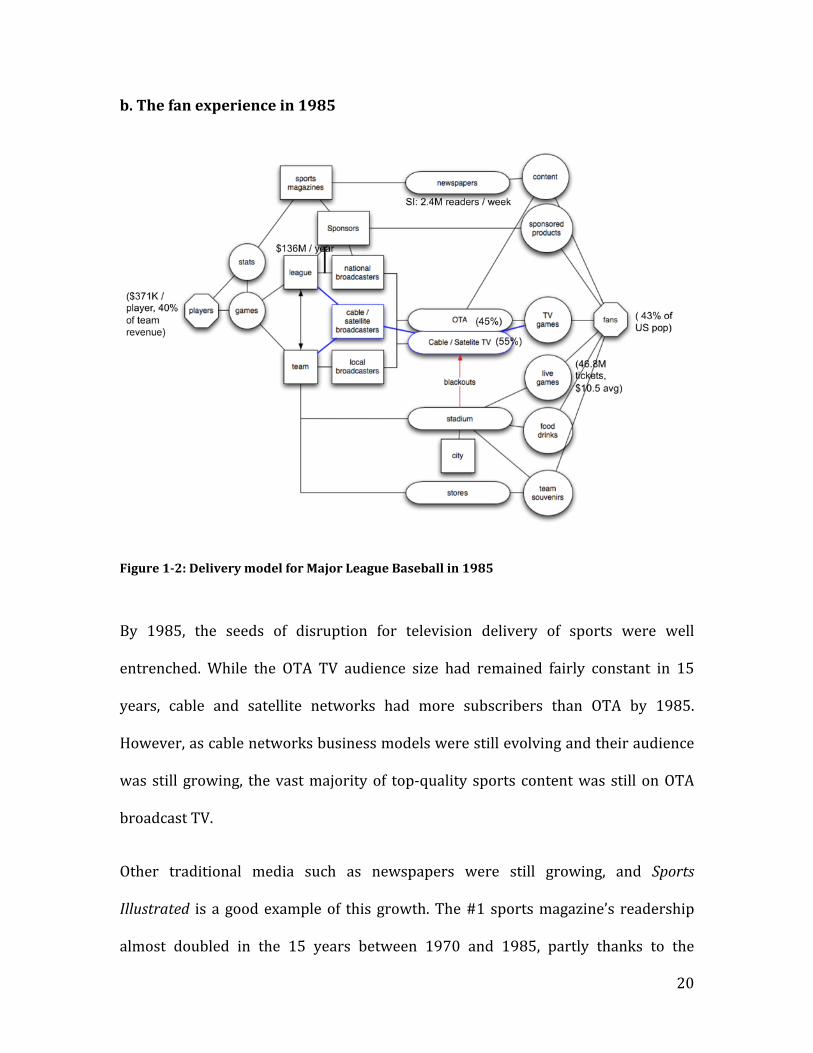
Figure 12: Delivery model for Major League Baseball in 1985
By 1985, the seeds of disruption for television delivery of sports were well
entrenched. While the OTA TV audience size had remained fairly constant in 15
years, cable and satellite networks had more subscribers than OTA by 1985.
However, as cable networks business models were still evolving and their audience
was still growing, the vast majority of top‐quality sports content was still on OTA
broadcast TV.
Other traditional media such as newspapers were still growing, and Sports
Illustrated is a good example of this growth. The #1 sports magazine’s readership
almost doubled in the 15 years between 1970 and 1985, partly thanks to the
21
broader variety of sports content on TV.8
Another phenomenon that began to change the balance of power in the sports value
chain was the change in the player reservation system. The most dramatic upheaval
occurred in Major League Baseball (MLB). Historically MLB players had been subject
to the reserve clause, which was interpreted to its strictest, as granting a team the
perpetual option on the player’s service. In a series of labor market victories
beginning in the wake of the Flood v. Kuhn decision in 1972 and continuing through
the rest of the century, the baseball players’ contract conditions greatly improved,
as they won the right to free agency (i.e. to bargain with any team for their services)
after six years of service, as well as escalating pension contributions, salary
arbitration, individual contract negotiations with agent representatives, reductions
in maximum salary cuts, and other benefits.
No longer were players shackled to one team forever, subject to the whims of one
owner for salary and status. With freedom to bargain with any and all teams,
salaries rose dramatically. The average salary skyrocketed from $45,000 in 1975 to
$289,000 in 1983. While this transformation did not affect the fan experience
directly, it had multiple repercussions. The growing share of the payroll in team’s
budgets created a need for more revenue, and created a complex dynamic which
drove a rapid sustained growth in the value of the broadcasting contracts between
the league or the teams and TV channels, as well as pressure to maintain high
attendance in stadiums while increasing the fan base, and, indirectly, an increase in
the price of the tickets.
22
Similarly, players’ salaries in football increased dramatically during the 1970s and
1980s, reflecting strong growth in gate and TV revenues for the league, as well as
player successes in courts in the 1970s. The NFL Players Association has however
been relatively less successful than the other players associations, for reasons such
as the short player careers and the prevalence of team play over individual success.9
III. 1985‐2005: The explosion of the offering and the advent of Internet
a. Television overview
Since 1985, the clockspeed of broadcasted sports has accelerated. There are more
hours of televised sports today than ever before. Sports continue to draw a large
total audience, but it is an audience fragmented among many available choices.
Despite the NFL Super Bowl's continually growing audience and increases in the
price of a 30 second advertising spot ($700,000 in 1990, $2,100,000 in 200 and
$3,000,000 in 2009), it remains a television anomaly, unique as a television and
cultural event. Otherwise, ratings and number of viewers for individual television
sports programs in the US have seen a continuous decline since 1970, as exemplified
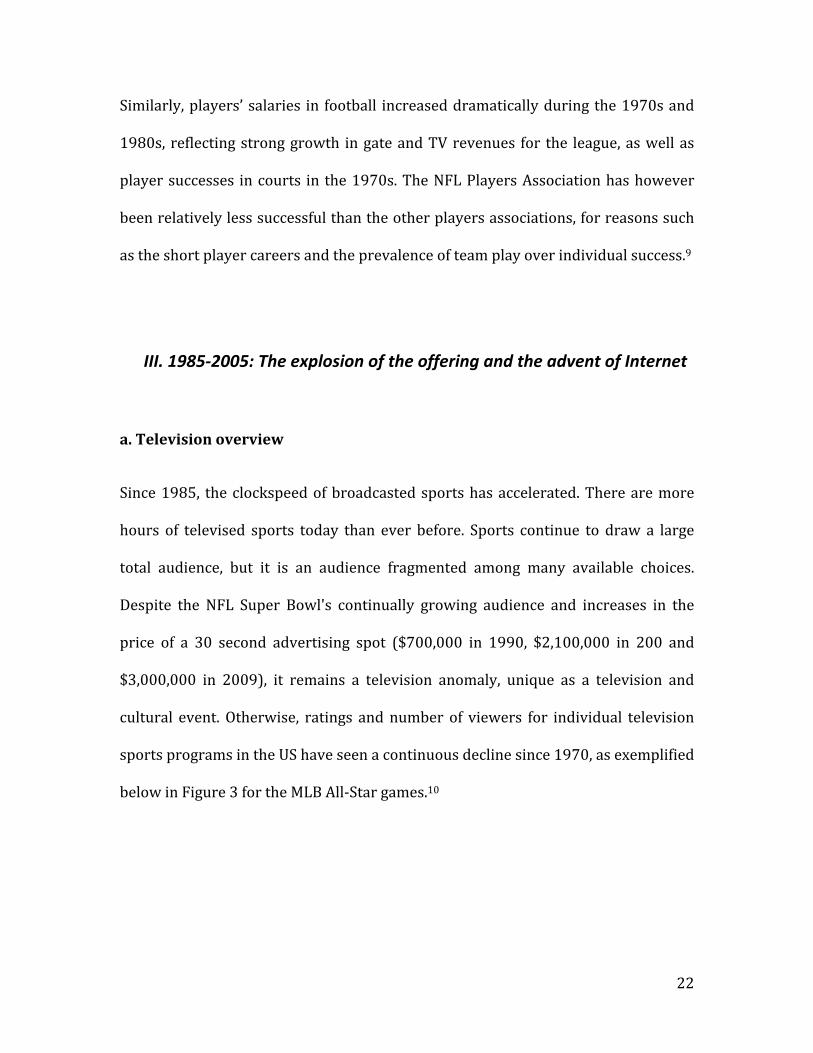
below in Figure 3 for the MLB All‐Star games.10
23
Figure 13: number of unique viewers for the MLB AllStar Game, from 19722008
This does not necessarily mean that the population is losing interest in sports on
television. Rather, as new cable channels continued to appear, and more and more
sports are broadcast online, the television audience has become even more divided,
splitting eyeballs and revenues among a wide range of offerings. To make up for
falling revenues per hour on all its programming as they began to lose audience, the
legacy networks began to raise the price of advertising time on sports shows to
cover the huge rights fees contractually owed to the sports leagues.
This dynamic, initiated in the 1970s, has significantly changed the balance of power
in sports broadcasting. The huge rights fees that national networks were ready to
pay to keep control of this premium content in the 1980s have become high enough
to represent a burden. In the meantime, the landscape became much more favorable
for cable networks. By 1986, cable and satellite broadcasting networks had reached

24
60% penetration in the US market. Sports content became affordable for cable
networks as subscription revenues grew over time, ensuring another revenue
stream on top of the traditional advertising revenues. Furthermore, sports
programming was cheaper to buy and air than other types of shows, especially first‐
run programming for cable channels and local broadcasters.
This new landscape created even more opportunities to expand the cable TV
offering. ESPN, for example, launched ESPN2 in 1993, ESPN Plus in 1995, and
ESPNU (a channel dedicated to college and university sports) in 2005. More
recently, sports leagues themselves have taken this opportunity to create their own
cable channels (the NFL network was launched in November 2003, the NHL
network in October 2007 and the MLB network in January 2009)
In addition, Internet advances, broadband availability, and online video streaming
have not spared sports content. While broadcasting used to require huge initial
investments in infrastructure and production capabilities, the increasing availability
of broadband Internet is changing this trend. Much like music, news and other
media, the sports new media participants – content owners, online platforms, end‐
users and even players themselves – are empowered by the shift of sports
programming to the Internet.
Leagues, that already started to produce their own content with dedicated cable
networks, are now starting to deliver video on the Web as well. Sports content has
gone mobile, too. MobiTV, the leading mobile television service in the United States
today, with over 5 million users, offers a mobile version of ESPN. Content has been
25
adapted to fit a cell phone screen, and the mobile channel allows subscribers to
watch their favorite teams on‐the‐go.
Pirated sports content distribution is also on the rise. Recent technologies are
empowering the end users, giving them tools to rebroadcast content seamlessly on
the Web. While this solution is only appealing to relatively tech‐savvy consumers, it
could gain momentum just like peer‐to‐peer (P2P) sharing did in the case of music.
While these services are still in their infancy (MLB.TV started 7 years ago and has
around 1 million subscribers), they are perturbing the television landscape, adding
variety, opening up the traditionally closed delivery networks, and threatening the
existing balance of powers among the leagues, the networks and the carriers.
These new paradigms and the business models associated with them will be studied
in detail in Chapter 4 of this thesis.
26
b. the fan experience
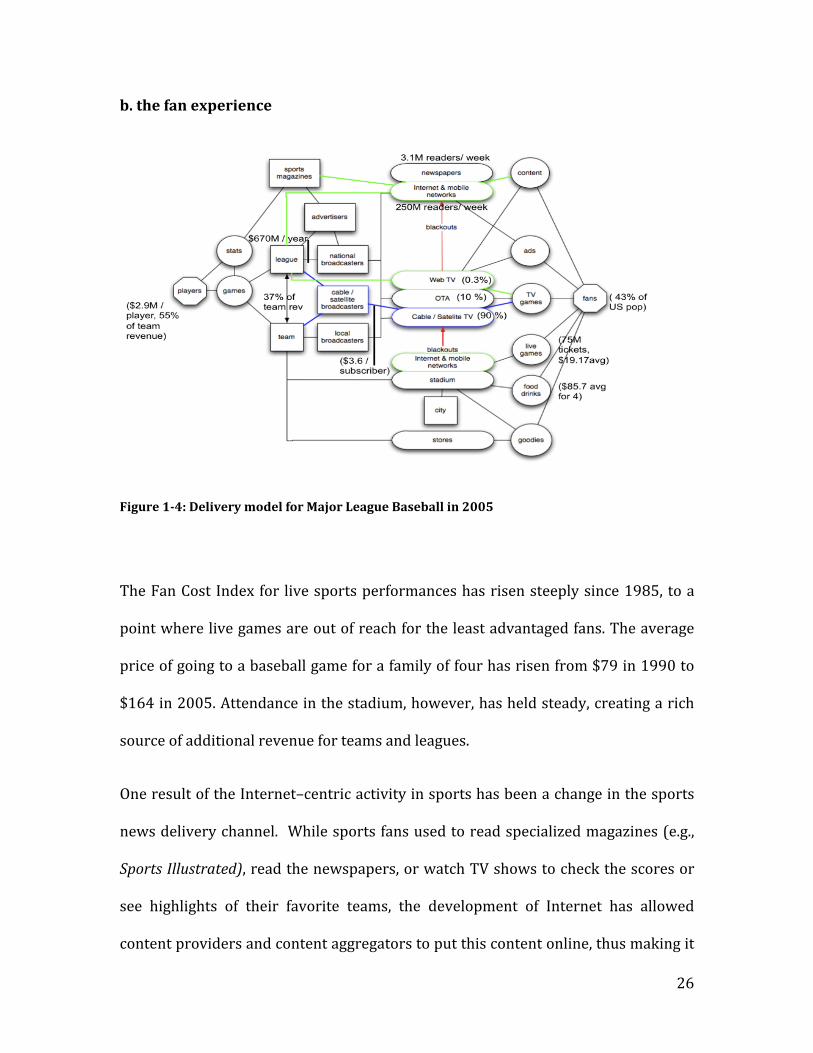
Figure 14: Delivery model for Major League Baseball in 2005
The Fan Cost Index for live sports performances has risen steeply since 1985, to a
point where live games are out of reach for the least advantaged fans. The average
price of going to a baseball game for a family of four has risen from $79 in 1990 to
$164 in 2005. Attendance in the stadium, however, has held steady, creating a rich
source of additional revenue for teams and leagues.
One result of the Internet–centric activity in sports has been a change in the sports
news delivery channel. While sports fans used to read specialized magazines (e.g.,
Sports Illustrated), read the newspapers, or watch TV shows to check the scores or
see highlights of their favorite teams, the development of Internet has allowed
content providers and content aggregators to put this content online, thus making it
27
available any place, any time. Websites such as ESPN.com, NFL.com or MLB.com are
among the most popular of these sites. ESPN.com now accounts for 0.08% of the
global page views on the World Wide Web, and has more than 22 million unique
visitors. 11 Those websites have grown to act as multi‐faceted portals that offer
everything that a fan wants. MLB.com for example is a data repository (features
scoreboards, standings, rosters, schedules, portal to team websites…) that supports
community life via fan forums, and also offers premium content (e.g. players
interviews, “behind the scene” clips…). It even serves as an e‐commerce portal to
buy tickets, T shirts, caps, etc.
In the past ten years, new online and mobile services have emerged in addition to
the traditional TV experience. While these services were aimed initially at
complementing the live and TV experiences, and presumably did not seek to disrupt
these well‐established and profitable industries, they planted the seeds for a
potential new major disruption in sports broadcasting.
Conclusion
While sports co‐evoluted synergistically with the television broadcasting networks
in the early history of the medium, the current and future states of the genre look
quite different. There are more televised sports today than ever before and they
continue to draw a large total audience, but the audience is fragmented among many
choices. ABC, NBC and CBS with their advertising‐only revenue streams are at a

28
competitive disadvantage to cable networks that have both subscription revenue
and advertising revenue available to them. Therefore, sports on television is less
likely to appear on a national network, and the development of new broadcasting
media, especially via the Internet, will likely only accelerate this shift.
As we will acknowledge in the next chapter, Internet has a tremendous disruptive
potential, and the first uses of Internet in the sports broadcasting area– that will be
discussed in more details in chapters 3,4 and 5 – suggest that a disruption in the
value chain for sportscasting is likely to take place, both at the technical and
business levels. But before looking at the underlying issues of this potential
disruption in more depth, let us study briefly how the Internet has already disrupted
the distribution value chain in another part of the entertainment and media
industry: music.
29
Chapter 2. Music over IP: how the Internet has already disrupted other sectors of entertainment and media.
This chapter will describe how the seeds of the disruption of the music industry
were planted, and the radical changes that this industry has known with the use of
Internet as a new broadcasting and retail channel. The aim here is not to try to look
back and learn from the mistakes that were made, in order to come up with a set of
“ideal policies” that would solve the problem. The models that have proven
successful for the music industry more than ten years ago may not be very useful in
the case of Sports. Indeed, we should not neglect the fundamental differences
between how those two types of content are produced and consumed, nor should
we forget that today’s vision regarding the Internet, what it is capable of, and how it
can be used is very different from what it was a decade ago. As we will see, the main
focus in the case of music was piracy, and the radical change in the value chain
dynamics the industry has known came as a consequence of the fight on piracy. For
Sports content, the problems seem to arise from a potential upheaval of the value
chain, and piracy seems to be merely one consequence – although potentially
important – of this dramatic shift.
While the drivers of change seem different, sports media seems nonetheless to be
following a disruption that is similar to what happened with music in the 1990s.
More precisely, new Internet‐based, open channels are disrupting the legacy
distribution channels, such as cable television or over‐the‐air television. Just like the
mp3 and Napster redefined the way music was produced, distributed and
30
consumed, the early experiments of Sports over IP are demonstrating new
distribution channels and new ways of watching sports. Therefore, looking at what
happened in the music industry as a case study will allow us to pinpoint issues that
are likely to arise in context of sports broadcasting, and could help us identify the
dynamics that will drive those changes.
In order to stay aligned with the rest of the thesis, this study will focus on the U.S.
market, and will primarily focus on the “mainstream” market, which is represented
here by the four major music labels (Universal Music, Sony Music, Warner Music and
EMI) that retain rights on 70% of the music worldwide.12
I. A brief history of the transition to “Music over IP”
In the 1990s, the compact disc (CD) was the main channel used by artists and labels
to distribute music content. The CD had been introduced in the market in 198213
and was a mature technology. While this support had been considered as a
disruption to the audiotape when it hit the market, it did not change dramatically
the way music was distributed. Just like they used to do in the 1980s, music labels
would regularly release new albums from their in‐house artists containing around
ten songs. The marketing and shipping processes were very similar to what was
done for the audiotapes – only the support was different.
In fact, the next real disruption to this powerful and robust distribution model did
not come from the media labels themselves, but from a variety of other

31
technological innovations that empowered the consumer during the 1990s and led
to online file sharing. Advances in audio software technology along with the rapid
increase in computer power and storage capacity allowed end‐users to digitally rip
and compress the audio files contained in their CDs. The MPEG‐1 Audio Layer 3
(MP3) technology, released in 1994, acted as a key enabler for file sharing. 14 MP3
reduced the size of an audio file by more than a factor ten, without considerable loss
of quality for the listener, making it possible to download an average‐sized (3
megabytes) audio file in less that 15 minutes with a basic 1997 Internet connection
using a 56Kbps modem.
This technological leap, in conjunction with the rapid adoption of the Internet in US
households and the development of networks in U.S. colleges and universities, led to
the development of online file sharing communities. While centralized downloading
websites like MP3.com were popular at first, Shawn Fanning’s peer‐to‐peer (P2P)
software, Napster, released in the fall of 1999, quickly changed the way users would
share files, and led to a rapid increase in traffic, both in number of users and number
of downloads per user. Files could now be exchanged directly between users rather
than passing through a centralized intermediary, while a centralized index of
available content gave users an efficient way of finding music.
The P2P network proved efficient enough to represent real threat and attract the ire
of the major music labels and the Recording Industry Association of America (RIAA.)
A suit for “contributory and vicarious copyright infringement” under the Digital
Millennium Copyright Act (DMCA) was filed within weeks after Napster’s launch.

32
The online service was ultimately struck down in 2001 by the United States Court of
Appeal for the Ninth Circuit, which found that “Napster users infringe at least two of
the copyright holders' exclusive rights: the rights of reproduction, § 106(1); and
distribution, § 106(3) (…) The court found that the owners of Napster could control
the infringing behavior of users, and therefore had a duty to do so.” 15 Napster was
shut down a few months after the decision, as it was unable to comply with the
ruling. In the meantime, legal action from the RIAA had encouraged innovation in
two opposing directions.
a. The development of illegal online file sharing
Post‐Napster, P2P networks simply got better at circumventing authority or
exploiting regulatory loopholes. By decentralizing all functionality and eliminating
the centralized index of available content that had caused Napster’s demise, P2P
services like KaZaA and Grokster eliminated potential points of legal attack. When
the RIAA and the Motion Picture Industry sued KaZaA and Grokster in 2001, the
defendants argued that their services were not liable for illegal activity that
occurred on their networks because they did not manage a centralized directory.
Indeed, under the Sony safe‐harbor principle16 that was set by the Supreme Court in
the 1980s: "…the sale of copying equipment, like the sale of other articles of
commerce, does not constitute contributory infringement if the product is widely
used for legitimate, unobjectionable purposes. Indeed, it need merely be capable of
substantial non‐infringing uses."
33
In 2005, the Supreme Court ruled against Grokster, finding that evidence of non‐
infringing use was not sufficient, and that the way the software was designed was
encouraging piracy too obviously.17 It was estimated that more than 90% of the files
shared on the network were downloaded illegally. Grokster, KazaA and many other
P2P file‐sharing services were shut down quickly after this decision.
EDonkey2000, an P2P application developed by MetaMachine, was among the
numerous file‐sharing services that were closed after the Supreme Court decision.
While the software is not distributed anymore, the file repository, using the
eDonkey network, which was by design kept by the users, continues to exist and has
been growing until today. Furthermore, the vast majority of eDonkey downloaders
have simply switched to eMule, the open‐source alternative to eDonkey, which
continues to be developed without being targeted by the RIAA. The eDonkey
network is estimated to total more than 4 million users and 4 billion files shared.
In light of the increasing subtlety of file‐sharing systems, which worked around
more and more potential points of copyright infringement attack, the RIAA adopted
a strategy of prosecuting individual end‐users.18 Most lawsuit targets chose to settle
their cases for amounts ranging between $3,000 and $11,000. By October 2007, the
RIAA had filed more than 30,000 suits against single users.19
This behavior created a lot of animosity on the end‐user side. Many commentators
deemed this practice as “highly unproductive”, arguing that singling out thousands
of end‐users would not solve RIAA’s problem. The Electronic Frontier Foundation
34
(EFF) was particularly vocal about these issues20 and put forward a number of
initiatives to try to leverage new technologies and business models to provide a
legal, comparable alternative to illegal P2P networks.
b. New business models and players emerge, Apple iTunes as a winner
Despite discouragement by the major music labels, consumers liked the new
distribution channels, encouraging more business models that tried to take
advantage of the MP3 format. These initiatives were taken by MP3 player
manufacturers (Apple being the most famous example), online retailers
(Amazon.com), and ex‐“pirates” (Shawn Fanning came back with a new iteration of
Napster)
Two main business models were competing at that time. Services like RealMedia’s
Rhapsody, created in 2001, offered unlimited on‐demand streaming to a large
library of music for a monthly flat fee. At first, access to the songs was very limited
as the file format was proprietary and the company was using a Digital Rights
Management (DRM) system to prevent piracy.
Other services allowed users to download music legally from large online
repositories, and charged the customer a small fee for each download. The first and
most successful example of this model has been Apple’s iTunes Music store. The
popularity of Apple’s iPod music player, combined with Apple’s success in
contracting with the labels for content made available on the user‐friendly iTunes
store and music player, gave Apple a huge lead in online music distribution. Again, a
proprietary DRM called FairPlay was used on every music file sold by the iTunes

35
music store to prevent piracy. FairPlay limited the number of legal copies that could
be made of a file, or the number of authorized devices that could read a certain
track.21
It is worth noting that most of the players that launched a digital music service in
the early 2000s had some degree of expertise in software development. These new
players each took advantage of their existing position and complementary assets
(e.g. the customer base in the case of Apple) to quickly launch these services. To get
music labels to sign trade agreements, Digital Rights Management Systems were
created. Although most, if not all, DRM systems have been cracked, the primary goal
of these newer legitimate services is to provide a convenient way to legally obtain
digital music files at a reasonable price, while offering superior quality content.
These market‐based solutions presume that given the choice, users will choose a
legal option if it’s easy to use and the price is right. 22
II. Post‐disruption developments: 2000‐2010
a. A new balance of powers
Several developments have changed the face of the online music delivery market
since these early days. Overall, the evolution of music sales in the past decade
shows that the paradigm shift to digital music delivery has provided an opportunity
for new entrants, and has ended the prominence of music labels.
36
As years have passed, it becomes clear that Apple has been very successful at
leveraging the icon status reached by the iPod, which represented 72% of the
market for portable mp3 devices in 2006.23 Compared to other digital music store,
the iTunes Music Store provided a more streamlined content supply channel to the
device as it was part of the integrated “iTunes + iPod” experience. In effect, the
easiest way to fill an iPod with digital music was through the iTunes Music Store –
and in particular, the only way to fill it with authorized online music, was through
the iTunes Music Store. From 2002 onwards, the iTunes Music Store has in fact been
the first online music retailer in the U.S. According to a recent study by NPD
MusicWatch24, iTunes has continued to solidify its lead in the digital music arena, as
consumer downloads from iTunes represented 69 percent of the digital music
market in the first half of 2009. AmazonMP3, a service launched in 2007, was
second with only 8 percent of the market share.
Digital music sales are making up an increasing share of U.S. music sales. According
to the RIAA’s 2008 Year‐End Shipment Statistics25, 68% of the music sold in 2008
was on a physical medium (e.g. a CD), while 32% was sold digitally. In 2007, these
numbers were respectively 77% and 23%. In fact, although it sells only digital
music, Apple iTunes was the number one music retailer in the U.S. in 2008, with 25
percent of all music units sold. Walmart was in second position with 14% of the
market share.
37
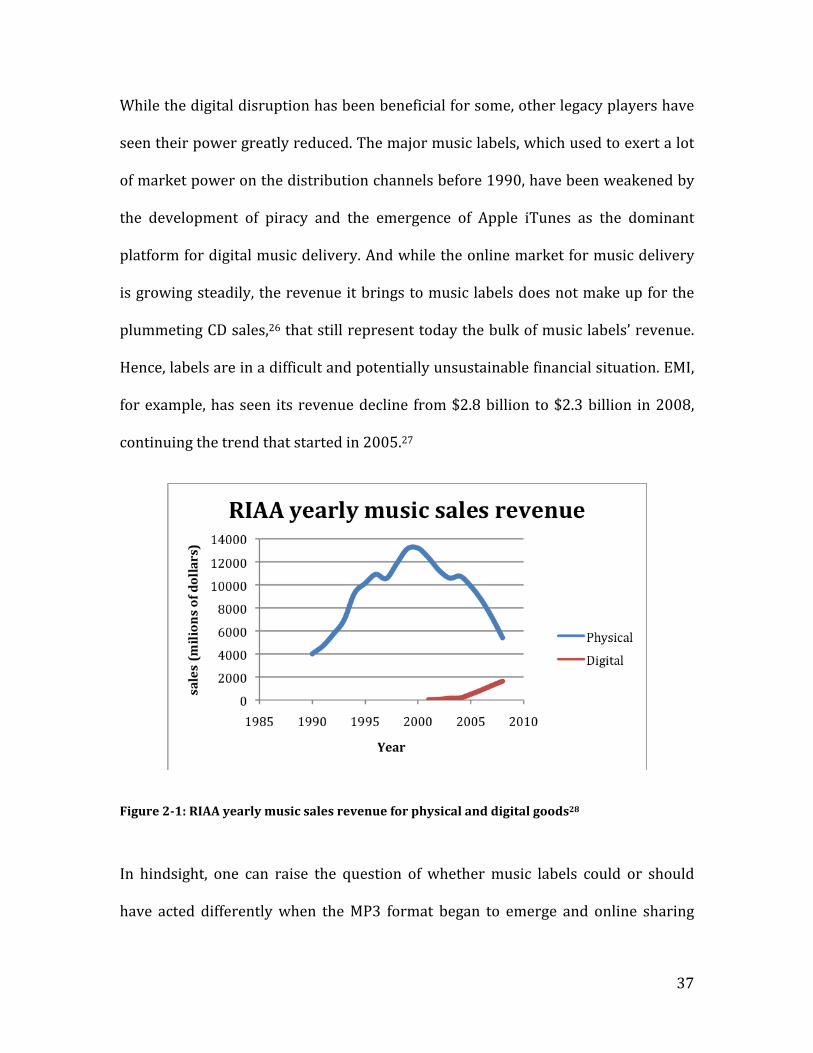
While the digital disruption has been beneficial for some, other legacy players have
seen their power greatly reduced. The major music labels, which used to exert a lot
of market power on the distribution channels before 1990, have been weakened by
the development of piracy and the emergence of Apple iTunes as the dominant
platform for digital music delivery. And while the online market for music delivery
is growing steadily, the revenue it brings to music labels does not make up for the
plummeting CD sales,26 that still represent today the bulk of music labels’ revenue.
Hence, labels are in a difficult and potentially unsustainable financial situation. EMI,
for example, has seen its revenue decline from $2.8 billion to $2.3 billion in 2008,
continuing the trend that started in 2005.27
Figure 21: RIAA yearly music sales revenue for physical and digital goods28
In hindsight, one can raise the question of whether music labels could or should
have acted differently when the MP3 format began to emerge and online sharing
38
appeared. Indeed, it seems that rather than being caused by an identifiable
aggressive player, the content owners’ loss of power was caused by a succession of
related events.
Looking at how slowly the market for digital sales was developing, music labels
prioritized the fight against piracy, which was perceived as a much bigger revenue
issue than the growing digital music market at the beginning of the 21st century.
Developing an online platform for music delivery was also a potentially dangerous
way to go for music labels. First, labels had little to no experience in digital music
distribution. This new delivery model required expertise in software design and
networks, two areas that most labels were not related with. In the meantime, the
basis of file‐sharing software and MP3 retailing sites was growing quickly. As
competition was fierce during the early days of digital music distribution, labels
adopted a “wait‐and‐see” strategy and agreed to license their music rights to several
players (including Apple iTunes and Rhapsody), while keeping their focus on fights
over piracy. The belief that very few customers would pay for digital music as long
as it was available on P2P networks was strong, and this belief may be part of the
reason why music labels agreed to license their rights to digital retailers. Because
the distribution costs were close to zero, music labels were able to pressure
distribution channels to reap the same share of the revenue on a digital copy of a
song as on a CD. It is estimated29 that in both cases, 70% of the revenue is given back
to labels and artists.30
39
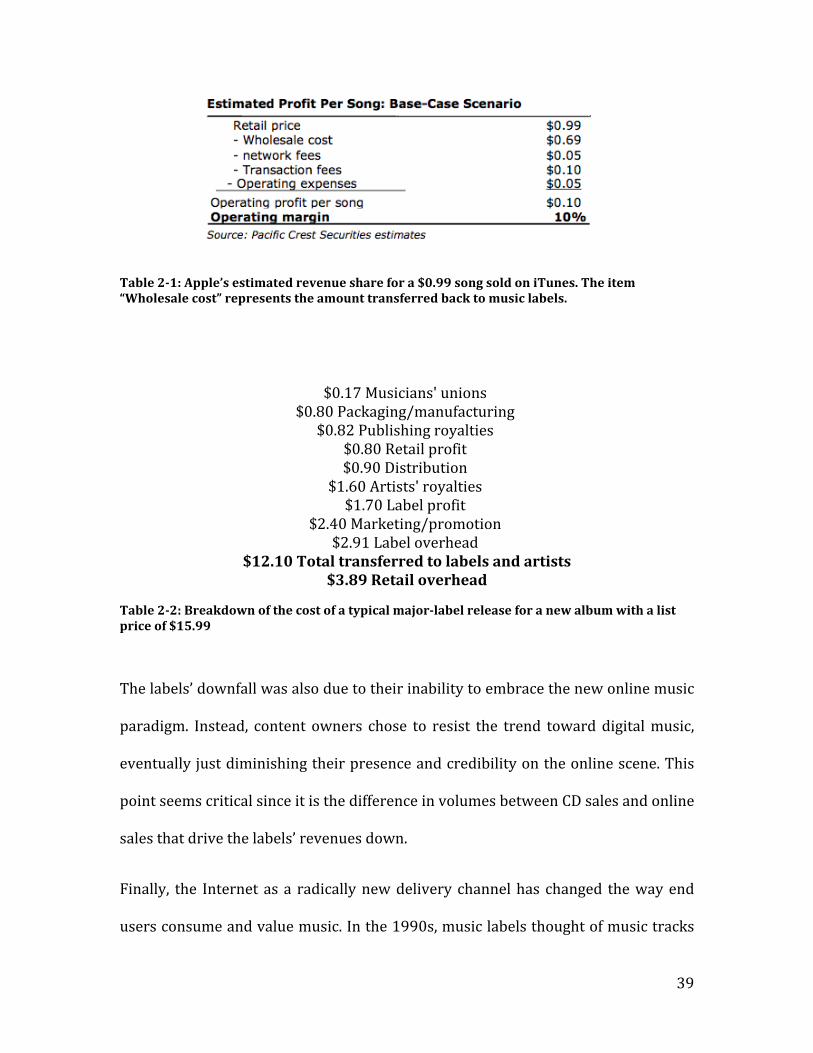
Table 21: Apple’s estimated revenue share for a $0.99 song sold on iTunes. The item “Wholesale cost” represents the amount transferred back to music labels.
$0.17 Musicians' unions $0.80 Packaging/manufacturing $0.82 Publishing royalties
$0.80 Retail profit $0.90 Distribution
$1.60 Artists' royalties $1.70 Label profit
$2.40 Marketing/promotion $2.91 Label overhead
$12.10 Total transferred to labels and artists $3.89 Retail overhead
Table 22: Breakdown of the cost of a typical majorlabel release for a new album with a list price of $15.99
The labels’ downfall was also due to their inability to embrace the new online music
paradigm. Instead, content owners chose to resist the trend toward digital music,
eventually just diminishing their presence and credibility on the online scene. This
point seems critical since it is the difference in volumes between CD sales and online
sales that drive the labels’ revenues down.
Finally, the Internet as a radically new delivery channel has changed the way end
users consume and value music. In the 1990s, music labels thought of music tracks
40
as the product or the "commodity", and music sales were supporting the whole
music industry. Nowadays, fans perceive that value comes more from the services
associated with music than from music itself, and as such, have changed their
consumption habits. This evolution of perception has certainly been facilitated by
the empowerment of the end‐user, but has left the content owners with a difficult
equation to solve: how should they change their business model, as their old
business model is not transferrable to the Internet, and value is now increasingly
captured by new players in the value chain?
b. Recent Issues
The fact that new entrants gained increased market power and captured more and
more value in the value chain has created tensions between music labels and
distributors.
As we have already seen, DRM was among the major points of contention. On
February 6, 2007, Steve Jobs, CEO of Apple Inc., published an open letter entitled
“Thoughts on Music” 31, asking the four major music labels to sell their music
without DRM. According to Jobs, Apple did not want to use DRM but was forced by
the four major musical labels with whom Apple negotiates contracts for iTunes.
Many commentators criticized Apple's approach to DRM. While openly criticizing
DRM, Apple had been actively threatening or suing anybody trying to open their
own DRM or make it interoperable. Critics claimed that this was not because Apple
was afraid of illegal copies but because it gave them an advantage in their market

41
position as a leader in both electronic music sales and in music players, reinforcing
each other due to the FairPlay DRM.
In January 2009, Apple announced that the music sold on the iTunes Music Store
would be totally DRM‐free. To get agreement from the music labels, Apple had to
give up its “every song for $0.99” policy and offer three different price points,
depending on the royalties demanded by the music labels for each track.
This apparent gain of market power for the labels reveals more about the new
mechanics that are at play here. When Apple launched its service in 2002, the use of
DRM was a tool to convince labels to embrace services such as iTunes as a potential
alternative to illegal downloading. Recently, DRM was deemed as irrelevant because
the burden it put on customers and innovators far outreached the benefit that labels
could get from them.32 By removing DRM from its online music catalogue, Apple
creates positive incentives for artists and customers to use the iTunes platform, as
lock‐in to proprietary formats is no longer a threat. Of course, stimulating the
market for mp3 will stimulate the market for mp3 players as well, the main revenue
stream for Apple in the music market.
Piracy is still a troubling issue for the RIAA, the music labels, and some artists,
particularly in light of the new generation of file‐sharing systems, using the
BitTorrent protocol. Instead of directly downloading the target file, a BitTorrent
downloader processes small files called “torrents.” These torrents contain metadata
about the files to be shared and about the computer that coordinates the file
distribution – the tracker. In order to download a file with this system, users must
42
first obtain a torrent file for it, and connect to the specified tracker, which tells them
from which other peers to download the pieces of the file.
There has been much controversy over the use of torrents for file sharing. While
BitTorrent seems to be mostly used to share big files, it is one of the RIAA’s main
targets, as it is estimated that more than a billion songs are downloaded monthly via
BitTorrent, mostly illegally.33
Since BitTorrent metafiles do not store copyrighted data, it has been claimed that
BitTorrent trackers, which only store and track the metafiles, must therefore be
legal even if sharing the data in question would be considered a violation of
copyright. BitTorrent advocates also suggest that, unlike Grokster or Napster,
BitTorrent is not well suited to users seeking to share copyrighted material without
authorization. First, BitTorrent itself does not offer a search facility to find files by
name. A user must find the initial torrent file by other means, such as a web search.
Second, unlike recent iterations of P2P software, BitTorrent makes no attempt to
conceal the host ultimately responsible for facilitating the sharing: a person who
wishes to make a file available must run a tracker on a specific host and distribute
the tracker address in the torrent file.
Since it is now far easier to track down individuals, music labels have now adopted a
new, less aggressive strategy to fight piracy. Instead of suing individual users for
damages like they did before, the RIAA has now secured agreement with several
Internet service providers, which agreed to “unplug” users sharing copyright‐
43
protected files over peer‐to‐peer networks in case of repeated infringement, in
accordance to the End User Service Agreement.34
Conclusion
While Internet has disrupted the music industry more than 10 years ago, legacy
content owners seem to still be looking for answers and sustainable business
models, as Internet seems to have changed the way music is consumed and
perceived as a good. Entrants have managed to create new revenue opportunities,
and legacy players such as music labels have seen their revenue model plummet.
As Internet is quickly gaining in capacity and the technology begins to enable
Internet‐based video delivery networks, video media moguls begin to be concerned
by this new, potentially disruptive, delivery channel.
It is worth noting that in fact, the music industry has long been fighting the piracy
threat. From the early debates on the use of licensed music on radio, to the
numerous controversies about tape recorders, and more recently CD writers, music
labels and producers have always sought to protect their content, with both
stringent regulations and secure storage supports. This long history does not apply
to the Sports industry, and while piracy is going to be an increasing concern for
Sports content, other questions are raised by this dramatic shift.
“Video over IP” is developing at a time where all the stakeholders are aware of the
upcoming disruption – thanks to what was learned ten years ago as music was
44
disrupted. Even if the results of the disruption are extremely uncertain, most
players in the sports broadcasting industry are historically closer to Internet
delivery channels, and thus legacy players are embedded much more deeply in the
early trials of “Sports over IP” initiatives.
Piracy may still be a big issue for Sports over IP if copycats catch on. Be because of
the awareness of content owners, broadcasters and content aggregators, it seems
that the controversies for Sports over IP will not be mainly centered on piracy, but
much more on innovative services, control of the value chain, and value capture
mechanisms.
45
Chapter 3. Technical Challenges associated with the development of Web TV
As we have witnessed in the last chapter, the Internet has brought openness in
formerly centralized and vertical entertainment industries. The music industry is
not an exception, and dramatic changes are operating in the newspapers and the
book industry as well. Yet, television is just beginning to see the premises of an
Internet disruption. This chapter will first show that the Web TV market is ripe to
welcome more than just user‐generated content, as users change their habits and
the technology allows new producers to broadcast high‐definition streams over the
Web. The second part of this chapter will then examine the technological conditions
under which “Sports over IP” could become a reality.
I. Distinction between Web TV and IPTV
The terms “Web TV”, “online video” and “IPTV” often have ambiguous meanings.
Some parts the literature don’t clearly make a distinction between Web TV and
IPTV, and some use the term “IPTV” where others talk about “Web TV”. These
definitions are not necessarily widely accepted, as the range of the technologies and
standards available make it difficult to draw a clear line between what belongs to
“Web TV” and to “IPTV”.
For the sake of clarity, in this thesis, “IPTV” will refer to delivery models that use a
proprietary network to deliver digital video using the Internet Protocol. What
46
defines specifically IPTV is that the Internet service provider acts as a gatekeeper
and has control over the channels that are delivered to the customer, often through
the use of a set‐top‐box. The business model and the value chain dynamics that exist
behind IPTV services are thus very similar to those of cable and digital broadcast
satellite services. Verizon FiOS is one example of IPTV service that is currently
offered. Verizon, just like Comcast with its cable offering, brings Internet and
television to the customer, in exchange of a monthly subscription fee. While some
content is available on‐demand, Verizon acts as an aggregator, just like cable or
satellite providers do.
Contrary to IPTV services, “Web TV” or “online video” services refer to video
streams brought to the end‐user via the Internet Protocol, but that are not
aggregated nor controlled by the Internet Service Provider (ISP.) Web TV packets,
even though they contain video content, are treated like any other packet that is
transiting on the internet – although the protocol used to transmit them might be
different – and as such, are subject to the same advantages and limitations than the
rest of the Web traffic. The business models associated with those Web TV services
vary, but often don’t directly involve the ISP, which is used solely for data carriage.
Some of those services, like Google’s YouTube, are free to consumers and ad‐
supported, while users of MLB.TV have to pay monthly subscription fees directly to
the MLB to gain access to the content.
This chapter, and the rest of the thesis, considers IPTV services as part of the legacy
model that has been developed in the 1970s with the development of cable and

47
digital broadcast satellite. The business model supporting the IPTV technology is
really close to the cable and satellite offerings, as the carrier has the same
aggregating and gatekeeping role than cable and satellite broadcasters have.
On the contrary, Web TV is at the center of the new disruptive video delivery
models, where among other things, that aggregator and gatekeeper role of the
carrier is questioned. The customer experience in this second case is closer to
today’s consumer‐based Internet experience.
II. Development of Web TV
a. History of Web TV
Interestingly enough, Web TV’s first iterations were inspired from the broadcast TV
model: producers would release videos on a regular basis, and their website would
be supported by ads. The first Web TV show, The Spot, appeared in 1995. This
website television drama was inspired from a contemporary television drama. The
Spot was an episodic fiction website, that aimed at taking advantage of the new
interactive possibilities that the Web had to offer. Viewers could post to the site and
email the cast to offer advice and became part of the storyline. The writers of the
show would indeed use the audience’s opinion to shift the plot lines around. From a
business standpoint, thespot.com was also among the first web sites financed by
advertising banners and product placements. At its height, the site received over
100,000 hits a day, a tremendous response for its time. Other early web series,
48
featuring small videos each week, came later to populate the Web.
After the dot‐com bubble, and as broadband bandwidth began to increase, new uses
for Web TV emerged. User‐generated content invaded the Web, and important
players such as YouTube and Dailymotion appeared in the mid 2000s. Those new
players completely changed the Web TV paradigm. In this new context, viewers
began consuming short, low quality on‐demand videos with no background, rather
than shows that were closer to what traditional TV already offered. This new
concept attracted an increasing number of viewers: YouTube had less than 60,000
visitors shortly after its creation in August 2005, and was serving 20 million a year
later.35
b. Development of Web TV nowadays
As pointed in the first chapter of the thesis, more and more video that could be only
found in the closed proprietary distribution networks of the cable companies are
appearing on the Web. Various new Web TV services have been launched in the past
ten years (Hulu, Joost, Blip.TV, MLB.TV) and the tendency is to the increase in the
Web TV offering.
These new offerings originate from a dramatic increase in consumption of online
video. While Web TV still accounts for a very small part of the U.S. video
consumption (Americans spend overall forty times more time watching traditional
TV than watching Web TV), the rate of growth of the online viewership is far greater

49
than the rate of growth for traditional television, both in terms of time spent, as in
terms of number of users. This is shown in the tables below.36
Table 31: Usage of television and Web TV services in 20082009
Table 32: Monthly time spent using television and Web TV services in 20082009
More than 140 million people in the U.S. have watched online video, which
represents over 10 billion video clips from US locations alone. Overall, 72.8 percent
of the total US Internet audience has viewed online video. This figure suggests that
Web TV is being adopted by a specific subset of the population that has both access
and a marked interest in being connected to the Internet. While penetration of Web
TV services is still greatly inferior to penetration of television in the U.S. (which is

50
very close to 100%)37, they still represent a thriving market and a serious contender
to traditional broadcast and cable‐owned models.
The following table presents the main destination sites for online video
consumption. While Google’s YouTube appears as a clear leader, more recent online
video providers such as Hulu or CBS are beginning to reach a significant number of
users as well.38
Property Unique Viewers (000)
Average Videos per Viewer
Total Internet 147,322 100.7 Google Sites 101,870 62.5 Fox Interactive Media 62,109 8.9 Yahoo! Sites 41,859 8.9 Microsoft Sites 30,042 8.9 AOL LLC 27,198 6.8 HULU.COM 24,448 10.2 CBS Corporation 24,215 4.2 Viacom Digital 24,126 11.9 Turner Network 22,979 8.5 Disney Online 13,435 10.5
Table 33: Top U.S. Online Video Properties* by Unique Viewers as of January 2009
Sports broadcasting is only a small subset of this market, but services like MLB.TV
have seen growth in a similar fashion than DailyMotion or Hulu. There is therefore a
market for online video delivery, that seems to be ripe to welcome more and more
high quality content, that was traditionally delivered by over‐the‐air or cable
broadcasts.
However, there are problems associated with the scaling up of such services, in
terms of network and bandwidth management. In this next part, we will first

51
examine the current over‐the‐top streaming technology and point out the key
differences with the way cable broadcasting works. The second part of this study
will look at emerging technologies that allow for better Web TV streaming, and the
infrastructure that will be needed for these technologies to be efficient.
III. What do we need to achieve Sports over IP ?
When dealing with the issue of broadcasting Sports over IP, the main issues appear
to be more hardware‐based than software‐based. Indeed, there are currently
several efficient tools to compress and stream video feed using the Internet
Protocol. On one hand, Adobe and Microsoft, with their respective Flash and
Sliverlight suites, have developed tools for producers and viewers, that prove to
scale very well with growing numbers of viewers. YouTube, which is using the Flash
player, now has more than 120 million viewers in the U.S.39 and is a tangible proof
that the streaming technologies can scale at a mass‐market level. On the other hand,
the existence of MLB.TV, exhibited in chapter 1, already demonstrates that those
streaming technologies are mature enough to provide high‐definition streams to
end‐users over the Internet.
However, the increasing demand of online video, shown earlier in this chapter, has
raised the concern of Internet Service Providers across the country, as the existing
infrastructure is more and more solicited to answer to the growing demand. The

52
rest of the chapter will look at the premises for these concerns, and the potential
solutions that could be implemented to alleviate those.
a. Current technology: why is Internet so much different than cable TV?
Give the limited amount of space that is available to treat the topic, the study will
only address concerns associated with cable television and Internet delivered by
cable. Cable has been chosen as it has a 61% market share in the U.S.40 for television
services, and is used as an Internet service provider by 30% of Internet users in the
US, providing roughly 50% of the broadband Internet in the country.41 While the
issues arising with the use of a telecom‐based DSL technology are different, the
reader will be able to find similarities with the example provided below.
Figure 31: Delivery network for cable television and Internet

53
The figure above describes how cable delivery networks work, at a very high level.
Since the upgrades of the major cable analog networks and the switch to digital
cable, cable operators can use their hybrid‐fiber and coaxial (HFC) network to carry
data and TV channels from their respective sources to the headend, and from the
headends to various nodes. At the headend, or the final node of the network
(depending of the population of the area that is served), the Cable Modem
Termination System (CMTS) will convert the IP data streams carried from the
Internet for each user served by the headend or node into a signal that can be
carried to the end‐user through the copper lines, on top of the TV signal.
The majority of each user’s bandwidth is dedicated to television. Estimates vary
between operators and sources, but one can assume that a user’s IP stream takes no
more than a fourth of the available bandwidth on its cable connection.
This system has essentially been designed to carry TV signals and has been adapted
in the 1990s to allow Internet data to be carried in the same physical pipes as
television. Thus, while it brings efficiently a high number of TV channels to a large
number of users on the television side, it supports Web TV very poorly. This comes
from the fact that all Television channels are made available at each headend or
node, and only one to three of them are actually transmitted to each user, taking a
fixed amount of bandwidth on the customer‐end of the network. Internet data,
however, is treated differently, and is only allowed on the remaining bandwidth for
each node. Since a large number of users connected to the same CMTS are sharing
the same remaining bandwidth, each individual IP stream is competing for
54
bandwidth with the other ones. The current paradigm allow for heavy users that
watch online videos and use demanding peer‐to‐peer file sharing networks, whose
consumption habits are balanced by the vast majority of user that has simple needs.
Data released by network management companies42 show that 10 percent of
subscribers consume 80 percent of bandwidth, while 80 percent of subscribers use
less than 10 percent of bandwidth. While file sharing on peer‐to‐peer networks
seems to be an important factor in this distribution, video viewing is identified as on
of the other major components of these consumption trends, and one of the most
likely to change abruptly.
While this paradigm of bandwidth sharing seems to hold now, problems could arise
if a significant share of these low users suddenly changed their habits and watched
online video.
b. Current implementations of Web TV: the unicaststreaming model
The unicast‐streaming model establishes a point‐to‐point interaction between an
individual user and a video server, often via a common protocol such as the Hyper‐
text Transfer Protocol (HTTP) and the Transfer Control Protocol (TCP)43 Once the
connection is established between the user (or client) and the server, the client will
begin downloading part or the integrality of the video file, depending on the
application used. Because of the protocol used, the video stream will be sent over

55
the Internet as independent packets, and treated as such by the Internet service
provider’s routers or CMTS.
While this design is effective for video on‐demand services like YouTube, it could
prove very inefficient for live services like MLB.TV, where several users could be
downloading the same stream at the same time. Given the point‐to‐point nature of
the interaction with the server, each packet is only addressed to a unique user,
regardless of whether the exact same packet has been sent to another close user. In
the worse case scenario, all the users connected to the same node could be watching
the same video stream at the same time, yet one individual stream would be sent to
each user, and would likely lead to network congestion. Another weakness of that
design is that HTTP and TCP feature a lot of confirmation requests around packets,
to make sure that none of them has been lost. While this is necessary to guarantee
reliable delivery of a stream of data for most of the Web traffic, it makes the data
transfer rate volatile and dependent on server‐client latency as well as packet loss.
Content Delivery Networks (CDN), such as Akamai, attempt to provide a higher
quality streaming experience by reducing the delivery distance and increasing the
availability of streams to the consumer. Instead of establishing a connection to the
server hosting the video streams, each user will establish a connection to a
dedicated server that is physically closer to the client’s location. However, these
CDN architectures do not solve congestion issues that arise at a the level of the node

56
– e.g. the system is not more efficient when two users connected to the same node
watch the same stream.
To mitigate the drawbacks of HTTP/TCP, other protocols have been developed. The
most common low‐level protocol to stream data in real time is the User Datagram
Protocol (UDP)44, notably used in most of Voice over IP applications. By its design,
UDP is capable of delivering messages at more consistent speeds than HTTP/TCP,
but is less reliable as UDP does not check whether packets have been received in a
timely manner or at all.
The RTP and RTCP protocols, more recent than UDP, have been designed specifically
with online video in mind. These protocols, working together, provide several
features (e.g. compensation of the variability in latency, detection of out of sequence
arrival in data) that ensure a smoother viewing experience. But more importantly,
RTP and UDP support data transfer to multiple destinations through multicast.45 As
we will see in the next part, this specific technology is key in the development of
Sports over IP.
c. Tomorrow’s needs: why multicasting is critical in the case of SpoIP
There are technical solutions that can take advantage of the prevalence of live
experience in Sports broadcasting. Contrary to unicast, IP multicast achieves one‐to‐
many communication over an IP‐based network. Multicast uses network

57
infrastructure more efficiently than unicast by requiring the source to send the
stream (in this case, the packets) only once, even if it needs to be delivered to a large
number of receivers.
In the case of Sports, multicasting has many advantages. Since most of the value is in
the instant and the live broadcasting, one can expect that multicasting would allow
for a more efficient use of the Internet bandwidth, as many users watching the same
game live on Web TV would be sharing only a unique IP stream, as opposed to the
equivalent of one stream per user for unicasting. Furthermore, multicasting scales
to a larger receiver population by not requiring prior knowledge of who or how
many receivers there are.
Multicasting does not require fundamental changes in the core infrastructure of the
existing network – rather a more systematic adoption of protocols that support it
and routers that allow multicast are needed.46 However, as demand for online video
will grow, new protocols will have to be developed, and a larger infrastructure
allowing for more bandwidth will have to be created. Thus, the burden of
developing multicasting solutions seems to be placed mostly on the shoulders of the
carriers. As the carriers don’t have a direct interest in developing Web TV services,
and the Web TV landscape seems to be composed of multiple, relatively small
players, a problem arises: how can we motivate capital expenditure that will allow
for more Web TV traffic ?
58
IV. The broadband incentive problem
While the benefits of multicasting are clear in the case of Sports broadcasting for
example, it is unclear whether the carriers will find the operational and capital
expenditures required by the demand for more bandwidth and multicasting worth
what they could get from them.
Because of the flat rates that have been offered to US Internet users to promote
broadband adoption, cable carriers have currently limited options regarding traffic
management, as going back to pricing models that are adapted to consumption
patterns seem to meet consumer resistance. The current business model makes
sense as long as low users value availability and convenience, and agree to tacitly
pay for more than the bandwidth they are really consuming, while a small
percentage of users consume much more than what they are currently paying for.
To control heavy users, cable companies have started voluntarily throttling traffic
for heavy users during peak hours, or limiting the amount of data that an individual
user is allowed to download every month.
While developing more efficient delivery technologies such as multicasting, and
increasing available bandwidth to end users would be partly in line with the cable
carriers’ strategy of providing “TV everywhere”47, improving the infrastructure
would benefit many other players, including the cable companies’ competitors on
the production side. We have here an incentive problems: while some of the content
that would be going through this new infrastructure would be controlled by
carriers, a lot of it would also be other producers “free‐riding”. As the burden of the

59
additional cost cannot be transferred totally to end users, carriers would rather
have content that they can control flow over these pipes, or at least would like to be
compensated for that extra traffic and all those sunk costs incurred. 48
Even if multicasting proves cheap to implement, the carriers are likely to allow it
only if it serves their interests. To address this incentive problem, several measures
could be taken.
‐ If multicasting proves to provide tangible benefits that by far go beyond the
carrier’s specific interests, the FCC could have to intervene to enforce the
enabling of multicasting standards (precedents ? Premises for this ?) The
government has recently clearly stated its intent to bring broadband to the
masses, and as such is heavily subsidizing the development of the cable
infrastructure in the U.S, especially in rural areas.49 As such, the regulator
would arguably be in its own right when demanding that cable carriers
develop technologies that increase the overall efficiency of the network, even
if it does not directly serve the carriers.
‐ Along those lines, the carriers could be required to free up some of the
bandwidth currently allocated to cable TV channels to allow more IP‐based
traffic.
‐ There are other alternatives that promote more freedom for the content
providers and the carriers. Although the FCC has historically watched what
was being carried over the cable infrastructure very closely (must carry,
etc…), one could see a more free‐market approach for over‐the‐top content.

60
Then, producers could start remunerating carriers for allowing better flow of
content. This has already happened in the United Kingdom, where the BBC is
encouraging ISPs to adopt multicast‐addressable services in their networks
by providing BBC Radio at higher quality than is available via their unicast‐
addressed services.
Conclusion
There is a market for online video, which is developing faster and faster each year
(with 2009 being an inflexion point.) While current technologies exist to stream
HDTV over IP, there is a growing concern that demand could grow much faster than
capacity, completely hampering Internet traffic as it works today. While there are
ways to overcome those difficulties – especially in the context of Sports content,
thanks to multicasting ‐ there is an incentive problem, as the burden of the costs will
rely heavily on the Internet service providers or carriers, which will have a much
harder time capturing all the value invested in that infrastructure.

61
Chapter 4. Early implementations and challenges of Sports over IP
In this chapter, we will describe in further details the early implementations or
projects of Sports webcasting. First, we will show how the concept of broadcasting
sports over IP is a disruption, by using Clay Christensen’s criteria50. Then, we will
propose a classification of the early examples of “Sports over IP”, focusing on value
capture and control over the value chain. Three major scenarios will be identified: in
each of them control shifts in turn to the advantage of the content owner, the
broadcaster and finally the end customer. The viability from a business point of
view and the potential impact on the existing value chain will then be studied in
details for each scenario.
For the sake of clarity, and to simplify the modeling work that will follow in this
thesis, the categories chosen and the examples taken will reflect only part of the
reality. Describing in depth all the interdependencies between the stakeholders in
those early examples could be the work of a master’s thesis on its own, but it is not
the purpose of this work. The reader should keep in mind that the reality is actually
more complex than what will be described. The primary aim of this part is to
describe the different goals of each stakeholders, and the means that each of them is
using to fulfill them.
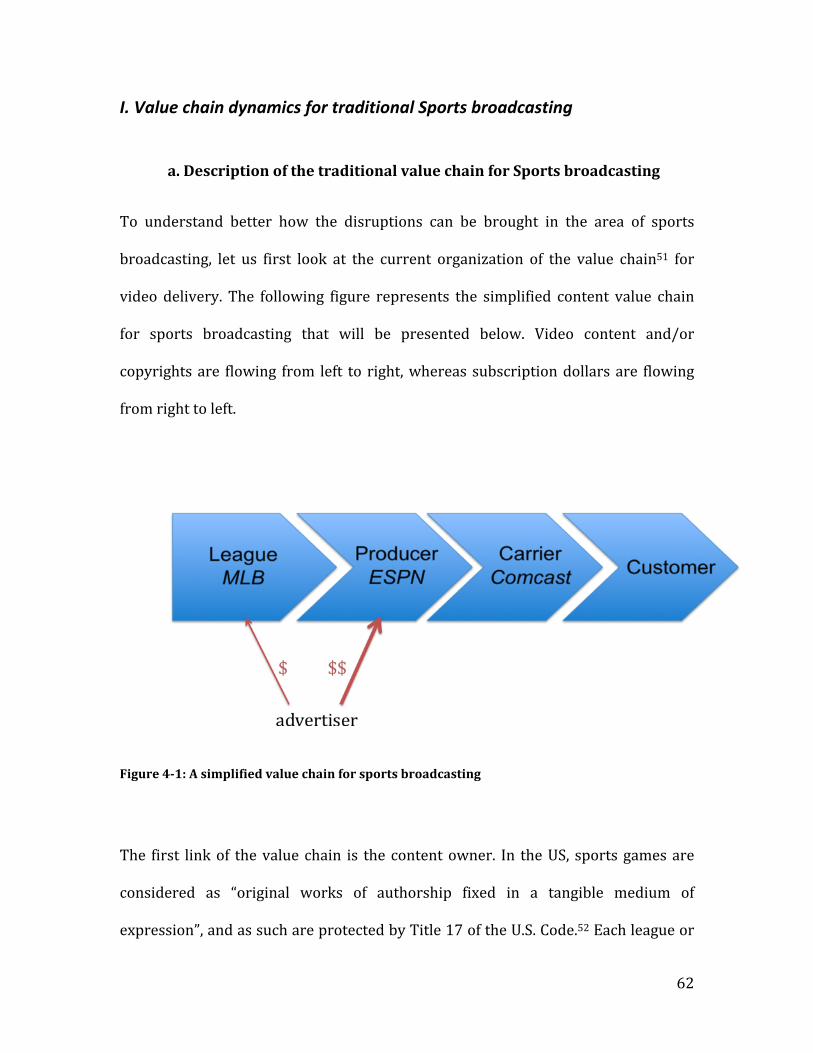
62
I. Value chain dynamics for traditional Sports broadcasting
a. Description of the traditional value chain for Sports broadcasting
To understand better how the disruptions can be brought in the area of sports
broadcasting, let us first look at the current organization of the value chain51 for
video delivery. The following figure represents the simplified content value chain
for sports broadcasting that will be presented below. Video content and/or
copyrights are flowing from left to right, whereas subscription dollars are flowing
from right to left.
Figure 41: A simplified value chain for sports broadcasting
The first link of the value chain is the content owner. In the US, sports games are
considered as “original works of authorship fixed in a tangible medium of
expression”, and as such are protected by Title 17 of the U.S. Code.52 Each league or
63
team is then free to formulate its own policy regarding copyrights. However, as
broadcasting rights are a primary source of revenue for leagues and teams, those
copyright clauses are often very stringent. The MLB, for example, prohibits "any
rebroadcast, retransmission, or account of a game, without the express written
consent of Major League Baseball".53
Most of the video content that is broadcasted over‐the‐air on cable networks is not
produced by the league itself, but rather by the TV networks, which take advantage
of their expertise, equipment (studios, HD cameras) and complementary assets
(high added‐value commentators, brand name for example) to add value to the raw
product that a sports game is, and make it more attractive for the viewer. This
constitutes the second link in the value chain: the production step. Producers also
often act as “content aggregators”: the games themselves will be embedded in a
specific programming on those channels (reviews, interviews, comments…),
increasing the value of the game itself. As stated earlier, and in the first chapter of
this thesis, TV channels are usually ready to give up large amounts of money to get
the rights to produce sports content. In return, they can get important returns on
this investment under the form of advertising dollars – and, in the case of premium
satellite or cable channels, subscription revenues.
The third link in the value chain is called here the “carrier”. Historically, content was
brought to US homes over the air, and national or local TV channels would produce
and carry the content on the airwaves at the same time. However, with the
development of cable and satellite and the blossoming of cable channels, carriage
64
became distinct of production. As seen in chapter 3, carriage or video or Internet
content is an investment‐heavy activity that only a handful of firms provide on a
national scale in the US.
At the end of the value chain is the end user. While historically, the end user does
not play a role in the distribution of content and simply consumes it, we will see that
Internet has significantly empowered the end‐user, to the point that it could be
considered part of the value chain. End‐users are also a primary source of revenue
for subscription‐based cable channels. In 2008, cable‐sports channels earned more
than $9.2 billion of about $22.9 billion in basic‐cable TV subscription fees, according
to SNL Kagan.54
This description would not be complete without advertisers. Advertisers are not
part of the value chain per se, as they do not play any role in modifying or bringing
the content to the end user. However, as they are the main source of revenue for
many players in the value chain, especially producers, they should be taken account
of in this analysis of the value chain dynamics.

65
b. Nondisruptive dynamics in the value chain: everybody wants to be a
producer
As showed in the first chapter of the thesis, the value chain presented above is ever
evolving, and adapts itself to the technologies and regulations in vigor.
Since the apparition of cable and satellite and the exponential growth that major
sports leagues have known in the US since then, sports have become an increasingly
appealing type of content for producers. With audiences diluted across more and
more channels and different entertainment media, national league sports appear as
a relatively reliable source of revenue from advertisers. Sports audiences have two
main advantages for advertisers: their attendance is consistent, and they have
unique demographics. Studies have indeed showed that sports were mainly
watched by men; most of them belong to the 18‐35 age range, a very attractive
segment for advertisers.55 As such, it is not uncommon to find long‐term
partnerships between advertisers or sponsors and local teams or leagues.
Broadcasting sports is therefore a rather cheap and reliable way to attract
advertisers.
On top of this, the mass of money poured into sports advertising has kept increasing
in the past decades – making a move towards production for sports content even
more appealing. For example, the price of a 30 second commercial for the Super
Bowl has increased from $47,000 in 1967 to $600,000 in 1981, to $2,500,000 in
200656. For 2008, TNS Media Intelligence estimates that advertisers spent $10.6

66
billion for commercials in sports programming across U.S. broadcast networks,
cable networks and local TV stations.57
These factors have led to the recent creation of many new satellite and cable
channels dedicated to sports. While historically, production was assured by national
channels that carried their signal themselves, we will see here that many players of
the value chain are moving toward the center of the value chain, to try to get a share
of the colossal amounts of money that are distributed by advertisers for sports
content. This results in a current increase in competition at the production layer of
the value chain, thus giving more bargaining power to both ends of the value chain:
content owners and carriers / end users.
Today, ESPN is the perfect example of a TV channel that produces content, but uses
a dedicated carrier to bring this content to the home. ESPN’s strategy focuses on
national events and deals with sports leagues rather than local teams. As of
September 2008, there were, 97.3 million subscribers to ESPN, 63.2 million to ESPN
classic and 67.4 million to ESPN News.58
The most direct competitor to ESPN is Fox Sports Network (FSN.) Unlike Disney’s
Sports network, FSN’s strategy is to acquire the broadcast rights to major sports
teams in their regional market, which can then be promoted against nationally
broadcast games on ESPN that have no local interest. Nowadays, 24 local cable
channels are affiliated or owned by FSN, covering a very large majority of the US
broadcast markets.

67
However, as described above, new players have recently ventured in production of
sports content. Comcast, which is historically a cable carrier, has launched its own
sports networks: Versus and Speed, respectively in 1995 and 1996. Besides the
antitrust issues that were caused by this move,59 the creation of these networks has
introduced complexities the landscape, and created more competition between
content aggregators.
In the years 2000, more cable and satellite TV networks were created, this time by
the major sports leagues themselves. The leagues have been careful for their entry
into the broadcasting world: new channels such as the NFL network or the MLB
network are in direct competition with legacy producers like ESPN or Versus, and
those producers are still nowadays a major source of revenue for the leagues. As
such, those new networks only broadcast a fraction of the season, so that sports fans
don’t have too strong incentives to switch their watching habits. Other leagues also
accepted financial participation from legacy carriers and producers (A third of the
MLB network is jointly owned by Comcast, DirecTV, time Warner and Cox
communications.)
However, these new channels contribute to further audience dilution. This move
from the content owners can also be seen as a first discreet step toward a more
league‐centric model for broadcasting.
The following table, which is not comprehensive, gives a quick overview of the
complexity and the variety that exists in the offering for sports channels on cable
television.

68
Table 41: List of principal cable TV channels available as of January 2010.
Name Owner Notes
CBS College Sports Network CBS Corporation formerly CSTV
ESPN
ESPN2
ESPN Plus
A service that syndicates college sports to local broadcast and regional cable stations.
ESPN Classic
formerly Classic Sports Network; sometimes used as an overflow for ESPN and ESPN2
ESPNews 24 hour sports news
ESPNU college sports
ESPN Deportes
Disney/Hearst Corporation
Spanish Language sports network
Fox College Sports
Fox Sports Network
Fuel TV
News Corporation
MLB Network Major League Baseball launched January 1, 2009
NBA TV National Basketball Association launched March 17, 1999
NFL Network National Football League launched November 4, 2003
NHL Network National Hockey League launched October 1, 2007
Versus Comcast formerly Outdoor Life Network/OLN. Launched in 1995
69
II. Why Sports over IP is a disruption to the traditional cable TV model
In his Innovator’s dilemma, Clay Christensen defines “disruptive technologies” as
cheap, easy‐to‐build and easy‐to‐use products, which are generally of lesser quality
than the mainframe products from the leading companies.60 By targeting low‐
margin markets, and small groups of customers, entrants grow up on markets that
are not big enough for larger companies. Once they have done so, and the quality of
the product matches what the mainstream market demands, they become able to set
up a new standard for the industry.
What can be worrying for incumbents is that great firms are good at improving the
technology on which their “star products” are based, but face major difficulties
when it comes to adopt a new technology.
In the case of Sports over IP, the disruptive technology is web broadcasting. While it
does not threaten directly content owners, Internet broadcasting can be heavily
disruptive for the producers and carriers, as the rules and complementary assets
that were built during the era of cable and satellite television will not necessarily
stand on the Internet.61
Furthermore, new online services like MLB.TV or pirate television on Justin.tv fit
quite well Christensen’s description of cheap, lesser quality products that
characterize those technologies with a high potential of disruption.
70
Of course, cable networks and carriers are more informed that Christensen’s
archetype of the “incumbent firm”. The history of Internet and its development in
the US has been closely observed and controlled by cable companies, who deliver
access to Internet to 14% of the American citizens today.62 Furthermore, media
moguls have seen what happened to the music industry in the 1990s, as described
in chapter 2 of this thesis, and are well aware of the disruptive nature of web video.
Yet, “Sports over IP” still represents a threat to those rigid, slow‐moving
incumbents. It seems that producers and carriers have, more than anything else, a
business model problem. Indeed, legacy carriers and producers will be threatened
by this disruption as long as there is no clear solution as how obtain a revenue
stream online that is as large and as sustainable as the cable TV revenue stream.
To better understand how disruptive technologies work, it is useful to think in
terms of S‐curves. In Christensen’s marketing and innovation S‐curve model, the
number of users and the quality delivered by every technology and product will go
through a “S‐curve” during its lifetime. Qualitatively, this pattern can be justified as
follows. First, the new products experiences a slow ramp‐up will be slow as the
technology emerges and starts gaining ground. If successful, the product will soon
be maturing and reaching the masses, increasing rapidly its market share,
decreasing its price, and increasing the quality delivered by a great deal. At the end
of the product lifetime, metrics such as number of users and quality delivered will

71
plateau up, either because of technical limitations or because the next generation of
the product will be slowly taking its place.
Disruptive technologies are characteristic in that their initial quality is in many
regards lower than the existing mainstream product. However, they have the
potential to perform better than the existing technology, because of a better design,
of the use of new technologies, by offering ancillary services, etc… In terms of S‐
curves, disruptive technologies begin below their mainstream counterparts, but
have the potential to end up higher than the already mature mainstream technology,
very quickly. This is illustrated by the following figure:
Figure 42: Disruptive Technology SCurve63
In this part, the “S‐curves” framework will be used to examine the past evolution of

72
the industry, and Internet’s potential for disruption. The three main criteria that
were held for this study are the number of viewers per event, number of events
available per dollar spent by a fan, and quality of the content. The comparison will
be made mainly between a traditional cable sports tier and MLB.TV – the first stand‐
alone Web TV service – but it can be generalized to all sports leagues and future web
services. Indeed, the disruptive nature of MLB.TV is tightly tied to the open nature of
the Internet and takes advantage of the cheap, quasi infinite broadcasting space that
is offered by this new medium, on contrary to the investment‐heavy and
constrained (in terms of number of channels, airing time…) nature of cable
networks.
a. Viewers per event
The first important metric for sports’ leagues and broadcasters is the maximum
number of people that will be able to watch a certain event. Indeed, the size and
consistency of the fan base will have a direct impact on the league and the
broadcasters’ advertising revenues. Therefore, technologies that enable them to
reach more and more people are key.
Before televised broadcasting was invented, sports fans had to attend to the games
themselves if they wanted to see their favorite team or athlete. Therefore, the
number of viewers per event was constrained by the size of the stadium – we will
take 50,000 as a baseline.
The number of people that can watch a game did not rise dramatically until

73
television was invented. At that point, sports actually contributed to speed up
adoption of the TV set, and the numbers of set in use in the U.S. rose from 190,000 in
1948 to 10.5 million in 1950, to more than 60 million in 1960. During the 1960s and
the 1970s, development of cable and satellite broadcasting systems contributed to
increase even more the potential audience, and the market penetration kept
increasing to almost reach its “physical limit” as almost anybody in the U.S. can now
watch the Superbowl or subscribe to a cable sports tier – the OECD reports that
cable services are available to 96% of the US population.64
The potentially disrupting technology, Internet broadcasting of sports, is not
widespread yet (MLB.TV has only 500,000 subscribers in the U.S.) However,
broadband Internet already has a 63% penetration, and the potential to reach the
vast majority of the U.S. population… as well as the rest of the world, without the
content owner (e.g. the MLB) having to make specific deals with traditional
broadcasting companies.
Figure 43: Viewers per event Scurve
74
b. Events available per dollar spent by a fan
Fans want to make the best of their money, and granting access to more content for
a lower price has always been a priority for leagues and broadcasters. At the
beginning of the 20th century, a ticket to see a Red Sox game cost about $1 (which
represents about $25 today in terms purchasing power). If we take inflation into
account, we can then argue that the absence of broadcasting technology left the fans
with 0.04 events per 2009 dollar. A monthly subscription to a cable Sports package
costs around $30‐50 on top of a regular cable subscription, and gave customers
access to up to 6,000 hours of programming (now 20,000 hours of programming).
This corresponds respectively to 25 and 60 events per dollar spent (one gets a new
sports event every 6 hours on average on a cable network).
A subscription to MLB.TV gives the customer access to the 162 games played in a
season, for $130, thus representing 1.25 events per dollar for a fan. It is important to
note that this service is still in its infancy, and thus benefits from very few
economies of scale. As we have seen in Chapter 3, the Internet disruption partly lies
in the fact that unlike traditional cable, satellite and over‐the‐air network, there is
no constraint as how much content is available at any point on the web. While
bandwidth can still be an issue, the concept of airtime and constraints on number of
channels are obsolete in webcasting. Therefore, once the webcasting technology is
mastered, we can assume that more and more content owners and producers will
move their content online, without being constrained by television schedule
constraints. This can pave the way to a decrease in price for web content, and an
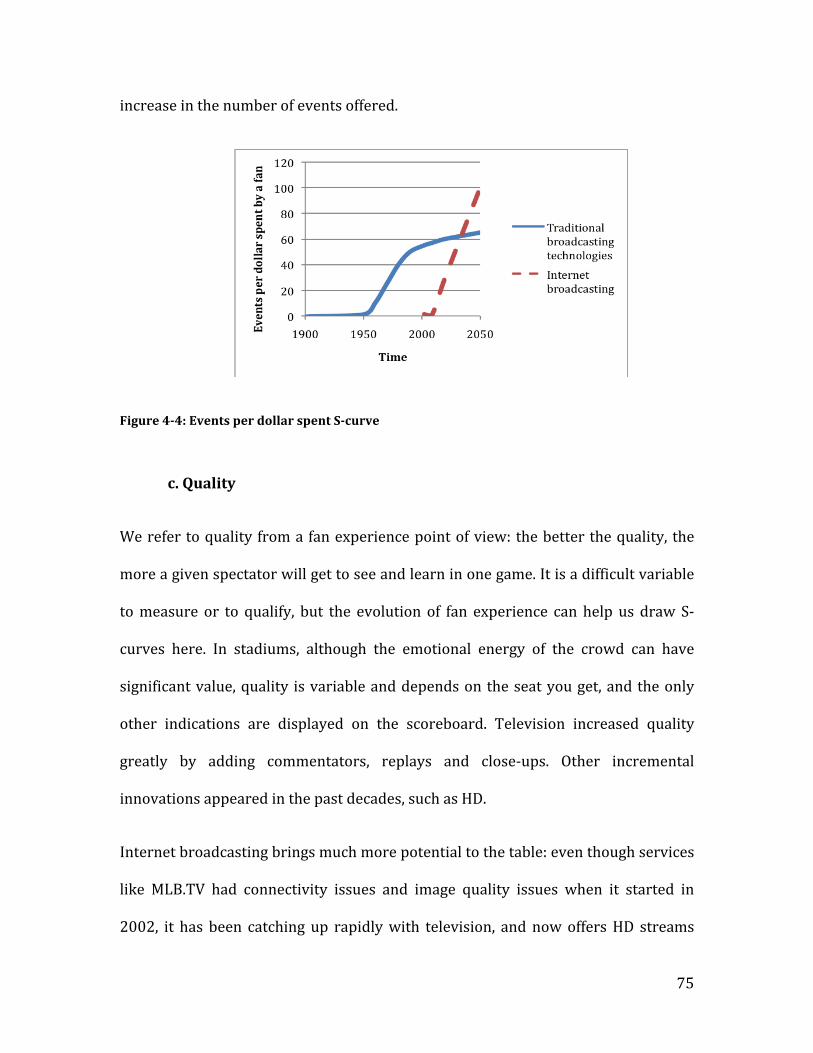
75
increase in the number of events offered.
Figure 44: Events per dollar spent Scurve
c. Quality
We refer to quality from a fan experience point of view: the better the quality, the
more a given spectator will get to see and learn in one game. It is a difficult variable
to measure or to qualify, but the evolution of fan experience can help us draw S‐
curves here. In stadiums, although the emotional energy of the crowd can have
significant value, quality is variable and depends on the seat you get, and the only
other indications are displayed on the scoreboard. Television increased quality
greatly by adding commentators, replays and close‐ups. Other incremental
innovations appeared in the past decades, such as HD.
Internet broadcasting brings much more potential to the table: even though services
like MLB.TV had connectivity issues and image quality issues when it started in
2002, it has been catching up rapidly with television, and now offers HD streams
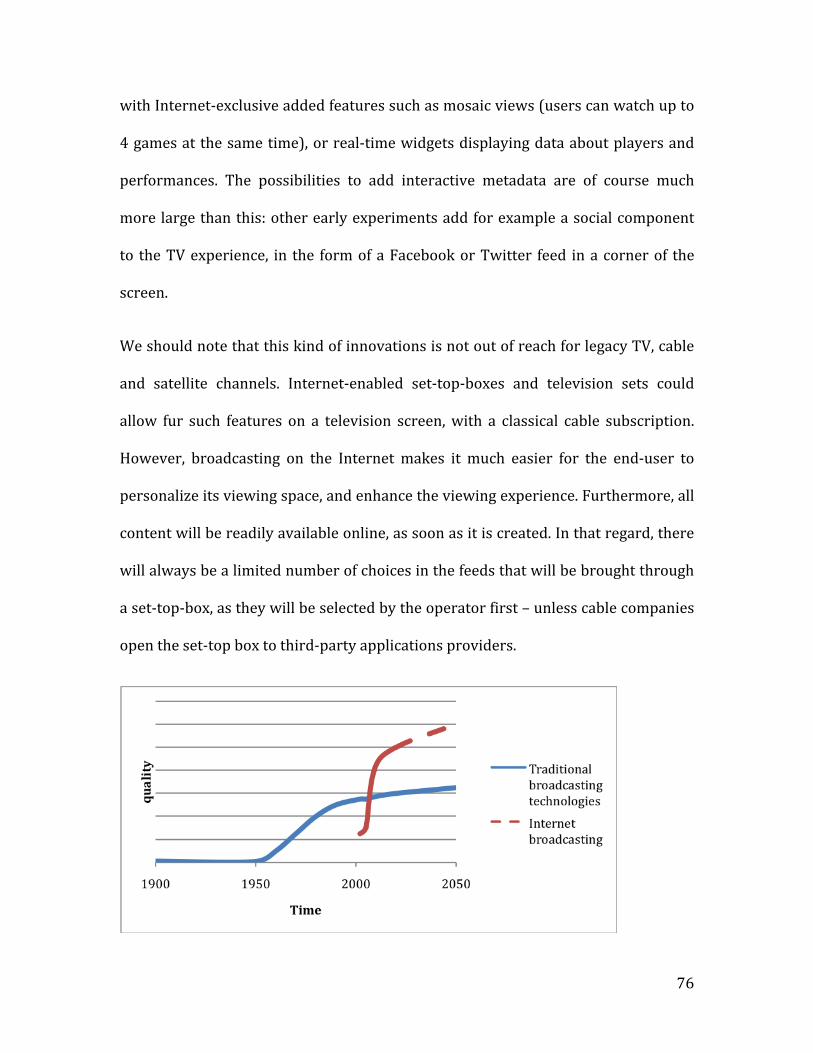
76
with Internet‐exclusive added features such as mosaic views (users can watch up to
4 games at the same time), or real‐time widgets displaying data about players and
performances. The possibilities to add interactive metadata are of course much
more large than this: other early experiments add for example a social component
to the TV experience, in the form of a Facebook or Twitter feed in a corner of the
screen.
We should note that this kind of innovations is not out of reach for legacy TV, cable
and satellite channels. Internet‐enabled set‐top‐boxes and television sets could
allow fur such features on a television screen, with a classical cable subscription.
However, broadcasting on the Internet makes it much easier for the end‐user to
personalize its viewing space, and enhance the viewing experience. Furthermore, all
content will be readily available online, as soon as it is created. In that regard, there
will always be a limited number of choices in the feeds that will be brought through
a set‐top‐box, as they will be selected by the operator first – unless cable companies
open the set‐top box to third‐party applications providers.
77
Figure 45: Quality Scurve
III. 3 different business models
In this part, we will describe briefly the first examples of disruptions to the existing
over‐the‐air and cable delivery models. As each example tends to favor one
particular player in the value chain, those early examples have be classified in three
categories, where successively the broadcaster, the carrier and the end user is
advantaged. Using the complementary asset framework65, we will then briefly
assess the viability of each of those models.
a. Business Model #1: Content is king (the MLB.TV example)
One of the first sports initiatives taken on the Internet did not originate from a
television network, but from Major League Baseball itself. MLB.TV was launched in
2002, and offered users live out‐of‐market content as well as a comprehensive
repository of the season’s past games for a monthly subscription fee. Fearing that
this move would upset its television partners who provide a large share of the
league’s revenue, the MLB has been very careful in implementing this service. The
pricing (about $20 per month) and programming make it complementary and not
directly competitive with a cable sports tier subscription – only appealing to fans
looking for an enhanced experience or for those living outside the U.S. And, the MLB
keeps very stringent blackout rules on its Internet channel.
78
Complementary assets
The MLB has also launched a mobile version of its MLB.TV online service, which is
now available on iPhones. This is a first step toward the development of
complementary assets. Indeed, while other mobile services, like MobiTV, require
adaptation of the content to stream on cellphones, MLB.TV sends an extremely
similar stream to PCs and laptops – only the size of the image and the added
features are different. In that sense, the MLB is the first player to truly leverage the
benefits of broadcasting over the Internet to multiple “screens”.
The MLB benefits from other strong complementary assets to start with. Some are
very specific, like the existing regulation that allows the MLB to behave as a
monopoly66, or its strong brand image. These two factors already guarantee MLB
bargaining power and make it a force to be reckoned with. With the creation of the
MLB network, the MLB has also built expertise in content production and delivery.
Now that assets like bandwidth or airtime, which were tightly held by producers
and carriers, are becoming more widely available on the Internet, the MLB seems to
be in a favorable position if it wants to adopt an aggressive strategy.
b. Business Model #2: Broadcaster is King (TV Everywhere)
“TV everywhere” is one among many projects launched by cable companies, which
aim at rebroadcasting content online while securing traditional cable fees from
subscribers. The basic idea between this service would be to “give away” content

79
online to customers already subscribing to cable television packages. This strategy,
formulated by cable companies, is another step toward customer lock‐in, as end‐
users would become reliant on one operator for both their television and Internet
service. While this kind of service bundling has been allowed in the 1996
Telecommunications Act, this paper argues that the existing equilibrium in cable
delivery markets is not desirable from a customer point of view. However, this
model would secure the monthly subscription revenues and encourage customers to
adopt its cable provider as Internet provider as well, while also creating an
opportunity for online advertising revenues.
This new model creates a tension between legacy producers and carriers. Indeed,
most carriers have now created their own cable sports network (Versus in the case
of Comcast) and plan to use this new online platform as a way to promote their own
programming.
Complementary assets
As we have seen earlier, carriers own a number of complementary assets that are
becoming less tightly held. In a sense, Internet is just an extreme version of cable:
while cable allowed for hundreds of channels to broadcast at the same time, the
Internet is literally allowing for as many broadcasting channels as there are people
willing to broadcast. Broadcasting on the Internet is much easier as on TV, as it is
not regulated by the FCC, does not force a specific video standard (like NTSC or
PAL), nor does it require one to “bid for bandwidth”.

80
On the upside, legacy producers and carriers have a long history of relations with
advertisers, and have extensive expertise at aggregating content, and generating
revenue from delivery. Some of them, like ESPN, also have a very strong brand.
Because of these complementary assets, one can question whether the MLB will be
able to bypass the legacy producers or broadcasters. Indeed, from a business point
of view, the legacy producers and broadcasters have a natural ability to make the
“advertising pie” as big as possible, for their benefit and the benefit of content
owners – in this case, the leagues. However, if those legacy players do not manage to
leverage sufficient advertising revenues from the legacy distribution channels, and
the overall “advertising pie” decreases, we could very well see content owners like
the MLB try to leverage their own distribution platforms and only use ISPs as a
“dumb pipe”, to get a bigger share of this smaller pie.
c. Business Model # 3: Customer is King (the rising piracy threat)
Just like in the case of music, innovators have found new ways to circumvent league
blackout policies, or to avoid the costly subscriptions for premium cable content.
Self‐broadcasting websites such as justin.tv allow individuals to create their own
Web TV channel, and broadcast whatever they want on it – may it be legal or not.
Due to the high number of channels and the difficulty to track the origin of the
content that is being broadcasted, it has proven difficult to stop individuals that
created Internet channels in the sole purpose of rebroadcasting a premium cable TV
81
channel such as the NFL network. Furthermore, the existing legislation67 protects
justin.tv owners against liability suits. Other individuals have also taken advantage
of new place‐shifting technologies such as the Slingbox to rebroadcast market‐
specific content on the Internet, so that people living in Boston could watch the New
York Yankees games too, for example.
Complementary assets
This third dominant model has very few complementary assets that make it viable
in the long run. More than everything else, what makes this solution attractive for
the masses is the fact that the end customer captures all the value. Thus, if content
owners and carriers do not acknowledge this threat and work together to stop
piracy, it may cripple their own growth – just like it did in the case of music.
Conclusions and recommendations
The relative size of the audience for Internet streaming (MLB.TV has a little above 1
million subscribers) shows that the technology has only reached early adopters so
far. These adopters seem to be sports fans that are willing to pay a premium to
benefit from the additional features offered online (mobility, quantity and variety of
content, etc.) or live abroad and would not be able to watch baseball otherwise. The
early majority of sports fans that Internet streaming would target next is already
subscribing to a cable sports tier and would switch only for a better service with

82
lower price. If Internet broadcasting were to “cross the chasm” and seek attention
from this segment, several improvements would need to be brought:
• Uptime should be close to 100%. When it comes to broadcasting, consumers
perceive Internet downtime more negatively than other distribution
channels. Additionally, customer service outlets (phone, email, chat) would
be required.
• The price of the service (which is extremely variable from one offering to
another, depending on the league and the level of quality offered) would have
to be lowered. The broadcaster (e.g. the league, a third‐party developer)
would have to develop a viable business model, for this would be interpreted
as an aggressive move against cable broadcasters and would jeopardize the
potential existing agreements and revenue streams from cable TV.
The following figure redraws the existing value chain, as described in the first part
of this paper, and shows how the three early examples described above attempt to
disrupt the existing order by taking control over new functions:

83
Figure 46: New value chain for Sports broadcasting
Overall, it is impossible to predict which model will prevail. However, one can note
that cable producers and content aggregators (such as ESPN), which seem to be able
to outbid legacy national broadcaster thanks to their double revenue stream, are in
a tight spot today. Their complementary assets, such as production expertise, are
becoming more widely available thanks to the open design of the Internet, and
capturing value by aggregating content may be a difficult way to go in the future.
Content owners, on the other hand, still have to prove that they could be capable of
generating large amount of revenue on their own, without having to rely on specific
content aggregators. Finally, while the piracy threat is not very important today;
content owners, producers and carriers will need to work together to eliminate
regulatory loopholes that may allow it to dominate in the future.

84
Chapter 5. Sports broadcasting: regulatory challenges and opportunities of IP‐based delivery systems
As showed in the first chapter of this thesis, sports broadcasting have historically
driven high revenues, and have even fostered technical innovation, such as the
expansion of cable networks, or broadcasted TV itself.68 This type of content is
regulated very specifically, and has been broadly sought after in the past decades.
Now is the time to look at the existing regulation, and the potential future antitrust
issues that may arise from the emerging Web TV model.
This chapter will first examine the regulatory setting in which the shift to “Sports
over IP” is taking place. We will first see that the history of broadcasting regulation,
particularly that of cable, is inadequate for sports and has failed to create a
competitive market for delivery of premium content. Furthermore, regulation of
sports content delivery itself is relying on assumptions that are no longer valid
nowadays. What we have here are two separate industries where natural
monopolies take place, and which interact in distribution of sports content. While
the law provides an acceptable set of regulations for cable broadcasting and sports
leagues taken separately, the existing legislation is no longer adequate to tackle
market failures that arise when those two industries interact; particularly in the
case of distribution of sports content.
The second part of the chapter will examine how the fundamental shift of
sportscasting over the Internet could either accentuate this failure or, alternately,
foster competition without need for further regulation. Examining the three
85
different potential scenarios that were presented in the last chapter, we will then set
forth a basis for regulation in this new context of sportscasting over the Internet.
I. Premises for regulating Sports broadcasting
According to Senator John McCain69, Major League Baseball (MLB) and the National
Football League (NFL) league championships have reached the status of "traditions"
which have "always been available to all Americans". In this first part, I will argue
that sports content, over the years, has become what could be considered a public
good, and that in agreement with McCain’s statement, which reflects a view shared
by both Republicans and Democrats, sports should be considered as a public good.
This argument provides a rationale for regulating Sports broadcasting and helps
identify the regulatory capture70 issues that characterizes sports broadcasting
nowadays, where benefits reaped by a handful of leagues and access providers, and
costs are borne by legions of fans, to the point where access to sports content
broadcasting is “determined by an income test."2
Sports leagues appear to be “natural monopolies”. As the failed attempt in 1974‐
1975 to create a “World Football League” as a direct competitor of the NFL showed
us71, several market failures lead to the existence of natural monopolies in sports
content generation. Besides the obvious economies of scale and scope that existing
leagues benefit from, teams of the four major US sports leagues have built solid fan
audiences that are attached to their local colors and players. Furthermore, there are
86
strong network effects when it comes to the player base. Good players attract
competition from other good players, along with higher salaries. A new league
would have to attract many iconic players outside the existing structure in order to
provide exciting games and grow its share of the fan audience. Such a battle on
players salary would probably lower the quality of games in both leagues and drive
prices up, as star players, a scarce resource, would use their bargaining power to get
the most out of their contracts.
While sports were a modest business in the 1960s, leagues are now profit‐driven
entities benefiting from market power. One could argue that baseball, or hockey for
that matter, is just one among many forms of entertainment, subject to competition
with the movie or the video game industry. While this argument is defensible to a
certain extent, sports leagues are doing a very good job at maintaining a large
dedicated fan base (through the promotion of college sports for example) and are
producing a very specific type of content that cannot be replaced easily. Indeed,
studies have shown that the demand for broadcasted sports content has been fairly
inelastic72.
The argument that leagues are natural monopolies has been the main motivation for
regulating sports content generation and broadcasting (see parts II and III).
However, a second argument based on more political and cultural grounds has
pushed regulators to look closer at sports content diffusion: the view that sports
content should be considered as a common good.

87
This view is closely related to the history of sports broadcasting. Sports played a
major part in the early development of television networks73, and were available on
ad‐supported, free public channels during the 50s and the 60s. Thanks partly to the
protection provided by the Sports Broadcasting Act of 1961 (see part III), leagues
have grown steadily. They were able to promote themselves, and grow their fan
audience. The NFL itself has evolved from a position of financial struggle in 1960 to
become a multi‐billion dollar entity, whose ever‐increasing TV deals are only on par
with its player’s ever‐increasing salaries. However, since sports have been
ubiquitous in free over‐the‐air broadcasting, they are now considered as part of the
American culture, as Senator McCain pointed out.
According to Olson, collective goods “go to everyone in some group of category if
they are provided at all.”74 Here, the relevant category is the ensemble of US citizens
that own a television. The size of this group, and its heterogeneity of points of view
in the matter of sports broadcasting make it particularly hard to coordinate a
collective action. Thus, not only are there strong incentives to free‐ride for sports
fans, but even if a lobbying group was to be formed to tackle this issue and fight
broadcasters and content owners, it would most likely carry a marginal opinion
view on the topic and would be unable to pull its weight against the media giants.
Hence, there is a need for the regulator to compensate for this market failure.
The very high number of actions that were attempted in Congress to make sports
available to the public shows the importance of this collective action issue, and the
difficulty for groups of citizens to act on this topic. Although it granted sports
88
leagues the privilege of operating beyond the scope of antitrust scrutiny (see part
III), Congress has maintained a healthy skepticism of the leagues and their potential
to bypass the over‐the‐air broadcast networks in search of pay‐per‐view television
riches. Over the past three decades, Democrats and Republicans, which have
attempted to restrain the move of sports programming away from mass‐market
broadcast television, a process known as “siphoning”, have introduced several bills
in both the House and Senate.75 Still recently, Representative Edward J. Markey
characterized professional sports “as unique and important parts of both the
nation's culture and the cohesiveness of local communities.” Calling events such as
the Super Bowl and the World Series "shared national events," Markey suggested
the leagues should at least repay the fans "with free access to those games". While
such iconic examples are used in congressional debates, the same arguments can
apply to regular game seasons.
II. How cable regulation history led to imperfect competition
Cable broadcasting and sports leagues have both been far from exempted of
regulation in the past decades. However, a close look at the history of regulation in
these areas sets light on loopholes that have been partly responsible for the market
failure that exists nowadays.
First, I will show that the move to deregulate cable in general has not fostered
competition as expected, resulting in a very concentrated market where cable
89
broadcasters exert market power. This finding is reinforced by the fact that sports
content is most of the time offered in “expanded” tiers of content, as opposed to the
basic cable packages whose price and content are watched more closely by the
regulators.
a. Cable regulation
The regulation of the rates charged by cable companies is one of the major areas of
dispute between the industry and the government. Before 1984, the FCC believed
that it was not mandated to regulate cable, and therefore local franchising
authorities regulated the rates charged by franchisees. The 1984 Cable
Communications Policy Act76, which was designed to promote competition and
allow competitive market forces to determine rates, deregulated rates for almost all
franchisees. Industry representatives that had pushed for the deregulation had
argued that competition from satellite delivery systems and other new broadcasting
technologies would keep rates reasonable.
The Cable Act of 1984 had two main provisions that gave more leeway to cable
broadcasters. First, it removed the rate restrictions for basic cable TV service in
areas where operators faced “effective competition” from other media; and second,
it restricted the ability of local franchise authorities to deny renewals to firms when
their contracts expired.77
The FCC defined “effective competition” as the availability of three or more,
unduplicated, over‐the‐air television channels—for example, ABC, CBS and NBC—in
the cable system’s market area. Based on this definition, about 97 percent of all
90
cable systems were free from rate regulation by December 29, 1986, the effective
date of deregulation.
Not surprisingly, competition did not occur after deregulation, and average monthly
cable rates increased far faster than the rate of inflation (see Figure 1 on page 10.)
The other argument brought by the cable industry – that deregulation and
competition would bring more diversity in the cable and satellite offering – did not
prove compelling either. During the 1984‐1992 period, the average cable subscriber
received only six additional channels, and competition from other operators was
almost non‐existent. In 1991, only 53 of the more than 9,600 cable systems in the
United States had a direct competitor in their service area.
During that period of time, the number of cable companies offering more than one
tier of basic service increased sharply—from 17 percent to 41 percent.78 Typically,
cable companies began offering a basic package—just the major networks and one
or two distant channels—and an “expanded” tier than included the rest of the
commonly viewed cable channels, like CNN or ESPN. The change was a reaction to
proposed legislation in the early 1990s that would have reregulated only the lowest‐
priced tier of basic service. In fact, the final legislation that was passed and signed in
1992 did just that.
The 1992 Cable Act provided a new regulatory framework, authorizing local
governments to regulate programming, equipment, and service rates charged by
companies in areas where there is no competition. Basic rates could be regulated
but only under prescribed circumstances that indicate a lack of competition in the
91
area. According to figures gathered by the FCC in 1994, the new regulations led to
average rate reductions of more than eight percent. The 1992 Cable Act eliminated
many of the barriers to competition that existed before. Most important, it abolished
the exclusive franchise agreement, which had been a powerful monopolistic tool.
The 1996 Telecommunications Act signaled a return to the pre‐1992 act philosophy,
as the FCC was again directed to deregulate the cable television industry. The
industry, which lobbied hard for the changes, contended that deregulation would
produce more competition and lower prices. In addition, cable operators saw an
opportunity to move into the areas of broadband Internet service and local phone
service. This outcome is a perfect example of regulatory capture, as Stigler79
describes it. Indeed, in this case, cable companies have a strong interest in
deregulation and potential gains in market power. On the customer side, the
additional financial burden is spread among many consumers, hard to measure, and
differs from market to market, making a lobbyist counteraction unlikely.
b. Evidence of market power
What has happened in the past decade is fairly close to what critics to the 1996
Telecommunications Act feared: less competition, high prices, and the consolidation
of cable services into the hands of a few powerful companies. Today, the cable
industry is more concentrated than ever. The number of cable systems in the US has
been halved since 1996, and the 5 top companies are controlling more than 80% of
the market ‐ which totals 63.1 million customers (see Table below.) 80
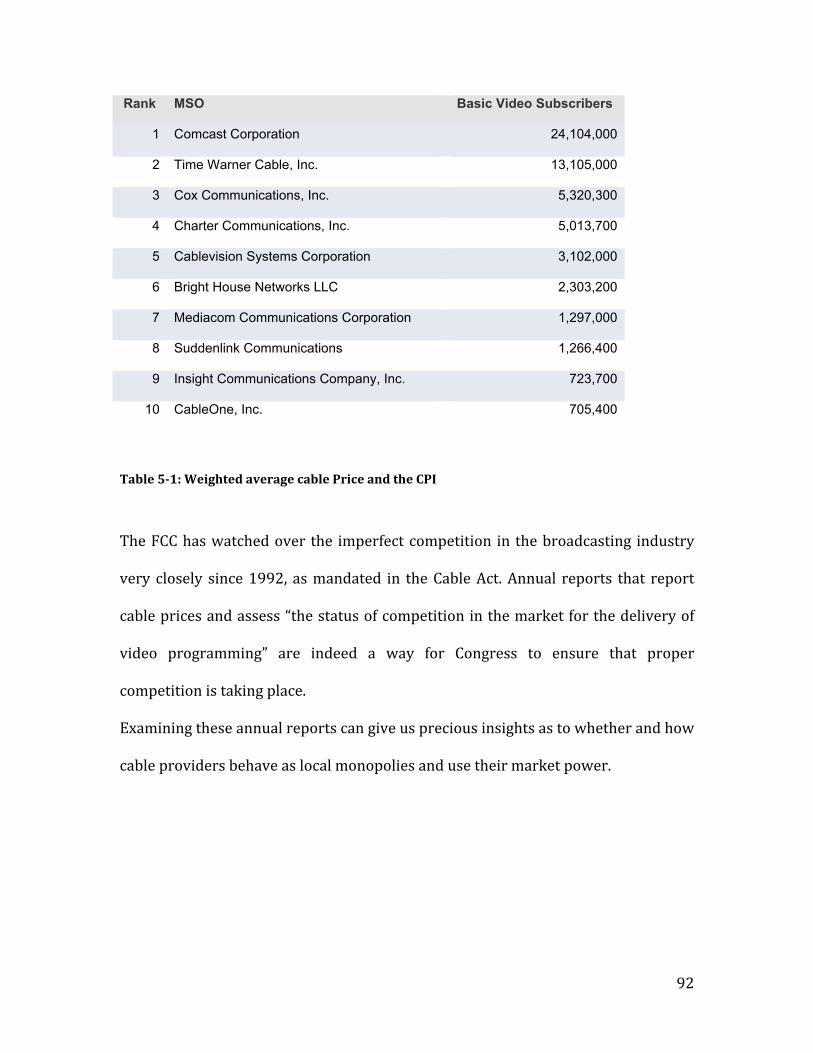
92
Rank MSO Basic Video Subscribers
1 Comcast Corporation 24,104,000
2 Time Warner Cable, Inc. 13,105,000
3 Cox Communications, Inc. 5,320,300
4 Charter Communications, Inc. 5,013,700
5 Cablevision Systems Corporation 3,102,000
6 Bright House Networks LLC 2,303,200
7 Mediacom Communications Corporation 1,297,000
8 Suddenlink Communications 1,266,400
9 Insight Communications Company, Inc. 723,700
10 CableOne, Inc. 705,400
Table 51: Weighted average cable Price and the CPI
The FCC has watched over the imperfect competition in the broadcasting industry
very closely since 1992, as mandated in the Cable Act. Annual reports that report
cable prices and assess “the status of competition in the market for the delivery of
video programming” are indeed a way for Congress to ensure that proper
competition is taking place.
Examining these annual reports can give us precious insights as to whether and how
cable providers behave as local monopolies and use their market power.

93
Figure 51: Weighted average cable Price and the CPI
The figure above presents the evolution of the subscription prices to cable.81 This
weighted average takes into account the fact that, nowadays, the majority of the
population subscribes to an upper tier of content, not necessarily the basic package.
In 13 years’ time, the price of cable subscriptions has increased by 163%, more than
four times the Customer Price Index (CPI in the figure). Of course, one could argue
that this increase in price came with better quality and variety of content, it shows
nonetheless a sign of market power by the cable providers, who are able to drive the
market toward more consumption and greater margins.

94
Figure 52: Weighted Average Cable Price by Basis for Finding Effective Competition
The figure above is another way to show that cable providers effectively benefit
from market power and use it, and defeats the assumption made by Congress in its
1996 Telecommunication Act that Digital Broadcast Satellite (DBS) and other
technologies would provide efficient competition to cable. Indeed, cable providers
charge about the same price in areas where there is no competition, and areas
where competition comes from alternative technologies such as DBS. However, in
markets where another cable operator competes, weighted average cable prices
drop suddenly by 10%. This phenomenon can partly be explained by the additional
costs incurred when subscribing to a satellite system, and the difference in offerings
between cable and DBS. This data suggests that technology itself is a differentiator,
and that one can find true competition only in markets where two cable companies
are competing against each other.
Even though there are no clear signs of monopolization from cable broadcasters,
barriers to entry are high, and the current legislation that aims at using competition

95
to let the market regulate itself seems to be failing. As we will see in the next section,
the issue of ever‐increasing prices is even worse in the context of Sports
broadcasting, as regulators have historically paid little attention to pricing and
offerings in upper tiers of content.
Of course, we cannot only blame monopoly power for the dramatic increase in cable
prices. In the next part of this paper, I will argue that content owners are partly
responsible for this price escalation. In particular, sports leagues have been
benefiting from particularly clement antitrust regulation and have secured a
monopoly position in their respective market that allow them to drive broadcasting
rights up.
III. The protection offered by the Sports Broadcasting Act is no longer adequate in today’s broadcasting landscape
In this part, I will show that the Sports Broadcasting Act of 1961 has created a
dramatic advantage for sports leagues, granting them market power in contracting
with broadcasters, and securing their position as natural monopolies in their
respective markets. While this piece of legislation was necessary fifty years ago to
protect the cultural legacy that sports leagues represent, it has created an imbalance
between broadcasters and the leagues, which own scarce and sought‐after content
that can be considered as a common good.

96
Like many other pieces of legislation, the history of the Sports Broadcasting Act
began in courts. In an effort to bring a greater quantity of televised football games
into the homes of Americans, the NFL tried to negotiate an exclusive television
contract with CBS. A federal court, however, ruled that this "exclusive" contract with
CBS violated the antitrust laws by effectively eliminating competition among the
member clubs of the NFL. Fearing for the financial future of the NFL and the
possibility of limited football on television, Congress quickly responded with the
Sports Broadcasting Act of 1961.82 The Sports Broadcasting Act essentially affords
professional sports leagues the status of a "single entity" and allows professional
baseball, football, basketball, and hockey to sell their pooled rights for "sponsored
telecasting" without being subject to antitrust violations. The passage of this Act has
proven extremely beneficial to the success of the major league sports. By allowing
the teams to pool their broadcasting rights and share revenues, Congress enabled
the professional sports leagues to expand and prosper. In effect, all the teams were
able to demand more money per broadcast. Teams in smaller markets were able to
receive shared revenues with teams in larger markets, which in some instances
assured the financial feasibility of struggling teams.
What was viewed as vital for sports leagues in 1961 has paved the way for the
development of the leagues’ market power, to the point where the protection that
was accorded to them more than four decades ago is so deeply anchored in the US
culture that it is being used as a bargaining tool by the leagues. One can then
question whether the Sports Broadcasting Act is still relevant nowadays, especially
97
when the technology allows the leagues themselves to create their own
broadcasting channels.
It is important to note, however, that the Sports Broadcasting Act expressly uses the
term "sponsored telecasting." To prevent siphoning of sports content out of free
over‐the‐air broadcasting, Congress specifically intended that the Act only apply to
"free telecasting of professional sports and does not cover subscription‐based
T.V."83 This did not seem to stop leagues to act the same way when dealing with
cable networks such as ESPN, for which cable broadcasters can charge more than $3
per month per viewer. In comparison, HBO charges less than a dollar per viewer per
month. In fact, many of the broadcasting deals that are contracted nowadays by
sports leagues are exclusive, and made only available on higher tiers of cable
content to attract customers to those “less regulated grounds” see previous part.)
NFL’s Monday Night Football, for example, has moved from ABC – where it has been
broadcasted for 36 years – to ESPN in 2005. There seems to be an enforcement issue
here, as Sports leagues are effectively acting as a monopoly and securing highly
valuable exclusive deals with several cable networks.
Evidence of market power
The evidence of the leagues’ increasing market power is everywhere. Sports content
produced by the four major American sports leagues is scarce, and the number of
potential broadcasters is increasing. Therefore, even though ratings are falling for
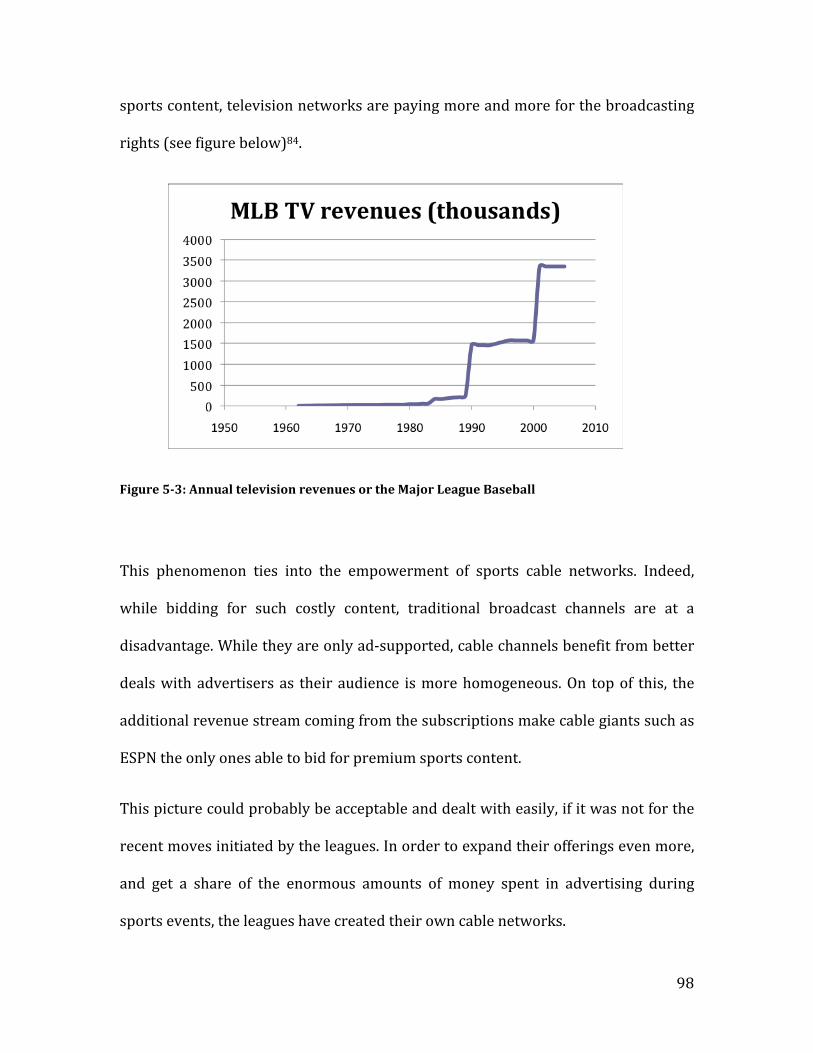
98
sports content, television networks are paying more and more for the broadcasting
rights (see figure below)84.
Figure 53: Annual television revenues or the Major League Baseball
This phenomenon ties into the empowerment of sports cable networks. Indeed,
while bidding for such costly content, traditional broadcast channels are at a
disadvantage. While they are only ad‐supported, cable channels benefit from better
deals with advertisers as their audience is more homogeneous. On top of this, the
additional revenue stream coming from the subscriptions make cable giants such as
ESPN the only ones able to bid for premium sports content.
This picture could probably be acceptable and dealt with easily, if it was not for the
recent moves initiated by the leagues. In order to expand their offerings even more,
and get a share of the enormous amounts of money spent in advertising during
sports events, the leagues have created their own cable networks.
99
The issue here is not that leagues are competing with cable networks. But a natural
monopoly that has been protected as such by the regulator is now trying to
vertically integrate, thus increasing pressure on the cable networks and
broadcasters. Indeed, the leagues are benefiting from a huge competing advantage:
their cable networks do not have any to pay for any broadcasting rights. This
pressure seems to be in turn transferred to the consumers, which contributes to
create what Senator McCain calls “an income test” for Sports viewing.
IV. The shift to IP‐based delivery systems is an opportunity to create new competition
Due to the low percentage of the population that watches television on the Web, and
the type of content that is mainly consumed online, Internet broadcasting has not
been regulated yet. The FCC seems to be more concerned about obscenity and
security nowadays, and to date the only major piece of legislation that deals with
online video content is the Digital Millennium Copyright Act (DMCA) of 1998.85
Yet, consumers’ behaviors are changing, and studies are showing that more and
more people are watching television online.86 While this phenomenon is only visible
in the younger generations, Internet broadcasting seems to offer the possibility of
place‐shifting and time‐shifting, both of which are valued highly by customers. Now
that the market for Internet broadcasting seems to grow, it is hard to predict which
dominant design will prevail. Are cable broadcasters going to retain their market

100
share thanks to the move to “TV everywhere” services? Will each league successfully
develop an online video service, effectively becoming its own broadcaster? Is
another player like ESPN going to come up with a compelling online video platform
for all sports?
The regulator will certainly welcome this technological shift as good news, since it
seems, for now, to be fostering competition and innovation. It is likely that after
several seasons of competition, a natural “winner” will take a predominant position
in the market. The regulator will play two different roles. First, during the
competition phase, it will have to look closely for anticompetitive behavior. Indeed,
what is at stake here is the multi‐billion dollar empire built by the major sports
leagues, currently served by equally powerful broadcasters. As congressional
debates remind us, they are a part of the American culture. Second, Congress will
have to produce adequate regulation to fill the legal loophole in which Sports
broadcasting resides now.
One can already identify some of the risks that could lead to vertical integration.
Each potential dominant design described in the last chapter raises its own set of
issues, and I will now briefly address these.
a. Broadcaster is king
“TV everywhere” and other services that aim at rebroadcasting content online while
securing traditional cable fees from subscribers would not change dramatically the
existing order. On the contrary, this strategy formulated by cable companies is
another step toward customer lock‐in, as end‐users would become reliant on one

101
operator for both their television and Internet service. While this kind of service
bundling has been allowed in the 1996 Telecommunications Act, we will argue that
the existing equilibrium in cable delivery markets is not desirable from a customer
point of view. Indeed, the same mechanics that result in regulatory capture today
would still be effective in that scenario.
In order to fight this outcome that would only increase the cable companies’ market
power, the regulator will have to redefine what “effective competition” is, going
further than what it did in the 1996 Telecommunications Act. This task will not be
easy to achieve, as the pool of services offered by broadcasters and the number of
devices on which those services will be received will most likely grow quickly.
However, we can point out here that as showed in part II, competition is much more
fierce between two firms providing the same technology (e.g. cable) than between
different technologies (e.g. cable and DBS). The regulator should therefore try to
promote competition inside given dominant technologies, rather than between
different ones.
Congress has already expressed its intention to make Internet an “open and
interconnected” place, where “consumers are entitled to competition among
network providers, application and service providers, and content providers.”87 The
regulator’s position, toward network neutrality and the free flow of data, will most
certainly discourage carriers from hampering competition by, for example, slowing
down traffic coming from MLB.TV, on the premises that those HD video feeds are
taking a lot of bandwidth.

102
b. Content is king
If the leagues go further down the path they have begun to explore by creating their
cable networks – and, in the case of the MLB, an online video platform; one might
see the major sports leagues becoming their own broadcaster, thus competing with
online and traditional cable and over‐the‐air broadcasters. The regulator should
look at this kind of vertical integration very closely, however. Indeed, sports leagues
are still benefiting from the protection of the Sports Broadcasting Act of 1961. While
denial of access from the content would be too obvious and severely sanctioned, it
would be tempting for the leagues, in order to reap more of the colossal advertising
dollars, to overprice their sports content in order to increase their revenue or rule
out competition from other broadcasters.
There are several different policy answers to this threat. First and foremost, the
regulator could choose to amend the Sports Broadcasting Act. Indeed the state of
sports broadcasting has changed since 1961, and sports content created by major
leagues is now seen by an increasing number of channels as valuable and scarce
content, and the fact that many different broadcasters are seeking grants the leagues
some market power already. However, this solution would only address partly the
issue of the leagues as their own broadcasters. By eliminating the regulatory failure,
we would only go back to the initial market failure of having leagues acting as
monopolies, and one can question whether the leagues’ competitive advantage
would really be reduced.
103
The second solution, that appears to be addressing competition more effectively,
would be to keep the Sports Broadcasting Act as it is today, but enforce a total
disintegration of the “content creation” and the “broadcasting” part for the MLB and
other leagues. In that case, leagues as content producers would still benefit from
some antitrust protection, while competition on the broadcasting side would be
fostered. This view is close to the solution that is offered by Kearney and Merrill.88
The issue of the leagues’ market power needs urgent attention. The Supreme Court
is currently reviewing the American needle vs. NFL case89, and has to decide whether
NFL (and by any extent, a sports league) should be only considered as a single entity
or not. This decision could have an enormous impact on broadcasting as well, as this
debated overlaps with the current protection offered by the Sports Broadcasting
Act.
Conclusion
It is an interesting time to look at the evolution of the regulation on Sports
broadcasting. With the advent of Internet, leagues, broadcasters and regulators are
at a critical point in broadcasting history. While regulation of Sports leagues and
cable broadcasting has not addressed adequately the issue of sports broadcasting,
letting market power and revenue skyrocket for both broadcasters and sports
leagues, a new order is about to be established. As Internet is believed to be the
broadcasting medium for the future, competition is entering this new, technology‐
104
driven area. While Internet broadcasting has not been extensively regulated yet, the
“effective competition” that is likely to be created seems to go along the lines of the
current broader legislation. However, because of the important position of the
players involved in Sports broadcasting over IP, namely, the sports leagues and the
historical cable carriers, the regulator will have to look for specific anticompetitive
behavior, and adapt the existing regulation that affects them if necessary.

105
Chapter 6. The System Dynamics Standard Method
I. Problem statement
In the first part of this thesis, we have described how the broadcasting of Sports via
the Internet Protocol could disrupt the existing value chain, as the case studies
showed us how cable television has already disrupted this industry in the 1970s,
and how other part of the larger entertainment and media industries have seen
dramatic changes with the empowerment of the user and the apparition of new
communication channels brought by the Web.
The general question, then, that is addressed in this thesis, is:
How would a shift toward Internetbased delivery systems influence the current
value chain for Sports broadcasting?
This question can be divided in three sub‐categories, which deal with the technical
issues, regulatory needs, and business model changes that Sports over IP cause –
which have been explored separate chapters in the second part of this thesis.
To address this question and provide insights and policy recommendations, a
system dynamics model has been built. In this chapter, we will first justify why the
use of system dynamics is adequate in addressing the problem stated above, and we
will then give a rapid overview of the standard method used to build the model. The
next chapter will present the model for Sports over IP in further details, and the last

106
chapter of the thesis will bring forward insights and policy recommendations that
emanate from this work.
II. Justification of the use of System Dynamics
System Dynamics is the tool of choice to complete the study that has been initiated
in the second part of this thesis for three main reasons.
a. The Sports over IP issue is essentially transdisciplinary
As shown by the second part of the thesis, any player in the sports broadcasting
value chain has to deal with several classes of problems at once, that cannot be
easily dissociated: the technical issues raised by an increase in online video demand,
the business issues related to profit models for various members of the sports value
chain, and the regulatory issues in the sports broadcasting field. In any case, the
technical, business and regulatory levels are intertwined in the Sports broadcasting
industry. Literature is abundant in each of these three separated fields. Yet, different
tools and languages are often used to deal with technical, regulatory or economic
issues. System Dynamics allows us to use a common language to treat these three
classes of issues together.
107
b. Feedback loops are prevalent in the problem
The second part of this thesis has exhibited an important interplay between the
incumbents of the Sports broadcasting industry, and the new “entrants”, which are
already part of the value chain. Therefore, a decision of any of these players will
necessarily have consequences on their direct competitors, but also indirectly on
other parts of the value chain, creating in turn feedback effects for those who made
the decision. On a broader scale, the market for sports production itself is rich in
self‐reinforcing and balancing dynamics, as exhibited in chapter 1.
Therefore, this complex system could give birth to what Sterman calls “policy
resistance”90 effects, and makes System Dynamics a tool of choice to address
potential issues that could arise from it.
c. Behavioral factors are inherently part of the model
Whether considering customer adoption of a new technology, competitive behavior
in a constrained environment (where players may not act “rationally”), or policy
decisions by a government entity, any model looking at Sports over IP will contain
numerous behavioral factors. The effects of these factors are hard to foresee and
often impossible to measure or predict with any precision. In any case, System
Dynamics enables consideration of such effects through the use of sensitivity
analysis and/or reality checks. And even if the hypotheses made on these behavioral

108
factors are arguable or even prove to be wrong, the insights gained while building
the model can still be valuable.
III. The System Dynamics Standard Method
The “standard method” is a widespread technique used to define a problem and
create a model, while gaining useful insights along the way. In this part, we will
describe the standard method. However, as this method is widely used, most of the
content of this part will be heavily inspired from previous work.91 92 This standard
method will then be applied in the next chapter to show the steps that led to the
creation of the Sports over IP System Dynamic model.
The Standard method is divided into several steps:93
1. Problem articulation
The theme of the problem is formulated; the key variables and concepts are
identified. System dynamics experts believe that focusing on five or six variables can
capture behavior in many of the complex systems we encounter.
2. Formulation of Reference modes
Reference modes are sets of graph showing the development of a problem over
time, which help characterizing the problem dynamically. A good example of a
109
simple reference mode is the exponential growth that the major league players’
salary has known since the 1970s. This salary could follow the same trend in the
future, plateau up after a certain threshold, oscillate or even decrease over the effect
of negative feedbacks or new policies. Thinking about those dynamics help narrow
down the problem and track dynamics affecting a variable.
3. Formulation of Dynamic Hypotheses and creation of causal loop diagrams
Dynamic hypotheses are sets of assumptions regarding how the problem studied
arose. Some causes of the problem will be exogenous to the model (a good example
in our case is the Sports Broadcasting Act of 1961, that triggered a reinforcing loop
driving the broadcasting rights of Sports up) while other will be captured in the
model. From these dynamic hypotheses, a causal loop diagram capturing the main
dynamics of the system will emerge.
4. Formulation of a Simulation model
A simulation model is then produced from the causal loop diagram. Links between
variables are broken down until each one can be modeled by a mathematic function
or a simple arithmetic description Stocks and flows are introduced. This process is
iterative and requires heavy communication with experts in the field to validate
both the mechanics and the underlying equations.
110
5. Testing
The model is then compared to reference modes, historical data. The boundaries of
each variable are tested, and the sensitivity of the whole system to uncertain
parameters is checked.
6. Policy design and Evaluation
While the first five steps of this method can yield useful insights, the policy design
and evaluation step aims at using the model to evaluate new rules, strategies and
structures that could be tried in the real world, point at synergies or compensatory
responses in those policies. A sensitivity analysis can also inform on how robust the
policy recommendations are under different scenarios or given uncertainties.
111
Chapter 7. System Dynamics model for Sports over IP
In this chapter, we will present the model that was built using the standard method
presented in the last chapter. First, the hypotheses made and the boundaries of the
model will be presented and justified. Then, we will focus on four important loops of
the model that play critical roles in the dynamics of the sports market and the
adoption of the Web TV technology. The construction of these loops will provide
some insights that will be presented along with the insights gained from the results
in chapter 8. The complete description of the model can be found in the appendix.
I. Boundaries of the model
For the sake of clarity and simplicity, the system dynamics model has been designed
to represent one specific implementation of Sports over IP: it models the
competition between the current offering of Baseball on cable and satellite
broadcast television, described as the classical value chain for sports broadcasting
in chapter 4 and representing the incumbent, and the Web TV service MLB.TV
presented in the first chapter of this thesis, representing the entrant. This
formulation of the model is a simplification over the three main disruptive
architectures identified in chapter 4. While the piracy threat is acknowledged and
taken into account separately, the “TV everywhere” service to be offered by
producers and carriers has not been separated from the existing cable and satellite
offering in the model. This is because in its current form, TV everywhere requires

112
customers to be subscribers of a cable or satellite package; and therefore the
competition seems not to take place between MLB.TV and a Web TV service
produced by legacy cable broadcasters, but rather between MLB.TV and the existing
cable package itself.
There are other limits to using this specific example for the model, rather than a
more generic formulation: by using specifically the rules formulated by the MLB,
and its specific value chain for sports broadcasting, the model loses a it of its
generality; we believe however that the mechanisms described here are general
enough so that they can be transposed to other sports leagues. Looking at the scale
of a league rather than at a national scale also rules out a certain class of scenarios
where content would be aggregated across several sports leagues (in the fashion of
what ESPN currently does.) For now, experience has shown that early examples of
Web TV sports services are often limited to one league at a time – at least besides TV
everywhere packages. Finally, the model makes little distinction between legacy
carriers and producers: both of them are a central part of the incumbent value
chain, but both feedback effects affect them equally – this may not be true in the real
life, as those players have different roles in the value chain, as described in Chapter
4.
However, there are also clear benefits of narrowing down the model to Major
League Baseball. First, focusing the model on one specific league and one specific
example of Web TV service allows for an easier description of the system and the
equations ruling it. Second, it allows us to use historical data (ticket prices, player
113
salaries, broadcasting rights over the years…), available at the level of the league, to
validate the descriptions of the model and calibrate parameters. Finally, this more
specific and fine‐grained description allows us to see more closely the impact of new
regulations or shocks of any sorts.
In the first two parts of this thesis, we noted that early users saw MLB.TV more as a
complement to the current cable offering than as a real competitor. While this may
remain the dominant use for now, as many of these early adopters are willing to pay
for both services, MLB.TV is most likely to become a true competitor to the current
cable offering and the “TV everywhere” model when this stand‐alone service
reaches the masses. As our model looks at a 15‐20 years prospective time frame,
those services have been considered as substitutes rather than complements in the
model.
As historical data was available for most of the variables in the first view (see TV
rights escalation loop and Cable success loop above), earlier versions of the model
(i.e. without implementing any of the Web TV loops) were used to fit historical data
over the 1970‐2005 period and calibrate the model.
The model simulations run from 2005 (three years after the apparition of MLB.TV)
to 2025. As it took roughly 20 years for the cable broadcasting technology to reach
high penetration, the same duration was taken for the model. A shorter time span
would not have allowed us to see significant changes, and letting the model run for
50 years seems to distant, as most hypotheses that have been made would not likely
hold for such a long period.

114
II. Presentation of the key loops
The model, presented in appendix, is divided in two parts – or “views.” The first
view deals with supply and demand for video services and live games. Its purpose is
to model the upper half of the legacy sports broadcasting value chain as well as the
“live sports viewing” value chain. This first view also provides inputs to the second
view that looks more closely at the competition among cable and satellite TV, Web
TV, and a potential piracy threat. This view provides most of the outcomes of the
model. As such, the first two loops that will be presented in this part – TV rights and
cable success – have been extracted from the first view, while the last two loops –
Web TV adoption and piracy control – come from the second view.
a. TV rights escalation loop
Dynamic hypothesis: The initial shocks that created the escalation of players
salaries, and consequently the rapid increase in ticket prices and television
broadcasting rights, are exogenous to the model and have been caused by singular
events such as the increase in player value in the 1960s and the Sports Broadcasting
Act of 1961.
Reference modes: Historical data shows an exponential growth for average players
salaries in the MLB and the overall league revenues, that come from gate sales and
broadcasting rights – this observation takes inflation into account. The dynamic
could stay unchanged for the next 20 years. However, due to the emergence of new

115
business models associated with the broadcasting of Sports, there could be some
goal erosion in this loop that would make the reinforcing dynamic plateau off.
Except from the players’ point of view, this would be the most desirable outcome.
Figure 71: Reference modes for Television rights
As league revenues increase from ticket sales and broadcasting rights revenues, the
players are able to exert their market power on the teams to get most of the revenue
increase into the payroll. This sets a new standard for player salaries for the season,
that the leagues need to take into account in their balance sheet, by increasing their
average ticket price and their reservation price to sell broadcasting rights to cable
networks.
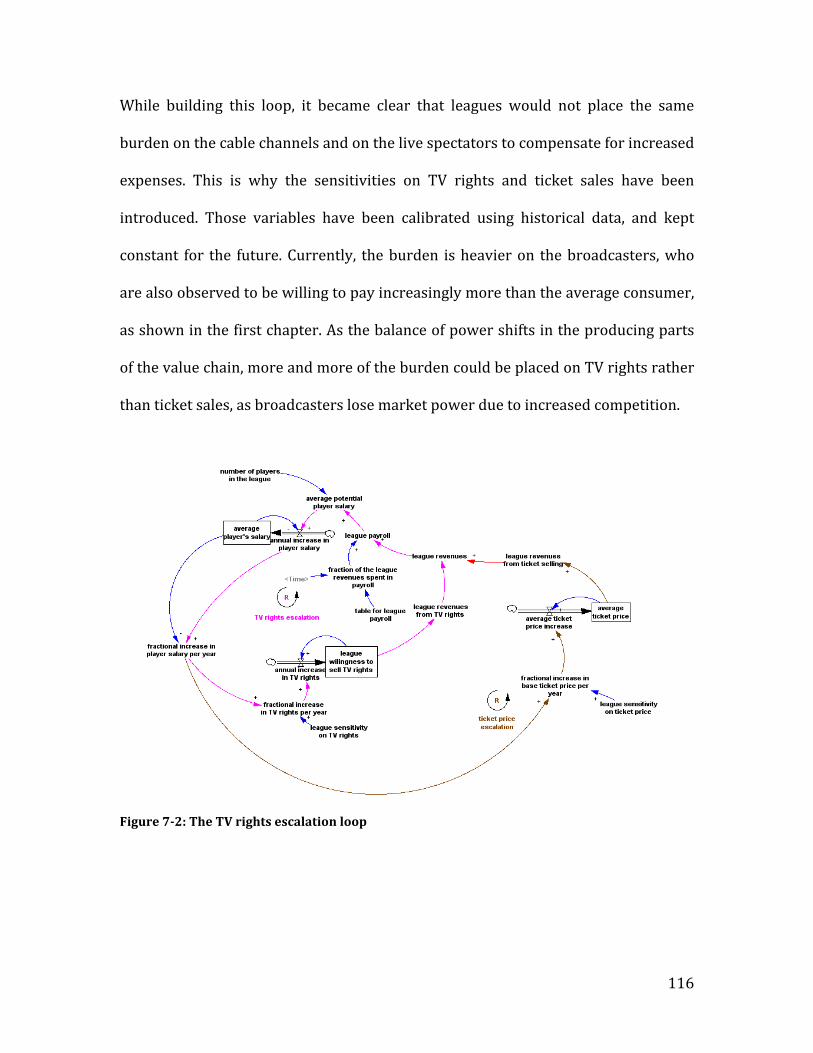
116
While building this loop, it became clear that leagues would not place the same
burden on the cable channels and on the live spectators to compensate for increased
expenses. This is why the sensitivities on TV rights and ticket sales have been
introduced. Those variables have been calibrated using historical data, and kept
constant for the future. Currently, the burden is heavier on the broadcasters, who
are also observed to be willing to pay increasingly more than the average consumer,
as shown in the first chapter. As the balance of power shifts in the producing parts
of the value chain, more and more of the burden could be placed on TV rights rather
than ticket sales, as broadcasters lose market power due to increased competition.
Figure 72: The TV rights escalation loop
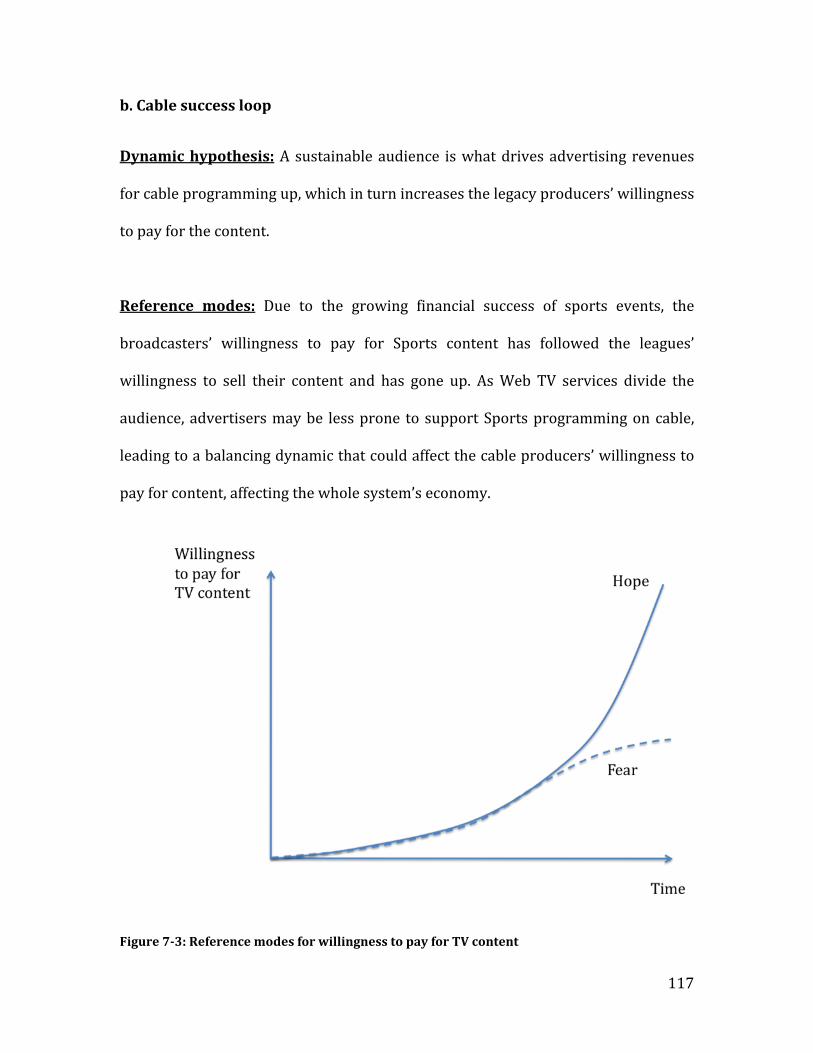
117
b. Cable success loop
Dynamic hypothesis: A sustainable audience is what drives advertising revenues
for cable programming up, which in turn increases the legacy producers’ willingness
to pay for the content.
Reference modes: Due to the growing financial success of sports events, the
broadcasters’ willingness to pay for Sports content has followed the leagues’
willingness to sell their content and has gone up. As Web TV services divide the
audience, advertisers may be less prone to support Sports programming on cable,
leading to a balancing dynamic that could affect the cable producers’ willingness to
pay for content, affecting the whole system’s economy.
Figure 73: Reference modes for willingness to pay for TV content
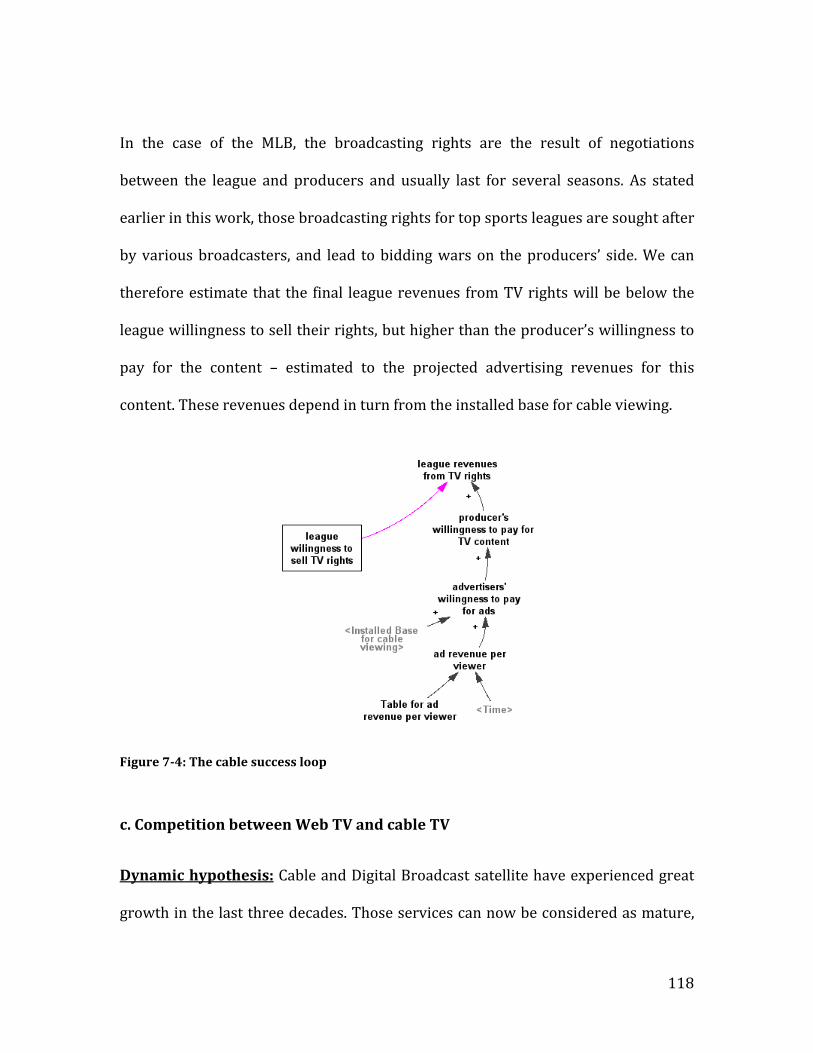
118
In the case of the MLB, the broadcasting rights are the result of negotiations
between the league and producers and usually last for several seasons. As stated
earlier in this work, those broadcasting rights for top sports leagues are sought after
by various broadcasters, and lead to bidding wars on the producers’ side. We can
therefore estimate that the final league revenues from TV rights will be below the
league willingness to sell their rights, but higher than the producer’s willingness to
pay for the content – estimated to the projected advertising revenues for this
content. These revenues depend in turn from the installed base for cable viewing.
Figure 74: The cable success loop
c. Competition between Web TV and cable TV
Dynamic hypothesis: Cable and Digital Broadcast satellite have experienced great
growth in the last three decades. Those services can now be considered as mature,
119
especially when looking at the upcoming new entrant, Web TV services. As such, the
attractiveness of cable television services is not going to change as much as the
attractiveness of Web TV services, whose price and quality are likely to change
much more in comparison.
Reference modes: Web TV services such as MLB.TV have experienced growth in
the past few years. Depending on the level of attractiveness that this service will be
able to attain, and the level of attractiveness that legacy services (here, only cable
and broadcast satellite) will be able to maintain, the amplitude and speed of this
growth will vary.
What constitutes a desirable or undesirable scenario here greatly depends on the
point of view that is adopted: while the hoped‐for outcome is clear for advocates of
Web TV and cable TV, the position that the regulator should take is less clear: both
Web TV and cable TV services are desirable, as the former service drives innovation
and, while the latter has been investing heavily in the much needed delivery
infrastructure. Fair competition between those services, then, seems to be a
desirable goal for the regulator.
In this example, we took the point of view of Web TV advocates.

120
Figure 75: Reference modes for Web TV market share
The competition model used for this model is inspired from a classical structure of
product adoption.94 New customers or customers that decided to renew their
subscription or switch for another product will then adopt either Web TV or cable
and satellite TV, based on the relative attractiveness of each product. Attractiveness
has been set as a multiplicative function of what has been identified as the three
main criteria of choice for consumers:
‐ Price
‐ Quality of content
‐ Variety of the content
There are several limits to this way of modeling: a consumer’s choice is indeed
driven by more than these three factors, and switching costs were not taken into
121
account here. But this simple representation allows us to capture the main dynamics
for product adoption more transparently; which will be most important for the next
part of the work.
In order to be able to compare both services on those three criteria, the variables
mentioned above have been normalized and made dimensionless, always greater
than zero and smaller than one. Their values are a function of the size of respective
installed customer bases for cable and satellite TV and Web TV, thus creating
reinforcing or balancing effects on each product’s adoption.
To emphasize the fact that cable and satellite TV represent the incumbent, and
MLB.TV the entrant, the attractiveness of cable and satellite TV is set initially higher
than the attractiveness of Web TV. However, a variable called “Internet innovation”
has been introduced in the model, in order to account for the greater potential of the
Web TV technology. The specifics of the advantage that Web TV has over Cable TV
can be found in the full description of the model, and are building on the analysis
done in Chapter 4, part II.

122
Figure 76: The design for competition between cable TV and Web TV
d. Piracy control loop
Dynamic hypothesis: The use of the Internet as a broadcasting channel has allowed
for the un‐authorized rebroadcasting of many cable sports networks and Web TV
services. This is a new, exogenous threat in an industry that was mostly protected
from piracy in the past. As such, users that are familiar enough with the Web TV
technology could choose to stop subscribing to sports broadcasting services and
only watch pirated content. Piracy control tools will be sought to counter the threat
of unauthorized rebroadcasting and consumption.
Reference modes: The hope is that piracy control tools will be potent enough and
come quickly enough that new ways of pirating Sports content could be dealt with
easily, without the pirate user base becoming too important. However, if producers
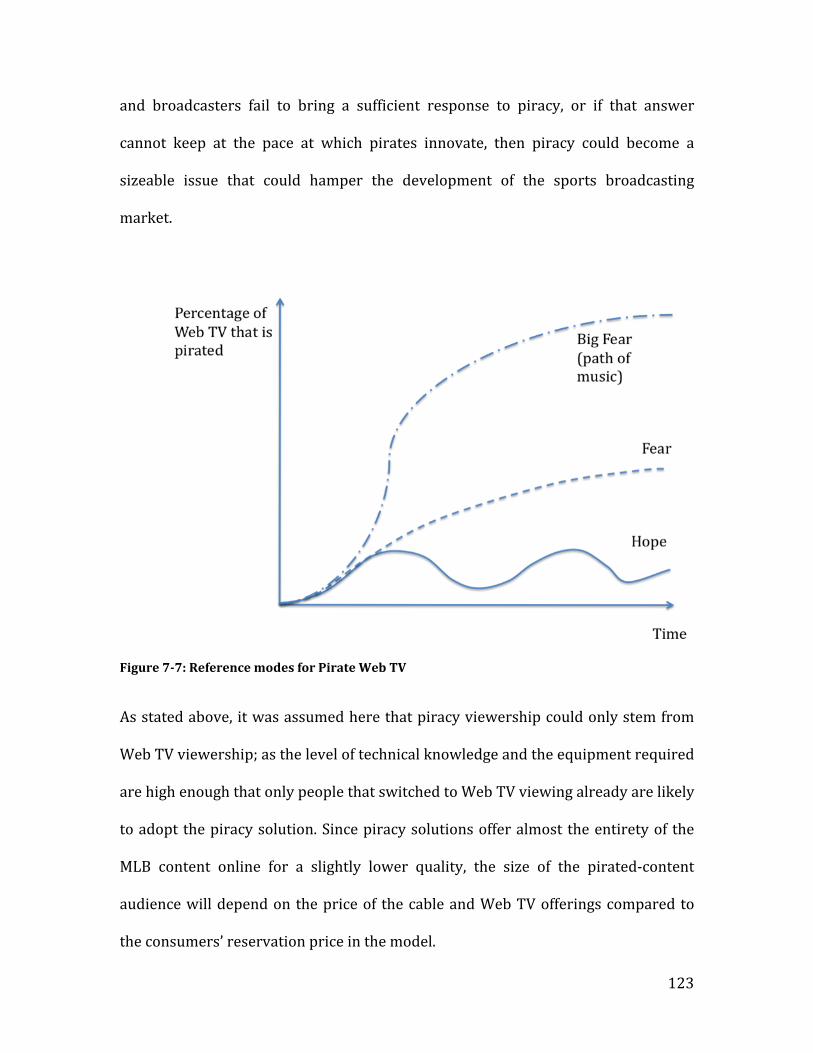
123
and broadcasters fail to bring a sufficient response to piracy, or if that answer
cannot keep at the pace at which pirates innovate, then piracy could become a
sizeable issue that could hamper the development of the sports broadcasting
market.
Figure 77: Reference modes for Pirate Web TV
As stated above, it was assumed here that piracy viewership could only stem from
Web TV viewership; as the level of technical knowledge and the equipment required
are high enough that only people that switched to Web TV viewing already are likely
to adopt the piracy solution. Since piracy solutions offer almost the entirety of the
MLB content online for a slightly lower quality, the size of the pirated‐content
audience will depend on the price of the cable and Web TV offerings compared to
the consumers’ reservation price in the model.
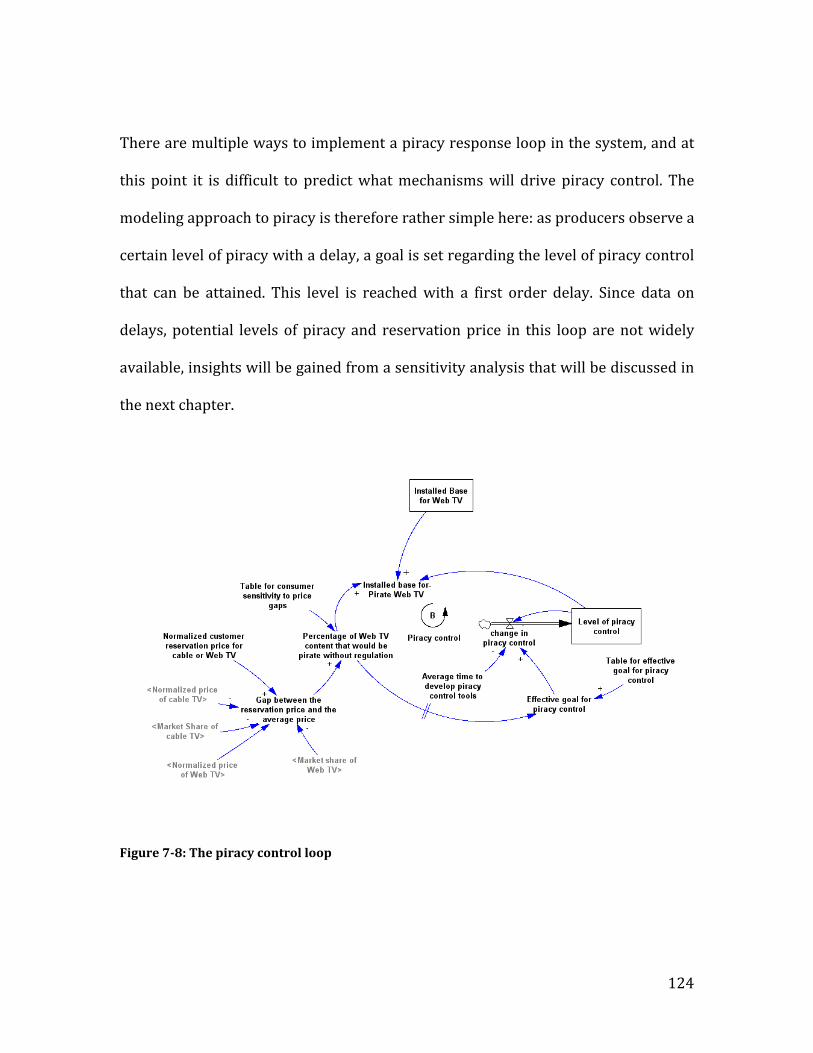
124
There are multiple ways to implement a piracy response loop in the system, and at
this point it is difficult to predict what mechanisms will drive piracy control. The
modeling approach to piracy is therefore rather simple here: as producers observe a
certain level of piracy with a delay, a goal is set regarding the level of piracy control
that can be attained. This level is reached with a first order delay. Since data on
delays, potential levels of piracy and reservation price in this loop are not widely
available, insights will be gained from a sensitivity analysis that will be discussed in
the next chapter.
Figure 78: The piracy control loop

125
III. Full System Dynamics Model
Figure 79: Full sports market view

126
Figure 710: Full dynamics of product adoption view
127
Chapter 8. System Dynamics findings and policy recommendations Overall, this study has shown that the shift toward Web‐based sports broadcasting
will likely transform the existing value chain, creating opportunities for new
entrants as well as redefining the roles of the producer and carrier. In this chapter,
we will use the System Dynamics model to get general insights on how the sports
broadcasting value chain could be transformed, to then generate policy
recommendation addressed to existing players of the sports broadcasting value
chain, as well as policymakers that regulate in the area of Sports, broadcasting and
the Internet.
I. System Dynamics Findings
As stated in various stages of the thesis, insights are drawn from two sources. First,
from the modeling process and the formulation of a “base scenario” for the System
Dynamics model. Second, from various sensitivity analyses that are performed on
parameters which values are uncertain or could change due to shifts in policy.
a. Insights from the base case scenario
To fully understand these insights, that come from the modeling process and the
design choices associated with the formulation of a plausible base case, it is
absolutely crucial to refer to the full version of the model presented in appendix.
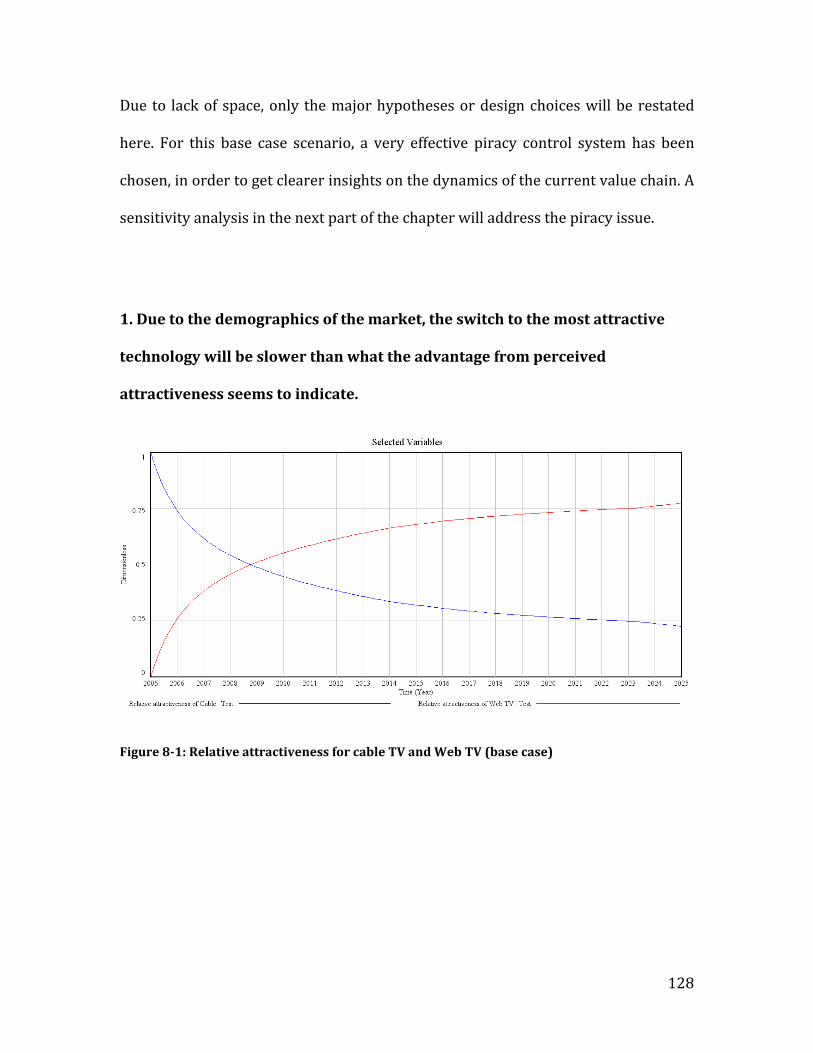
128
Due to lack of space, only the major hypotheses or design choices will be restated
here. For this base case scenario, a very effective piracy control system has been
chosen, in order to get clearer insights on the dynamics of the current value chain. A
sensitivity analysis in the next part of the chapter will address the piracy issue.
1. Due to the demographics of the market, the switch to the most attractive
technology will be slower than what the advantage from perceived
attractiveness seems to indicate.
Figure 81: Relative attractiveness for cable TV and Web TV (base case)
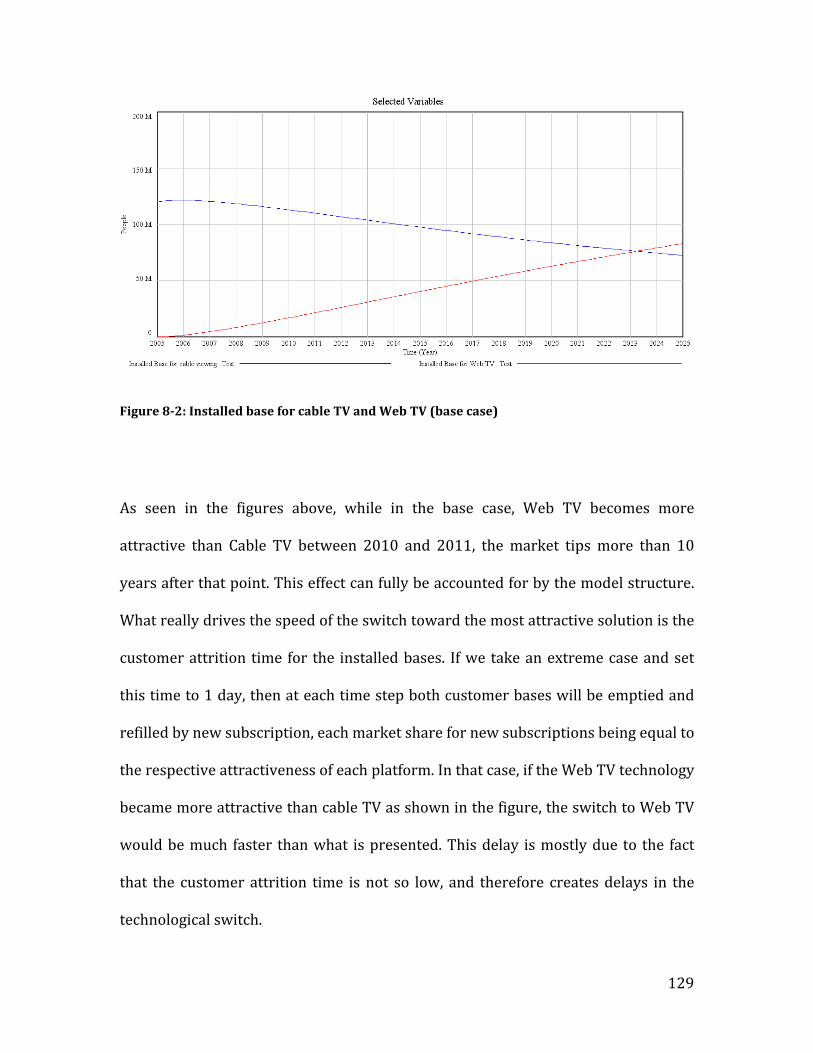
129
Figure 82: Installed base for cable TV and Web TV (base case)
As seen in the figures above, while in the base case, Web TV becomes more
attractive than Cable TV between 2010 and 2011, the market tips more than 10
years after that point. This effect can fully be accounted for by the model structure.
What really drives the speed of the switch toward the most attractive solution is the
customer attrition time for the installed bases. If we take an extreme case and set
this time to 1 day, then at each time step both customer bases will be emptied and
refilled by new subscription, each market share for new subscriptions being equal to
the respective attractiveness of each platform. In that case, if the Web TV technology
became more attractive than cable TV as shown in the figure, the switch to Web TV
would be much faster than what is presented. This delay is mostly due to the fact
that the customer attrition time is not so low, and therefore creates delays in the
technological switch.

130
It is then worth questioning what a good value, or a good value range would be for
that customer attrition time. This variable accounts for two effects. First, the change
in minds of the existing users – who ask themselves if they want to change their
existing subscription from time to time – but also, and more importantly, this
variable accounts for the new generations of users that are replacing the older ones.
Those new users, which are more tech‐savvy, are usually considered as early
adopters of new technologies, and therefore an important driver to change.
In the base case, a customer attrition time of 15 has been chosen – as this time is
believed to be comprised between 5 and 20 years. Those 15 years basically
represent the time that it takes for the next tech‐savvy generation to introduce the
new technology in the mass market – by using the new product themselves and
influencing the trends as lead users. 95 This time is observed to be much longer in
the case of television than what it was in the case of music, as sports broadcasting
reaches a audience that is on average older than music.
2. Whether it disrupts the value chain for sports broadcasting or not, the
switch to Sports over IP should not hurt the sports leagues too much, as long
as piracy remains low.

131
Figure 83: Total league revenues and its components (base case)
This insight, again, results from the basic structure of the model. As stated in the
first chapter of this thesis, part of what made cable so successful was its dual
revenue stream, compared to the sole dependency of legacy broadcasters to
advertisers.
Similarly, the MLB, in the model, has three different revenue streams. Furthermore,
two of these three streams – revenue from cable broadcasting and revenue from
Web broadcasting – come from substitutes, while the third one – ticket revenues – is
a function of the fan base, which has been found as consistent. This way, in the
current model for MLB, the sports league is always ensured to have at least two
strong revenue streams among the three. This revenue structure, combined with the
fact that the content owners are the only links in the value chain that are not being
endangered, reveals us that leagues are in a comfortable spot. This could play an
important role in the entry of the league as a broadcaster and producer, as this
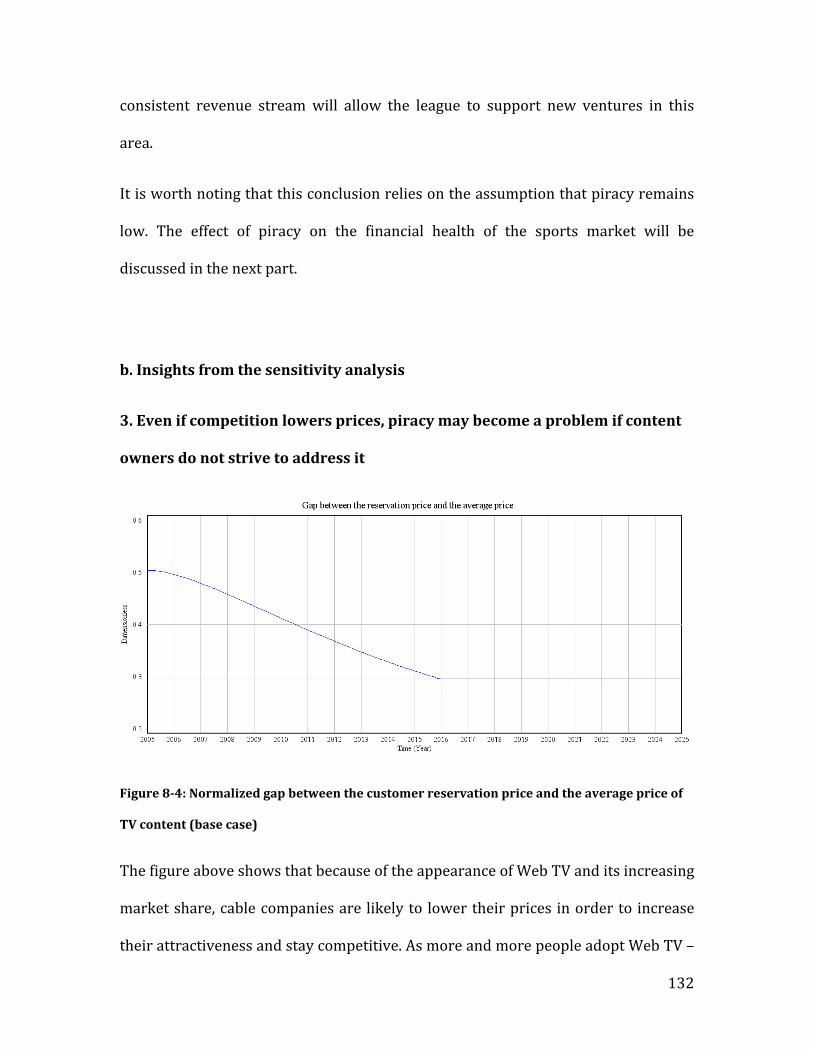
132
consistent revenue stream will allow the league to support new ventures in this
area.
It is worth noting that this conclusion relies on the assumption that piracy remains
low. The effect of piracy on the financial health of the sports market will be
discussed in the next part.
b. Insights from the sensitivity analysis
3. Even if competition lowers prices, piracy may become a problem if content
owners do not strive to address it
Figure 84: Normalized gap between the customer reservation price and the average price of
TV content (base case)
The figure above shows that because of the appearance of Web TV and its increasing
market share, cable companies are likely to lower their prices in order to increase
their attractiveness and stay competitive. As more and more people adopt Web TV –
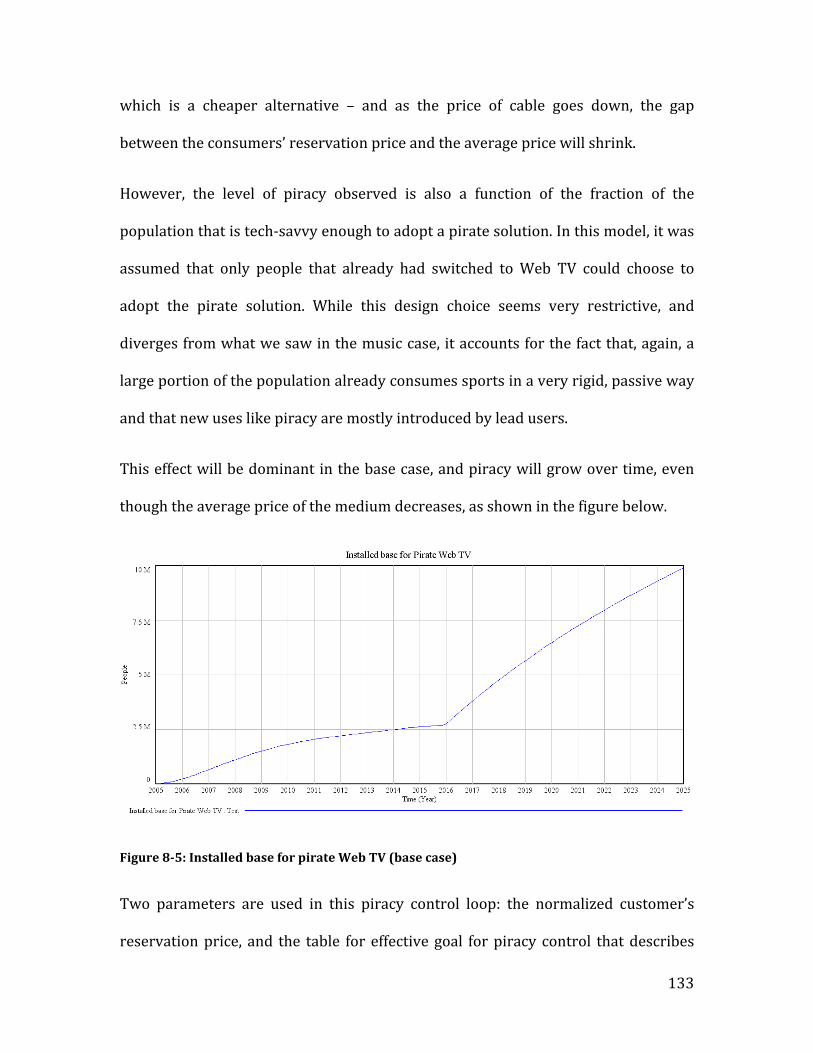
133
which is a cheaper alternative – and as the price of cable goes down, the gap
between the consumers’ reservation price and the average price will shrink.
However, the level of piracy observed is also a function of the fraction of the
population that is tech‐savvy enough to adopt a pirate solution. In this model, it was
assumed that only people that already had switched to Web TV could choose to
adopt the pirate solution. While this design choice seems very restrictive, and
diverges from what we saw in the music case, it accounts for the fact that, again, a
large portion of the population already consumes sports in a very rigid, passive way
and that new uses like piracy are mostly introduced by lead users.
This effect will be dominant in the base case, and piracy will grow over time, even
though the average price of the medium decreases, as shown in the figure below.
Figure 85: Installed base for pirate Web TV (base case)
Two parameters are used in this piracy control loop: the normalized customer’s
reservation price, and the table for effective goal for piracy control that describes

134
how content owners will respond to different levels of piracy. Since public data for
these parameters is not available, they come from mental models and have been
calibrated for the base case after interviews. However, since there is great
uncertainty about those “states of the world”, it is important to conduct sensitivity
analyses to understand how misestimating these parameters could change the
behavior of the system.
As shown elsewhere96 in the System Dynamics literature, incumbents often respond
to threats (e.g. new entrants, or in our case, piracy) in a different manner, depending
on what the level of this threat is. Low levels of threat that represent a small share of
the market will be underestimated; and the incumbent will only start devoting
adequate resources to counter the threat when it is significant enough to be able to
take a large share of the market. The table below shows the implementation of the
table for effective goal for piracy control in the base case, and uses this observation:
if the piracy threat is low, low levels of resources will be used, and high levels of
resources will be used only when the piracy threat gets closer to 100%.
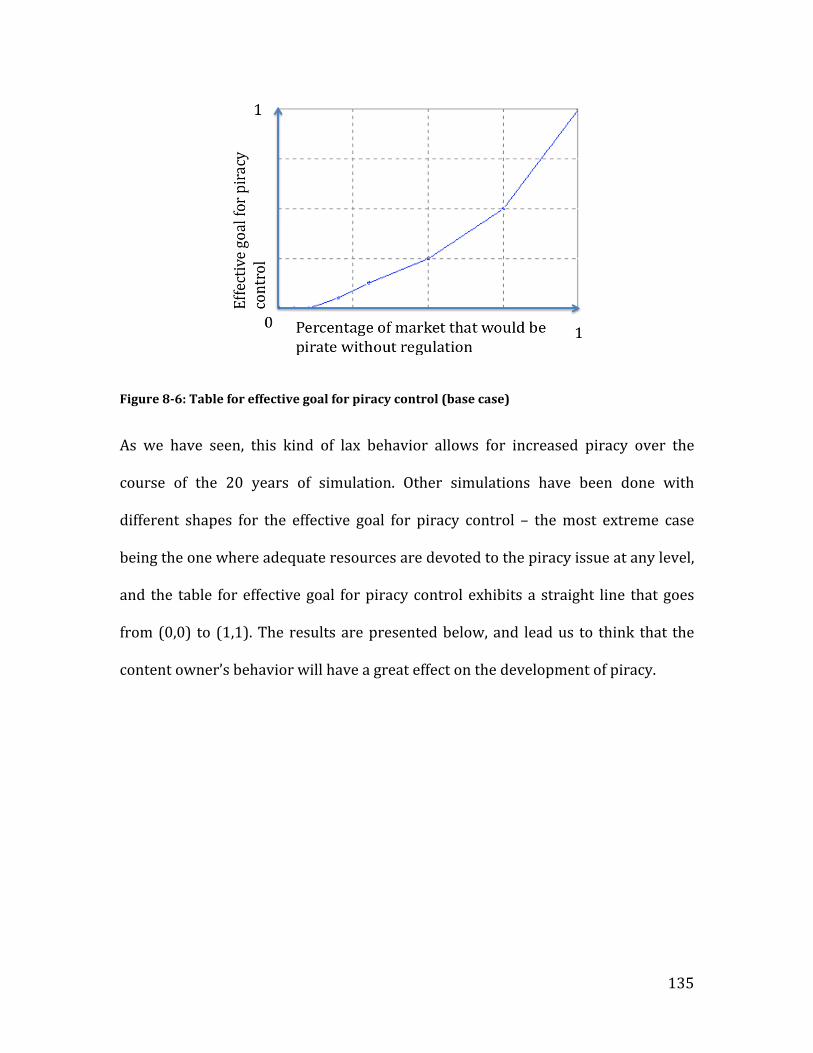
135
Figure 86: Table for effective goal for piracy control (base case)
As we have seen, this kind of lax behavior allows for increased piracy over the
course of the 20 years of simulation. Other simulations have been done with
different shapes for the effective goal for piracy control – the most extreme case
being the one where adequate resources are devoted to the piracy issue at any level,
and the table for effective goal for piracy control exhibits a straight line that goes
from (0,0) to (1,1). The results are presented below, and lead us to think that the
content owner’s behavior will have a great effect on the development of piracy.
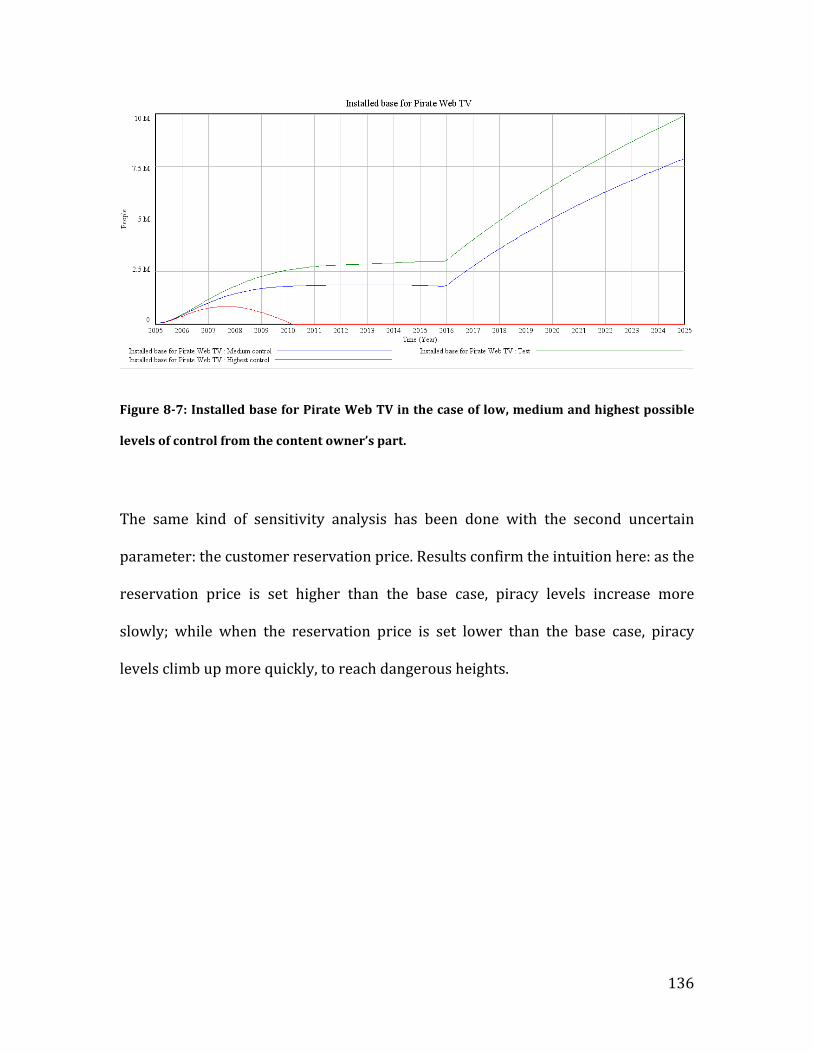
136
Figure 87: Installed base for Pirate Web TV in the case of low, medium and highest possible
levels of control from the content owner’s part.
The same kind of sensitivity analysis has been done with the second uncertain
parameter: the customer reservation price. Results confirm the intuition here: as the
reservation price is set higher than the base case, piracy levels increase more
slowly; while when the reservation price is set lower than the base case, piracy
levels climb up more quickly, to reach dangerous heights.
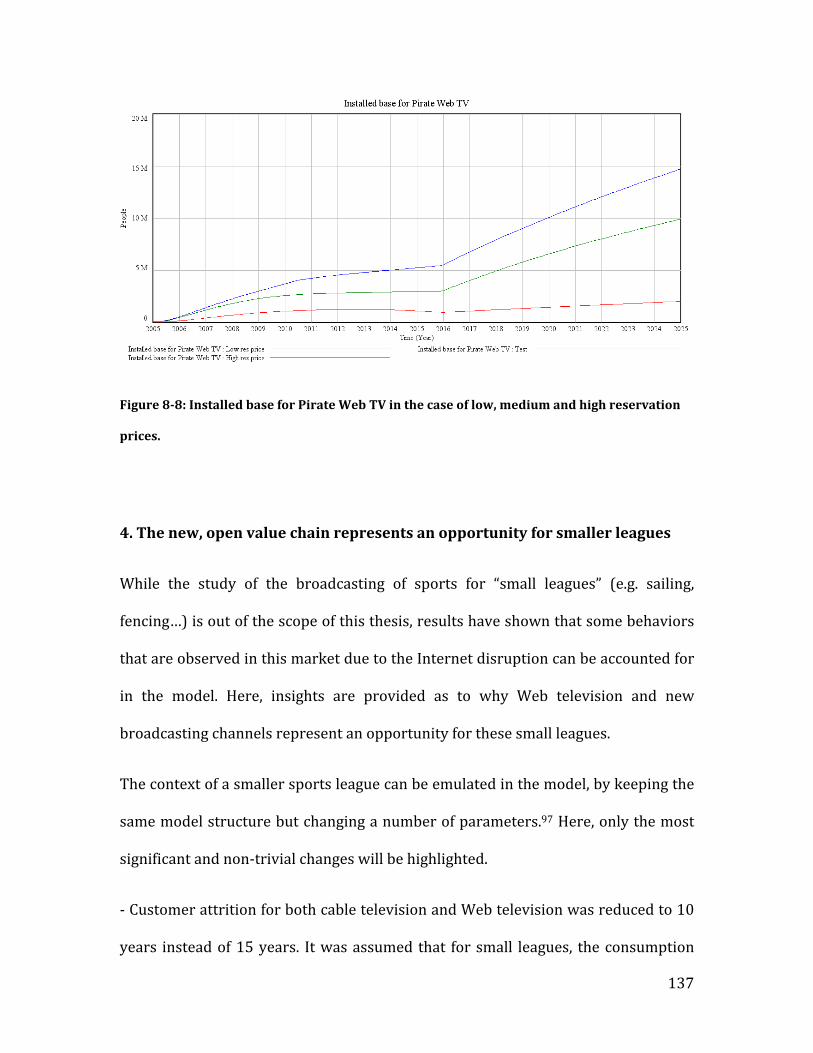
137
Figure 88: Installed base for Pirate Web TV in the case of low, medium and high reservation
prices.
4. The new, open value chain represents an opportunity for smaller leagues
While the study of the broadcasting of sports for “small leagues” (e.g. sailing,
fencing…) is out of the scope of this thesis, results have shown that some behaviors
that are observed in this market due to the Internet disruption can be accounted for
in the model. Here, insights are provided as to why Web television and new
broadcasting channels represent an opportunity for these small leagues.
The context of a smaller sports league can be emulated in the model, by keeping the
same model structure but changing a number of parameters.97 Here, only the most
significant and non‐trivial changes will be highlighted.
‐ Customer attrition for both cable television and Web television was reduced to 10
years instead of 15 years. It was assumed that for small leagues, the consumption
138
models of broadcasted sports were more proactive: as a result of the dominance of
big leagues in the cable broadcasting world, media coverage of sports events in
these leagues is only partial and scattered. As a consequence, customers would be
more easily and quickly aware of new media that would broadcast the content that
they seek. One of the most visible effects of this change is an increase in the speed of
the shift toward Web TV.
‐ The initial variety of content on cable TV was set to half the value it had for big
leagues. This change reflects the fact that because there are a limited number cable
sports network, and an increasing number of hours of sports broadcasted by the big
leagues, there is little broadcasting space left for smaller leagues, thus making the
amount of content available on small leagues compared to what could be
broadcasted on the Web even smaller. This will have an important impact in the
evolution for Web TV attractiveness compared to cable TV attractiveness.
‐ Share of exogenous Internet innovation in the development process. This change
reflects the fact that unlike big leagues that have additional resources that can be
put into development of new media solution (e.g. MLB Advanced Media, the branch
of the MLB that developed MLB.TV), small leagues will have comparatively less
leeway to create such initiatives. Thus, advances in quality and quantity of the
content that can be broadcasted on a small league’s web channel are more likely to
come from exogenous development of the Web and readily available broadcasting
solutions.
The results of this new simulation for small leagues are shown below.

139
Figure 89: Attractiveness of cable TV and Web TV in the case of small leagues
Figure 810: Market share of Web TV and cable TV in the case of small leagues
Results show that very shortly after the apparition of the new technology, the
attractiveness of the Web TV solution greatly outclasses the traditional cable TV
service. It is worth noting that in this case, the attractiveness is mostly driven by the
140
variety of content, as opposed to the base case for big leagues, where quality of
content and price seemed to drive the attractiveness.
The model seems to suggest that there is an important window of opportunity for
small leagues to be broadcasted online: as the Internet offers virtually an much
bigger broadcasting space, with an infinite number of broadcasting channels, small
leagues now have a medium with which they can afford to broadcast themselves,
even to a reduced audience.
II. Policy recommendations
The qualitative analysis done in chapters 3, 4 and 5, as well as the insights provided
by the systems dynamics model allow us to formulate three general policy
recommendations, that are addressed at policymakers, but also at players in the
industry. The aim of the study, again, was not to predict what the outcome of the
Internet disruption would be, but rather to identify pitfalls or dangers associated
with this disruption. These recommendations, along with the insights gained during
the study, can be used to mitigate these potentially undesirable effects, to create a
better, more open and competitive marketplace.
1. The Sports Broadcasting Act needs to be modified at in order to create a
more even competitive space in the Sports broadcasting world, as content
owners become broadcasters themselves.
141
As highlighted in Chapter 5, leagues, broadcasters and regulators are at a critical
point in broadcasting history. While regulation of Sports leagues and cable
broadcasting has not addressed adequately the issue of sports broadcasting, letting
market power and revenue skyrocket for both broadcasters and sports leagues, a
new order is about to be established. As Internet is believed to be the broadcasting
medium for the future, competition is entering this new, technology‐driven area.
While Internet broadcasting has not been extensively regulated yet, the “effective
competition” that is likely to be created seems to go along the lines of the current
broader legislation. However, because of the important position of sports leagues in
the context of Sports broadcasting over IP, namely, the regulator will have to
address the fact that the Sports Broadcasting Act creates an unbalance if the leagues
are to compete with legacy producers and carriers to distribute content.
2. Legacy carriers and content owners need to work together to find a solution
to the broadband incentive problem. On the same note, policymakers should
enforce net neutrality rules to create a more even competitive space.
This recommendation echoes directly the previous one. Enforcing net neutrality
rules will ensure that the competitive balance between content owners and
infrastructure owners will be preserved. In counterpart to this measures in favor of
the cable companies’ competitors, the policymakers should strive to have content
owners and legacy carriers agree on a new business model, that would not
necessarily be based solely on advertising, to compensate for the broadband

142
incentive problem described in Chapter 3. This is the only way to ensure that
content will be accessible to the masses at the lowest price possible, while having
beneficial spillover in terms of universal access to the Web, etc…
3. Legacy producers and carriers should not try to solely transpose old
business model to the online world, but rather redefine their role and look for
new partnerships
Once the two forms of regulatory capture stated above have been eliminated, and
the competitive balance between cable television, and new Web services operated
by legacy broadcasters or new players is ensured, we can start giving
recommendations to individual players of the value chain.
Given the results of the analysis and the insights gained from the System Dynamics
model, it seems that both ends of the value chain (content owners and customers)
are going to be empowered by the development of Sports over IP. On top of these
observations, lies the simple fact that these two links of the value chain are
independent of the technology used to broadcast sports, and are loyal to each other
– which is different than the relations that both content owners and customers can
have with producers, as highlighted in chapter 1.
This set of observation puts legacy producers and carriers in a difficult situation.
The study shows that they try for now to transpose their current role in the cable
broadcasting value chain to the online broadcasting world. However, it seems that
143
this specific business model is hard to reproduce online, where the audience is more
fragmented and proactive. This is a danger for legacy producers. Indeed, if legacy
broadcasters fail at delivering the same kind of revenue to leagues via Web TV as
what they used to deliver with cable TV, the empowered leagues could very well go
their own way.
Legacy producers should capitalize on their core competencies and be part of the
new alliances may be forged with online players. Indeed, services like MLB.TV may
not be able to reach the masses as a stand‐alone service, as there may be value in the
aggregation of content for certain classes of customers. A the variety of offerings is
likely to increase in the online world, legacy producers have to position themselves
in an offering that is consistent with their past, but does not deny the fundamental
differences inherent to the online world.

144
References 1 Television, Internet and Mobile usage in the U.S: A2/M2 Three screen report, The Nielsen Company, Volume 6, 3rd quarter 2009.
2 S. J. Baran, Sports and television, the Museum of Broadcast Communications, accessed October 24, 2009, http://www.museum.tv/archives/etv/S/htmlS/sportsandte/sportsandte.htm
3 Rader, B.G. In Its Own Image: How Television Has Transformed Sports. New York: Free Press, 1984.
4 S. J. Baran, Sports and television, the Museum of Broadcast Communications, accessed October 24, 2009, http://www.museum.tv/archives/etv/S/htmlS/sportsandte/sportsandte.htm
5 Team Marketing Research, Going, going, gone: MLB prices flying out of ballparks, accessed June 12, 2009, http://teammarketing.com.ismmedia.com/ISM3/std‐content/repos/Top/Fan%20Cost%20Index/MLB/MLB08.pdf
6 Quirk, J. and Fort, R.D: Pay Dirt, Princeton University Press, 1997
7 Freeman, M: ESPN: An Uncensored History, Taylor Trade Publishing, 2002
8 Michael MacCambridge, The Franchise: A History of Sports Illustrated Magazine, Hyperion Books, 1997 9 Quirk, J. and Fort, R.D: Pay Dirt, Princeton University Press, 1997, chapters 5 and 6
10 Bill Gorman, Super Bowl TV ratings, the Nielsen Company, January 18, 2009, accessed June 14, 2009, http://tvbythenumbers.com/2009/01/18/historical‐super‐bowl‐tv‐ratings/11044#more‐11044
11 Nicolas Carlson, Traffic flat, ESPN.com gets redesign (DIS), Business Insider, accessed May 17, 2009, http://www.businessinsider.com/2008/12/traffic‐flat‐espncom‐gets‐redesign‐dis ,
12 Steve Jobs, Thoughts on music, Apple Inc., February 6, 2007, accessed October 10, 2009, http://www.apple.com/hotnews/thoughtsonmusic/
13 A great invention 100 years on, Sony Corporation, accessed October 20, 2009, http://www.sony.net/Fun/SH/1‐20/h5.html
14 Brandenburg, Karlheinz; Bosi, Marina, Overview of MPEG Audio: Current and Future Standards for LowBitRate Audio Coding, Journal of the Audio Engineering Society 45 (1/2): 4–21. (February 1997)
15 A&M Records, Inc. v. Napster, Inc., 239 F.3d 1004 (9th Cir. 2001)
16 Sony v. Universal Studios 464 U.S. 417 (1984)
17 MGM Studios, Inc. v. Grokster, Ltd. 545 U.S. 913 (2005)
18 John Borland, RIAA sues 261 file swappers, CNET news, September 8, 2003, accessed October 21, 2009, http://news.cnet.com/2100‐1023_3‐5072564.html
19 Jeff Leeds, Labels Win Suit Against Song Sharer, New York Times, Oct. 5, 2007
20 RIAA v. The People: five years later, the Electronic Frontier Foundation, accessed October 19, 2009, http://www.eff.org/wp/riaa‐v‐people‐years‐later

145
21 Steve Jobs, Thoughts on music, Apple Inc., February 6, 2007, accessed October 10, 2009, http://www.apple.com/hotnews/thoughtsonmusic/
22 Natalie Klym, Digital Music Distribution, MIT Communications Futures Program, 2005
23 Amanda Cantrell, Apple’s remarkable comeback story, Cable News Network, March 29, 2006, accessed October 23, 2009, http://money.cnn.com/2006/03/29/technology/apple_anniversary/index.htm
24 iTunes Store top music retailer in the U.S., Apple Inc., April 3, 2008, accessed October 23, 2009, http://www.apple.com/pr/library/2008/04/03itunes.html
25 Key statistics, RIAA, accessed November 10, 2009, http://www.riaa.com/keystatistics.php
26 ibid
27 Swati Pandey, New report: EMI lost $1.2 billion, revenue declined, Los Angeles Times, October 24, 2008, accessed October 24, 2009, http://latimesblogs.latimes.com/entertainmentnewsbuzz/2008/10/emi‐posts‐12‐bi.html
28 Key statistics, RIAA, accessed November 10, 2009, http://www.riaa.com/keystatistics.php
29 Katie Marsal, iTunes store a greater cash crop than apple implies?, Apple Insider, April 23, 2007, accessed October 22, 2009, http://www.appleinsider.com/articles/07/04/23/itunes_store_a_greater_cash_crop_than_apple_implies.html
30 Warren Cohen, WalMart Wants $10 CD's, Rolling Stone Magazine, 2004, accessed October 12, 2009, http://www.rollingstone.com/news/story/6558540/walmart_wants_10_cds
31 Steve Jobs, Thoughts on music, Apple Inc., February 6, 2007, accessed October 10, 2009, http://www.apple.com/hotnews/thoughtsonmusic/
32 Peter Eckersley, EMI begins licensing DRMfree music downloads, the Electronic Frontier Foundation, April 2, 2007, accessed October 21, 2009, http://www.eff.org/deeplinks/2007/04/emi‐begins‐licensing‐drm‐free‐music‐downloads
33 Michael Arrington, The inevitable march of recorded music towards free, TechCrunch, October 4, 2007, accessed October 23, 2009, http://www.techcrunch.com/2007/10/04/the‐inevitable‐march‐of‐recorded‐music‐towards‐free/
34 Sarah McBride and Ethan Smith, Music industry to abandon mass suits, Wall Street Journal, December 19, 2008, accessed October 24, 2009 http://online.wsj.com/article/SB122966038836021137.html
35 Greg Sterling, YouTube growth is almost shocking, Search Engine Journal, July 17, 2006, accessed February 17, 2010, http://www.searchenginejournal.com/youtube‐growth‐is‐almost‐shocking/3641/
36 Television, Internet and Mobile usage in the U.S: A2/M2 Three screen report, The Nielsen Company, Volume 6, 3rd quarter 2009.
37 Grant Gross, FCC aims to free up 500MHz of Spectrum for Broadband, PCWrold, February 24, 2009, accessed February 26, 2010,
146
http://www.pcworld.com/businesscenter/article/190154/fcc_aims_to_free_up_500mhz_of_spectrum_for_broadband.html
38 Video Metrix, Comscore Inc, accessed March 23, 2009, http://www.comscore.com/Products_Services/Product_Index/Video_Metrix/(language)/eng‐US
39 Ben Parr, YouTube now has over 120 milllion U.S. viewers, Mashable, accessed February 26, 2010, http://mashable.com/2009/08/29/youtube‐viewers/
40 Federal Communications Commission, Thirteenth Annual Report of the Status of Competition in the Market for the Delivery of Video Programming, January 16, 2009
41 OECD Broadband portal, OECD, accessed January 9, 2010, http://www.oecd.org/sti/ict/broadband
42 Om Malik, Shocking: New facts about P2P and broadband usage, the GigaOM Network, http://gigaom.com/2008/04/22/shocking‐new‐facts‐about‐p2p‐and‐broadband‐usage/
43 Daniel Hardy, Guy Malléus, Jean‐Noël Méreur, Networks: internet, telephony, multimedia : convergences and complementarities , De Boeck University, 2002
44 ibid
45 A Streaming Media Primer, the Adobe Dynamic Media Group, 2001
46 Williamson, Beau. Developing IP Multicast Networks. Indianapolis: Cisco Press, 2000.
47 See chapter 4 for more details
48 Bill Lehr, The Broadband Incentive Problem, Communications Futures Program, 2005, accessed September 2, 2009, http://cfp.mit.edu/docs/incentive‐wp‐sept2005.pdf
49 Rural Utilities Service Broadband Initiatives Program, Round Two: Application Guide, U.S. Department of Agriculture, March 9, 2010, accessed March 20, 2010, http://www.broadbandusa.gov/files/BIP%20Application%20Guide%20Round%202_030910.pdf 50 Clayton Christensen, The innovator’s dilemma: when new technologies cause great firms to fail, Harvard business press, 1997
51 Porter, M. E, What is strategy?, Harvard Business Review, December 1996, 61‐78.
52 U.S. Code: Title 17 – Copyrights, Cornell University Law school, accessed December 10, 2009, http://www.law.cornell.edu/uscode/html/uscode17/usc_sup_01_17.html
53 Mike Masnick, MLB refuses to give permission to guy to describe game to a friend, TechDirt, September 4, 2009, accessed December 1, 2009, http://www.techdirt.com/articles/20090904/0304256103.shtml
54 Sam Schechner, Comcast seeks NBC Sports Muscle, the Wall Street Journal, October 12, 2009, accessed December 3, 2009, http://online.wsj.com/article/SB10001424052748704882404574463712075917016.html?mod=googlenews_wsj
55 Garry Whannel, Reading the Sports Media audience, Ch. 14 in Mediasport by Laurence A. Wenner, Routledge, 1998.

147
56 Super Bowl ad cost through the years, MSNBC, accessed July 10, 2009, http://www.msnbc.msn.com/id/16874732?pg=1#biz_super_bowl_ads_070129
57 Garry Whannel, Reading the Sports Media audience, Ch. 14 in Mediasport by Laurence A. Wenner, Routledge, 1998.
58 ESPN: making ‘payforcontent’ work: a telco opportunity, STL Partners, accessed December 2, 2009, http://www.telco2research.com/articles/AN_ESPN‐making‐pay‐for‐content‐work‐telco‐opportunity_summary
59 see chapter 5
60 Clayton Christensen, The innovator’s dilemma: when new technologies cause great firms to fail, Harvard business press, 1997
61 see Chapter 3
62 OECD Broadband portal, OECD, accessed January 9, 2010, http://www.oecd.org/sti/ict/broadband
63 Clayton Christensen, The innovator’s dilemma: when new technologies cause great firms to fail, Harvard business press, 1997
64 OECD Broadband portal, OECD, accessed January 9, 2010, http://www.oecd.org/sti/ict/broadband
65 Henderson, Rebecca, Making money from Innovation, Chapter 3 in Strategy and Technology (forthcoming)
66 1961 Sports Broadcasting Act, in Title 15 of the U.S. Code, Chapter 32 "Telecasting of Professional Sports Contest" (§§ 1291‐1295)
67 Title II of the Digital Millenium Copyright Act of 1996
68 Rader, B.G. In Its Own Image: How Television Has Transformed Sports. New York: Free Press, 1984.
69 137 Cong. Rec. S5515 (daily ed. May 8, 1991) (statement of Sen. McCain)
70 G. Stigler, The Theory of Economic Regulation, Bell Journal of Economics and Management Science, no. 3, pp. 3‐18, 1971
71 A. N. Wise, B. S. Meyer, International Sports Law and Business: Chapter 4, Kluwer Law International, 1997
72 M. Baimbridge, S. Cameron & P. Dawson, Satellite broadcasting and match attendance, the case of rugby league” Applied Economics Letters, 2, pp.343‐346, 1995
73 S. J. Baran, Sports and television, the Museum of Broadcast Communications, accessed October 24 2009, http://www.museum.tv/archives/etv/S/htmlS/sportsandte/sportsandte.htm
74 M. Olson, The Rise and Decline of Nations, Ch 2 "The Logic.", 1982
75 Phillip M. Cox II, Flag on the Play? The Siphoning Effect on Sports Television, Federal Communications Law Journal, 47, 3, 1995
76 46 U.S.C.A. §§ 484‐487, 47 U.S.C.A. § 35, 152 et seq.
148
77 A. M. Zaretsky, The Cable TV industry and Regulation, Federal Reserve Bank of St. Louis, The Regional Economist, 1995.
78 Federal Communications Commission, Thirteenth Annual Report of the Status of Competition in the Market for the Delivery of Video Programming, January 16, 2009
79 G. Stigler, The Theory of Economic Regulation Bell Journal of Economics and Management Science, no. 3,pp. 3‐18, 1971
80 Top 25 Multichannel video programming distributors, National Cable and Telecommunications Association, accessed July 12, 2009, http://www.ncta.com/Stats/TopMSOs.aspx
81 Federal Communications Commission, Thirteenth Annual Report of the Status of Competition in the Market for the Delivery of Video Programming, January 16, 2009
82 15 U.S.C. 32, §1291‐1294
83 Telecasting of Professional Sports Contests: Hearings on H.R. 8757 Before the Subcomm. on Antitrust (Subcomm. No. 5) of the House Comm. on the Judiciary, 87th Cong., 1st Sess. 36 (1961).
84 Kurt Badenhausen, Michael K. Ozanian and Christina Settimi, The Business of Baseball, Forbes, accessed April 17, 2009, http://www.forbes.com/2010/04/07/most‐valuable‐baseball‐teams‐business‐sportsmoney‐baseball‐valuations‐10_land.html
85 17 U.S.C. §§ 512, 1201–1205, 1301–1332; 28 U.S.C. § 4001
86 A2/M2 Three screen report, Nielsen Company, 4th quarter 2008, http://blog.nielsen.com/nielsenwire/wp‐content/uploads/2009/02/3_screens_4q08_final.pdf
87 FCC, Policy Statement, 2005, accessed March 21, 2010, http://hraunfoss.fcc.gov/edocs_public/attachmatch/FCC‐05‐151A1.pdf
88 J. Kearney and T. Merrill, The Great Transformation of Regulated Industries Law, 98, Columbia Law Review, Oct 1998. 89 The Supreme court, Certiorati – Summary dispositions, June 2009, accessed October 1, 2009, http://www.supremecourtus.gov/orders/courtorders/062909zor.pdf
90 John Sterman, Business dynamics: systems thinking and modeling for a complex world. 2000, Boston: Irwin/McGraw‐Hill
91 ibid
92 Chintan Vaishnav, Voice over Internet Protoco (VoIP) : the Dynamics of technology and Regulation, MIT, 2006
93 ibid
94 John Sterman, Business dynamics: systems thinking and modeling for a complex world. 2000, Boston: Irwin/McGraw‐Hill. 95 Charles H. Fine, Clockspeed: Winning Industry Control in the Age of Temporary Advantage. 1998, Cambridge: Basic Books.

149
96 John Sterman, Business dynamics: systems thinking and modeling for a complex world. 2000, Boston: Irwin/McGraw‐Hill. 97 See appendix for a full description of the changes
150
Appendix: Full description of the System Dynamics model used
Note: the stock and flow view of the model can be found at the end of Chapter 6 in the body of the thesis.
(001) ad revenue per viewer=
Table for ad revenue per viewer(Time)
Units: Dollars/person
(002) additional seats to build=
MAX(0,fraction of unsatisfied demand to fulfill*unsatisfied demand for tickets
/number of games played)
Units: Seats
The number of seats to adapt to the increasing demand. I actually took 50% of this value to keep some scarcity
(003) advertisers' wilingness to pay for ads=
Installed Base for cable viewing*ad revenue per viewer
Units: Dollars
Data can be found on the installed base for cable viewing and for the ad revenue that advertisers will provide the producers for each viewer. From there, we can derive the total advertiser's willingness to pay for advertising over a year.
(004) aggregated size of the stadiums= INTEG (
seat addition rate,
375000)
Units: Seats
In 1970, the Rex Sox sold out the vast majority of their games, and attendance reached 20,000 spectators/game. I muliplied this number by the number of teams

151
(005) annual increase in player salary=
average potential player salary‐average player's salary
Units: Dollars/Year
The players will capture all the additional wealth made available by the teams and the league each year. The increase may be negative, which would result in a decrease in the average player salary
(006) annual increase in TV rights=
league wilingness to sell TV rights*fractional increase in TV rights per year
Units: Dollars/Year
(007) annual rabid fan budget increase=
average rabid fan budget*Economic growth
Units: Dollars/Year
We make the assumption that the fan budget follows the same trend than the economy
(008) Attractiveness of Cable TV=
(1‐Normalized price of cable TV)*quality of cable TV*Variety of content on cable TV
Units: Dimensionless
Attractiveness is the product of three terms: the surplus that each consumer gets, the quality and the quantity
(009) Attractiveness of Web TV=
(1‐Normalized price of Web TV)*Quality of Web TV*variety of content in Web TV
Units: Dimensionless

152
Attractiveness is the product of three terms: the surplus that each consumer gets, the quality and the quantity
(010) average number of games attended per rabid fan=
average rabid fan budget/average ticket price
Units: Dimensionless
According to Quirk and Fort, each fan has a budget that is devoted to sports ticket. The average number of games attended per fan then just depends on the average price of a ticket
(011) average number of games watched on TV per casual fan=
3*Total Attractiveness of All Products
Units: Dimensionless
(012) average number of games watched on TV per rabid fan=
10*Total Attractiveness of All Products
Units: Dimensionless
(013) average player's salary= INTEG (
annual increase in player salary,
2e+006)
Units: Dollars
Calibrated, based on MLB data
(014) average potential player salary=
league payroll/number of players in the league
Units: Dollars
The average salary of each player in the league is a function of the amount of money that is available for the league players, and of the number of players in that league

153
(015) average rabid fan budget= INTEG (
annual rabid fan budget increase,
75)
Units: Dollars
The amount of money that a rabid fan is willing to spend on sports tickets. Initial value taken from MLB data
(016) average ticket price= INTEG (
average ticket price increase,
30)
Units: Dollars
Based on MLB data
(017) average ticket price increase=
average ticket price*fractional increase in base ticket price per year
Units: Dollars/Year
(018) average time to create new seats=
5
Units: Years
(019) Average time to develop piracy control tools=
3
Units: Years
(020) average time to improve Web TV quality=
5
Units: Years

154
(021) Base price of Web TV=
20
Units: Dollars
see chapter 1
(022) cable audience attrition=
Installed Base for cable viewing/cable TV average attrition time
Units: People/Year
(023) cable TV average attrition time=
15
Units: Years
see chapter 8
(024) casual fan base=
fraction of the population that is a casual fan*Potential fan base
Units: People
The casual fans do not watch live games, they only create demand for video viewing
(025) change in piracy control=
(Effective goal for piracy control‐Level of piracy control)/Average time to develop piracy control tools
Units: 1/Year
(026) Economic growth=
0.063
Units: Dimensionless

155
According to Penn World Table, GDP growth in the U.S. has been 6.3% on average during the last decades. We assume that purchasing power is going to increase by 6.3% each year, following the same trend.
(027) Effective goal for piracy control=
Table for effective goal for piracy control(Percentage of Web TV content that would be pirate without regulation
)
Units: Dimensionless
(028) Exponential Growth Rate=
0
Units: 1/Day
The exponential growth rate in the input.
(029) Exponential Growth Time=
0
Units: Day
The time at which the exponential growth in the input begins.
(030) fan demand for stadium tickets=
average number of games attended per rabid fan*rabid fan base
Units: People
The number of seats per year that should be provided to meet the fans' demand.
(031) fan demand for video viewing=
casual fan base*average number of games watched on TV per casual fan+rabid fan base
*average number of games watched on TV per rabid fan

156
+MAX(unsatisfied demand for tickets,0 )
Units: People
(032) FINAL TIME = 2025
Units: Year
The final time for the simulation.
(033) fraction of the league revenues spent in payroll=
table for league payroll(Time)
Units: Dimensionless
The fraction of the league revenues spent in payroll is taken from historical data as a table function. We assume that this fraction will still slowly increase in the next years. Note that the study shows that this dynamic is caused by the tremendous market power that star players have gained with free agency, and as such is exogenous to the model.
(034) fraction of the population that is a casual fan=
0.34
Units: Dimensionless
According to studies, the fraction of the population that watches sports on TV has been constant since the 1970s. We assume that this will not change dramatically in the future
(035) fraction of the population that is a rabid fan=
0.1
Units: Dimensionless
According to studies, the fraction of the population that watches sports live has been constant since the 1970s. We assume that this will not change dramatically in the future
(036) fraction of unsatisfied demand to fulfill=
0.08

157
Units: Dimensionless
This goal depends on the team. I took the value of 8% for the Red Sox as it seems to fit historical data this way.
(037) fractional increase in base ticket price per year=
league sensitivity on ticket price*fractional increase in player salary per year
Units: 1/Year
To make up for the increase in player's salary, the ticket price should increase in a similar way
(038) fractional increase in player salary per year=
annual increase in player salary/average player's salary
Units: 1/Year
This is the fractional increase in player salary for each year. This is the baseline on which the leagues will set their expectations for TV rights and gate revenues.
(039) fractional increase in TV rights per year=
league sensitivity on TV rights*fractional increase in player salary per year
Units: 1/Year
To make up for the increase in player's salary, the TV rights should increase in a similar way
(040) Gap between the reservation price and the average price=
MAX(0,(Normalized price of cable TV*Market Share of cable TV+Normalized price of Web TV
*Market share of Web TV)‐Normalized customer reservation price for cable or Web TV
)
Units: Dimensionless

158
Measures the gap between the average price for broadcasted sports and the customer reservation price. If this difference is negative, the gap will be set to zero.
(041) Initial Installed Base for Cable TV=
1.2e+008
Units: People
The initial number of product in use.
(042) Initial Installed Base for Web TV=
100000
Units: People
The initial number of product 2 in use.
(043) INITIAL TIME = 2005
Units: Year
The initial time for the simulation.
(044) Input=
1 + STEP(Step Height,Step Time)+
(Pulse Quantity/TIME STEP)*PULSE(Pulse Time,TIME STEP)+
RAMP(Ramp Slope,Ramp Start Time,Ramp End Time)+STEP(1,Exponential Growth Time
)*(EXP(Exponential Growth Rate*Time)‐1)+
STEP(1,Sine Start Time)*Sine Amplitude*SIN(2*3.14159*Time/Sine Period)+STEP
(1,Noise Start Time)*RANDOM NORMAL( ‐4 , 4 , 0 , Noise Standard Deviation
, Noise Seed )
Units: Dimensionless

159
The test input can be configured to generate a step, pulse, linear ramp, exponential growth, sine wave, and random variation. The initial value of the input is 1 and each test input begins at a particular start time. The magnitudes are expressed as fractions of the initial value.
(045) Installed Base for cable viewing= INTEG (
New cable subscriptions‐cable audience attrition,
Initial Installed Base for Cable TV)
Units: People
(046) Installed base for Pirate Web TV=
MAX(0,Installed Base for Web TV*(Percentage of Web TV content that would be pirate without regulation
‐Level of piracy control
))
Units: People
(047) Installed Base for Web TV= INTEG (
New Web TV subscriptions‐web TV attrition,
Initial Installed Base for Web TV)
Units: People
(048) "Internet‐based research"=
0.3
Units: Dimensionless
The part of the Internet‐centric innovation that is exogenous to the system (incidental innovations, research grants, etc...)
(049) "Internet‐centric innovation"=
160
"Internet‐based research"+"Table for Internet‐centric innovation"(Installed Base for Web TV
/Total Installed Base)*(1‐"Internet‐based research")
Units: Dimensionless
This normalized number measures the impact of internal and exogenous research that will allow for a higher quality and quantity of content broadcasted online
(050) league payroll=
fraction of the league revenues spent in payroll*league revenues
Units: Dollars
(051) league revenues=
league revenues from ticket selling+league revenues from TV rights+subscription revenues for web TV
Units: Dollars
Total team revenues are the sum of revenues from TV contracts, web TV viewers, and gate revenues.
(052) league revenues from ticket selling=
total fan attendance*average ticket price
Units: Dollars
The revenue generated from ticket selling is the actual number of tickets that will be sold, multiplied by the average price of this ticket.
(053) league revenues from TV rights=
(league wilingness to sell TV rights+producer's willingness to pay for TV content
)/2
Units: Dollars
161
A very simple simulation of the bidding / negociation process that takes place between leagues and producers, the final value of the broadcasting rights that the league will get each year is the average of what the league is demanding and what the producers are willing to bid for initially
(054) league sensitivity on ticket price=
0.5
Units: Dimensionless
This parameter, in conjunction with the league sensitivity on TV rights, determines how much the financial burden of the league is translated to an increase in ticket prices, versus an increase in what the league will ask the TV channels. Fit with historical data suggests that this parameter is equal to 0.5 for the 1970‐2005 period.
(055) league sensitivity on TV rights=
1.8
Units: Dimensionless
This parameter, in conjunction with the league sensitivity on ticket price, determines how much the financial burden of the league is translated to an increase in ticket prices, versus an increase in what the league will ask the TV channels. Fit with historical data suggests that this parameter is equal to 2 for the 1970‐2005 period.
(056) league wilingness to sell TV rights= INTEG (
annual increase in TV rights,
5e+008)
Units: Dollars
This is the amount of money that the league is willing to sell its TV rights for.
(057) Level of piracy control= INTEG (
change in piracy control,
0)
Units: Dimensionless

162
The level of piracy control that will be effectively apply to prevent a share of the customers from watching pirate Web TV
(058) Market Share of cable TV=
Installed Base for cable viewing/Total Installed Base
Units: Dimensionless
The fraction of the installed base of products that are cable TV services.
(059) Market share of Web TV=
Installed Base for Web TV/Total Installed Base
Units: Dimensionless
The fraction of the installed base of products that are Web TV services?
(060) New cable subscriptions=
new demand for broadcasted sports * Relative attractiveness of Cable
Units: People/Year
The sales rate is determined by the market share for the given product and the exogenous total demand.
(061) new demand for broadcasted sports=
Total fan base for broadcasted sports‐Total Installed Base
Units: People
The number of people that need to subscribe to a new service each year
(062) New Web TV subscriptions=
new demand for broadcasted sports * Relative attractiveness of Web TV
Units: People/Year

163
The sales rate is determined by the market share for the given product and the exogenous total demand.
(063) Noise Seed=
1000
Units: Dimensionless
Varying the random number seed changes the sequence of realizations for the random variable.
(064) Noise Standard Deviation=
0
Units: Dimensionless
The standard deviation in the random noise. The random fluctuation is drawn from a normal distribution with min and max values of +/‐ 4. The user can also specify the random number seed to replicate simulations. To generate a different random number sequence, change the random number seed.
(065) Noise Start Time=
0
Units: Day
The time at which the random noise in the input begins.
(066) Normalized customer reservation price for cable or Web TV=
0.2
Units: Dimensionless
The price under which all fans will subscribe to either a cable TV or a Web TV package. If the price of both those packages is higher than the reservation price, a portion of the consumers will decide to adopt the pirate solution.
(067) Normalized price of cable TV=

164
MAX(Relative size of the audience of cable TV*0.7, 0.5)
Units: Dimensionless
There are heavy fixed installation costs, that cannot make the price of cable TV drop below 0.5 (normalized). As the market share for cable diminishes, prices will be lowered to answer the competition.
(068) Normalized price of Web TV=
0.5
Units: Dimensionless
This price is normalized, and has been taken as equal to the subscription fee component of the price of cable TV
(069) number of games played=
81
Units: Dimensionless
Each baseball season, 162 games are played by a team, half of which are played home.
(070) number of players in the league=
640
Units: Dimensionless
For the MLB, there are currently 16 teams, each of them having 40 players in their roster.
(071) Percentage of Web TV content that would be pirate without regulation=
Table for consumer sensitivity to price gaps(Gap between the reservation price and the average price
)
Units: Dimensionless

165
(072) population growth rate=
0.012
Units: 1/Year
We assume that the U.S. population is going to grow at the same rate as it did during the past decade. Data taken from the US Census.
(073) Potential fan base= INTEG (
potential fan creation rate,
3e+008)
Units: People
Since the study is limited to the U.S. market, the potential fan base is the U.S. population. This variable is initialized at 300M people, roughly the US population in 2005
(074) potential fan creation rate=
Potential fan base*population growth rate
Units: People/Year
New potential fans come from population growth.
(075) producer's willingness to pay for TV content=
advertisers' wilingness to pay for ads
Units: Dollars
the producer aims at balancing the expenses with the revenues from advertisers: as such, the producer's willingness to pay for TV content is taken equal to the advertiser's willingness to pay
(076) Pulse Quantity=
0
Units: Dimensionless*Day
The quantity added to the input at the pulse time.

166
(077) Pulse Time=
0
Units: Day
The time at which the pulse increase in the input occurs.
(078) quality of cable TV=
0.5
Units: Dimensionless
As cable TV is considered as a mature technology, its quality remains constant over time.
(079) Quality of Web TV= INTEG (
Web TV quality enhancement,
0.25)
Units: Dimensionless
(080) rabid fan base=
Potential fan base*fraction of the population that is a rabid fan
Units: People
Rabid fans will go to the games if their budget allows them; otherwise they will watch them on TV
(081) Ramp End Time=
1e+009
Units: Day
The end time for the ramp input.

167
(082) Ramp Slope=
0
Units: 1/Day
The slope of the linear ramp in the input.
(083) Ramp Start Time=
0
Units: Day
The time at which the ramp in the input begins.
(084) Relative attractiveness of Cable=
Attractiveness of Cable TV/Total Attractiveness of All Products
Units: Dimensionless
Market share is determined by the attractiveness of each firm's products relative to the attractiveness of the other firms' products.
(085) Relative attractiveness of Web TV=
Attractiveness of Web TV/Total Attractiveness of All Products
Units: Dimensionless
Market share is determined by the attractiveness of each firm's products relative to the attractiveness of the other firms' products.
(086) Relative size of the audience of cable TV=
Installed Base for cable viewing/Total Installed Base
Units: Dimensionless
(087) SAVEPER =
TIME STEP

168
Units: Year [0,?]
The frequency with which output is stored.
(088) seat addition rate=
additional seats to build/average time to create new seats
Units: Seats/Year
There is a first order delay in the creation of new seats (building can only be made between seasons, it is not every year, etc...)
(089) seat capacity=
aggregated size of the stadiums*number of games played
Units: Seats
Total number of tickets that will be offered by the team for a year.
(090) Sine Amplitude=
0
Units: Dimensionless
The amplitude of the sine wave in the input.
(091) Sine Period=
10
Units: Day
The period of the sine wave in the input.
(092) Sine Start Time=
0
Units: Day
The time at which the sine wave fluctuation in the input begins.

169
(093) Step Height=
0
Units: Dimensionless
The height of the step increase in the input.
(094) Step Time=
0
Units: Day
The time at which the step increase in the input occurs.
(095) subscription revenues for web TV=
Normalized price of Web TV*Base price of Web TV*Installed Base for Web TV
Units: Dollars
(096) Table for ad revenue per viewer(
[(1970,0)‐(2025,5)],(1970,0.25),(1980,0.5),(1990,1),(2000,3.3),(2010,4),(
2025,4.75))
Units: Dolars/person
Taken from historical data from the Superbowl ‐ the trends follow the same that the Superbowl's games, and the numbers are calibrated so that the revenue per viewer for the season matches 2008's numbers. From 2010 onwards, we assume that because of audience dilution, advertisers will offer decreasingly higher amounts of money per viewer
(097) Table for consumer sensitivity to price gaps(
[(0,0)‐(1,1)],(0,0),(0.1,0.025),(0.2,0.075),(0.3,0.15),(0.5,0.5),(0.8,0.8
),(1,0.9))
Units: **undefined**
170
(098) Table for effective goal for piracy control(
[(0,0)‐(1,1)],(0,0),(0.05,0),(0.1,0),(0.2,0.05),(0.3,0.125),(0.5,0.25),(0.75
,0.5),(1,1))
Units: Dimensionless
(099) "Table for Internet‐centric innovation"(
[(0,0)‐(1,1)],(0,0),(0.25,0.5),(0.5,0.75),(0.75,0.9),(1,1))
Units: Dimensionless
(100) table for league payroll(
[(0,0)‐(2100,10)],(1970,0.19),(1985,0.4),(2005,0.6),(2025,0.7))
Units: Dimensionless
In 1970, the payroll represented 19% of the Red Sox' revenue. In 1985, it was 40. From 2005 and onwards, it represented 60% of the team revenues.
(101) Table for variety of content on cable TV(
[(0,0)‐(1,1)],(0,0),(0.1,0.025),(0.2,0.075),(0.3,0.15),(0.5,0.4),(0.7,0.475
),(0.8,0.49),(1,0.5))
Units: **undefined**
Maximum variety of content attainable is 0.5, due to the technological limitations associated with cable. The more people are watching on cable TV, the more variety is going to be offered, but there needs to be a "critical mass" first.
(102) TIME STEP = 0.125
Units: Year [0,?]
The time step for the simulation.

171
(103) Total Attractiveness of All Products=
Attractiveness of Cable TV + Attractiveness of Web TV
Units: Dimensionless
Total attractiveness is the sum of the attractiveness levels of all products in the marketplace.
(104) total fan attendance=
MIN(seat capacity,fan demand for stadium tickets)
Units: People
If the demand for tickets is less than the capacity of the stadiums, the total attendance will be equal to the demand. If not, then the capacity of the stadiums will determine how many fans get to see live games.
(105) Total fan base for broadcasted sports=
casual fan base+rabid fan base
Units: People
This is the total population that wants to watch sports on television
(106) Total Installed Base=
Installed Base for cable viewing + Installed Base for Web TV
Units: People
The total number of products that are currently in use.
(107) unsatisfied demand for tickets=
MAX(0,fan demand for stadium tickets‐seat capacity)
Units: People
The number of tickets that will not be sold because the demand is higher than the offer
172
(108) variety of content in Web TV=
DELAY1I("Internet‐centric innovation", 2 , 0 )
Units: Dimensionless
(109) Variety of content on cable TV=
Table for variety of content on cable TV(Relative size of the audience of cable TV
)
Units: Dimensionless
As the cable TV technology is mature, and the number of cable channels heavily regulated and slow to move, the variety of content offered on cable TV is going to depend mainly on the relative size of the audience
(110) web TV attrition=
Installed Base for Web TV/web TV average attrition time
Units: People/Year
(111) web TV average attrition time=
15
Units: Years
see chapter 8
(112) Web TV quality enhancement=
(1‐Quality of Web TV)*"Internet‐centric innovation"/average time to improve Web TV quality
Units: 1/Year