spnerstilnégf ulplr yeearss rceosnfultse 2007 rence
TRANSCRIPT

Name of chairman
Nestlé Full Year Results 2007
Name of chairman
SPRING PRESS CONFERENCE
February 21, 2008

2 Name of chairmanSPRING PRESS CONFERENCE 2008
This presentation contains forward looking statements which reflect Management’s current views and estimates. The forward looking statements involve certain risks and uncertainties that could cause actual results to differ materially from those contained in the forward looking statements. Potential risks and uncertainties include such factors as general economic conditions, foreign exchange fluctuations, competitive product and pricing pressures and regulatory developments.
Disclaimer

3 Name of chairmanSPRING PRESS CONFERENCE 2008
Key Figures
• Sales of CHF 107.6bn, up CHF 9.1bn (+9.2%)
• Above-target Organic Growth of 7.4%
• EBIT CHF 15 024m, up 12.9%, to 14% of sales
• Net Profit CHF 10 649m, up 15.8%
• Dividend up 17.3% to CHF 12.20

4 Name of chairmanSPRING PRESS CONFERENCE 2008

5 Name of chairmanSPRING PRESS CONFERENCE 2008
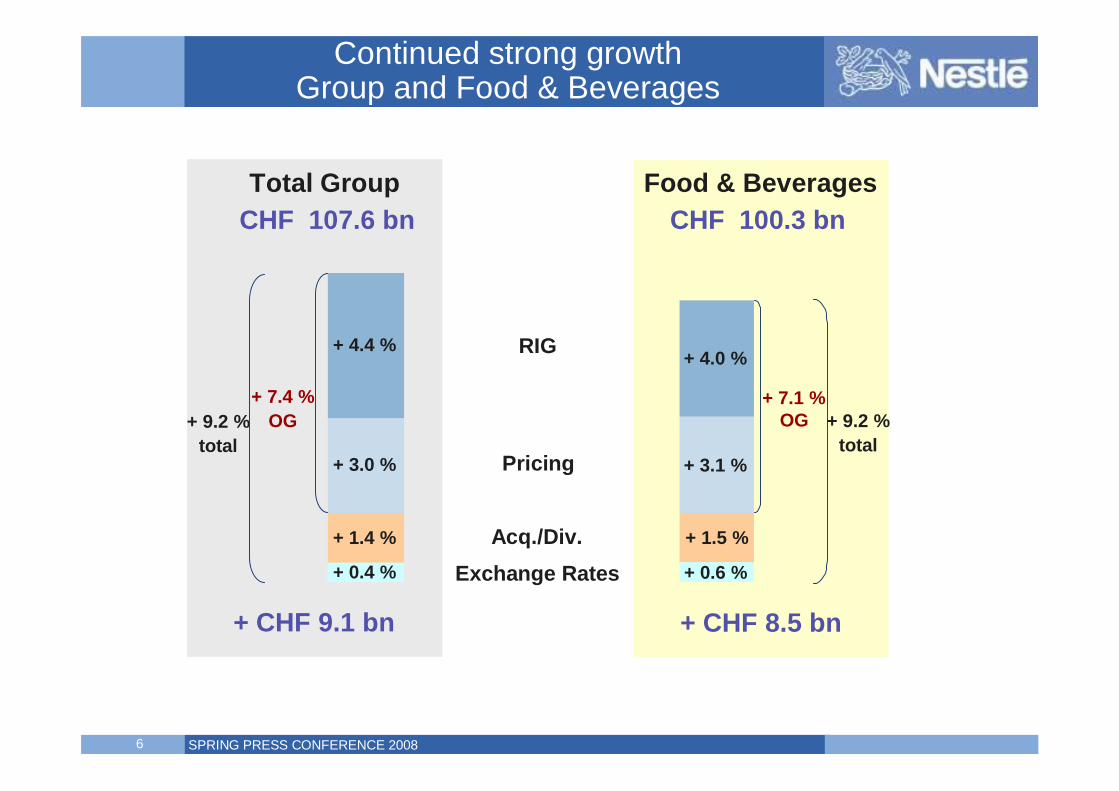
Continued strong growthGroup and Food & Beverages
Pricing
Acq./Div.Exchange Rates
CHF 107.6 bnTotal Group
+ CHF 9.1 bn
+ 9.2 %total
+ 3.0 %
+ 1.4 %
+ 0.4 %
+ 4.4 %
+ 7.4 %OG
RIG
6 Name of chairmanSPRING PRESS CONFERENCE 2008
Continued strong growthGroup and Food & Beverages
CHF 100.3 bnFood & Beverages
Pricing
Acq./Div.Exchange Rates
CHF 107.6 bnTotal Group
+ CHF 9.1 bn
+ 9.2 %total
+ 3.0 %
+ 1.4 %
+ 0.4 %
+ 4.4 %
+ CHF 8.5 bn
+ 7.1 %OG + 9.2 %
total
+ 4.0 %
+ 0.6 %
+ 1.5 %
+ 3.1 %
+ 7.4 %OG
RIG

7 Name of chairmanSPRING PRESS CONFERENCE 2008
2007 Highlights – all metrics improveDelivering the Nestlé Model
+ 9.2 %+ 7.4 %
+ 12.9 %+ 50 bps
+ 15.8 %+ 60 bps
- 10 bps
+ 15.1 %
+ 100 bps+ 50 bps
CHF 107.6 bn
CHF 15.0 bn14.0 %
CHF 10.6 bn9.9 %
6.6 %
CHF 13.4 bn
22.2 %12.2 %
+ CHF 9.1 bn
+ CHF 1.7 bn
+ CHF 1.4 bn
+ CHF 1.7 bn
Sales – totalOrganic growth
EBITEBIT margin
Net profitNet profit margin
Working capital (% of sales)
Operating cash flow
ROIC- before goodwill- after goodwill
Improvements FY 07 v 06 FY 07 Total

8 Name of chairmanSPRING PRESS CONFERENCE 2008
Food and BeveragesAll metrics improve
2007
2006
RIG OG EBIT margin
Sales
CHF 100.3 bn
CHF 91.8 bn
+ 9.2 % + 40 bps
12.6 %
12.2 %
Strongon-goinggrowth
4.0 %
7.1 %
5.9 %
4.2 %
EBIT
+ 12.7 %
CHF 12.6 bn
CHF 11.2 bn

9 Name of chairmanSPRING PRESS CONFERENCE 2008
Dairy(incl. Ice cream)
Product groups RIG & organic growth
% RIG % Organic growth
% G
row
th
7.6
5.0
1.7
6.5
3.22.3
3.8
10.210.3
6.6
7.8
9.7
4.0
5.3
7.0
11.0
0
2
4
6
8
10
12
Powdered & Liquid Beverages(ex-Nestlé Waters)
NestléWaters
NestléNutrition
Prepared dishes & cooking aids
Confectionery PetCare Pharma
SalesCHF bn 17.9 10.4 20.7 8.4 18.5 12.3 7.312.1
Total Beverages (RIG 6.6 % OG 8.9 %) Total Milk, Nutrition & Ice cream (RIG 2.8 % OG 8.3 %)
10 Name of chairmanSPRING PRESS CONFERENCE 2008
% G
row
th % RIG % Organic Growth
SalesCHF bn
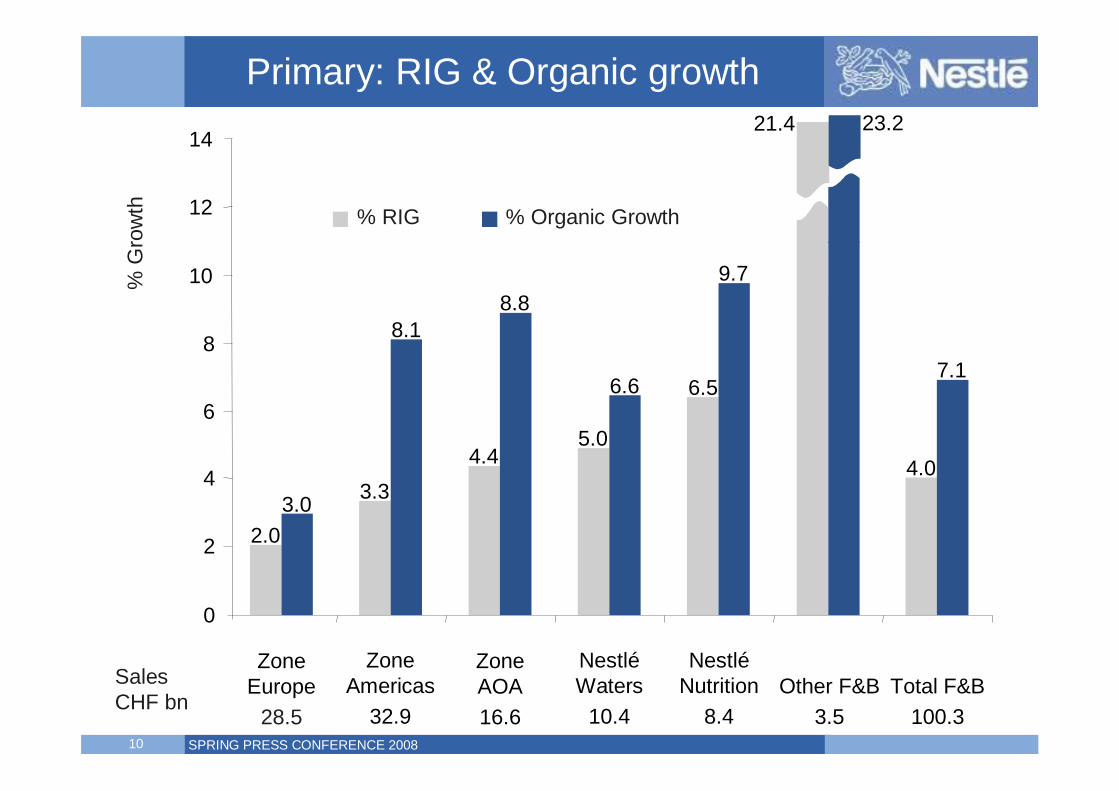
Primary: RIG & Organic growth
2.0
3.34.4
5.0
6.5
21.4
4.0
3.0
8.18.8
6.6
9.7
23.2
7.1
ZoneEurope
28.5
ZoneAmericas
32.9
ZoneAOA16.6
NestléWaters
10.4
NestléNutrition
8.4Other F&B
3.5Total F&B
100.3
0
2
4
6
8
10
12
14

11 Name of chairmanSPRING PRESS CONFERENCE 2008
F&B "Billionaire Brands" represent about 70 % of F&B sales

12 Name of chairmanSPRING PRESS CONFERENCE 2008
Superpremium ChocolateLaunch of premium product range
Key Innovation & Renovation 2007 -supporting our Billionaire Brands
DibsLow Temperature Freezing
Chocolate & Malted Beverages60/40+ (Actigen-E & Protomalt)
NAN, BEBA, NIDINA, NIDALwith BABs strengthening and
enhancing the infants immune system
Dolce GustoFrom 3 countries in 2006 to 11 in 2007
NIDO Nutrition SystemAge specific nutrition solution
with probiotics (lactobacillus protectus)

13 Name of chairmanSPRING PRESS CONFERENCE 2008
Quality & Technology
R&D Development Platformswill drive further Innovation
60/40 Profiling Systems & Packaging
Nutrition, Health & Wellness
Functional Quality
Taste Packaging

14 Name of chairmanSPRING PRESS CONFERENCE 2008
2007 Full Year ResultsKey factors of margin improvement
EBIT2006
COGS Distribution Marketing R&D EBIT2007
13.5 %
+ Operation Excellence+ Mix
- Input costs
- 60
GROUP EBIT MARGIN + 50 bps (+ 60 constant currency)F&B EBIT MARGIN + 40 bps (+ 50 constant currency)
Spend+ 8.1 % 14.0 %
EBIT + 12.9 %+ CHF 1.7 bn
+ 20
CHF spend + 1.5 bnMedia % up with sales+ Trade spend efficiencies+ Volume growth
+ 90
+ GNBS+ Growth+ Efficiencies
Administration- 10
+ 10+ 50

15 Name of chairmanSPRING PRESS CONFERENCE 2008
Increased earnings per share, proposed dividend and payout ratio
Dividend per share CHFEarnings per share (Full) CHF
19.51
17.04
+ 16.4%
7.20
16.05
8.00
10.40
23.90
20062003 2004 2005 2007
9.00
20.78
12.20
27.81
+ 17.3%
CHF 4.4 bn of shares bought backin 2007 – on going

16 Name of chairmanSPRING PRESS CONFERENCE 2008
Improved management of working capital
Working capital total (in % sales)
6.2
6.4
6.6
6.8
7.0
7.2
7.4
7.6
7.8
Working capital total includes Trade receivables, Inventories, Trade payables, Other receivables, Prepayments, Accruals, Current tax payables and Other short term payables. Calculation is based on year-end figures.
10 bpsimprovement
2003 2004 2005 2006 2007
7.2
6.9
7.7
6.7 6.6

17 Name of chairmanSPRING PRESS CONFERENCE 2008
Free cash flow (FCF)
Strong cash flow generation
Operating cash flow (OCF)
0
2
4
6
8
10
6.64
10.41
6.56
10.21
7.02
11.68
2005 2006 20072003 2004
6.36
10.13
CH
F bi
llion 12
OCF+ CHF 1.76 bn
FCF+ CHF 1.21 bn
8.23
13.4414
18 Name of chairmanSPRING PRESS CONFERENCE 2008
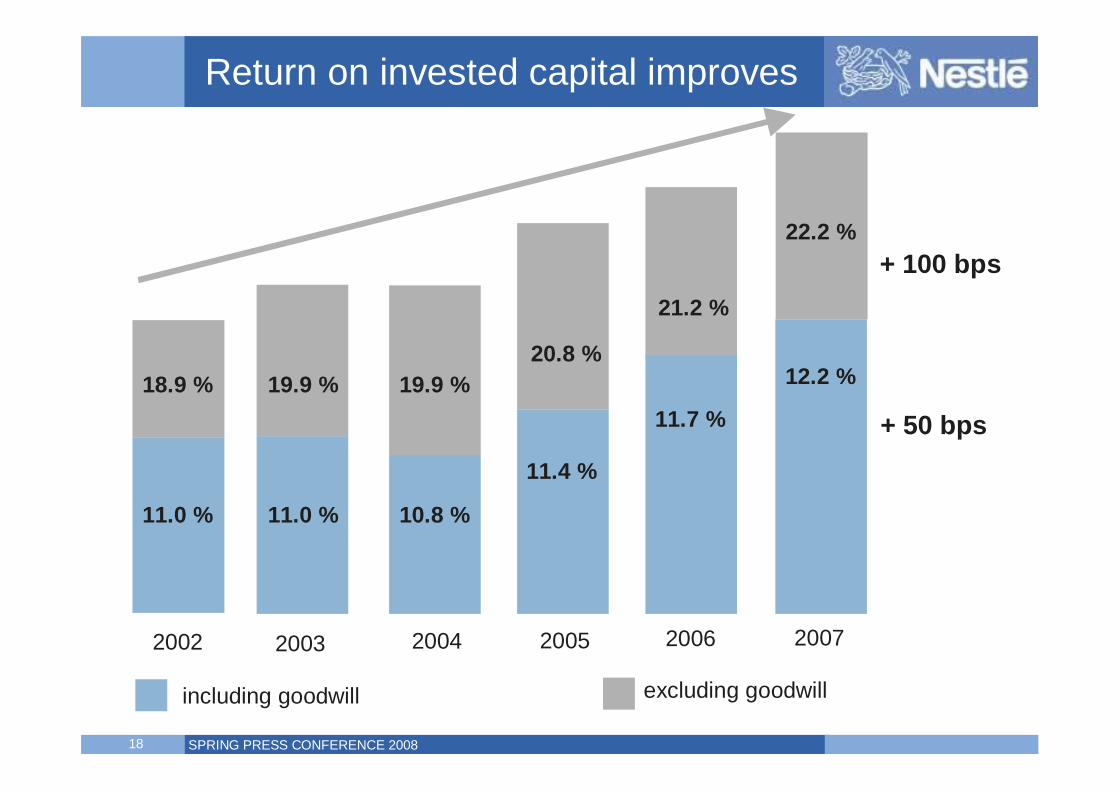
Return on invested capital improves
excluding goodwillincluding goodwill
2005
20.8 %
2002
18.9 %
11.0 %
2003
19.9 %
11.0 %
2004
19.9 %
10.8 %
+ 100 bps
+ 50 bps11.4 %
2006
21.2 %
11.7 %
12.2 %
22.2 %
2007

19 Name of chairmanSPRING PRESS CONFERENCE 2008
Acquisitions
Acquisition of Novartis Medical Nutrition
Acquisition of Gerber
Acquisition of Henniez water in Switzerland
Strategic partnership with Belgian luxury chocolate maker Pierre Marcolini
Acquisition of Ruzskaya Confectionery Factory in Russia

20 Name of chairmanSPRING PRESS CONFERENCE 2008
Disposal of canned and powdered milk category in Canada
Disposal of all Nestlé Canada Roast & Ground brands such as CLUB COFFEE, GOOD HOST, ANTHOS COFFEE, SANTOS COFFEE and MARTICAN
Schöller Private Label ice cream business in Germany
Other disposals: Margarine & Fat business in Chile, Negro confectionery business in Hungary, Jam’s culinary products (sauces and others) in Czeck/Slovak, ... Nestlébroadens strategic co-operation with Barry Callebaut in Europe
Disposal of home delivery service for ice-cream and frozen food in Germany
Divestitures
Liquid milk businesses in Thailand, Malaysia, Singapore and Brunei
Disposal of Turtle confectionery brand in USA. Kept brand in Canada

21 Name of chairmanSPRING PRESS CONFERENCE 2008
2007 Summarised
Ø 9.2 % sales growth; 7.4 % organic growth
Ø EBIT margin up 50 bps to 14 %
Ø Nestlé generated an additional - CHF 9.1 billion of sales- CHF 1.7 billion of EBIT- CHF 1.4 billion of net profit- CHF 1.7 billion of operating cash flow
Ø Well placed for further improvement in 2008 - another year of delivering the Nestlé Model- Strong EPS & share buyback contribute to outperforming long-term shareholder value creation

22 Name of chairmanSPRING PRESS CONFERENCE 2008

23 Name of chairmanSPRING PRESS CONFERENCE 2008
11 yearsaverage
Acquisitions
DivestituresForex
OG: OrganicGrowth
3.7%
2.2%
2.5%
-1.2%
OG5.9%
-1.5%
RIG Pricing & Other Acquisitions Divestitures FX Impact
Consistent Top-Line Organic Growth for the past 11 Years
% Growth
-10%
-5%
0%
5%
10%
15%
1997 1998 1999 2000 2001 2002 2003 2004 2005 2006 2007
24 Name of chairmanSPRING PRESS CONFERENCE 2008
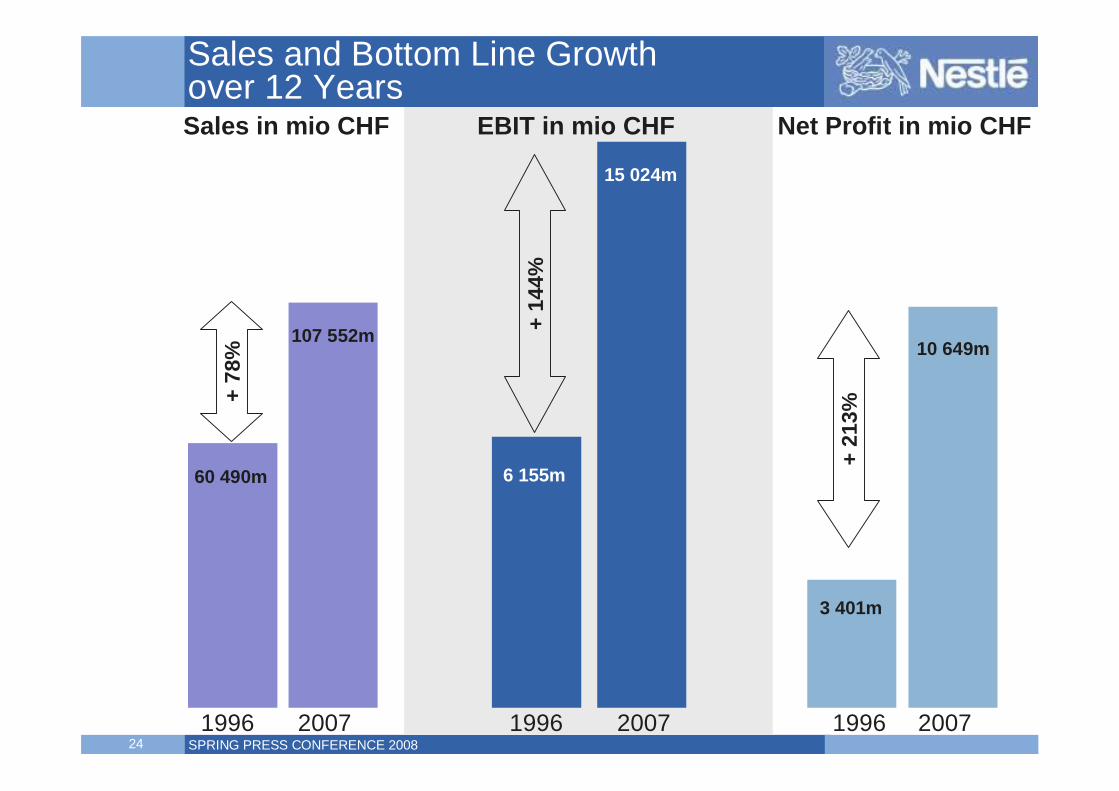
Sales and Bottom Line Growthover 12 Years
1996 1996 19962007
Sales in mio CHF
2007 2007
EBIT in mio CHF Net Profit in mio CHF
+ 78
%
+ 14
4%
+ 21
3%
60 490m
107 552m
6 155m
3 401m
10 649m
15 024m

25 Name of chairmanSPRING PRESS CONFERENCE 2008
Sales and Bottom Line Growthover 12 Years
1996 1996 19962007
Sales in mio $
2007 2007
EBIT in mio $ Net Profit in mio $
+ 84
%
+ 15
3%
+ 22
5%
48 782m
89 927m
4 964m
2 743m
8 904m
12 562m

26 Name of chairmanSPRING PRESS CONFERENCE 2008
SustenancePleasure andPleasure anddiversitydiversity
ConvenienceConvenience
5,000 13,000 22,000
Per-capita income (PPP)
Consumption of food manufacturing value-added
actual US$, per capita
28,000
Nestlé per capita sales
Sources: UNIDO (value-added), WIDER and World Bank; Nestlé F&C; analysis EIR
Growth scenario (2005-15)
+ US$ 170bn5.9% p.a.
Growth scenario (2005-15)
+ US$ 70bn6.9% p.a.
Demographics Focusing on the Low and High Ends
US$ 1,500
PPP
$240 billion opportunity PREMIUMIZATION

27 Name of chairmanSPRING PRESS CONFERENCE 2008
The Nestlé Fleet Strategy

28 Name of chairmanSPRING PRESS CONFERENCE 2008
GLOBE
• leverage our size as a strength
• unite/align the Group internally to be more
competitive externally
• exploit the power of e-technology

29 Name of chairmanSPRING PRESS CONFERENCE 2008
Total Shareholder Return over 12 Years

30 Name of chairmanSPRING PRESS CONFERENCE 2008
Nestlé Rated 7TH in Barron’s Survey: Most Respected Companies

31 Name of chairmanSPRING PRESS CONFERENCE 2008
Articles of AssociationQuorum, Majority
OLD:
attendance quorum, super majority
NEW:
two third majority of shares represented at AGM
32 Name of chairmanSPRING PRESS CONFERENCE 2008
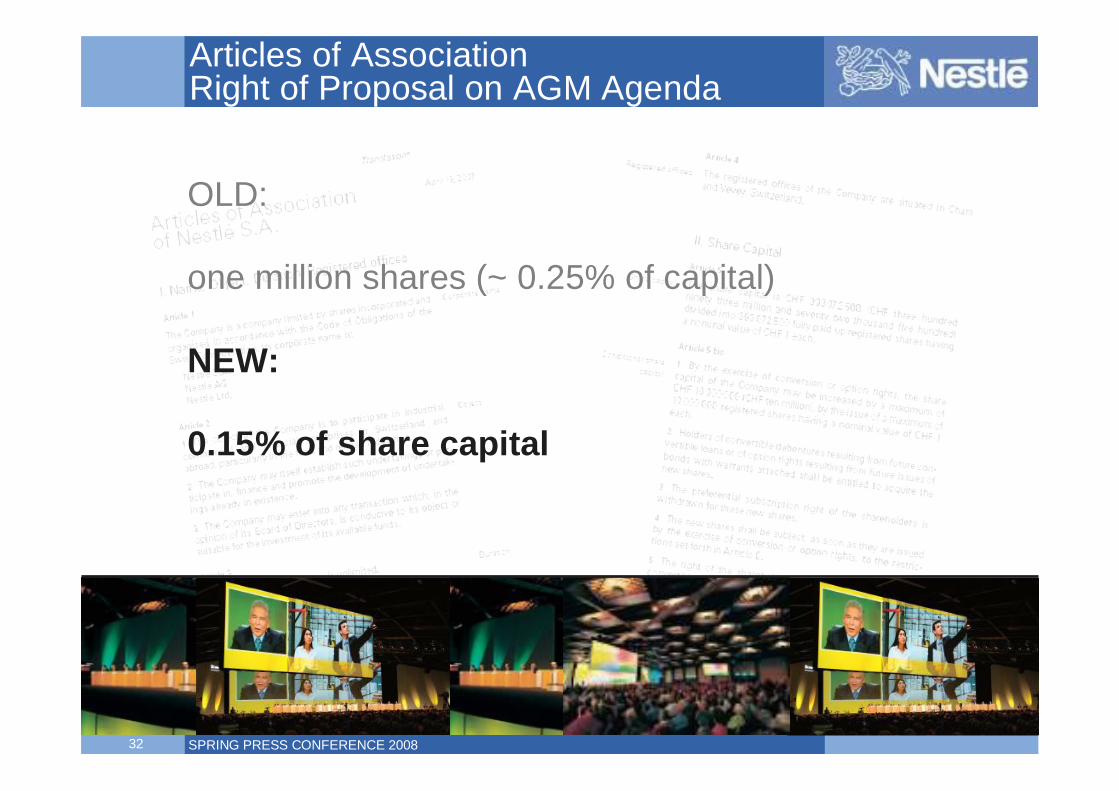
Articles of Association Right of Proposal on AGM Agenda
OLD:
one million shares (~ 0.25% of capital)
NEW:
0.15% of share capital

33 Name of chairmanSPRING PRESS CONFERENCE 2008
Articles of AssociationTerms of Office for Board Members
OLD: 5 years
NEW: 3 years

34 Name of chairmanSPRING PRESS CONFERENCE 2008
Articles of AssociationVoting Limitations
OLD: 3 percent
NEW: 5 percent

35 Name of chairmanSPRING PRESS CONFERENCE 2008
36 Name of chairmanSPRING PRESS CONFERENCE 2008
Outlook 2008 – The Nestlé Model
• Organic Growth 5 – 6 %
• Further improvement of EBIT margins
in constant currencies
• Further capital efficiency improvement
37 Name of chairmanSPRING PRESS CONFERENCE 2008

38 Name of chairmanSPRING PRESS CONFERENCE 2008
Next Media Events
10 April 2008 – Annual General Meeting21 April 2008 – First Quarter Sales
7 August 2008 – Half-Year Results23 October 2008 – Autumn Press Conference