splash screen. lesson menu five-minute check (over lesson 7–4) main idea and vocabulary example...
TRANSCRIPT


Five-Minute Check (over Lesson 7–4)
Main Idea and Vocabulary
Example 1:Make a Frequency Table
Example 2:Make a Frequency Table

• I will choose appropriate scales and intervals for frequency tables.
• scale
• interval

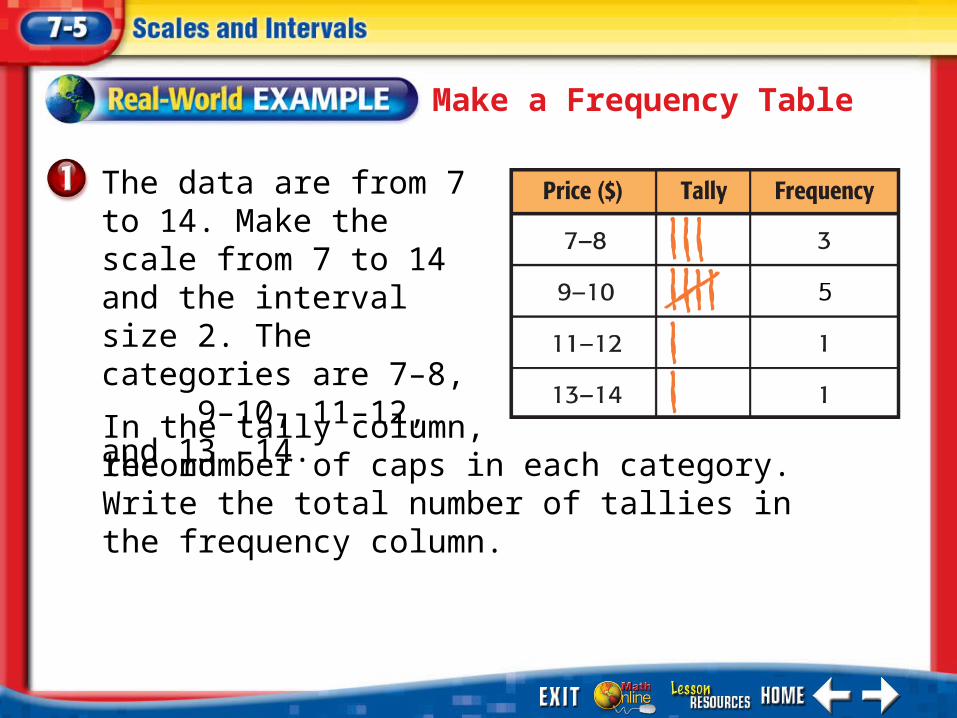
Make a Frequency Table
Choose an appropriate scale and interval size for the data. Then make a frequency table.
Make a Frequency Table
The data are from 7 to 14. Make the scale from 7 to 14 and the interval size 2. The categories are 7–8, 9–10, 11–12, and 13 –14.
In the tally column, recordthe number of caps in each category. Write the total number of tallies in the frequency column.

1. A
2. B
3. C
4. D0% 0%0%0%
A. scale 20–80; interval 10
B. scale 30–100; interval 5
C. scale 40–100; interval 20
D. scale 40–70; interval 5
Which is an appropriate scale and interval size for the data below?
41, 65, 70, 43, 55, 67, 58, 42, 44, 57, 68, 70, 61, 51, 47, 63

Make a Frequency Table
The table shows lunchtime sales for one hour. Make a frequency table of the data. Then write a sentence or two to describe how the data are distributed among the intervals.

Make a Frequency Table
The sales range from $0.99 to $9.21. You could make the scale from $0.01 to $10.00 with an interval size of $1.99.
Most sales were in the $4.01–$6.00 interval.

1. A
2. B
3. C
4. D0% 0%0%0%
Which statement best describes how the data is distributed among the intervals?
A. The cost is mostly in the 15-19 interval.
B. More than half the data is contained between a cost of 0 and 9.
C. More than half the data is within the 10-14 interval.
D. None of the values are $0.

End of the Lesson

Five-Minute Check (over Lesson 7–4)
Image Bank
Math Tool Chest
Use an Appropriate Graph

(over Lesson 7–4)
The table shows the lengths of different streets in a town. Make a frequency table of the data.

1. A
2. B
3. C
4. D
0% 0%0%0%
(over Lesson 7–4)
A. B.
C. D.

1. A
2. B
3. C
4. D
0% 0%0%0%
(over Lesson 7–4)
Find the median and mode, and range of the data. Identify any outliers.
A. median: 2, mode: 4, range: 11, outlier: 8
B. median: 2, mode: 2, range: 10, outlier: 11
C. median: 3, mode: 2, range: 11, outlier: 10
D. median: 2, mode: 3, range: 10, outlier: 9
