spillover effects of startup accelerator programs: evidence from...
TRANSCRIPT
Spillover Effects of Startup Accelerator Programs: Evidence from
Venture-Backed Startup Activity*
Daniel C. Fehder
University of Southern California
Yael V. Hochberg Rice University and NBER
April 20, 2019
We examine the spillover effects of seed accelerator programs—fixed-term, cohort-based educational and mentorship programs for startups—on venture-backed seed and early stage technology startup activity in the regions in which they locate. Accelerators are often opened with an eye towards galvanizing technology entrepreneurship activity in the region through provision of peer effects/role models. We use a difference-in-differences approach that utilizes the staggered introduction of such programs combined with matching methods and synthetic control methodologies to assess the impact of an accelerator’s arrival on the volume of seed and early stage VC deals completed in the region, excluding the accelerator’s own portfolio companies. The arrival of an accelerator is associated with a significant increase in the volume of seed and early stage deals external to the accelerator cohorts; an increase driven both by outside investor groups and the emergence of new local early-stage investors, and supporting the notion that an accelerator can lead to peer effects and provision of role models in the ecosystem that encourage additional local entrepreneurial spillover activity. The findings suggest that the introduction of such programs can have a general effect on the equilibrium of the regions in which they locate, rather than merely an effect of treatment on the treated, and suggests a role for accelerator programs in galvanizing latent regional interest in entrepreneurial activity.
* We thank Jean-Noel Barrot, Eric Floyd, Naomi Hausman, Steve Kaplan, Joshua Krieger, Daniel Lee, Josh Lerner, Fiona Murray, Ramana Nanda, Scott Stern, Juan Carlos Suarez Serrato and seminar participants at Boston College, MIT, MIT Innovation Lab Conference, Duke University, the NBER IPE Conference, Hebrew University, McGill University, University of Virginia Darden, University of Amsterdam, Tilburg University, Erasmus University, SXSW Interactive, the NBER-AIEA Annual Meeting, and the American Economic Association annual meetings for helpful comments and suggestions. This research is funded under NSF grant number 1462008. Both authors are grateful for broader financial support from the Kauffman Foundation. Hochberg is grateful for funding from the Batten Institute at the University of Virginia. Fehder is grateful for funding from Skolkovo Technical University. Both authors are research affiliates of the MIT Innovation Initiative. Please direct correspondence to [email protected] (Hochberg) or [email protected] (Fehder). All errors are our own.
1
1. Introduction
A large literature documents the geographic concentration of entrepreneurial activity (Glaeser
and Kerr, 2009; Glaeser et al., 2010; Chatterji et al., 2014). This geographic clustering of
entrepreneurial activity leads to wide disparities in regional economic growth (Acs and Armington,
2006). The roots of this clustering have been attributed to both Marshallian factors (e.g. labor
pooling, knowledge spillovers) as well as to social mechanisms such as peer effects and culture
(Glaeser and Kerr, 2009). Increasingly, policy makers have sought to generate interventions
designed to overcome shortcomings that may deter the growth of such regional entrepreneurial
clusters. One popular regional intervention in recent years is the accelerator model. These “startup
bootcamps” concentrate a cohort of entrepreneurial ventures, and provide resources and
mentorship critical to the entrepreneurial production function to a small group of startups. While
the proliferation of accelerator programs targeted towards regional economic development has
been rapid, evidence on the role and efficacy of these programs as regional interventions is scant.
Accelerator programs are relatively small in scale, with an average of around twelve startups per
cohort (Cohen et al., 2019). Thus, for such programs to be relevant in shifting the capacity of
regions to foster high growth ventures, they must be expected to engender broader spillover effects
on the regions in which they are housed. For policy makers and economists alike, a critical question
is whether accelerator programs can indeed produce local entrepreneurship spillovers.
In this paper, we attempt to assess the impact that accelerator programs can have on the
entrepreneurial ecosystem of the regions in which they are established, and whether they indeed
produce spillovers that lead to proliferation of high-growth, technology-based entrepreneurial
activity in the local area. Contemporaneous studies have found significant treatment impacts for
accelerator participants for specific individual programs (e.g. Gonzalez-Uribe and Leatherbee,
2016, Fehder, 2018), primarily attributed to education or to social factors such as peer effects and
increased social capital: since entry into entrepreneurship is heavily influenced by an individual’s
estimates of their potential success (Manso, 2016), social processes that influence the formation
of these subjective probability estimates are critical to the entrepreneurial process. Unsurprisingly,
prior studies have found significant spillovers to entrepreneurial peers in terms of fostering new
entrepreneurial entry (Giannetti and Simonov, 2009; Markussen and and Røed, 2017). Peer effects
and social capital, however, would not necessarily be limited to the individual participants of
accelerator programs. Accelerator programs may provide peer effects and role models for

2
entrepreneurs in the region in which they locate more generally; this, in fact, is a primary
justification cited by policy makers in establishing and funding such endeavors in their regions.1
These social channels quickly attenuate with geographic distance, and thus, local interventions
may be important for facilitating such effects. Consistent with these motivations, we present
evidence that suggests that the establishment of an accelerator in regions typically not considered
to be clusters of entrepreneurial activity is associated with substantial regional startup activity
spillover effects.
The accelerator programs we examine are fixed-term, cohort-based, “boot camps” for startups
that offer educational programming, expose startup founders to wide variety of mentors and
investors, and culminate in a pitch event, or “demo day” (Cohen et al, 2018). Recent estimates of
the number of accelerators range from 300+ in the U.S. to over 2000 worldwide, spanning six
continents, and the number is growing rapidly (Cohen and Hochberg 2014). Ex ante, whether such
programs can have significant impact in developing new entrepreneurial clusters is unclear. Brad
Feld, a founder of Techstars, one of the earliest accelerator programs, describes his rationale for
its establishment "as an experiment to help create more early-stage startups in Boulder."2 In
subsequent writing, Feld has suggested that accelerators are important tools for enhancing the
entrepreneurial capacity of regions and thus should be launched in nearly every city (Feld, 2012).
In contrast, Paul Graham, the founder of Y Combinator, the first and perhaps most well-known
accelerator program, argues that "[p]eople sometimes think they could improve the startup scene
in their town by starting something like Y Combinator there, but in fact it will have near zero effect.
I know because Y Combinator itself had near zero effect on Boston when we were based there . . .
People came from all over . . . and afterward they went wherever they could get more funding—
generally Silicon Valley".3 In Graham’s view, if this happened in Boston, which at the time had
the second highest allocation of venture capital in the world, this same concern would be even
more pronounced in regions with less activity than Boston. Can an accelerator truly serve to attract
startups (and investors) to a city, beyond its own portfolio companies? Can it encourage and retain
the talent required to build a venture worth funding? These conflicting views highlight two
1 Based on interviews with a variety of accelerator founders and surveys of accelerator founders conducted by
the Seed Accelerator Rankings Project and the media, see for example Ryan (2010) on the attempt to catalyze entrepreneurship in Boston’s Seaport District through support of MassChallenge, a local accelerator.
2 http://www.feld.com/archives/2013/04/government-shouldnt-be-in-the-accelerator-business.html 3 http://paulgraham.com/maybe.html

3
differing views on whether regional development is a reasonable economic rationale for
establishing accelerators.
Accordingly, we focus our efforts on the capacity of startup accelerators to facilitate increased
entrepreneurial ecosystem activity in relatively low-intensity entrepreneurship regions, where the
growth rationale motivating the establishment of accelerators is more pressing. To measure
spillovers, we wish to examine measures of startup activity that are not attributable to participants
in the accelerator program itself. As noted by Guzman and Stern (2015), common measures of
new business creation such as new business starts do not properly capture the type of high-growth
entrepreneurial startup companies which policy makers are trying to encourage when establishing
an accelerator. We therefore use VC-backed companies as a proxy for technology-oriented high
growth potential entrepreneurial activity, and focus on seed and early stage deals as a proxy for
new startup creation. To capture the spillover effects on high-growth potential technology-oriented
entrepreneurship, the primary regional outcome measure we employ is the volume of seed and
early stage venture capital (VC) deals in the region, excluding any investments in startups that
participate in the accelerator program.
That said, measuring the impact of accelerators on regional-level startup activity is complicated
by the fact that there is no source of guaranteed exogenous variation in the location of accelerators.
Importantly, however, there is considerable anecdotal and survey evidence suggesting that the
locational choices of many accelerators are rooted in the birthplace of founders who found success
elsewhere and returned home hoping to help their hometowns (Hallen et al., 2014, Seed
Accelerator Rankings Project Surveys 2013-2017), rather than in selection of regions poised for
entrepreneurial growth. In support of this anecdotal and survey evidence, we show that the
accelerators we study are founded to encourage economic development, rather than primarily
because entrepreneurial growth was already expected in the region. Using data on accelerator
founding reasons obtained from the Seed Accelerator Rankings Project (SARP), we document that
91.6% of the accelerators in the regions we study state that they were founded with a primary
objective of “ecosystem building” or “regional development.” This contrasts sharply with the
objectives stated by founders of accelerators in traditional, established entrepreneurial clusters
such as San Francisco or Boston, nearly all of whom state their primary objective as “return on
invested capital.”

4
Second, we document that, in contrast to the founders of accelerators in established
entrepreneurial clusters, accelerator founders in the regions in our sample typically have a long-
term connection to the region in which they open an accelerator; in particular, such founders are
extremely likely to have attended high school in the MSA in which they launch the program. This
considerably restricts the potential set of choice models to describe the selection of MSAs in which
to establish an accelerator in our sample, as they seem to be opened by local talent. Together, these
two patterns serve to help alleviate immediate concerns about the endogeneity of which regions
receive accelerators.
We then mimic the approaches of other studies faced with similar program evaluation settings
with potentially non-random staggered entry (e.g. Autor, 2003). First, we carefully match
Metropolitan Statistical Areas (MSAs) that are ‘treated’ with an accelerator program to other
MSAs that are very similar in terms of pre-treatment levels, growth, and trends in VC-backed
startup activity. We then exploit employ a staggered-entry difference-in-differences model with
MSA and year fixed effects to control for time-invariant differences between treatment and control
groups. Additionally, we fit MSA-specific time-trends to control not only for differences in level
of financing across treated and untreated regions (the parallel trends assumption in DD models)
but also differences in the growth rate (Autor, 2003), in order to capture any pre-trends in funding
patterns that might not be captured fully in the matching process. This approach identifies our
coefficients of interest off of changes from average trend that coincide in time (within a year) with
the founding of an accelerator. The inclusion of MSA-specific linear trends in our DD
specifications should reduce concerns about the timing of the arrival of an accelerator
considerably; we further employ multiple methods to test the robustness of our results, including
a triple-differences model comparing funding availability for a more-affected versus less-affected
industry, visual inspection of pre-trends, and fractional logit models of early and later stage deals,
to ameliorate the more obvious concerns along this dimension and show consistency with a causal
interpretation.
As an alternative, we additionally employ a synthetic control approach (e.g. Abadie and
Gardeazabal, 2003; Abadie et al., 2010). Synthetic control methods strongly complement our
difference-in-differences approach by allowing us to control for unobserved and time-varying
confounders that might endogenously affect the establishment of an accelerator in a particular
region. If, for instance, Cincinnati became a particularly attractive location for startups starting in

5
2010 specifically (e.g. because of its concentration of consumer packaged goods companies),
synthetic control methods control for this time-varying impact of unobservables, while difference-
in-differences cannot (Abadie and Gardeazabal, 2003; Abadie et al., 2010). We use the approach
outlined in Abadie et al. (2010) and extended by Cavalloet al. (2013) to multiple cases, and
construct a synthetic control for each of our treated MSAs, using an optimally-weighted convex
combination of untreated MSAs to construct the synthetic counterfactual. To the best of our
knowledge, ours is the first paper to apply this quasi-experimental design to a topic in the
entrepreneurship literature.
Our estimates suggest a significant potential role for accelerators in creating spillovers of
entrepreneurial activity in the local ecosystem. In our difference-in-differences model with a
strictly matched sample, fixed effects, and linear time trends, the arrival of an accelerator is
associated with an annual increase of 103% in the number of seed and early stage VC investments
in the MSA involving startups that did not attend the accelerator. Additionally, not only do our
estimates suggest an increase in the number of venture backed startups in the regions, but they also
suggest that the amount of funding provided to these companies increases disproportionately: we
observe an increase of 265% in the log total dollar amount of seed and early stage funding provided
in the region, again excluding accelerator portfolio companies.
Importantly for regional entrepreneurial capacity, when we examine the source of these deals,
we find that the arrival of an accelerator is associated with a 88% increase in the number of distinct
investors investing in the region. Importantly, this increase in the number of distinct investors
following the establishment of an accelerator comes both from attraction of active investors from
outside the region as well as an increase in local investment groups, suggesting an increase in
overall regional capacity. Our results using the synthetic control approach mirror the results
obtained using the matched-sample difference-in-differences methodology. Treated MSAs
experience significantly higher deal volume, excluding accelerator participants, and exhibit
emergence of new investor groups after the arrival of an accelerator.
In the absence of a natural experiment, however, we are explicit about the limitations of our
empirical approaches. We do not make definitive claims for causality, though we provide evidence
to alleviate concerns about many of the more obvious potential sources of endogeneity in our
sample. In sum total, however, our findings would be consistent with a causal effect.
6
Overall, our findings appear to be consistent with the argument that establishing an accelerator
can have a significant effect on high-growth entrepreneurial activity in the regional ecosystem,
beyond its effects on its own participants. The data are consistent with policy makers’ beliefs that
accelerators can have significant influence on the population of entrepreneurs who are interested
in founding companies locally, through peer effects and provision of role models that shift beliefs
regarding the probabilities of successful undertaking of entrepreneurial activity in the area,
irrespective of whether they participate in the accelerator program. This shift in equilibrium and
our finding on the creation of new local investor groups is also consistent with accelerators having
the ability to deliver, through encouragement of broader entrepreneurial activity, enough new
additional startup formation such that an investor will be willing to incur the fixed costs associated
with investing in a new class of financial instruments (early-stage equity investments) or in a new
region.4
Our results contribute to multiple literatures. First, we contribute to a small but growing
literature exploring the role and effects of new institutional players such as accelerator programs
in the startup ecosystem. Until now, this research has focused on the effect of treatment on the
treated for ‘accelerated’ startups (Gonzalez-Uribe and Leatherbee, 2016; Fehder, 2018). Many
studies of entrepreneurial policies and programs focus on firm-level dependent variables, however
existing research suggests that policies which seem “effective” at the individual firm level can
have indeterminate or negative impacts on the regional economy (Davis, Haltiwanger, and Schuh,
1998). In contrast to the prior studies, we focus our study on the overall regional effects of such
initiatives, and provide evidence suggestive that in the case of accelerators, there may also be
positive spillover effects consistent with policy maker motivations.
Second, we contribute to the literature that traces the impact of social factors such as peer
effects on geographic clustering of entrepreneurial activity. A similar influence of peer effects has
been documented in the formation of behavioral preferences such as risk aversion and trust as well
4 It is important to note that it does not appear that venture investment trivially follows the opening of an
accelerator due to some sort of pre-commitment on the part of investors to invest in the accelerator alumni or in the region. While some accelerators are funded by VC dollars, many are funded initially by their founders, who are typically former successful entrepreneurs. Furthermore, the costs to launch a startup accelerator are in the low hundreds of thousands (around $200-250 thousand), a relatively cheap option purchase for a single investor, let alone a group of investors. Based on our extensive discussion with accelerator founders and VCs who have invested in accelerators, no pre-commitments to invest in accelerator graduates are made by VC investors (this notion was summarily dismissed by every person we spoke to). Rather, investors in a startup accelerator are taking an option on a future stream of projects that (hopefully) have been vetted and improved. Their willingness to exercise those options is another matter entirely.

7
as the making of financial decisions (Ahern et al., 2014; Shue, 2013). Prior literature has
documented a number of social channels for peer influences including co-workers (Nanda and
Sorensen, 2010), family (Lindquist et al., 2015), and university alumni ties (Kacperczyk, 2013).
Unsurprisingly, therefore, other scholars have found significant spillovers to entrepreneurial peers
in terms of fostering new entrepreneurial entry (Giannetti and Simonov, 2009; Markussen and and
Røed, 2017). Our findings suggest that even interventions aimed at direct interaction with a small
number of startups can have larger spillovers, through the provision of role models and peers that
enhance prospective entrepreneurs’ subjective estimates of the likelihood of their success.
Lastly, we attempt to bridge programmatic evaluation of accelerators to a broader literature on
the regional and geographic context of economic growth through innovation and entrepreneurship.
In this particular case, the outcome we explore—growth-oriented innovation-driven
entrepreneurial activity—is considered a critical element in the entrepreneurial ecosystem, and has
been shown to be tightly tied to economic growth (Decker et al., 2016; Decker et al., 2018; Guzman
and Stern, 2018). Researchers have long noted the localization of economic activity, and recent
work confirms the clustering phenomenon for entrepreneurship (Glaeser and Kerr, 2009), while
also describing the shape and content of these clusters (Delgado, Porter and Stern, 2010). The
arrival of startup accelerators provides a new context that provides additional insight into how
shifts in a region's institutional support for entrepreneurs can influence its capacity for innovation
and entrepreneurial activity more broadly.
The paper proceeds as follows. Section 2 introduces the accelerator model and its relationship
to local entrepreneurial activity, and discusses the research to date. Section 3 describes the data.
Section 4 presents the methodological approach and results. Section 5 discusses and concludes.
2. Seed Accelerators
The formal definition of a startup or seed accelerator, first offered by Cohen and Hochberg
(2014), is a fixed-term, cohort-based program, including mentorship and educational components,
that culminates in a public pitch event, often referred to as a ‘demo-day.’ Some accelerator
programs, though not all, provide a stipend or small seed investment (a minimum of $28 thousand
on average, with a range from $0 to $120 thousand) to their startups, and receive an equity stake
8
in the portfolio company in return, typically 5-7%.5 Most offer co-working space and other
services in addition to mentorship, educational and networking opportunities. Some also offer a
larger, guaranteed investment in the startup, in the form of a convertible note, upon graduation.
While many accelerators are generalists across industries, others are vertically-focused
(healthcare, energy, digital media). Despite the vertical or industry focus, careful examination of
the products/services provided by the portfolio companies of accelerators reveals that nearly all
accelerator portfolio startups offer some form of software or internet services, though such
software may be targeted towards use in a specific industry vertical.6
The emergence of accelerators has been facilitated by a significant fall in the costs of
experimentation over the last decade (e.g. Ewens, Nanda and Rhodes-Kropf, 2016). The capital
requirements to seed a startup software company have fallen dramatically along with the cost of
experimentation; where building a software company may have cost $5 million on average 10
years ago, today it can often be accomplished with $500 thousand, and startups can often
accomplish with a $50 thousand seed investment what used to take $500 thousand to $1 million.
This has allowed accelerators to provide meaningful assistance to startup portfolio companies with
a seed investment or stipend as low as $15 thousand, or even without provision of funding.
In practice, accelerator programs are a combination of previously distinct services or functions
that were each individually costly for an entrepreneur to find and obtain: value-added mentorship
and advisement, co-working/co-location with other startup companies, capital introductions and
exposure, network building, and the opportunity to pitch to multiple investors, and in some cases,
seed investment. The likely result of these services is a reduction in search costs for the
entrepreneur, and possibly an increase in leverage vis-a-vis potential VC investors. Indeed,
accelerators often attempt to be an organized version of the “dealmakers” described in Feldman
and Zoller (2012), drawing the community together and creating social capital surrounding
entrepreneurial efforts.7
5 Summary statistics obtained from the Seed Accelerator Rankings Project (Gilani and Quann 2011, Hochberg
and Kamath 2012 and Hochberg, Cohen, Fehder and Yee 2014), which uses proprietary data collected annually from accelerator programs to assess the relative quality of U.S.-based programs. Additional descriptive statistics on accelerator programs and their participants are detailed in Cohen, et al. (2018).
6 The Seed Accelerator Rankings Project tracks the identity and focus of the portfolio companies for most established (2 cohorts +) accelerators.
7 Notably, accelerators differ considerably from existing institutional structures in the entrepreneurial ecosystem, such as incubators. Incubators are primarily real estate ventures, offering startup co-working space at reduced rent. Incubators, unlike accelerators, lack a fixed term, and experience continuous entry and exit of startup groups, which stay resident for much longer periods of time (1-4 years on average versus 3-4 months for an accelerator). Most offer

9
From the perspective of the VC investors, accelerators serve a dual function as deal sorters and
deal aggregators. The accelerator application process screens among a larger population of startups
to identify high-potential candidates, and the program aggregates these candidates in a single
location, attracting investors who might otherwise find the costs of searching for opportunities in
smaller regions too high to justify. Investors often serve as mentors, thus getting an early look at
the startups, business plans, team dynamics and progress over the term of the program. The public
demo day, or pitch event, allows them to observe multiple companies pitch in a single instance,
and since they are already traveling to the region, non-local investors often choose to look at other
opportunities in the area as well. The aggregation and sorting function performed by accelerators
is thus believed to result in a reduction in search and sorting costs for the VCs when investing in
smaller regions.
The existing research on accelerator programs primarily is descriptive or compares accelerated
startups to non-accelerated companies. In the descriptive category, Cohen and Hochberg (2014)
offer the first formal definition of an accelerator program, distinguishing accelerators from other
types of programs that have similar or related goals. Isabelle (2013) presents a comparison of
accelerators to incubators, while Miller and Bound (2011) provide descriptions of the accelerator
model. Radojevich-Kelley and Hoffman (2012) presents case studies of a small number of early
U.S.-based programs. Cohen, et al. (2019) present descriptive evidence on variation in the design
of accelerators and their impact on individual participant performance and funding.
A second emerging set of empirical studies compares startup companies that complete
accelerator programs to other populations of startups that did not attend accelerator programs.
Hallen, Cohen and Bingham (2014) compare accelerated startups that eventually raise venture
capital to non-accelerated ventures that eventually raise venture capital. They find that graduating
from a top accelerator program is correlated with a shorter time to raising VC, exit by acquisition,
and achieving customer traction. Winston-Smith, et al. (2015) compare ventures that have
participated in two of the leading accelerators, TechStars and Y Combinator, to similar ventures
that do not go through these programs but instead raise angel funding. They find that startups that
graduate from these top two programs achieve exit (acquisition or failure) faster than their
fee-based professional services. They do not offer investment or stipends, and their educational and mentorship offerings, if provided, are ad hoc at best. Incubators are primarily thought to shelter vulnerable nascent businesses from the harsh realities of the real world, while accelerators force startups to quickly confront those realities and determine whether the business is viable (Cohen and Hochberg 2014).
10
matched, angel-funded counterparts, due to both higher acquisition rates and higher failure rates
than for angel-funded startups. This increased speed of failure is also found in Yu (2014), utilizing
a different sample of accelerated and matched controls.
Other studies examine the impact of particular individual accelerator programs. Fehder (2018)
performs a regression discontinuity study of one large program, and finds a significant positive
treatment effect for companies that complete that program. Gonzalez-Uribe and Leatherbee (2016)
use variation in the provision of services across portfolio companies to identify the impact of
certain elements of one particular program, Startup Chile, finding that admission to the program
alone did not produce a treatment effect, but access to intensive mentoring and peer effects did
have a performance impact.
These early-stage studies are focused on the outcomes for accelerator portfolio companies: in
other words, they are interested in the effect of treatment on the treated (do accelerators add value
to the companies that attend them). Outcomes, however, are difficult to measure in this setting,
and endogeneity issues are rife. Furthermore, if accelerators serve to shift the general equilibrium
of the entrepreneurial ecosystem by increasing overall entrepreneurial entry and encouraging the
emergence of increased resources for both the treated and the non-treated in a region, studies of
this nature will not be able to properly capture the full effects of accelerators. Here, we instead
take a complementary approach, examining the regional effects of programs on the quantity of
spillover activity in the local entrepreneurial ecosystem outside of the accelerator participants,
rather than the treatment effect of the accelerator on the treated startups.
3. Data
Our sample is derived from a list of 59 accelerators that were founded in 38 MSAs in the
United States between 2005 and 2013, leaving sufficient post-period to measure outcome activity.
We create an exhaustive list of accelerators from a number of sources, including thorough web
searches and lists compiled through active engagement with the accelerator practitioner
community by the Seed Accelerator Ranking Project (http://www.seedrankings.com) (SARP). Our
dataset covers 2003 through 2013 and thus includes the entire early development of accelerators
as an institution in the United States. The list of the accelerators included in our analysis is included
in Table 1. Notably, many accelerators are located in regions that are not typically thought of as
hot beds of startup or VC activity. For example, of the ten accelerators launched from 2005 to

11
2009, only two located in known startup clusters (Silicon Valley and Boston, MA). The remaining
eight located in what were, at the time, relatively inactive locations, such as Boulder, CO,
Philadelphia and Pittsburgh, PA, Dallas, TX and Providence, RI. Anecdotal evidence from books
and interviews with accelerator founders suggests that this pattern emerges precisely because many
programs were founded by hometown entrepreneurs who had made their money elsewhere and
who wished to return to try and establish a startup cluster in their region.
For each of the accelerators in our list, we code a number of variables. First, we note the
founding year as the year in which the first cohort of the accelerator graduated and had a demo
day. We exclude accelerators from our analysis if they did not graduate at least two cohorts. Next,
we note the MSA region in which the accelerator is located. Third, we note whether the accelerator
was ranked in the top fifteen in the 2013 Seed Accelerator Rankings.
For each MSA region in the United States, we create a dichotomous variable that indicates
whether a startup accelerator has been established in the region (TREATED) and a variable that
indicates when the region received its first accelerator (TREAT YEAR). We collect a range of
outcome and control variables at the MSA-Year level. Table 1 describes each of the variables we
collect and their sources. We obtain per capita income and employment at the MSA-year level
from the U.S. Census. We obtain an annual count of utility patents issued to entities or individuals
in the MSA from the United State Patent and Trademark Office. We obtain an annual count of
Science, Technology, Engineering and Mathematics (STEM) graduate students in each MSA and
annual university research and development spending in the MSA from the National Science
Foundation. Finally, we obtain an annual count of new firms in each MSA from the U.S. Census
Business Dynamics Statistics tabulation.
Our analysis contains three outcome variables each obtained from Thomson-Reuter’s
VentureXpert. First, we measure the number of distinct seed and early stage VC deals that occur
each year in each MSA (NUMBER DEALS) for companies in “Internet Specific” and “Computer
Software” companies. We focus on these company classifications because all but two of the four
hundred accelerator portfolio companies that we have records for are classified by VentureXpert
in these two categories. We use company name, founder names and location data to match the
VentureXpert data to a list of startups in each accelerator generated from the SARP data.
Importantly, SARP tracks all name changes and aliases (“DBA”) associated with portfolio
companies on an ongoing basis, thus easily allowing us to identify accelerator participants in later
12
years even if they have changed names multiple times. Using the SARP list of all startups that
attended the accelerators in our sample and their name changes and aliases/DBAs, we are able to
exclude investments in these startups from our sample, thus restricting our outcomes measures to
non-accelerator participants, a necessary condition to measure spillovers.
Having restricted the outcome data to non-accelerator participants, we further code the total
sum of seed and early stage VC dollars invested each year at the MSA level (FUNDS INVESTED)
in the two classifications, again excluding accelerator portfolio companies. Last, we note the count
of distinct investors making investments in each MSA each year (DISTINCT INVESTORS). We
further break our total count of investors into separate counts of investors whose fund is
headquartered more than 100 miles8 from the startup company (DISTANT INVESTORS) and
investors whose fund is headquartered less than 100 miles (NEAR INVESTORS). Note that these
investments are external investments by venture capital firms, not the accelerator. We do not
include participants in the accelerators themselves in any of our outcome measures.
The resulting sample is a panel with observations at the MSA x Year level. Panel A of Table
3 provides the descriptive statistics for our entire sample across all U.S. MSA regions and all years,
segmented by ever-treated or never-treated status. For this comparison, we include all U.S. cities,
including known entrepreneurial clusters. Even excluding accelerator graduates, comparing the
overall sample means of the never-treated regions to overall means of the treated regions reveals
that treated regions exhibit statistically significant higher levels of venture financing activity both
in terms of Funds Invested and Number of Deals. Treated regions also exhibit higher levels of
other covariates associated with startup formation. In addition, comparison of the change in
number of deals across treated and untreated regions over the course of the sample period reveals
that treated regions differ significantly from untreated regions not only in terms of level but also
growth rate of entrepreneurial financing events. As we next show, however, much of this is driven
by the inclusion of known startup-activity clusters, such as Silicon Valley.
Panel B of Table 3 demonstrates the skewness of the distribution of entrepreneurial financing
events by dropping the MSAs associated with the San Francisco Bay Area (Silicon Valley) and
Boston from the summary statistics for the treated regions. Simply removing these regions from
8 We calculate this distance as the geodetic distance between the geographic center of the zip codes reported for
both the startup company and the investment firm. We chose 100 miles as a distance where a venture capitalist could fly there and back in a day or drive to the startup’s office in a day. We obtain similar results when employing smaller radii.

13
the summary statistics decreases the overall sample means for both Funds Invested and Number
of Deals by roughly half in the treated column. The modal number of the funding events across all
MSA-years is zero, while a few MSAs have a large number of yearly events. The differences
between Panel A and Panel B of Table 3 underline the importance of finding the properly matched
treatment and control groups so that our results are not driven by the large apparent differences in
the level and growth rate of entrepreneurial financing events in treated and non-treated regions.
4. Empirical Analysis
Our research seeks to measure the impact of startup accelerator formation on the venture-
backed startup activity in an MSA excluding startups directly “treated” by an accelerator through
participation in their program. As discussed above, startup accelerators can serve to increase
entrepreneurial entry in a region through peer effects, role models and other social mechanisms. If
so, the presence of an accelerator should be associated with an increase in the level of startup
activity in a region.
An examination of the raw data provides initial indications that such spillover effects may be
present. Data on accelerator portfolio company identities obtained from the Seed Accelerator
Rankings Project allows us to match funding activity in the region to the companies that completed
the accelerator program. As an example, consider the MSA that includes Boulder, CO. TechStars
Boulder was founded in 2007. In the period preceding the founding of TechStars, Boulder saw an
average of 4.8 seed and early stage software and IT VC deals per year. Post-arrival of TechStars,
from 2007-2013, the average number of deals in the Boulder MSA rose to 10.7 deals per year, a
5.9 deal increase. However, during this period, only 2.3 deals per year, on average, involved
companies that had graduated from TechStars Boulder. Similarly, consider Cincinnati, OH, home
of The Brandery, and accelerator founded in 2010. Pre-arrival of The Brandery, Cincinnati
experienced, on average, 0.55 early stage VC deals per year – about one deal every two years.
After The Brandery was established, in the period 2010-2013, Cincinnati averaged 4 deals per
year—an increase of 3.45 deals per year. However, only 1.45 deals per year on average in this
period involved a Brandery graduate startup.
We can perform a similar tabulation for each of the treated MSAs for which we are able to
obtain a list of portfolio companies from the Seed Accelerator Ranking Project. Across these
MSAs, on average, seed and early stage financing deals of startups that graduated from the

14
accelerator represent only 30.4% of the increase in the annual number of seed and early stage
financing deals post-treatment. This hints at a more general effect on startup activity in the region,
consistent with the notion that an accelerator program may serve as a catalyst to encourage latent
local entrepreneurial entry.
At the same time, conceivably, startup accelerators may be more likely to be founded in regions
that have higher levels of startup activity or have experienced (or are about to experience) swift
growth in that activity. Thus, from an analysis perspective, our goal is—to the extent possible
given the setting and data—to separate the causal impact of startup accelerator formation from the
endogenous selection of startup accelerators into “hot” regions for startup activities.
Of course, the founding of an accelerator in a given MSA is potentially a function of variables
that are unobserved by the econometrician. While we know from interviews with founders that
any number of accelerator programs were established by former entrepreneurs for altruistic reasons
such as a desire to support a hometown community or develop an ecosystem in an area that had
none, a concern still remains that the regions in which they were established differ in a systematic
fashion from regions that do not receive an accelerator.
By restricting our analysis to regions with less-developed entrepreneurial communities, our
particular endogeneity concern—namely, that accelerator founders select the region in which to
found their accelerator based on variables that are unobservable to the econometrician and bias our
estimates upward—is reduced. Anecdotal evidence as well as surveys and interviews conducted
by the Seed Accelerator Rankings Project (SARP) and others strongly suggest that accelerator
founders in our regions of interest primarily founded accelerators out of altruistic or regional
growth oriented objectives. In fact, most accelerator founders in these regions demonstrate deep
roots and ties to the region in which they found their accelerator program. In contrast, accelerator
founders in regions with active, well-established entrepreneurial ecosystems, such as Silicon
Valley and Boston/Cambridge, tend to be founded by outsiders who recount that they came to the
region to take advantage of the prior existence and growth of these ecosystems, rather than to grow
them.9
We lend support to this anecdotal evidence more formally by comparing regions that received
accelerators that are in and out of our sample. The Seed Accelerator Rankings Project (SARP)
9 Consistent with this assumption, each of the top five regions for total yearly venture capital allocations received
startup accelerators relatively early in the diffusion of this organizational form (Cambridge, MA and Silicon Valley were the first two locations).
15
collects information from each of their participating accelerator programs regarding the primary
reason for the founding of the accelerator, including the options “ecosystem building,” “regional
development,” and “return on invested capital.” Using this data, we find that 91.6% of the
accelerators in the regions we include in the matched sample state that they were founded with a
primary objective of “ecosystem building” or “regional development.” This contrasts sharply with
the objectives stated by founders of accelerators in traditional, established entrepreneurial clusters
such as San Francisco or Boston, nearly all of whom state their primary objective as “return on
invested capital.”
We then econometrically address the potential for omitted variables bias in multiple ways.
First, we create a set of matched control and treatment MSAs using a dynamic hazard rate model;
we match MSAs on both the level of and growth trends in VC financing pre-accelerator arrival.
Our specification allows for non-linearity in such growth. Second, for each model we run an
additional regression with the inclusion of MSA-specific linear time trends, to absorb any
remaining linear trend differences. Third, we estimate a triple differences model using early stage
investment into semiconductor startups as an untreated industry which adds industry variation
within each MSA. Fourth, we employ a synthetic controls methodology. Taken together, these
four approaches allow us to examine the robustness of our regression models to different forms of
misspecification. Each of these four approaches is discussed in turn below.
4.1 Matched Sample
In other contexts, researchers have found that short-term changes, such as a wage dip, can drive
a treatment decision, like attending a job-training program (Ashenfelter, 1978; Abadie, 2005). To
address such concerns in our context, we match the treated regions to regions without accelerators
whose growth dynamics are similar to those of the MSAs in which accelerators are founded in the
period prior to arrival of an accelerator to a region. By choosing control regions which match the
treated regions on past growth dynamics leading up to the founding of the accelerator, we hope to
minimize the chance that our measured impact of the accelerator founding is driven by short term
fluctuations in the attractiveness of a region for early stage investors and entrepreneurs. Matching
also has the additional advantage of matching the never-treated regions to treated regions in
specific event time, such that each matched never-treated region observation has a clear “PRE”
and “POST” event period.
16
We match our treated MSAs to untreated MSAs that are substantially similar to the treated
MSAs in pre-treatment year trends likely to affect the attractiveness of the region for early stage
funding. To create our matched sample, we first estimate a dynamic hazard rate model of the form:
ℎ(𝑡𝑡,𝑚𝑚𝑚𝑚𝑚𝑚) = 𝑓𝑓(𝜀𝜀𝑡𝑡,𝑀𝑀𝑀𝑀𝑀𝑀; 𝛽𝛽0 + 𝛽𝛽𝑡𝑡𝑉𝑉𝑉𝑉𝑡𝑡,𝑀𝑀𝑀𝑀𝑀𝑀 + 𝛽𝛽𝑡𝑡−1Δ𝑡𝑡−1,𝑀𝑀𝑀𝑀𝑀𝑀 + 𝛽𝛽𝑡𝑡−2Δ𝑡𝑡−2,𝑀𝑀𝑀𝑀𝑀𝑀 + 𝛽𝛽𝑡𝑡−3Δ𝑡𝑡−3,𝑀𝑀𝑀𝑀𝑀𝑀),
(2)
where h(t) is the point hazard of an accelerator being founded in that MSA and in that year.
𝑉𝑉𝑉𝑉𝑡𝑡,𝑀𝑀𝑀𝑀𝑀𝑀 is the count of seed/early stage venture capital deals in that MSA and in that year. The
delta terms (Δ𝑡𝑡−1,𝑀𝑀𝑀𝑀𝑀𝑀, Δ𝑡𝑡−2,𝑀𝑀𝑀𝑀𝑀𝑀, and Δ𝑡𝑡−3,𝑀𝑀𝑀𝑀𝑀𝑀 ) measure the differences in the current number of
early stage deals in that MSA to the levels one, two and three years previously respectively, thus
capturing possible nonlinearities in the growth prior to accelerator arrival. Thus, our hazard rate
model flexibly estimates how both the level and the short-term rate of change in venture-backed
startups predict the arrival of an accelerator in a given MSA region. We thus obtain an
instantaneous probability, based on current levels of venture-backed startup activity, that an
accelerator will choose to locate in a specific MSA in a specific year.
Using the estimates for each region from the dynamic hazard rate model, we then choose a
match for each treated region by finding the untreated region with the most similar probability of
founding an accelerator in the year of treatment (with replacement) when the treated region is on
the common support. As discussed in the introduction, we are specifically focused on
understanding the impact of accelerators in regions with less developed startup infrastructure. The
use of this matching procedure means that regions such as Silicon Valley and the
Boston/Cambridge region, where accelerators are much more likely to be established with the goal
of capturing increasing startup activity, and which do not have a natural counterpart in the
population of potential control MSAs, will not have control matches and therefore will naturally
be excluded from the analysis. Thus, our matching procedure is such that the excluded regions are
regions with disproportionately rich entrepreneurial ecosystems, and their exclusion allows us to
properly examine the appropriate counterfactual for the research question at hand: the effect of an
accelerator’s founding on regions looking to create an ecosystem or induce the creation of
entrepreneurial activity.
Table 4 explores the differences between the treated and non-treated regions in our matched
sample. The matching procedure, which requires matched and treated MSAs to be on the common

17
support, leaves us with 23 treated MSAs that have substantially similar matched MSAs for the
estimation. In contrast to the patterns exhibited in Table 3 for the full sample, the differences
between the treated and untreated groups in the matched sample are far smaller. Indeed, when we
compare the means for each of the variables in Table 4 for the pretreatment period of the treated
and untreated MSA regions, we find no significant differences for any of the financing variables,
though there remain some statistically significant differences between the two populations for the
university R&D funding, firm births, and employment variables. In the subsequent regressions, we
are careful to control for these differences by adding these variables as controls. Nevertheless, and
importantly, the matching procedure appears to purge these two populations of their differences in
both the level and growth rate of entrepreneurial financing events.
In Table 5, we present additional supporting evidence for the use of this matched sample to
alleviate endogeneity concerns, using data collected by SARP and through web searches on
accelerator founder origins. Column (1) of Table 5 shows the statistics for accelerated regions that
had no close matches in untreated regions and were thus excluded from our analysis while column
(2) shows those from in our hazard-rate matched sample. In the first row, we compare proportion
of accelerator founders who went to high school within 150 miles of where they established their
accelerator. In our hazard-rate matched sample, the mean is nearly 50%, while the proportion in
the excluded regions are lower by a statistically significant 19.3%. This pattern is repeated in the
second row, where we examine distance between a founder's high school and accelerator location
as a continuous variable. Accelerator founders in our sample are far more likely to have local
connections to the MSA in which they open their accelerator. If these locations are chosen for
reasons orthogonal to their immediate economic potential, as suggested by the stated primary
objectives of the accelerator population we study, then endogeneity concerns are substantially
reduced. In the remainder of the rows of Table 5, we show that accelerators founders outside of
our hazard-rate matched sample do seem to choose locations based on the scale and growth of
entrepreneurial activity in their chosen locations; lending credence to both the fact that these
endogeneity concerns are warranted, but also to the fact that such behavior is largely purged from
our matched sample (further exploration of this issue is presented in Appendix C). While this helps
to mitigate concerns about specific endogeneity in our sample, we will additionally employ
multiple econometric approaches to further lend support to a causal interpretation of our findings.
18
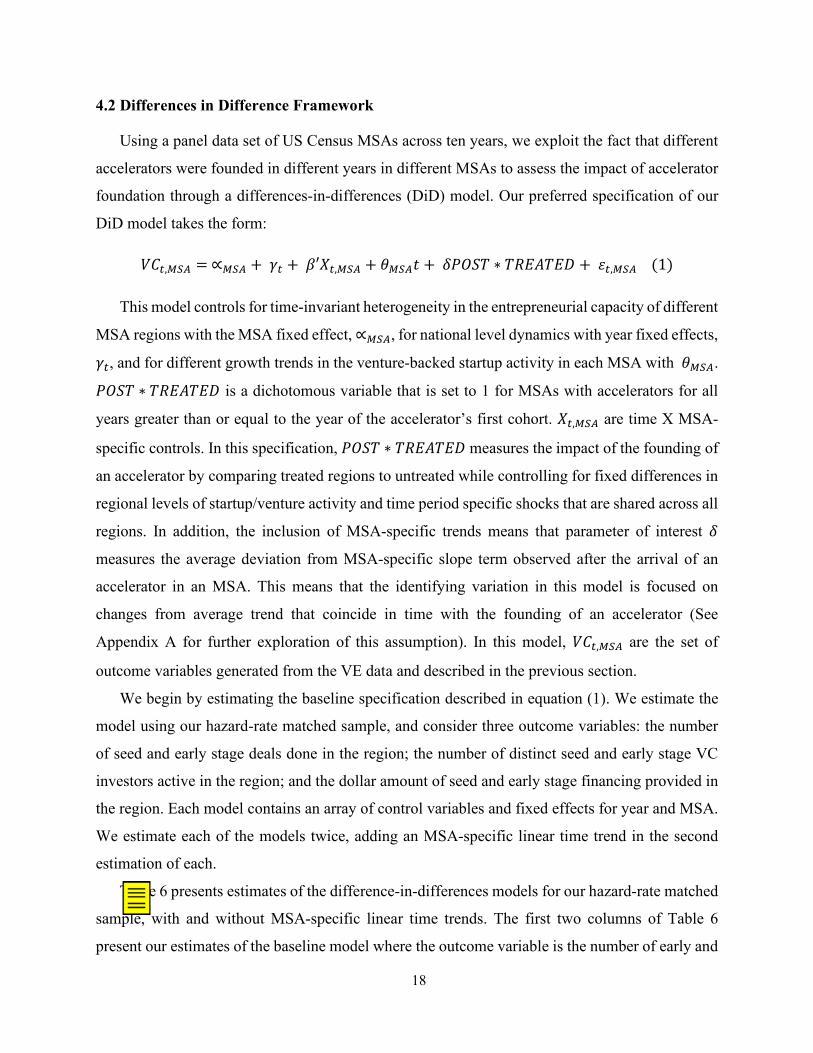
4.2 Differences in Difference Framework
Using a panel data set of US Census MSAs across ten years, we exploit the fact that different
accelerators were founded in different years in different MSAs to assess the impact of accelerator
foundation through a differences-in-differences (DiD) model. Our preferred specification of our
DiD model takes the form:
𝑉𝑉𝑉𝑉𝑡𝑡,𝑀𝑀𝑀𝑀𝑀𝑀 = ∝𝑀𝑀𝑀𝑀𝑀𝑀 + 𝛾𝛾𝑡𝑡 + 𝛽𝛽′𝑋𝑋𝑡𝑡,𝑀𝑀𝑀𝑀𝑀𝑀 + 𝜃𝜃𝑀𝑀𝑀𝑀𝑀𝑀𝑡𝑡 + 𝛿𝛿𝛿𝛿𝛿𝛿𝛿𝛿𝛿𝛿 ∗ 𝛿𝛿𝑇𝑇𝑇𝑇𝑇𝑇𝛿𝛿𝑇𝑇𝑇𝑇 + 𝜀𝜀𝑡𝑡,𝑀𝑀𝑀𝑀𝑀𝑀 (1)
This model controls for time-invariant heterogeneity in the entrepreneurial capacity of different
MSA regions with the MSA fixed effect, ∝𝑀𝑀𝑀𝑀𝑀𝑀, for national level dynamics with year fixed effects,
𝛾𝛾𝑡𝑡, and for different growth trends in the venture-backed startup activity in each MSA with 𝜃𝜃𝑀𝑀𝑀𝑀𝑀𝑀.
𝛿𝛿𝛿𝛿𝛿𝛿𝛿𝛿 ∗ 𝛿𝛿𝑇𝑇𝑇𝑇𝑇𝑇𝛿𝛿𝑇𝑇𝑇𝑇 is a dichotomous variable that is set to 1 for MSAs with accelerators for all
years greater than or equal to the year of the accelerator’s first cohort. 𝑋𝑋𝑡𝑡,𝑀𝑀𝑀𝑀𝑀𝑀 are time X MSA-
specific controls. In this specification, 𝛿𝛿𝛿𝛿𝛿𝛿𝛿𝛿 ∗ 𝛿𝛿𝑇𝑇𝑇𝑇𝑇𝑇𝛿𝛿𝑇𝑇𝑇𝑇 measures the impact of the founding of
an accelerator by comparing treated regions to untreated while controlling for fixed differences in
regional levels of startup/venture activity and time period specific shocks that are shared across all
regions. In addition, the inclusion of MSA-specific trends means that parameter of interest 𝛿𝛿
measures the average deviation from MSA-specific slope term observed after the arrival of an
accelerator in an MSA. This means that the identifying variation in this model is focused on
changes from average trend that coincide in time with the founding of an accelerator (See
Appendix A for further exploration of this assumption). In this model, 𝑉𝑉𝑉𝑉𝑡𝑡,𝑀𝑀𝑀𝑀𝑀𝑀 are the set of
outcome variables generated from the VE data and described in the previous section.
We begin by estimating the baseline specification described in equation (1). We estimate the
model using our hazard-rate matched sample, and consider three outcome variables: the number
of seed and early stage deals done in the region; the number of distinct seed and early stage VC
investors active in the region; and the dollar amount of seed and early stage financing provided in
the region. Each model contains an array of control variables and fixed effects for year and MSA.
We estimate each of the models twice, adding an MSA-specific linear time trend in the second
estimation of each.
Table 6 presents estimates of the difference-in-differences models for our hazard-rate matched
sample, with and without MSA-specific linear time trends. The first two columns of Table 6
present our estimates of the baseline model where the outcome variable is the number of early and

19
seed stage deals done in the MSA. The unit of observation is an MSA-year and we are interested
primarily in the coefficient loading on the dichotomous variable that indicates whether an
accelerator was active in the MSA in that year. Since the number of deals is a count variable, we
estimate Poisson models. We report the coefficients in their exponentiated form, also referred to
as the incidence rate ratio (or IRR), as it provides an intuitive interpretation as the multiplicative
effect of the treatment on the count of the dependent variable in question. Column (1) estimates
the baseline model. The coefficient on the Accelerator Active (the post x treated) variable of
interest is positive and statistically significant at the 1% level; the IRR estimate of 2.292 indicates
that the region experiences an increase of 129.2% in the number of early stage venture deals—our
proxy for high-growth potential entrepreneurial activity—in the years following the arrival of an
accelerator in the MSA.
In column (2), we add the MSA-specific linear time trend to absorb any unobserved variation
in the growth rate in venture-backed startup activity in each MSA. Once again we observe a
positive and statistically significant coefficient on the variable of interest; the magnitude of the
IRR estimate in this case is only slightly lower, suggesting an increase of 102.6% in the number
of early stage venture deals in the years following the arrival of an accelerator in the MSA. The
unconditional mean of financing events in the matched sample (treated and matched untreated) in
the pre-treatment period is 1.75 deals per year. While this baseline level is low, the increase of
over 100% in the number of deal represents a significant jump in activity for a region.
Figure 1 graphs the treatment effect for the treated regions by year relative to the control. Year
0 on the graph is the year of the accelerator founding. In the three years prior to the establishment
of an accelerator, treated and matched control MSAs look virtually the same in terms of the number
of deals done in the region; following the establishment of the accelerator, the number of deals
jumps sharply for the accelerated MSAs as compared to the control MSAs. This pattern is evident
in both models with and without inclusion of the MSA-specific linear time trend.
In columns (3) and (4) of Table 6, we present estimates from similar models, where the
outcome variable employed instead measures the number of distinct seed and early stage venture
investors active in the region in a given year. Estimating the model without the MSA-specific
linear time trend (column (3)), we find a 98.7% increase in the number of distinct investors in
treated MSAs following the arrival of an accelerator. In column (4), we explore whether this effect
changes significantly with the inclusion of an MSA-specific linear time trend. The level of the

20
IRR coefficient and the standard errors remain relatively similar with the inclusion of the linear
time trend, addressing concerns that our coefficient estimates are being driven by differences in
the growth rates of investors across the treated and untreated MSAs. The estimates in column (4)
suggest an increase of 87.9% in the number of distinct seed and early stage investors in the region
following the establishment of an accelerator. These increases are relative to the unconditional
mean number of 2.66 distinct investors each year in the pre-treatment period.
In similar fashion to Figure 1, Figure 2 graphs the treatment effect for the treated regions by
year relative to the control. Once again, in the three years prior to the establishment of an
accelerator, treated and matched control MSAs look virtually the same in terms of the number of
distinct seed and early stage investors active in the region; following the establishment of the
accelerator, the number of distinct investors jumps sharply for the accelerated MSAs as compared
to the control MSAs. Again, this pattern is evident in both models with and without inclusion of
the MSA-specific linear time trend.
In columns (5) and (6) we repeat these estimations for the outcome variable measuring total
dollar amount of seed and early stage software and IT VC investment in the region. We once again
observe a significant effect of accelerator establishment on financing activity: with the arrival of
an accelerator in the region, the MSA experiences an statistically insignificant estimated increase
of 72% (without linear time trend controls) to 165% (with MSA-specific linear time trend controls)
in the natural logarithm of total $ seed and early stage capital invested in the region. Figure 3
presents the treatment effect graphically over time; once again, there is no apparent difference
between the treated and matched untreated MSAs prior to the arrival of the accelerator, but after
accelerator establishment, the treated MSAs experience a jump in total funding relative to the
matched controls.
Notably, we observe little in the way of consistent statistically significant coefficients for the
control variables included in the models, regardless of whether the models contain an MSA-
specific linear time trend or not. The exception is employment; across all but one model in column
(2), the parameter estimates suggest a negative relationship between overall local employment
levels and our measures of early stage funding activity (in the count models, the reported IRR
coefficients are less than one, indicating a negative coefficient on the variable in the actual model
estimation, and in the OLS models, the coefficients estimated are negative). Altogether, the models

21
in Table 6 suggest a large and significant association between venture-backed startup activity and
the establishment of an accelerator in the region.
4.3 Triple-Differences Model
The outcome variables we measure in the baseline capture seed stage investment activity in
the software and IT segments alone. In Table 7, we provide our first falsification test by adding
to our models an industry that is less likely to be impacted by accelerators, the semi-conductor
industry. Because of the length of the time to market (years versus months to a potential signal of
viability) and the differences in the human capital required of founders (Ph.D.s versus software
developers), startup accelerators have typically not included semiconductor companies in their
portfolios. If accelerators tend to galvanize latent entrepreneurial activity by providing role
models, peer effects, and evidence on the existence of ecosystem resources, this effect should be
much stronger for startup activity in the industry that accelerators primarily focus on, software and
IT. Moreover, since most VC firms, particularly smaller and newer firms, are specialized by
industry vertical (Hochberg and Westerfield, 2012; Hochberg et al., 2015), even with the entry of
new investors to the region to take advantage of new startup activity, we should expect semi-
conductor startup financing activity to be significantly less impacted. Thus, adding financing
events from this “non-accelerated” industry to our data on “accelerated” industries within each
MSA, we can control for trends across accelerated industries and shared trends within treated
MSAs. Given the lack of focus by accelerators on the semiconductor segment, we would expect
to see less of an effect of accelerator establishment on entrepreneurial finance activity in that
industry.
Table 7 presents the estimates of the triple difference models for our three outcome variables.
The coefficient of interest is that on the triple interaction Treated Region X Treated Industry X
Post-Treatment. We observe significant and positive coefficients in the models for number of
deals and number of distinct investors, both when we include MSA-specific linear time trends and
when we omit them. Here, in columns (1) and (2), the model estimates suggest that the founding
of an accelerator in an MSA produces a statistically significant 328% (280%) increase in the
number of early stage software and IT deals in accelerated industries when omitting (including)
the linear time trends. In columns (3) and (4), we explore the impact of the arrival of an accelerator
on the number of distinct investors while controlling for industry. We find that the arrival of an

22
accelerator is associated with a 195% (167%) increase in the number of investors when omitting
(including) MSA-specific linear time trends. Lastly, in columns (5) and (6), we explore the impact
of the arrival of accelerators on the total amount of dollars invested. In this set of models, we find
no statistically significant differential impact of the arrival of an accelerator on software startups
when compared to startups in the semiconductor industry.
Figure 4 graphs the treatment effect for the treated industry in treated industries over time.
Also included in the model generating these parameter estimates, but not displayed, are separate
terms for treated region and treated industry as well as MSA and year fixed effects. There is no
difference in financing patterns pre-accelerator founding between the groups; following the
establishment of the accelerator, there is a jump in financing activity for the more-treated industry
(software and IT) in the treated region, but not for the less-treated industry (semiconductors). Thus,
our estimates of the positive impact of accelerator founding on regional entrepreneurial finance
appear to be robust to controlling for whether the industry in question is likely to be more affected.
4.4 Synthetic Controls
While the previous analysis uses a dynamic hazard model to find the closest untreated MSA in
terms of level and trend in early stage venture-backed startup activity, an alternative approach is
to construct a closer counterfactual MSA for each treated region using synthetic control
approaches. The synthetic control method (Abadie and Gardeazabal, 2003; Abadie et al., 2010)
involves the construction of a convex combination of comparison (untreated) units used as
controls, which approximates the characteristics of the unit that is exposed to the treatment. A
combination of comparison units often provides a better comparison for the unit exposed to the
intervention than any comparison unit alone. This “synthetic control” unit is then used to estimate
what would have happened the treatment group if it had not received the treatment.
Unlike difference in differences approaches, the synthetic control method can account for the
effects of confounders changing over time, by weighting the control group to better match the
treatment group before the intervention. Critically, this means that the synthetic control approach
concretely addresses the one remaining source of endogeneity not addressed by our hazard-rate
matched difference-in-differences analysis or our triple differences. An additional advantage of
the synthetic control method is that it allows researchers to systematically select comparison
groups. Synthetic controls can be thought of as an extension of the difference-in-differences
23
model: while the diff-in-diff approach treats unobservables as a cross-sectional constant, the
synthetic control approach allows unobservable factors (which may be correlated with covariates
Xit) to vary cross-sectionally.10 Cavallo, et al. (2013) extend the Abadie et al methodology to
account for multiple treated units.
We use the methodology from Cavallo, et al. (2013) and create a synthetic control unit for each
of our treated regions, using the never-treated regions as the comparison units. We restrict our
treated sample to the programs that were included in our hazard rate sample so as to exclude
regions such as San Francisco, Boston, and New York that are not on the common support and
thus are not likely to be able to have a synthetic control constructed for them. Appendix B provides
a detailed description of the methodology.
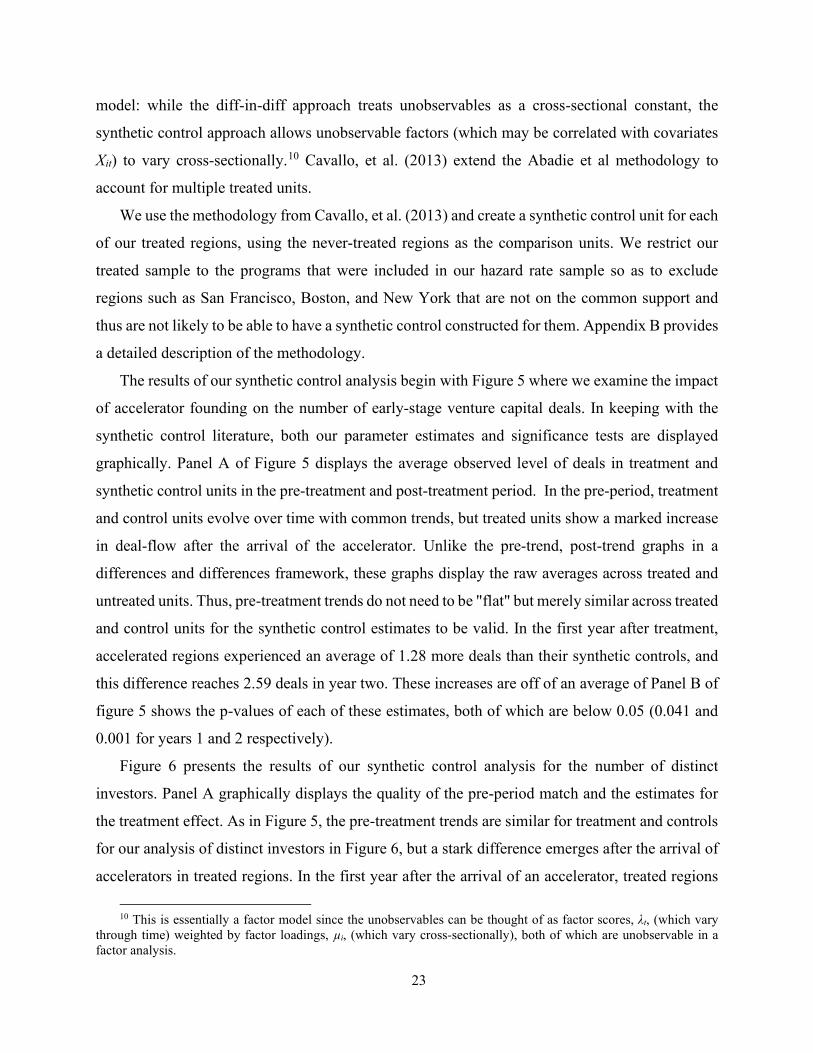
The results of our synthetic control analysis begin with Figure 5 where we examine the impact
of accelerator founding on the number of early-stage venture capital deals. In keeping with the
synthetic control literature, both our parameter estimates and significance tests are displayed
graphically. Panel A of Figure 5 displays the average observed level of deals in treatment and
synthetic control units in the pre-treatment and post-treatment period. In the pre-period, treatment
and control units evolve over time with common trends, but treated units show a marked increase
in deal-flow after the arrival of the accelerator. Unlike the pre-trend, post-trend graphs in a
differences and differences framework, these graphs display the raw averages across treated and
untreated units. Thus, pre-treatment trends do not need to be "flat" but merely similar across treated
and control units for the synthetic control estimates to be valid. In the first year after treatment,
accelerated regions experienced an average of 1.28 more deals than their synthetic controls, and
this difference reaches 2.59 deals in year two. These increases are off of an average of Panel B of
figure 5 shows the p-values of each of these estimates, both of which are below 0.05 (0.041 and
0.001 for years 1 and 2 respectively).
Figure 6 presents the results of our synthetic control analysis for the number of distinct
investors. Panel A graphically displays the quality of the pre-period match and the estimates for
the treatment effect. As in Figure 5, the pre-treatment trends are similar for treatment and controls
for our analysis of distinct investors in Figure 6, but a stark difference emerges after the arrival of
accelerators in treated regions. In the first year after the arrival of an accelerator, treated regions
10 This is essentially a factor model since the unobservables can be thought of as factor scores, λt, (which vary
through time) weighted by factor loadings, µi, (which vary cross-sectionally), both of which are unobservable in a factor analysis.

24
saw investment activity from 1.8 more distinct investors and this increased to 3.04 more investors
in year two. Panel B of Figure 6 shows that these estimates of the impact of an accelerator being
founded in a region were statistically significant, with p-values of 0.002 and 0.0001 for years 1
and 2 respectively.
Lastly, we present the results of our synthetic control analysis for logged dollar value of funds
invested in a region. Seen graphically, the pre-trends in this treatment graph do not appear as stable
as in a difference-in-difference graphical representation (or relative to the previous two synthetic
control graphs). However, these synthetic control graphs are not meant to be flat before treatment;
rather, they merely show the degree to which control units match treated units before the arrival
of the accelerator—which remains the case for this outcome variable, as for the two prior. After
the establishment of the accelerator, our synthetic control methods show a 1.51 increase in logged
funding in year 1 which corresponds to a 151% increase in logged dollar funding levels in the
treated group relative to control. In year 2, we see an increase of 2.29 corresponding to a 229%
increase in the logged dollar funding levels of treated regions relative to controls. In Panel B, we
display the p-values for our parameter estimates which show that both estimates are statistically
significant, at the 0.08 and 0.007 level for years 1 and two respectively.
4.5 Shifts in Industry and Stage Composition
Our triple differences models provide evidence consistent with the impact of accelerator
founding being isolated to the industries in which we would expect them to be. To add support to
this result, we next run an analogous set of regressions that examine the composition of deals in
accelerated and non-accelerated MSAs in terms of staging and industry. We would expect the
arrival of an accelerator to shift the distribution of deals (at least in the window of our study)
towards early stage deals within the treated industry and towards deals within the treated industry
because it encourages additional seed and early stage activity in this specific industry.
We estimate a series of fractional logits (Hausman and Leonard, 1997; Papke and Woolridge,
2008) to examine whether there are shifts in deal-flow coinciding with accelerator founding
towards the types of investments we expect to be affected by accelerators—early stage investments
in software and IT firms. Table 8 explores the impact of accelerator arrival on the proportion of
early versus later-stage deals done in an MSA. Columns (1) through (4) demonstrate statistically
significant increases in early stage deals in the accelerated industries (Internet Specific and
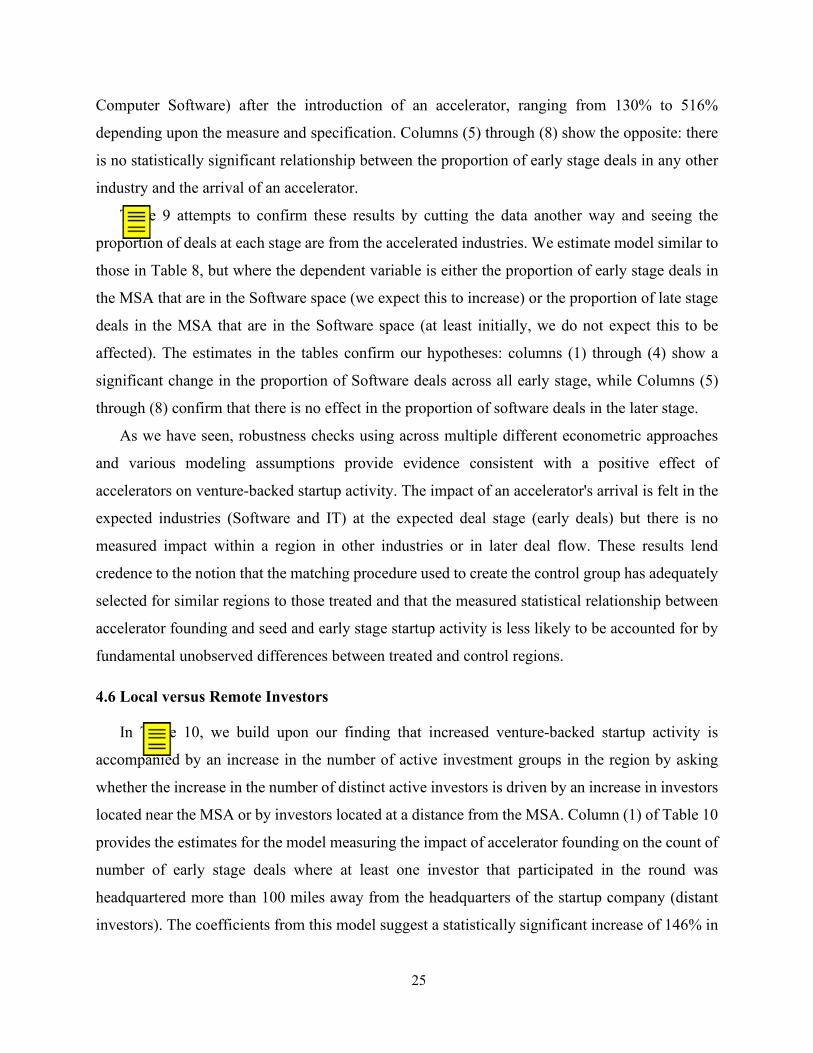
25
Computer Software) after the introduction of an accelerator, ranging from 130% to 516%
depending upon the measure and specification. Columns (5) through (8) show the opposite: there
is no statistically significant relationship between the proportion of early stage deals in any other
industry and the arrival of an accelerator.
Table 9 attempts to confirm these results by cutting the data another way and seeing the
proportion of deals at each stage are from the accelerated industries. We estimate model similar to
those in Table 8, but where the dependent variable is either the proportion of early stage deals in
the MSA that are in the Software space (we expect this to increase) or the proportion of late stage
deals in the MSA that are in the Software space (at least initially, we do not expect this to be
affected). The estimates in the tables confirm our hypotheses: columns (1) through (4) show a
significant change in the proportion of Software deals across all early stage, while Columns (5)
through (8) confirm that there is no effect in the proportion of software deals in the later stage.
As we have seen, robustness checks using across multiple different econometric approaches
and various modeling assumptions provide evidence consistent with a positive effect of
accelerators on venture-backed startup activity. The impact of an accelerator's arrival is felt in the
expected industries (Software and IT) at the expected deal stage (early deals) but there is no
measured impact within a region in other industries or in later deal flow. These results lend
credence to the notion that the matching procedure used to create the control group has adequately
selected for similar regions to those treated and that the measured statistical relationship between
accelerator founding and seed and early stage startup activity is less likely to be accounted for by
fundamental unobserved differences between treated and control regions.
4.6 Local versus Remote Investors
In Table 10, we build upon our finding that increased venture-backed startup activity is
accompanied by an increase in the number of active investment groups in the region by asking
whether the increase in the number of distinct active investors is driven by an increase in investors
located near the MSA or by investors located at a distance from the MSA. Column (1) of Table 10
provides the estimates for the model measuring the impact of accelerator founding on the count of
number of early stage deals where at least one investor that participated in the round was
headquartered more than 100 miles away from the headquarters of the startup company (distant
investors). The coefficients from this model suggest a statistically significant increase of 146% in

26
the number of deals with at least one distant investor participating in the round after the arrival of
an accelerator, and the point estimate remains substantially positive and statistically significant
when we add MSA-specific time trends in column (2), where shows a 112% increase in
participation from distant investors. In columns (3) and (4), we similarly explore the impact of
accelerator founding on the number of deals where the investor syndicate is comprised entirely of
investors headquartered within 100 miles of the company headquarters (local investors). Here, we
observe a statistically significant 115% increase in the number of deals with entirely local
investors, a result that is robust to the inclusion of MSA-specific linear time trends in column (4).
Columns (5) and (6) of Table 10 present estimates of the impact of accelerator founding on the
count of distinct distant investors active in the region. The coefficient in the baseline model in
column (5) is statistically significant (95% increase in number of investors), and when we add the
MSA-specific linear time trends in column (6), the magnitude of the coefficient remains
substantially similar (suggesting an 85% increase) and remains statistically significant (although
less so than the previous model). In columns (7), when we examine the impact of accelerator
founding on the count of number of distinct local investors, we find that the founding of an
accelerator leads to a statistically significant increase of 122% in the number of distinct local
investors and similar to the previous results, the sign and statistical significance of the results hold
when we add MSA-specific linear time trends in column (8). This holds in both specifications with
and without the MSA-specific linear time trend.
Finally, we look at the impact of the arrival of an accelerator on the total number of dollars
invested in a region by local and distant investors. In column (9) and (10), we explore the impact
of accelerator founding on total investment from distant investors, finding no statistically
significant relationship. In contrast, column (11) looks at the impact of accelerator founding on the
total amount of early stage funding invested by local investors. Here, we find that the arrival of an
accelerator is associated with a large and statistically significant increase in the amount of funding
provided by local investors, and this result is robust to the inclusion of MSA-specific linear time
trends in column (12).
Taken together, the estimates in Table 10 suggest that much of the increase in venture backed
startup deal activity in the region following the arrival of an accelerator is financed not necessarily
by the entrance of remotely-located investors into the region, but rather from new growth in
investment groups local to the region itself. This is consistent with the idea that accelerators may

27
serve as a catalyst for drawing together latent local forces to create an entrepreneurial cluster where
it did not exist previously.
5. Conclusion
While the proliferation of accelerator programs over the last few years has been rapid, very
little has been shown to date regarding their efficacy as institutions and intermediaries in the
entrepreneurial ecosystem, including whether they indeed engender the spillover effects looked
for by policy makers. With little information to inform decision-making processes, policy makers
have struggled to determine how or if these programs should be supported or encouraged. This
study provides some initial insights into the spillover effect that accelerator programs can have on
the entrepreneurial ecosystem, by exploring their effects on the entrepreneurial financing
environment in the local region.
Our findings suggest that accelerators positively impact the regional entrepreneurial
ecosystem through spillovers of entrepreneurial activity, consistent with peer effects and provision
of social capital to the region. MSAs in which an accelerator is established subsequently exhibit
more seed and early stage venture-backed startup activity for non-accelerator graduates.
Certainly, this increase in activity may simply represent a shift of investment dollars and
startup activity from other regions into the accelerator’s region, possibly to the detriment of the
other regions. Even if this is the case, however, if the presence of the accelerator increases activity
in local region, this may meet the goals of both the accelerator founders and local policy makers.
A second critique is that the companies being funded locally may simply be companies that would
otherwise have gone to one of the coasts and been financed there, and now are instead financed in
their original home regions. However, again, retaining companies locally is often a primary goal
for local policy makers and for accelerator founders.
We note that as the average seed and early stage investment size has fallen in these industries
over last 15 years, primarily due to reduction in the cost of experimentation (Ewens, Nanda and
Rhodes-Kropf, 2013), angels have begun to emerge as a viable substitute for VC seed and A round
investment. While we do not observe angel funding, it is likely that the effects we see for VC
investment are also present at the angel level, and may be many times the VC effects.

28
References
Abadie, Alberto. 2005. “Semiparametric Difference-in-Differences Estimators.” The Review of Economic Studies 72 (1): 1–19.
Abadie, Alberto, Alexis Diamond, and Jens Hainmueller. 2010. “Synthetic Control Methods for Comparative Case Studies: Estimating the Effect of California’s Tobacco Control Program.” Journal of the American Statistical Association 105 (490): 493–505.
Abadie, Alberto, and Javier Gardeazabal. 2003. “The Economic Costs of Conflict: A Case Study of the Basque Country.” American Economic Review 93 (1): 113–32.
Acs, Zoltan J., and Catherine Armington. 2006. Entrepreneurship, Geography, and American Economic Growth. Cambridge University Press.
Ahern, Kenneth R., Ran Duchin, and Tyler Shumway. 2014. “Peer Effects in Risk Aversion and Trust.” Review of Financial Studies, hhu042.
Ashenfelter, Orley. 1978. “Estimating the Effect of Training Programs on Earnings.” The Review of Economics and Statistics, 47–57.
Autor, David H. 2003. “Outsourcing at Will: The Contribution of Unjust Dismissal Doctrine to the Growth of Employment Outsourcing.” J. Labor Econ. 21 (1): 1–42.
Bernstein, Shai, Xavier Giroud, and Richard R. Townsend. 2016. “The Impact of Venture Capital Monitoring.” The Journal of Finance 71 (4): 1591–1622.
Cavallo, Eduardo, Sebastian Galiani, Ilan Noy, and Juan Pantano. 2013. “Catastrophic Natural Disasters and Economic Growth.” Review of Economics and Statistics 95 (5): 1549–1561.
Chatterji, Aaron, Edward Glaeser, and William Kerr. 2014. “Clusters of Entrepreneurship and Innovation.” Innovation Policy and the Economy 14 (1): 129–166.
Chen, Henry, Paul Gompers, Anna Kovner, and Josh Lerner. 2010. “Buy Local? The Geography of Venture Capital.” Journal of Urban Economics 67 (1): 90–102.
Cohen, Susan, Daniel Fehder, Yael V. Hochberg, and Fiona Murray. 2018. “The Design and Evaluation of Startup Accelerators.”
Cohen, Susan, and Yael V. Hochberg. 2014. “Accelerating Startups: The Seed Accelerator Phenomenon.” Available at SSRN 2418000. http://papers.ssrn.com/sol3/Papers.cfm?abstract_id=2418000.
Davis, Steven J., John C. Haltiwanger, Scott Schuh, and others. 1998. “Job Creation and Destruction.” MIT Press Books 1.
Delgado, Mercedes, Michael E. Porter, and Scott Stern. 2010. “Clusters and Entrepreneurship.” Journal of Economic Geography 10 (4): 495–518.
Ewens, Michael, Ramana Nanda, and Matthew Rhodes-Kropf. 2016. “Cost of Experimentation and the Evolution of Venture Capital.”
Fehder, Daniel. 2018. “Coming from a Good Pond: The Organizational Consequences of a Startup’s Early-Stage Ecosystem.” Available at SSRN.
Feld, Brad. 2012. Startup Communities: Building an Entrepreneurial Ecosystem in Your City. John Wiley & Sons.
Feldman, Maryann, and Ted D. Zoller. 2012. “Dealmakers in Place: Social Capital Connections in Regional Entrepreneurial Economies.” Regional Studies 46 (1): 23–37.
Giannetti, Mariassunta, and Andrei Simonov. 2009. “Social Interactions and Entrepreneurial Activity.” Journal of Economics & Management Strategy 18 (3): 665–709.
Gilani, Aziz, and K Quann. 2011. “2011 Seed Accelerator Rankings.” Glaeser, E. L., and W.R. Kerr. 2009. “Local Industrial Conditions and Entrepreneurship: How Much of
the Spatial Distribution Can We Explain?” Journal of Economics & Management Strategy 18 (3): 623–663.
Glaeser, E. L., W.R. Kerr, and G. A. M. Ponzetto. 2010. “Clusters of Entrepreneurship.” Journal of Urban Economics 67 (1): 150–168.
Gonzalez-Uribe, Juanita, and Michael Leatherbee. 2016. “The Effects of Business Accelerators on Venture Performance: Evidence from Start-up Chile.” The Review of Financial Studies.

29
Hallen, Benjamin L., Christopher B. Bingham, and Susan Cohen. 2014. “Do Accelerators Accelerate? A Study of Venture Accelerators as a Path to Success?” In Academy of Management Proceedings, 2014:12955. Academy of Management.
Hausman, Jerry A., and Gregory K. Leonard. 1997. “Superstars in the National Basketball Association: Economic Value and Policy.” Journal of Labor Economics 15 (4): 586–624.
Hochberg, Yael V., and K Kamath. 2012. “2012 Seed Accelerator Rankings.” Hochberg, Yael V., Michael J. Mazzeo, and Ryan C. McDevitt. 2015. “Specialization and Competition in
the Venture Capital Industry.” Review of Industrial Organization 46 (4): 323–347. Hochberg, Yael V., and Mark M. Westerfield. 2012. “The Size and Specialization of Direct Investment
Portfolios.” Isabelle, Diane A. 2013. “Key Factors Affecting a Technology Entrepreneur’s Choice of Incubator or
Accelerator.” Technology Innovation Management Review, no. February: Platforms, Communities, and Business Ecosystems. http://www.timreview.ca/article/656.
Kacperczyk, Aleksandra J. 2013. “Social Influence and Entrepreneurship: The Effect of University Peers on Entrepreneurial Entry.” Organization Science 24 (3): 664–83.
Lindquist, Matthew J., Joeri Sol, and Mirjam Van Praag. 2015. “Why Do Entrepreneurial Parents Have Entrepreneurial Children?” Journal of Labor Economics 33 (2): 269–296.
Manso, Gustavo. 2016. “Experimentation and the Returns to Entrepreneurship.” The Review of Financial Studies 29 (9): 2319–2340.
Markussen, Simen, and Knut Røed. 2017. “The Gender Gap in Entrepreneurship–The Role of Peer Effects.” Journal of Economic Behavior & Organization 134: 356–373.
Miller, Paul, and Kirsten Bound. 2011. The Startup Factories: The Rise of Accelerator Programmes to Support New Technology Ventures. Nesta.
Nanda, Ramana, and Jesper B. Sørensen. 2010. “Workplace Peers and Entrepreneurship.” Management Science 56 (7): 1116–1126.
Papke, Leslie E., and Jeffrey M. Wooldridge. 2008. “Panel Data Methods for Fractional Response Variables with an Application to Test Pass Rates.” Journal of Econometrics, The use of econometrics in informing public policy makers, 145 (1–2): 121–33.
Radojevich-Kelley, Nina, and David Lynn Hoffman. 2012. “Analysis of Accelerator Companies: An Exploratory Case Study of Their Programs, Processes, and Early Results.” Small Business Institute Journal 8 (2): 54–70.
Ryan, Andrew. 2010. “Ideas Percolate in Innovation District.” Boston Globe, July 26, 2010. http://archive.boston.com/news/local/massachusetts/articles/2010/07/26/ideas_percolate_in_innovation_district/.
Samila, S., and O. Sorenson. 2011. “Venture Capital, Entrepreneurship, and Economic Growth.” The Review of Economics and Statistics 93 (1): 338–349.
Shue, Kelly. 2013. “Executive Networks and Firm Policies: Evidence from the Random Assignment of MBA Peers.” The Review of Financial Studies 26 (6): 1401–42. https://doi.org/10.1093/rfs/hht019.
Winston Smith, Sheryl, T. J. Hannigan, and Laura L. Gasiorowski. 2013. “Accelerators and Crowd-Funding: Complementarity, Competition, or Convergence in the Earliest Stages of Financing New Ventures?” Temple Working Paper.
Yu, Sandy. 2014. “The Impact of Accelerators on High-Technology Ventures.” Available at SSRN 2503510. http://papers.ssrn.com/sol3/papers.cfm?abstract_id=2503510.
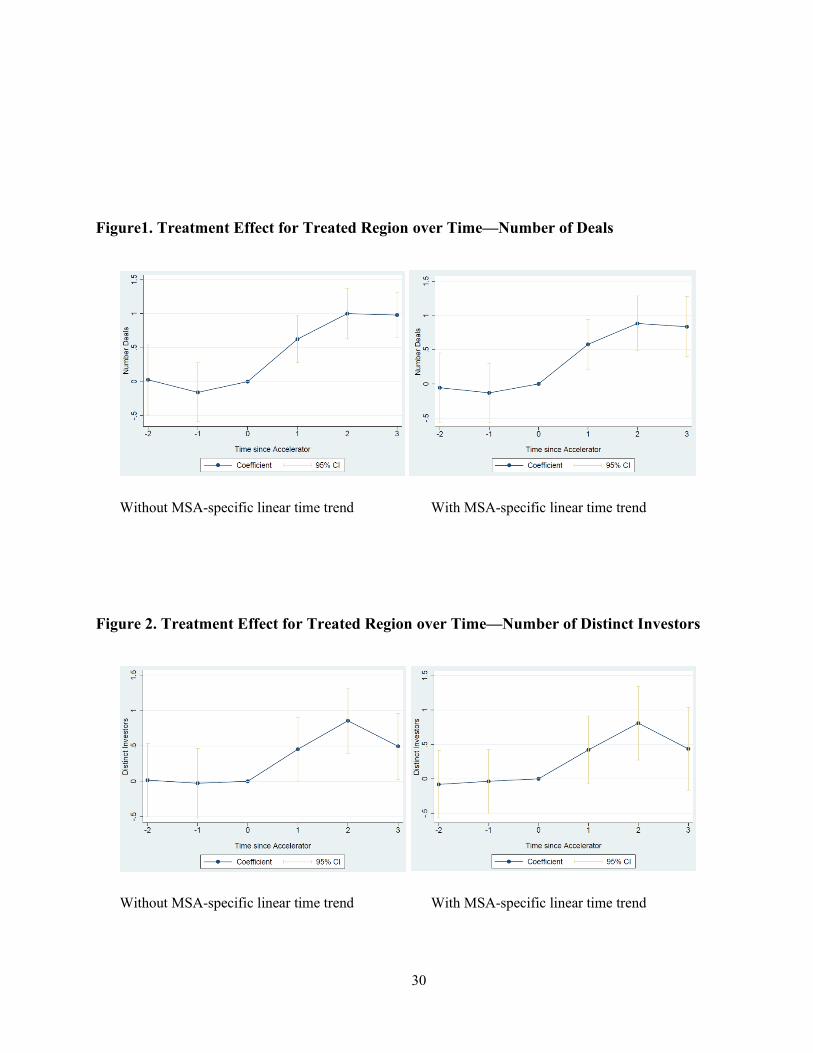
30
Figure1. Treatment Effect for Treated Region over Time—Number of Deals
Without MSA-specific linear time trend With MSA-specific linear time trend
Figure 2. Treatment Effect for Treated Region over Time—Number of Distinct Investors
Without MSA-specific linear time trend With MSA-specific linear time trend
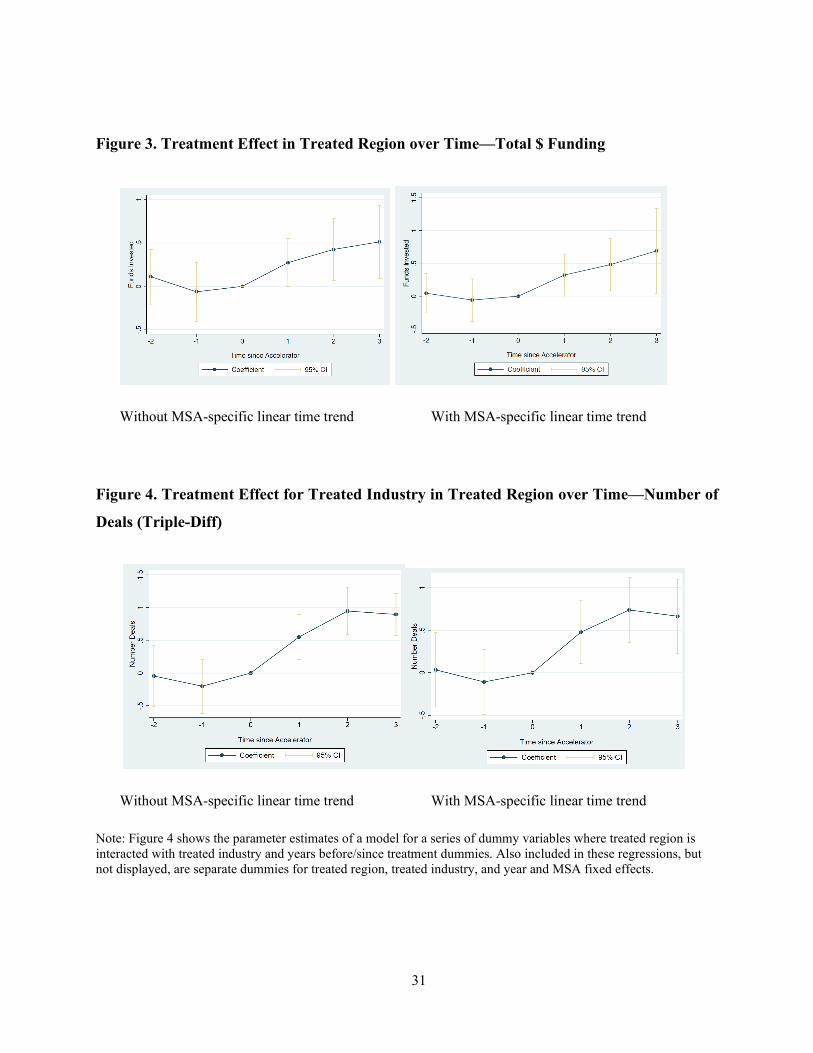
31
Figure 3. Treatment Effect in Treated Region over Time—Total $ Funding
Without MSA-specific linear time trend With MSA-specific linear time trend
Figure 4. Treatment Effect for Treated Industry in Treated Region over Time—Number of
Deals (Triple-Diff)
Without MSA-specific linear time trend With MSA-specific linear time trend
Note: Figure 4 shows the parameter estimates of a model for a series of dummy variables where treated region is interacted with treated industry and years before/since treatment dummies. Also included in these regressions, but not displayed, are separate dummies for treated region, treated industry, and year and MSA fixed effects.
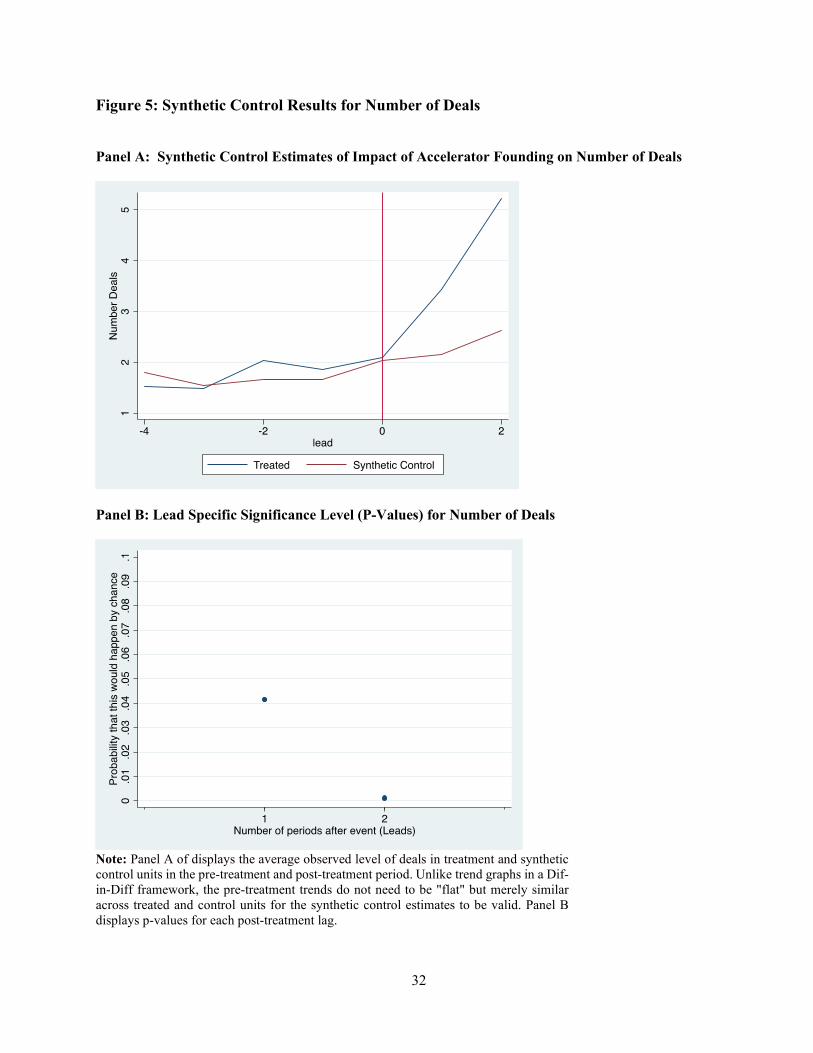
32
Figure 5: Synthetic Control Results for Number of Deals
Panel A: Synthetic Control Estimates of Impact of Accelerator Founding on Number of Deals
Panel B: Lead Specific Significance Level (P-Values) for Number of Deals
Note: Panel A of displays the average observed level of deals in treatment and synthetic control units in the pre-treatment and post-treatment period. Unlike trend graphs in a Dif-in-Diff framework, the pre-treatment trends do not need to be "flat" but merely similar across treated and control units for the synthetic control estimates to be valid. Panel B displays p-values for each post-treatment lag.
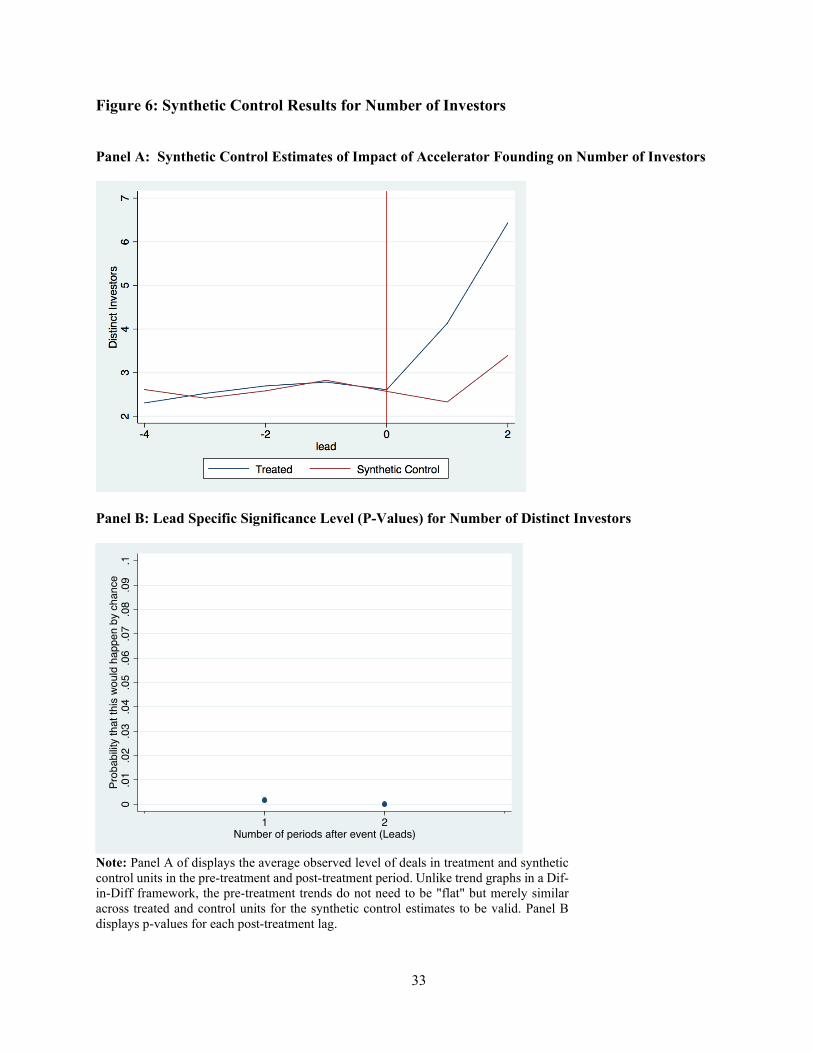
33
Figure 6: Synthetic Control Results for Number of Investors
Panel A: Synthetic Control Estimates of Impact of Accelerator Founding on Number of Investors
Panel B: Lead Specific Significance Level (P-Values) for Number of Distinct Investors
Note: Panel A of displays the average observed level of deals in treatment and synthetic control units in the pre-treatment and post-treatment period. Unlike trend graphs in a Dif-in-Diff framework, the pre-treatment trends do not need to be "flat" but merely similar across treated and control units for the synthetic control estimates to be valid. Panel B displays p-values for each post-treatment lag.

34
Figure 7: Synthetic Control Results for Funds Invested
Panel A: Synthetic Control Estimates of Impact of Accelerator Founding on Funds Invested
Panel B: Lead Specific Significance Level (P-Values) for Funds Invested
Note: Panel A of displays the average observed level of deals in treatment and synthetic control units in the pre-treatment and post-treatment period. Unlike trend graphs in a Dif-in-Diff framework, the pre-treatment trends do not need to be "flat" but merely similar across treated and control units for the synthetic control estimates to be valid. Panel B displays p-values for each post-treatment lag.

35
Table 1: List of Data Sources for MSA Level Data
VARIABLE DESCRIPTION SOURCE
Funds Invested Logged Yearly Sum of Early Stage VC Dollars in MSA VentureXpert
Number Deals Yearly Count of Early Stage VC Financing Events by MSA VentureXpert
Distinct Investors Yearly Count of Early Stage Investors in MSA VentureXpert
Patent Count Yearly Count of Utility Patents in MSA USPTO
# STEM Grad. Students Yearly Count of STEM Graduate Students by State NSF
Firm Births Yearly Count of New Firms by MSA US Census BDS
University R&D Spending Yearly Sum of University R&D Spending in MSA NSF
Per Capita Income Per Capita Income at MSA Level US Census
Employment Employment at the MSA Level US Census

36
Table 2: U.S.-Based Accelerator Programs Founded 2007-2012
Accelerator Name
First Class Year MSA
Accelerator Name
First Class Year MSA
1 Y Combinator 2005 San Jose-Sunnyvale-Santa Clara, CA 31 Dreamit Ventures - NYC 2011 New York-North. NJ-Long Island-PA 2 Techstars - Boulder 2007 Boulder, CO 32 gener8tor -- Milwaukee 2012 Milwaukee-Waukesha-West Allis, WI 3 Dreamit Ventures -
Philadelphia 2008 Philadelphia-Camden-Wilmington 33
Hatch 2012 Virginia Beach-Norfolk-Newport News, VA-NC
4 AlphaLab 2008 Pittsburgh, PA 34 Blueprint Health 2012 New York-North. NJ-Long Island-PA 5 Tech Wildcatters 2009 Dallas-Fort Worth-Arlington, TX 35 StartFast Venture Accel. 2012 Syracuse, NY 6 Techstars - Boston 2009 Boston-Cambridge-Quincy, MA-NH 36 Accelerate Baltimore 2012 Baltimore-Towson, MD 7 Capital Factory 2009 Austin-Round Rock-San Marcos, TX 37 Telluride Venture Accel. 2012 Telluride, CO 8 First Growth Venture Network 2009 New York-North. NJ-Long Island-PA 38 Alchemist Accelerator 2012 San Jose-Sunnyvale-Santa Clara, CA 9 Betaspring 2009 Providence-New Bedford-Fall River 39 LaunchHouse 2012 Cleveland-Elyria-Mentor, OH 10 Launchpad LA 2009 Los Angeles-Long Beach-Santa Ana, CA 40 MindTheBridge 2012 San Francisco-Oakland-Fremont, CA 11 AngelPad 2010 San Francisco-Oakland-Fremont, CA 41 Techstars - Cloud 2012 San Antonio-New Braunfels, TX 12 Brandery 2010 Cincinnati-Middletown, OH-KY-IN 42 Healthbox -- Chicago 2012 Chicago-Joliet-Naperville, IL-IN-WI 13 BoomStartup 2010 Salt Lake City, UT 43 StartEngine 2012 Los Angeles-Long Beach-Santa Ana, CA 14
JumpStart Foundry 2010 Nashville-Davidson-Murfreesboro-Franklin, TN
44 SURGE Accelerator 2012 Houston-Sugar Land-Baytown, TX
15 Techstars - Chicago 2010 Chicago-Joliet-Naperville, IL-IN-WI 45 Triangle Startup Factory 2012 Durham-Chapel Hill, NC 16 Portland Incubator Experiment 2010 Portland-Vancouver-Hillsboro, OR-WA 46 Rock Health -- Boston 2012 Boston-Cambridge-Quincy, MA-NH 17 NYC Seed Start 2010 New York-North. NJ-Long Island-PA 47 MuckerLab 2012 Los Angeles-Long Beach-Santa Ana, CA 18 500 Startups 2010 San Jose-Sunnyvale-Santa Clara, CA 48 The Iron Yard 2012 Greenville-Mauldin-Easley, SC 19 Techstars - Seattle 2010 Seattle-Tacoma-Bellevue, WA 49 Bizdom - Detroit 2012 Detroit-Warren-Livonia, MI 20 Entrepreneurs Roundtable 2011 New York-North. NJ-Long Island-PA 50 InnoSpring 2012 San Jose-Sunnyvale-Santa Clara, CA 21 FinTech Innovation Lab 2011 New York-North. NJ-Long Island-PA 51 NY Digital Health Accel. 2012 New York-North. NJ-Long Island-PA 22 NewMe 2011 San Jose-Sunnyvale-Santa Clara, CA 52 Co.Lab Accelerator 2012 Chattanooga, TN-GA 23 Portland Seed Fund 2011 Portland-Vancouver-Hillsboro, OR-WA 53 Tandem 2012 San Francisco-Oakland-Fremont, CA 24 Techstars - NYC 2011 New York-North. NJ-Long Island-PA 54 Blue Startups 2012 Honolulu, HI 25 Imagine K12 2011 San Jose-Sunnyvale-Santa Clara, CA 55 TechLaunch 2012 New York-North. NJ-Long Island-PA 26 Seed Hatchery 2011 Memphis, TN-MS-AR 56 ARK Challenge 2012 Fayetteville-Springdale-Rogers, AR-MO 27 Rock Health -- San Francisco 2011 San Francisco-Oakland-Fremont, CA 57 Gener8tor -- Madison 2012 Madison, WI 28 Amplify.LA 2011 Los Angeles-Long Beach-Santa Ana, CA 58 Impact Engine 2012 Chicago-Joliet-Naperville, IL-IN-WI 29 Start Engine 2011 Los Angeles-Long Beach-Santa Ana, CA 59 Healthbox -- Boston 2012 Boston-Cambridge-Quincy, MA-NH 30 Capital Innovators 2012 St. Louis, MO-IL
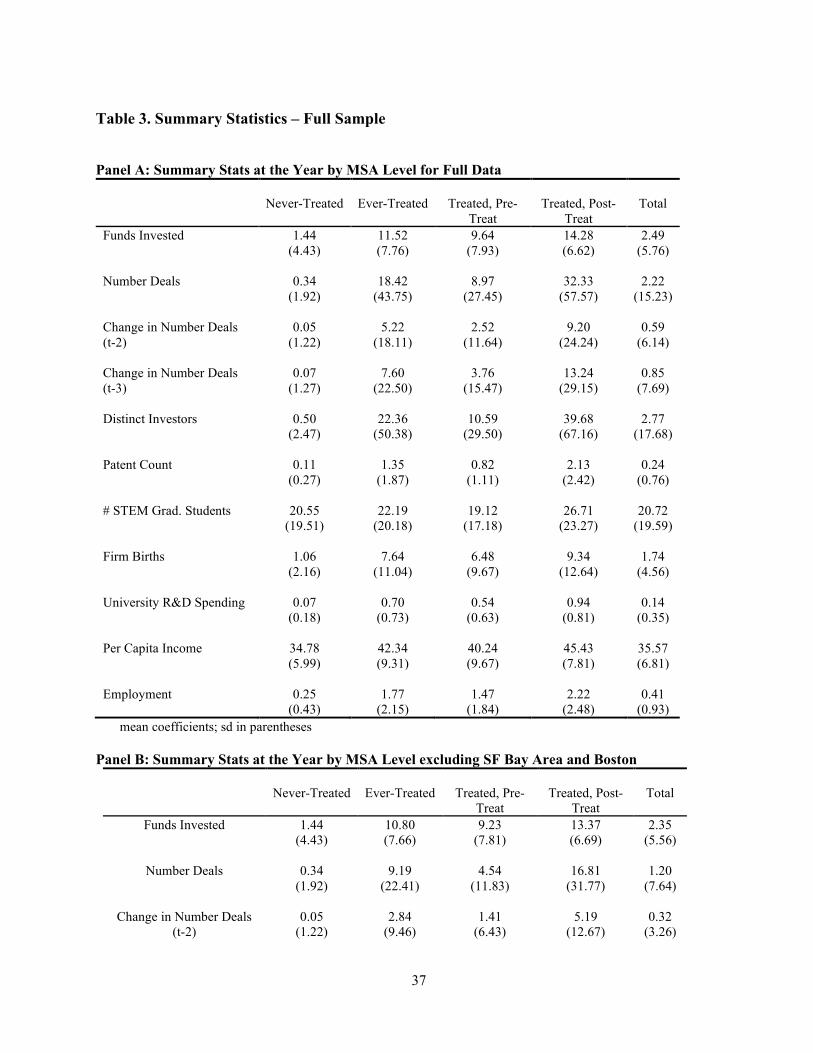
37
Table 3. Summary Statistics – Full Sample
Panel A: Summary Stats at the Year by MSA Level for Full Data
Never-Treated Ever-Treated Treated, Pre-
Treat Treated, Post-
Treat Total
Funds Invested 1.44 (4.43)
11.52 (7.76)
9.64 (7.93)
14.28 (6.62)
2.49 (5.76)
Number Deals 0.34
(1.92) 18.42
(43.75) 8.97
(27.45) 32.33
(57.57) 2.22
(15.23) Change in Number Deals (t-2)
0.05 (1.22)
5.22 (18.11)
2.52 (11.64)
9.20 (24.24)
0.59 (6.14)
Change in Number Deals (t-3)
0.07 (1.27)
7.60 (22.50)
3.76 (15.47)
13.24 (29.15)
0.85 (7.69)
Distinct Investors 0.50
(2.47) 22.36
(50.38) 10.59
(29.50) 39.68
(67.16) 2.77
(17.68) Patent Count 0.11
(0.27) 1.35
(1.87) 0.82
(1.11) 2.13
(2.42) 0.24
(0.76) # STEM Grad. Students 20.55
(19.51) 22.19
(20.18) 19.12
(17.18) 26.71
(23.27) 20.72
(19.59) Firm Births 1.06
(2.16) 7.64
(11.04) 6.48
(9.67) 9.34
(12.64) 1.74
(4.56) University R&D Spending 0.07
(0.18) 0.70
(0.73) 0.54
(0.63) 0.94
(0.81) 0.14
(0.35) Per Capita Income 34.78
(5.99) 42.34 (9.31)
40.24 (9.67)
45.43 (7.81)
35.57 (6.81)
Employment 0.25
(0.43) 1.77
(2.15) 1.47
(1.84) 2.22
(2.48) 0.41
(0.93) mean coefficients; sd in parentheses
Panel B: Summary Stats at the Year by MSA Level excluding SF Bay Area and Boston Never-Treated Ever-Treated Treated, Pre-
Treat Treated, Post-
Treat Total
Funds Invested 1.44 (4.43)
10.80 (7.66)
9.23 (7.81)
13.37 (6.69)
2.35 (5.56)
Number Deals 0.34
(1.92) 9.19
(22.41) 4.54
(11.83) 16.81
(31.77) 1.20
(7.64)
Change in Number Deals (t-2)
0.05 (1.22)
2.84 (9.46)
1.41 (6.43)
5.19 (12.67)
0.32 (3.26)
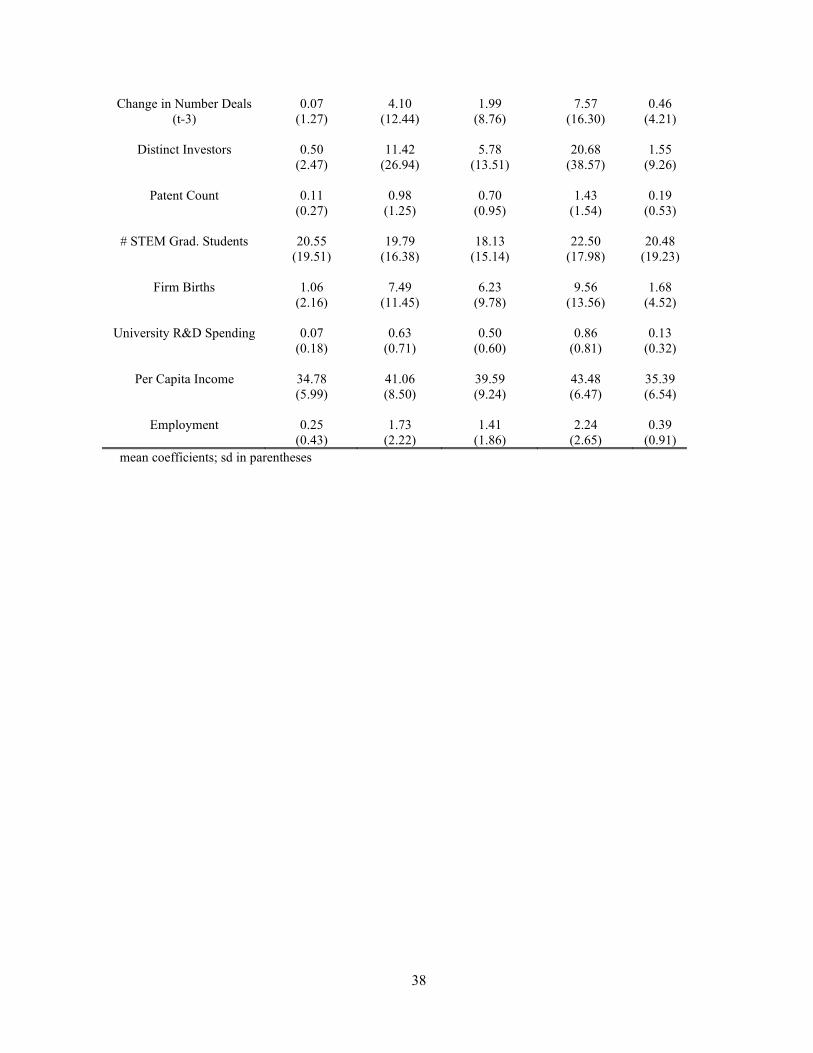
38
Change in Number Deals (t-3)
0.07 (1.27)
4.10 (12.44)
1.99 (8.76)
7.57 (16.30)
0.46 (4.21)
Distinct Investors 0.50
(2.47) 11.42
(26.94) 5.78
(13.51) 20.68
(38.57) 1.55
(9.26)
Patent Count 0.11 (0.27)
0.98 (1.25)
0.70 (0.95)
1.43 (1.54)
0.19 (0.53)
# STEM Grad. Students 20.55
(19.51) 19.79
(16.38) 18.13
(15.14) 22.50
(17.98) 20.48
(19.23)
Firm Births 1.06 (2.16)
7.49 (11.45)
6.23 (9.78)
9.56 (13.56)
1.68 (4.52)
University R&D Spending 0.07
(0.18) 0.63
(0.71) 0.50
(0.60) 0.86
(0.81) 0.13
(0.32)
Per Capita Income 34.78 (5.99)
41.06 (8.50)
39.59 (9.24)
43.48 (6.47)
35.39 (6.54)
Employment 0.25
(0.43) 1.73
(2.22) 1.41
(1.86) 2.24
(2.65) 0.39
(0.91) mean coefficients; sd in parentheses

39
Table 4: Summary Statistics at the MSA-Year Level for Hazard-Rate Matched Sample
Treated,
Pre-treatment
Matched, Pre-
treatment
Diff. Treated, Post-
treatment
Matched, Post-
treatment
Diff. Total
Funds Invested 7.79 (7.62)
6.95 (7.78)
0.84 (0.88)
11.34 (7.12)
8.70 (7.92)
2.64** (1.33)
8.51 (7.74)
Number Deals 1.50
(2.40) 1.91
(3.28) -0.32 (0.31)
5.46 (6.20)
2.49 (3.30)
2.97*** (0.89)
2.59 (4.07)
Change in Number
Deals (t-2) 0.12
(2.11) 0.12
(2.14) 0.00
(0.26) 2.70
(4.15) 0.42
(2.67) 2.27*** (0.63)
0.68 (2.89)
Change in Number
Deals (t-3) 0.21
(2.20) 0.17
(2.57) 0.03
(0.31) 3.38
(4.72) 0.56
(2.67) 2.82*** (0.69)
0.88 (3.26)
Distinct Investors 2.36
(3.20) 3.16
(5.25) -0.80 (0.50)
5.94 (5.83)
4.14 (5.65)
1.81* (1.07)
3.51 (5.05)
Patent Count 0.56
(0.62) 0.48
(0.63) 0.08
(0.07) 0.83
(0.73) 0.76
(0.89) 0.07
(0.14) 0.62
(0.71)
# STEM Grad. Students
19.39 (14.60)
20.96 (18.25)
-1.57 (1.74)
20.29 (14.41)
28.26 (23.42)
-7.96 (3.38)
21.54 (17.67)
Firm Births 4.88
(3.98) 3.42
(4.43) 1.46** (0.44)
5.52 (4.54)
3.55 (4.08)
1.97 (0.77)
4.33 (4.32)
University R&D
Spending 0.49
(0.54) 0.22
(0.35) 0.27*** (0.04)
0.66 (0.58)
0.38 (0.46)
0.27 (0.09)
0.42 (0.51)
Per Capita Income 38.50
(4.28) 37.69 (5.31)
0.81 (0.54)
41.78 (3.94)
40.92 (4.57)
0.86 (0.75)
39.30 (4.87)
Employment 1.22
(0.91) 0.75
(0.87) 0.47*** (0.09)
1.52 (1.13)
0.85 (0.89)
0.67 (0.18)
1.07 (0.98)
Note: This table provides summary statistics of regions before and after treatment for the hazard-rate matched sample. * p < 0.1, ** p < 0.05, *** p < 0.01. Standard deviations are displayed in parentheses for columns 1 and 2. Standard errors in parentheses for column 3.
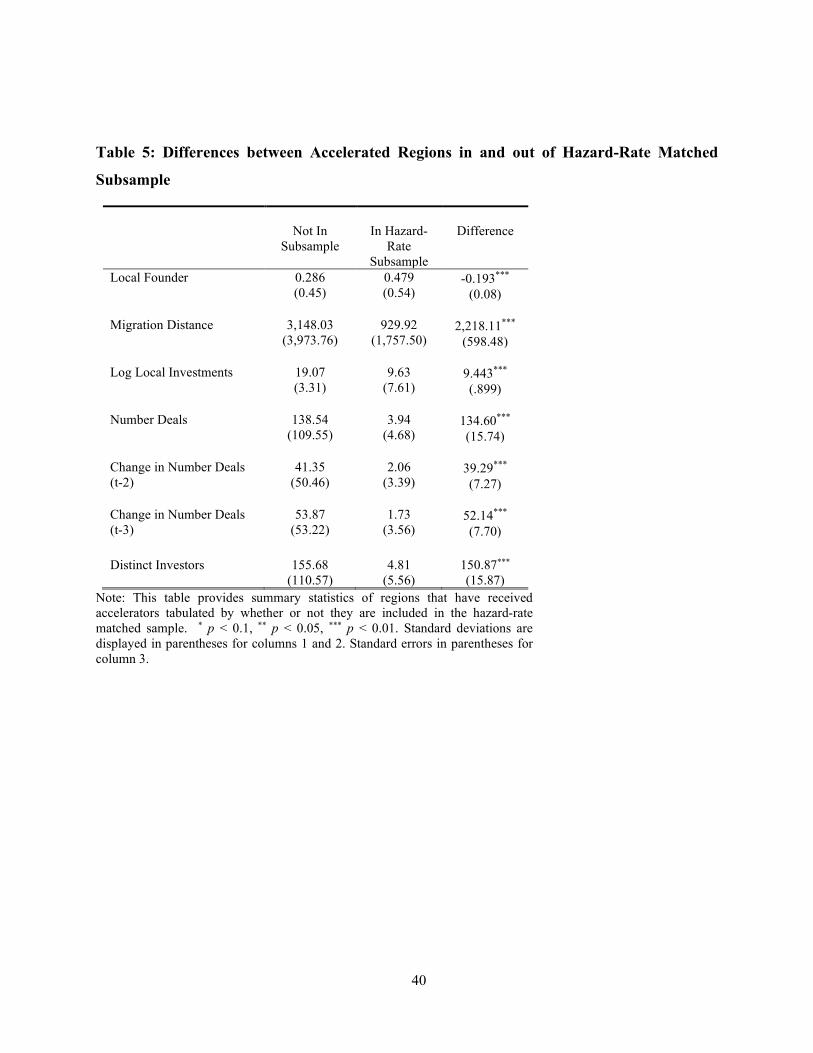
40
Table 5: Differences between Accelerated Regions in and out of Hazard-Rate Matched
Subsample
Not In
Subsample In Hazard-
Rate Subsample
Difference
Local Founder 0.286 (0.45)
0.479 (0.54)
-0.193*** (0.08)
Migration Distance 3,148.03
(3,973.76) 929.92
(1,757.50) 2,218.11***
(598.48) Log Local Investments 19.07
(3.31) 9.63
(7.61) 9.443*** (.899)
Number Deals 138.54
(109.55) 3.94
(4.68) 134.60*** (15.74)
Change in Number Deals (t-2)
41.35 (50.46)
2.06 (3.39)
39.29*** (7.27)
Change in Number Deals (t-3)
53.87 (53.22)
1.73 (3.56)
52.14*** (7.70)
Distinct Investors 155.68
(110.57) 4.81
(5.56) 150.87*** (15.87)
Note: This table provides summary statistics of regions that have received accelerators tabulated by whether or not they are included in the hazard-rate matched sample. * p < 0.1, ** p < 0.05, *** p < 0.01. Standard deviations are displayed in parentheses for columns 1 and 2. Standard errors in parentheses for column 3.
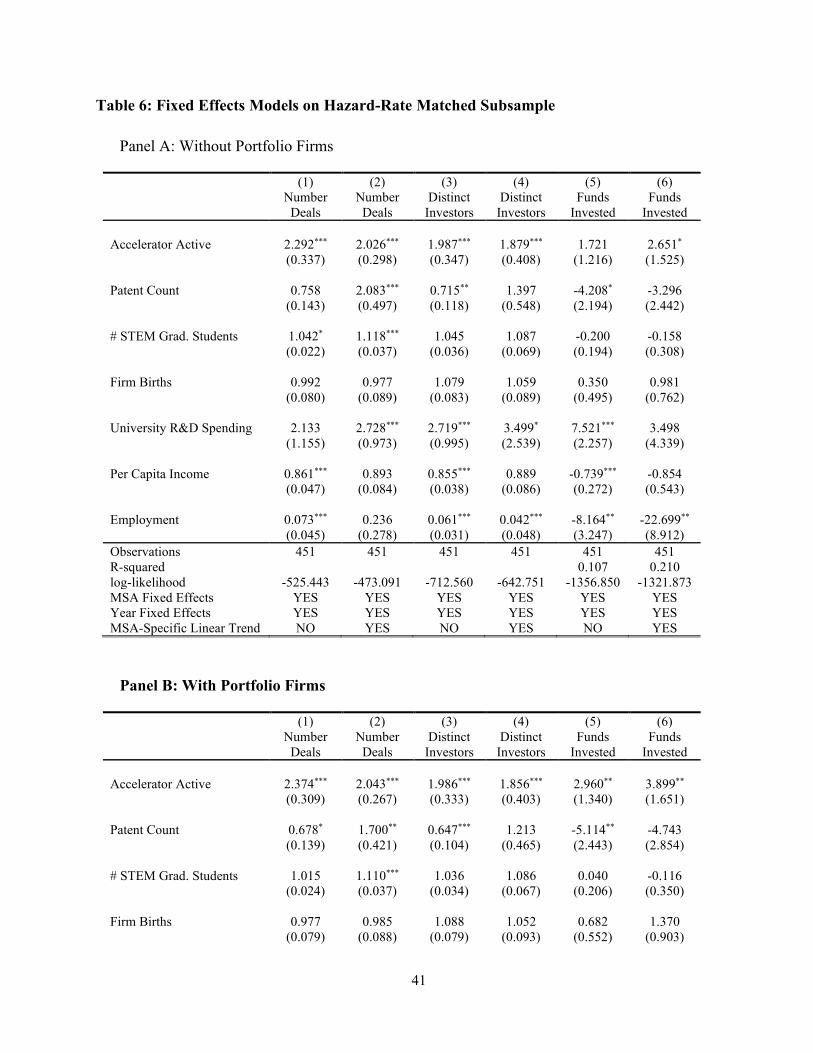
41
Table 6: Fixed Effects Models on Hazard-Rate Matched Subsample
Panel A: Without Portfolio Firms
(1) (2) (3) (4) (5) (6) Number
Deals Number
Deals Distinct
Investors Distinct
Investors Funds
Invested Funds
Invested Accelerator Active 2.292***
(0.337) 2.026*** (0.298)
1.987*** (0.347)
1.879*** (0.408)
1.721 (1.216)
2.651* (1.525)
Patent Count 0.758
(0.143) 2.083*** (0.497)
0.715** (0.118)
1.397 (0.548)
-4.208* (2.194)
-3.296 (2.442)
# STEM Grad. Students 1.042*
(0.022) 1.118*** (0.037)
1.045 (0.036)
1.087 (0.069)
-0.200 (0.194)
-0.158 (0.308)
Firm Births 0.992
(0.080) 0.977
(0.089) 1.079
(0.083) 1.059
(0.089) 0.350
(0.495) 0.981
(0.762) University R&D Spending 2.133
(1.155) 2.728*** (0.973)
2.719*** (0.995)
3.499* (2.539)
7.521*** (2.257)
3.498 (4.339)
Per Capita Income 0.861***
(0.047) 0.893
(0.084) 0.855*** (0.038)
0.889 (0.086)
-0.739*** (0.272)
-0.854 (0.543)
Employment 0.073***
(0.045) 0.236
(0.278) 0.061*** (0.031)
0.042*** (0.048)
-8.164** (3.247)
-22.699** (8.912)
Observations 451 451 451 451 451 451 R-squared 0.107 0.210 log-likelihood -525.443 -473.091 -712.560 -642.751 -1356.850 -1321.873 MSA Fixed Effects YES YES YES YES YES YES Year Fixed Effects YES YES YES YES YES YES MSA-Specific Linear Trend NO YES NO YES NO YES
Panel B: With Portfolio Firms
(1) (2) (3) (4) (5) (6) Number
Deals Number
Deals Distinct
Investors Distinct
Investors Funds
Invested Funds
Invested Accelerator Active 2.374***
(0.309) 2.043*** (0.267)
1.986*** (0.333)
1.856*** (0.403)
2.960** (1.340)
3.899** (1.651)
Patent Count 0.678*
(0.139) 1.700** (0.421)
0.647*** (0.104)
1.213 (0.465)
-5.114** (2.443)
-4.743 (2.854)
# STEM Grad. Students 1.015
(0.024) 1.110*** (0.037)
1.036 (0.034)
1.086 (0.067)
0.040 (0.206)
-0.116 (0.350)
Firm Births 0.977
(0.079) 0.985
(0.088) 1.088
(0.079) 1.052
(0.093) 0.682
(0.552) 1.370
(0.903)

42
University R&D Spending 1.841
(1.138) 2.563** (1.002)
2.488** (0.964)
3.468 (2.642)
7.843*** (2.509)
3.759 (5.509)
Per Capita Income 0.881**
(0.048) 0.895
(0.085) 0.860*** (0.037)
0.894 (0.089)
-0.863*** (0.284)
-0.817 (0.581)
Employment 0.075***
(0.045) 0.225
(0.218) 0.057*** (0.028)
0.068** (0.078)
-12.093*** (3.078)
-31.075** (12.457)
Observations 451 451 451 451 451 451 R-squared 0.107 0.210 log-likelihood -538.902 -486.561 -724.843 -662.893 -1357.225 -1329.485 MSA Fixed Effects YES YES YES YES YES YES Year Fixed Effects YES YES YES YES YES YES MSA-Specific Linear Trend NO YES NO YES NO YES
Note: In Panel A, we explore the impact of the arrival of an accelerator on investment activity outside the accelerator while Panel B includes each accelerator’s portfolio firms. Across both panels, we run the same models. Models (1) - (4) are QML Poisson fixed effects models with exponentiated coefficients — incident rate ratios (IRR)— so that a coefficient of 1 represents no effect and a 2 represents a 100% increase. Z-Statistic and p-value calculations are made based on untransformed models. Models (5) - (6) are log linear models where the dependent variable is logged dollars. * p < 0.1, ** p < 0.05, *** p < 0.01. Standard errors in parentheses. All standard errors are clustered at the MSA level.

43
Table 7: Triple Diff Models on Hazard-Rate Matched Sub-Sample
(1) (2) (3) (4) (5) (6) Number
Deals Number
Deals Distinct
Investors Distinct
Investors Funds
Invested Funds
Invested Treated Region X Treated Industry X Post-Treatment
4.286*** (1.911)
3.807*** (1.655)
2.949** (1.483)
2.677* (1.347)
0.346 (3.362)
-0.373 (3.578)
Treated Industry X Post-Treatment
1.056 (0.191)
1.218 (0.233)
1.285 (0.231)
1.441* (0.279)
2.927 (1.929)
3.762* (2.146)
Post-Treatment X Treated Region
0.545 (0.204)
0.491* (0.190)
0.604 (0.269)
0.560 (0.264)
-0.675 (0.970)
-1.268 (1.132)
Patent Count 0.717*
(0.127) 1.917*** (0.452)
0.647** (0.113)
1.348 (0.426)
-2.213** (0.893)
2.827 (2.642)
# STEM Grad. Students 1.003
(0.023) 1.079*** (0.030)
0.985 (0.032)
1.048 (0.049)
-0.286 (0.177)
0.112 (0.272)
Firm Births 0.925
(0.076) 0.944
(0.101) 0.990
(0.074) 1.026
(0.098) 0.100
(0.741) 0.561
(0.892) University R&D Spending 1.859*
(0.678) 1.375
(0.627) 1.971*** (0.464)
1.248 (0.921)
1.296 (1.672)
-2.346 (3.122)
Per Capita Income 0.870***
(0.045) 0.860* (0.077)
0.880*** (0.039)
0.870 (0.089)
-0.097 (0.171)
-0.397 (0.456)
Employment 0.113***
(0.065) 0.309
(0.417) 0.131*** (0.071)
0.076** (0.084)
-3.428 (5.538)
-4.544 (13.404)
Observations 902 902 902 902 902 902 R-squared 0.141 0.192 -823.758 -766.611 -1216.297 -1134.202 -2998.288 -2970.559 MSA Fixed Effects YES YES YES YES YES YES Year Fixed Effects YES YES YES YES YES YES MSA-Specific Linear Trend NO YES NO YES NO YES
Note: Because the semiconductor industry is a less-treated industry than software/IT, we exploit this within-MSA variation in a triple differences specification. By including an additional industry within our estimation, we can now control for within-MSA effects. Models (1) - (4) are QML Poisson fixed effects models with exponentiated coefficients — incident rate ratios (IRR)— so that a coefficient of 1 represents no effect and a 2 represents a 100% increase. Z-Statistic and p-value calculations are made based on untransformed models. Models (5) - (6) are log linear models where the dependent variable is logged dollars. All standard errors are clustered at the MSA level. * p < 0.1, ** p < 0.05, *** p < 0.01. Standard errors in parentheses.
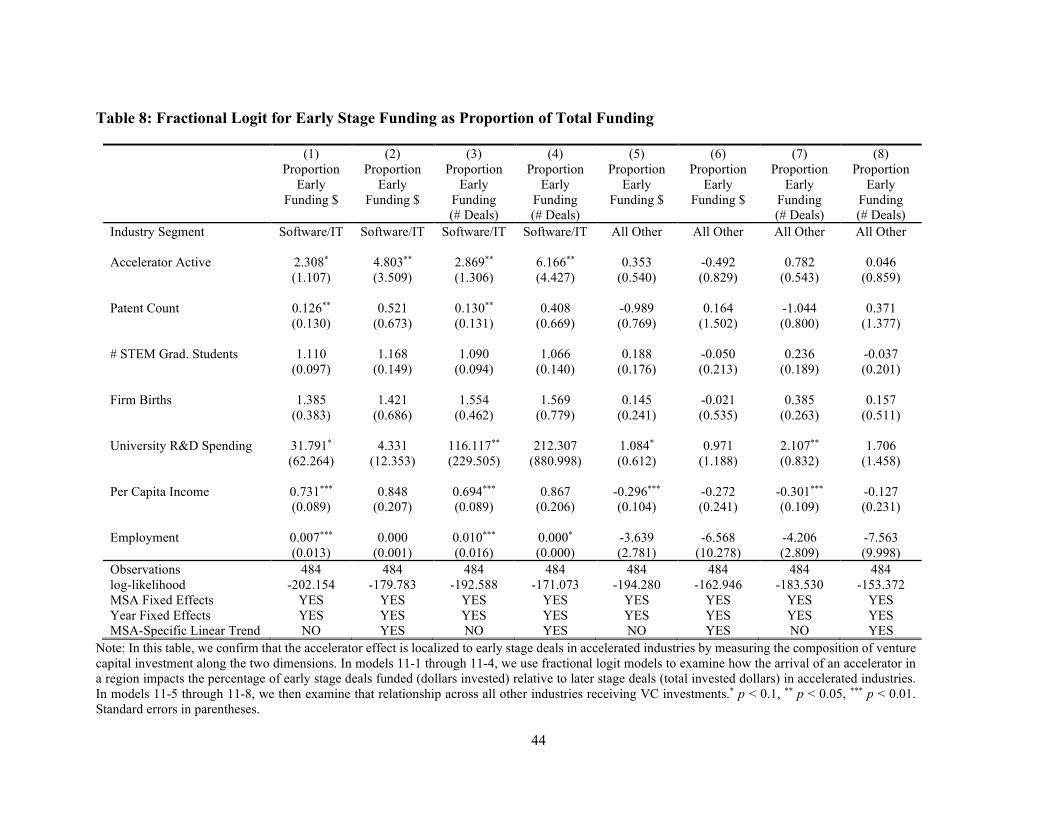
44
Table 8: Fractional Logit for Early Stage Funding as Proportion of Total Funding
(1) (2) (3) (4) (5) (6) (7) (8) Proportion
Early Funding $
Proportion Early
Funding $
Proportion Early
Funding (# Deals)
Proportion Early
Funding (# Deals)
Proportion Early
Funding $
Proportion Early
Funding $
Proportion Early
Funding (# Deals)
Proportion Early
Funding (# Deals)
Industry Segment
Software/IT Software/IT Software/IT Software/IT All Other All Other All Other All Other
Accelerator Active 2.308* (1.107)
4.803** (3.509)
2.869** (1.306)
6.166** (4.427)
0.353 (0.540)
-0.492 (0.829)
0.782 (0.543)
0.046 (0.859)
Patent Count 0.126**
(0.130) 0.521
(0.673) 0.130** (0.131)
0.408 (0.669)
-0.989 (0.769)
0.164 (1.502)
-1.044 (0.800)
0.371 (1.377)
# STEM Grad. Students 1.110
(0.097) 1.168
(0.149) 1.090
(0.094) 1.066
(0.140) 0.188
(0.176) -0.050 (0.213)
0.236 (0.189)
-0.037 (0.201)
Firm Births 1.385
(0.383) 1.421
(0.686) 1.554
(0.462) 1.569
(0.779) 0.145
(0.241) -0.021 (0.535)
0.385 (0.263)
0.157 (0.511)
University R&D Spending 31.791*
(62.264) 4.331
(12.353) 116.117** (229.505)
212.307 (880.998)
1.084* (0.612)
0.971 (1.188)
2.107** (0.832)
1.706 (1.458)
Per Capita Income 0.731***
(0.089) 0.848
(0.207) 0.694*** (0.089)
0.867 (0.206)
-0.296*** (0.104)
-0.272 (0.241)
-0.301*** (0.109)
-0.127 (0.231)
Employment 0.007***
(0.013) 0.000
(0.001) 0.010*** (0.016)
0.000* (0.000)
-3.639 (2.781)
-6.568 (10.278)
-4.206 (2.809)
-7.563 (9.998)
Observations 484 484 484 484 484 484 484 484 log-likelihood -202.154 -179.783 -192.588 -171.073 -194.280 -162.946 -183.530 -153.372 MSA Fixed Effects YES YES YES YES YES YES YES YES Year Fixed Effects YES YES YES YES YES YES YES YES MSA-Specific Linear Trend NO YES NO YES NO YES NO YES
Note: In this table, we confirm that the accelerator effect is localized to early stage deals in accelerated industries by measuring the composition of venture capital investment along the two dimensions. In models 11-1 through 11-4, we use fractional logit models to examine how the arrival of an accelerator in a region impacts the percentage of early stage deals funded (dollars invested) relative to later stage deals (total invested dollars) in accelerated industries. In models 11-5 through 11-8, we then examine that relationship across all other industries receiving VC investments.* p < 0.1, ** p < 0.05, *** p < 0.01. Standard errors in parentheses.
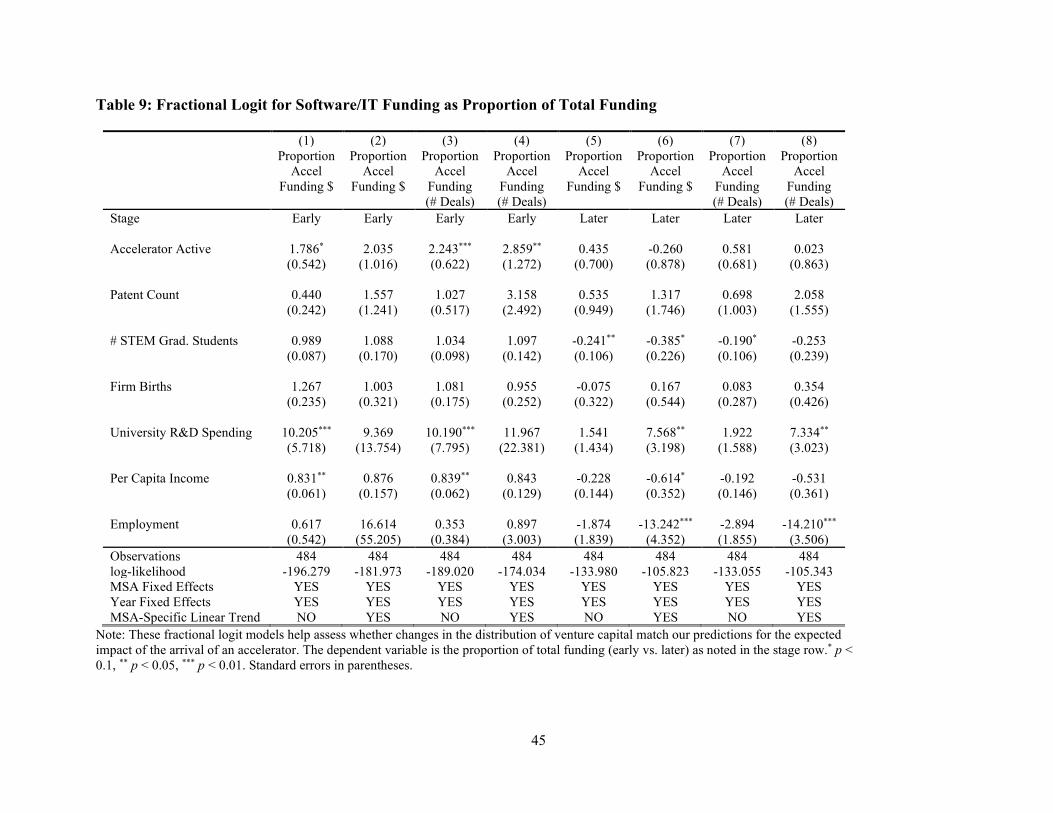
45
Table 9: Fractional Logit for Software/IT Funding as Proportion of Total Funding
(1) (2) (3) (4) (5) (6) (7) (8) Proportion
Accel Funding $
Proportion Accel
Funding $
Proportion Accel
Funding (# Deals)
Proportion Accel
Funding (# Deals)
Proportion Accel
Funding $
Proportion Accel
Funding $
Proportion Accel
Funding (# Deals)
Proportion Accel
Funding (# Deals)
Stage
Early Early Early Early Later Later Later Later
Accelerator Active 1.786* (0.542)
2.035 (1.016)
2.243*** (0.622)
2.859** (1.272)
0.435 (0.700)
-0.260 (0.878)
0.581 (0.681)
0.023 (0.863)
Patent Count 0.440
(0.242) 1.557
(1.241) 1.027
(0.517) 3.158
(2.492) 0.535
(0.949) 1.317
(1.746) 0.698
(1.003) 2.058
(1.555) # STEM Grad. Students 0.989
(0.087) 1.088
(0.170) 1.034
(0.098) 1.097
(0.142) -0.241** (0.106)
-0.385* (0.226)
-0.190* (0.106)
-0.253 (0.239)
Firm Births 1.267
(0.235) 1.003
(0.321) 1.081
(0.175) 0.955
(0.252) -0.075 (0.322)
0.167 (0.544)
0.083 (0.287)
0.354 (0.426)
University R&D Spending 10.205***
(5.718) 9.369
(13.754) 10.190*** (7.795)
11.967 (22.381)
1.541 (1.434)
7.568** (3.198)
1.922 (1.588)
7.334** (3.023)
Per Capita Income 0.831**
(0.061) 0.876
(0.157) 0.839** (0.062)
0.843 (0.129)
-0.228 (0.144)
-0.614* (0.352)
-0.192 (0.146)
-0.531 (0.361)
Employment 0.617
(0.542) 16.614
(55.205) 0.353
(0.384) 0.897
(3.003) -1.874 (1.839)
-13.242*** (4.352)
-2.894 (1.855)
-14.210*** (3.506)
Observations 484 484 484 484 484 484 484 484 log-likelihood -196.279 -181.973 -189.020 -174.034 -133.980 -105.823 -133.055 -105.343 MSA Fixed Effects YES YES YES YES YES YES YES YES Year Fixed Effects YES YES YES YES YES YES YES YES MSA-Specific Linear Trend NO YES NO YES NO YES NO YES
Note: These fractional logit models help assess whether changes in the distribution of venture capital match our predictions for the expected impact of the arrival of an accelerator. The dependent variable is the proportion of total funding (early vs. later) as noted in the stage row.* p < 0.1, ** p < 0.05, *** p < 0.01. Standard errors in parentheses.
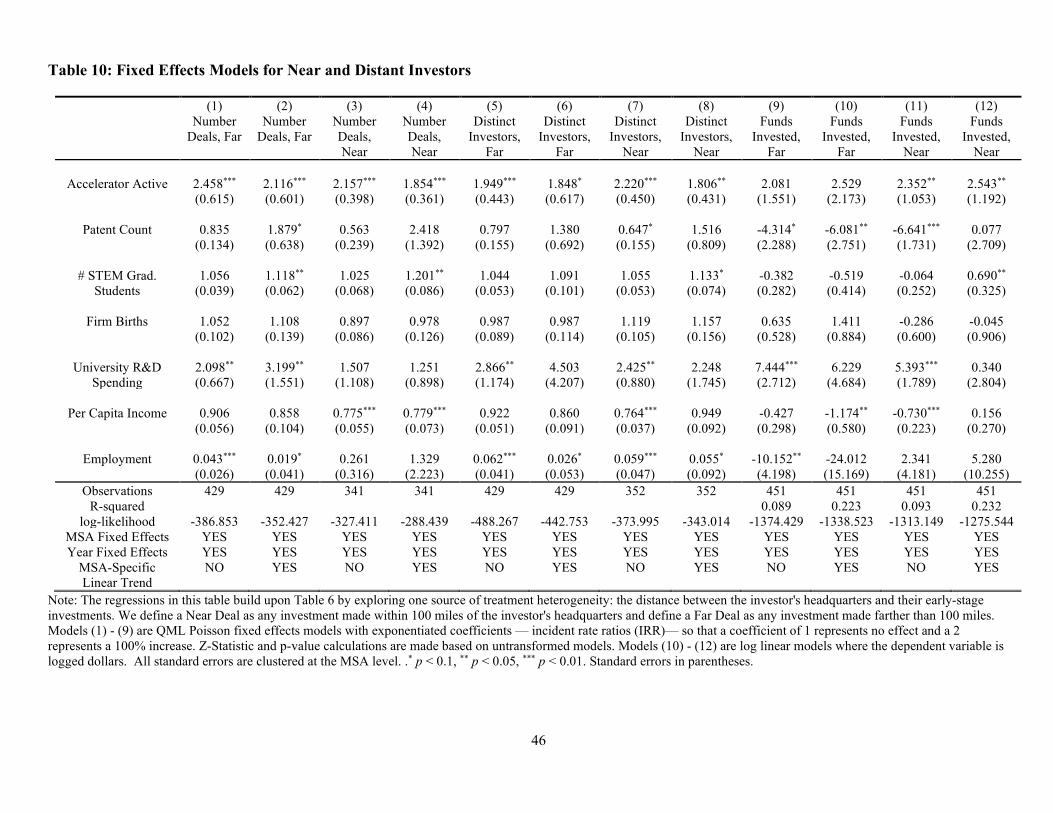
46
Table 10: Fixed Effects Models for Near and Distant Investors
(1) (2) (3) (4) (5) (6) (7) (8) (9) (10) (11) (12) Number
Deals, Far Number
Deals, Far Number Deals, Near
Number Deals, Near
Distinct Investors,
Far
Distinct Investors,
Far
Distinct Investors,
Near
Distinct Investors,
Near
Funds Invested,
Far
Funds Invested,
Far
Funds Invested,
Near
Funds Invested,
Near
Accelerator Active 2.458*** (0.615)
2.116*** (0.601)
2.157*** (0.398)
1.854*** (0.361)
1.949*** (0.443)
1.848* (0.617)
2.220*** (0.450)
1.806** (0.431)
2.081 (1.551)
2.529 (2.173)
2.352** (1.053)
2.543** (1.192)
Patent Count 0.835
(0.134) 1.879* (0.638)
0.563 (0.239)
2.418 (1.392)
0.797 (0.155)
1.380 (0.692)
0.647* (0.155)
1.516 (0.809)
-4.314* (2.288)
-6.081** (2.751)
-6.641*** (1.731)
0.077 (2.709)
# STEM Grad.
Students 1.056
(0.039) 1.118** (0.062)
1.025 (0.068)
1.201** (0.086)
1.044 (0.053)
1.091 (0.101)
1.055 (0.053)
1.133* (0.074)
-0.382 (0.282)
-0.519 (0.414)
-0.064 (0.252)
0.690** (0.325)
Firm Births 1.052
(0.102) 1.108
(0.139) 0.897
(0.086) 0.978
(0.126) 0.987
(0.089) 0.987
(0.114) 1.119
(0.105) 1.157
(0.156) 0.635
(0.528) 1.411
(0.884) -0.286 (0.600)
-0.045 (0.906)
University R&D
Spending 2.098** (0.667)
3.199** (1.551)
1.507 (1.108)
1.251 (0.898)
2.866** (1.174)
4.503 (4.207)
2.425** (0.880)
2.248 (1.745)
7.444*** (2.712)
6.229 (4.684)
5.393*** (1.789)
0.340 (2.804)
Per Capita Income 0.906
(0.056) 0.858
(0.104) 0.775*** (0.055)
0.779*** (0.073)
0.922 (0.051)
0.860 (0.091)
0.764*** (0.037)
0.949 (0.092)
-0.427 (0.298)
-1.174** (0.580)
-0.730*** (0.223)
0.156 (0.270)
Employment 0.043***
(0.026) 0.019* (0.041)
0.261 (0.316)
1.329 (2.223)
0.062*** (0.041)
0.026* (0.053)
0.059*** (0.047)
0.055* (0.092)
-10.152** (4.198)
-24.012 (15.169)
2.341 (4.181)
5.280 (10.255)
Observations 429 429 341 341 429 429 352 352 451 451 451 451 R-squared 0.089 0.223 0.093 0.232
log-likelihood -386.853 -352.427 -327.411 -288.439 -488.267 -442.753 -373.995 -343.014 -1374.429 -1338.523 -1313.149 -1275.544 MSA Fixed Effects YES YES YES YES YES YES YES YES YES YES YES YES Year Fixed Effects YES YES YES YES YES YES YES YES YES YES YES YES
MSA-Specific Linear Trend
NO YES NO YES NO YES NO YES NO YES NO YES
Note: The regressions in this table build upon Table 6 by exploring one source of treatment heterogeneity: the distance between the investor's headquarters and their early-stage investments. We define a Near Deal as any investment made within 100 miles of the investor's headquarters and define a Far Deal as any investment made farther than 100 miles. Models (1) - (9) are QML Poisson fixed effects models with exponentiated coefficients — incident rate ratios (IRR)— so that a coefficient of 1 represents no effect and a 2 represents a 100% increase. Z-Statistic and p-value calculations are made based on untransformed models. Models (10) - (12) are log linear models where the dependent variable is logged dollars. All standard errors are clustered at the MSA level. .* p < 0.1, ** p < 0.05, *** p < 0.01. Standard errors in parentheses.
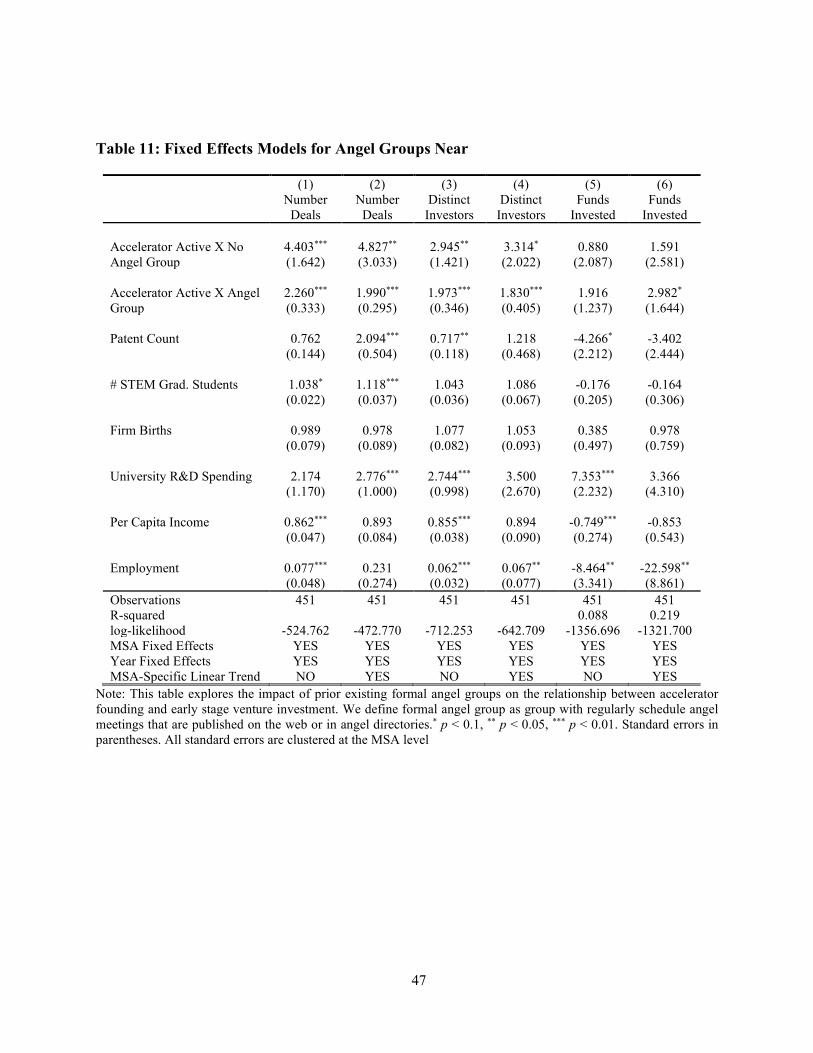
47
Table 11: Fixed Effects Models for Angel Groups Near
(1) (2) (3) (4) (5) (6) Number
Deals Number
Deals Distinct
Investors Distinct
Investors Funds
Invested Funds
Invested Accelerator Active X No Angel Group
4.403*** (1.642)
4.827** (3.033)
2.945** (1.421)
3.314* (2.022)
0.880 (2.087)
1.591 (2.581)
Accelerator Active X Angel Group
2.260*** (0.333)
1.990*** (0.295)
1.973*** (0.346)
1.830*** (0.405)
1.916 (1.237)
2.982* (1.644)
Patent Count 0.762
(0.144) 2.094*** (0.504)
0.717** (0.118)
1.218 (0.468)
-4.266* (2.212)
-3.402 (2.444)
# STEM Grad. Students 1.038*
(0.022) 1.118*** (0.037)
1.043 (0.036)
1.086 (0.067)
-0.176 (0.205)
-0.164 (0.306)
Firm Births 0.989
(0.079) 0.978
(0.089) 1.077
(0.082) 1.053
(0.093) 0.385
(0.497) 0.978
(0.759) University R&D Spending 2.174
(1.170) 2.776*** (1.000)
2.744*** (0.998)
3.500 (2.670)
7.353*** (2.232)
3.366 (4.310)
Per Capita Income 0.862***
(0.047) 0.893
(0.084) 0.855*** (0.038)
0.894 (0.090)
-0.749*** (0.274)
-0.853 (0.543)
Employment 0.077***
(0.048) 0.231
(0.274) 0.062*** (0.032)
0.067** (0.077)
-8.464** (3.341)
-22.598** (8.861)
Observations 451 451 451 451 451 451 R-squared 0.088 0.219 log-likelihood -524.762 -472.770 -712.253 -642.709 -1356.696 -1321.700 MSA Fixed Effects YES YES YES YES YES YES Year Fixed Effects YES YES YES YES YES YES MSA-Specific Linear Trend NO YES NO YES NO YES
Note: This table explores the impact of prior existing formal angel groups on the relationship between accelerator founding and early stage venture investment. We define formal angel group as group with regularly schedule angel meetings that are published on the web or in angel directories.* p < 0.1, ** p < 0.05, *** p < 0.01. Standard errors in parentheses. All standard errors are clustered at the MSA level
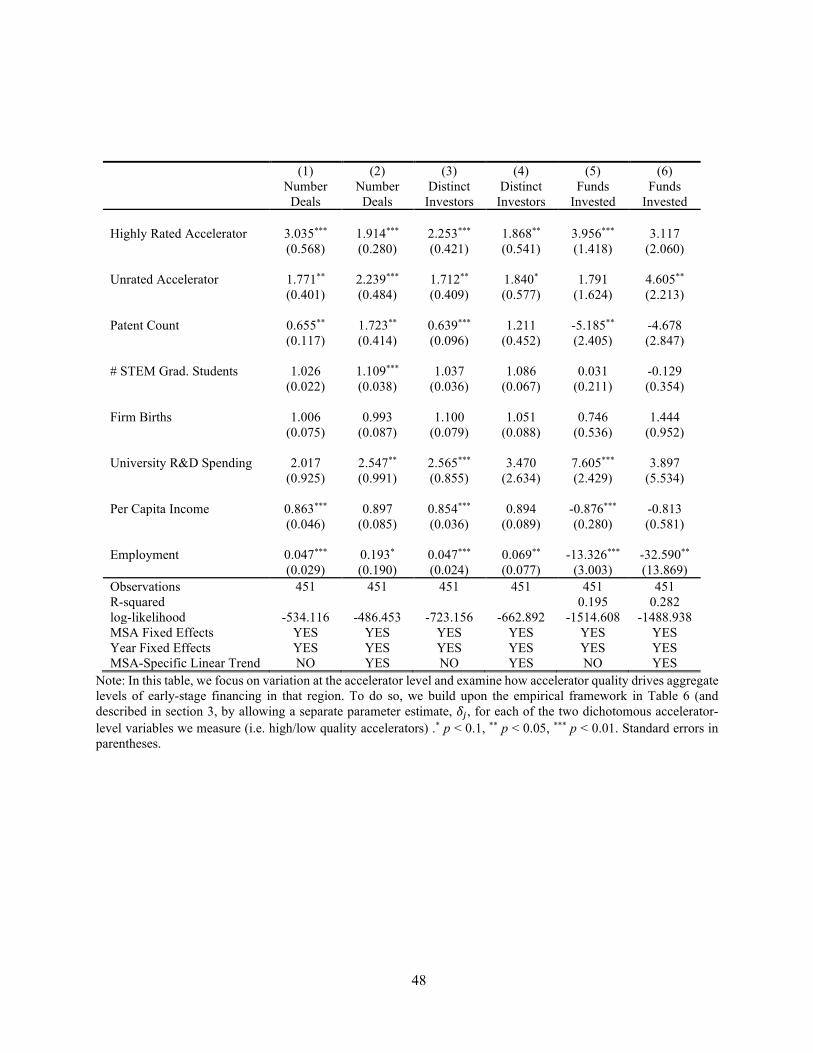
48
(1) (2) (3) (4) (5) (6) Number
Deals Number
Deals Distinct
Investors Distinct
Investors Funds
Invested Funds
Invested Highly Rated Accelerator 3.035***
(0.568) 1.914*** (0.280)
2.253*** (0.421)
1.868** (0.541)
3.956*** (1.418)
3.117 (2.060)
Unrated Accelerator 1.771**
(0.401) 2.239*** (0.484)
1.712** (0.409)
1.840* (0.577)
1.791 (1.624)
4.605** (2.213)
Patent Count 0.655**
(0.117) 1.723** (0.414)
0.639*** (0.096)
1.211 (0.452)
-5.185** (2.405)
-4.678 (2.847)
# STEM Grad. Students 1.026
(0.022) 1.109*** (0.038)
1.037 (0.036)
1.086 (0.067)
0.031 (0.211)
-0.129 (0.354)
Firm Births 1.006
(0.075) 0.993
(0.087) 1.100
(0.079) 1.051
(0.088) 0.746
(0.536) 1.444
(0.952) University R&D Spending 2.017
(0.925) 2.547** (0.991)
2.565*** (0.855)
3.470 (2.634)
7.605*** (2.429)
3.897 (5.534)
Per Capita Income 0.863***
(0.046) 0.897
(0.085) 0.854*** (0.036)
0.894 (0.089)
-0.876*** (0.280)
-0.813 (0.581)
Employment 0.047***
(0.029) 0.193* (0.190)
0.047*** (0.024)
0.069** (0.077)
-13.326*** (3.003)
-32.590** (13.869)
Observations 451 451 451 451 451 451 R-squared 0.195 0.282 log-likelihood -534.116 -486.453 -723.156 -662.892 -1514.608 -1488.938 MSA Fixed Effects YES YES YES YES YES YES Year Fixed Effects YES YES YES YES YES YES MSA-Specific Linear Trend NO YES NO YES NO YES
Note: In this table, we focus on variation at the accelerator level and examine how accelerator quality drives aggregate levels of early-stage financing in that region. To do so, we build upon the empirical framework in Table 6 (and described in section 3, by allowing a separate parameter estimate, 𝛿𝛿𝑗𝑗, for each of the two dichotomous accelerator-level variables we measure (i.e. high/low quality accelerators) .* p < 0.1, ** p < 0.05, *** p < 0.01. Standard errors in parentheses.
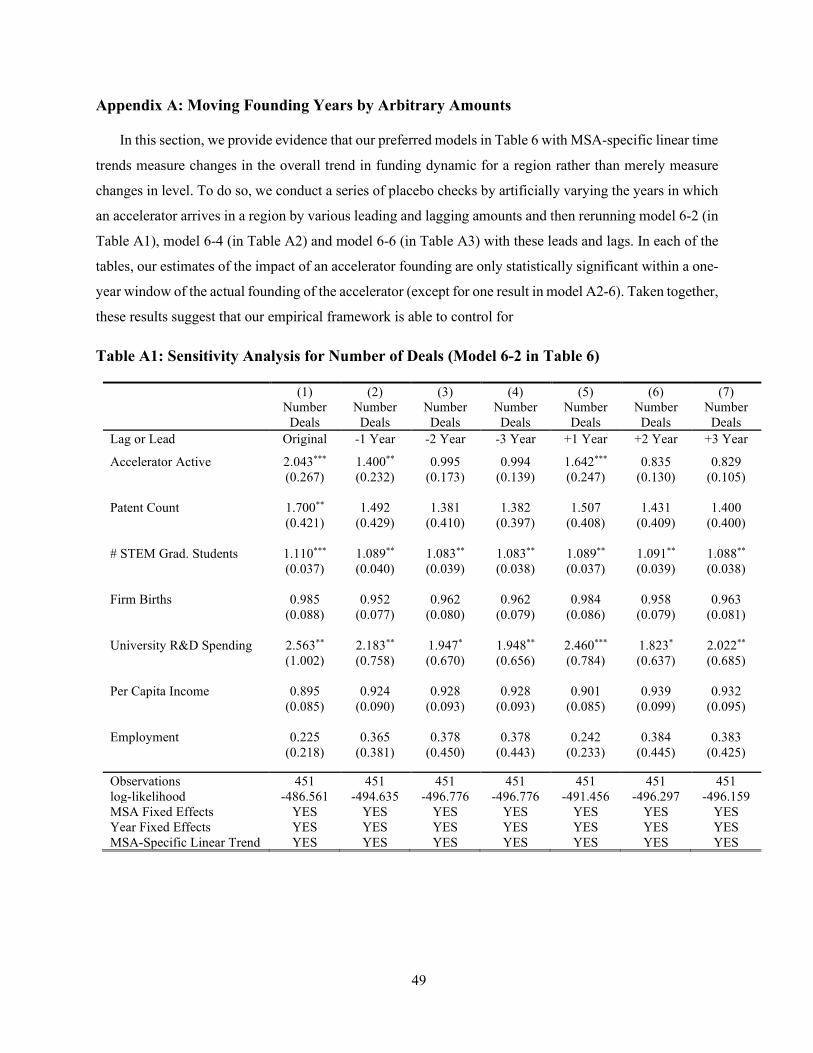
49
Appendix A: Moving Founding Years by Arbitrary Amounts
In this section, we provide evidence that our preferred models in Table 6 with MSA-specific linear time
trends measure changes in the overall trend in funding dynamic for a region rather than merely measure
changes in level. To do so, we conduct a series of placebo checks by artificially varying the years in which
an accelerator arrives in a region by various leading and lagging amounts and then rerunning model 6-2 (in
Table A1), model 6-4 (in Table A2) and model 6-6 (in Table A3) with these leads and lags. In each of the
tables, our estimates of the impact of an accelerator founding are only statistically significant within a one-
year window of the actual founding of the accelerator (except for one result in model A2-6). Taken together,
these results suggest that our empirical framework is able to control for
Table A1: Sensitivity Analysis for Number of Deals (Model 6-2 in Table 6)
(1) (2) (3) (4) (5) (6) (7) Number
Deals Number
Deals Number
Deals Number
Deals Number
Deals Number
Deals Number
Deals Lag or Lead Original -1 Year -2 Year -3 Year +1 Year +2 Year +3 Year
Accelerator Active 2.043*** (0.267)
1.400** (0.232)
0.995 (0.173)
0.994 (0.139)
1.642*** (0.247)
0.835 (0.130)
0.829 (0.105)
Patent Count 1.700**
(0.421) 1.492
(0.429) 1.381
(0.410) 1.382
(0.397) 1.507
(0.408) 1.431
(0.409) 1.400
(0.400) # STEM Grad. Students 1.110***
(0.037) 1.089** (0.040)
1.083** (0.039)
1.083** (0.038)
1.089** (0.037)
1.091** (0.039)
1.088** (0.038)
Firm Births 0.985
(0.088) 0.952
(0.077) 0.962
(0.080) 0.962
(0.079) 0.984
(0.086) 0.958
(0.079) 0.963
(0.081) University R&D Spending 2.563**
(1.002) 2.183** (0.758)
1.947* (0.670)
1.948** (0.656)
2.460*** (0.784)
1.823* (0.637)
2.022** (0.685)
Per Capita Income 0.895
(0.085) 0.924
(0.090) 0.928
(0.093) 0.928
(0.093) 0.901
(0.085) 0.939
(0.099) 0.932
(0.095) Employment 0.225
(0.218) 0.365
(0.381) 0.378
(0.450) 0.378
(0.443) 0.242
(0.233) 0.384
(0.445) 0.383
(0.425) Observations 451 451 451 451 451 451 451 log-likelihood -486.561 -494.635 -496.776 -496.776 -491.456 -496.297 -496.159 MSA Fixed Effects YES YES YES YES YES YES YES Year Fixed Effects YES YES YES YES YES YES YES MSA-Specific Linear Trend YES YES YES YES YES YES YES
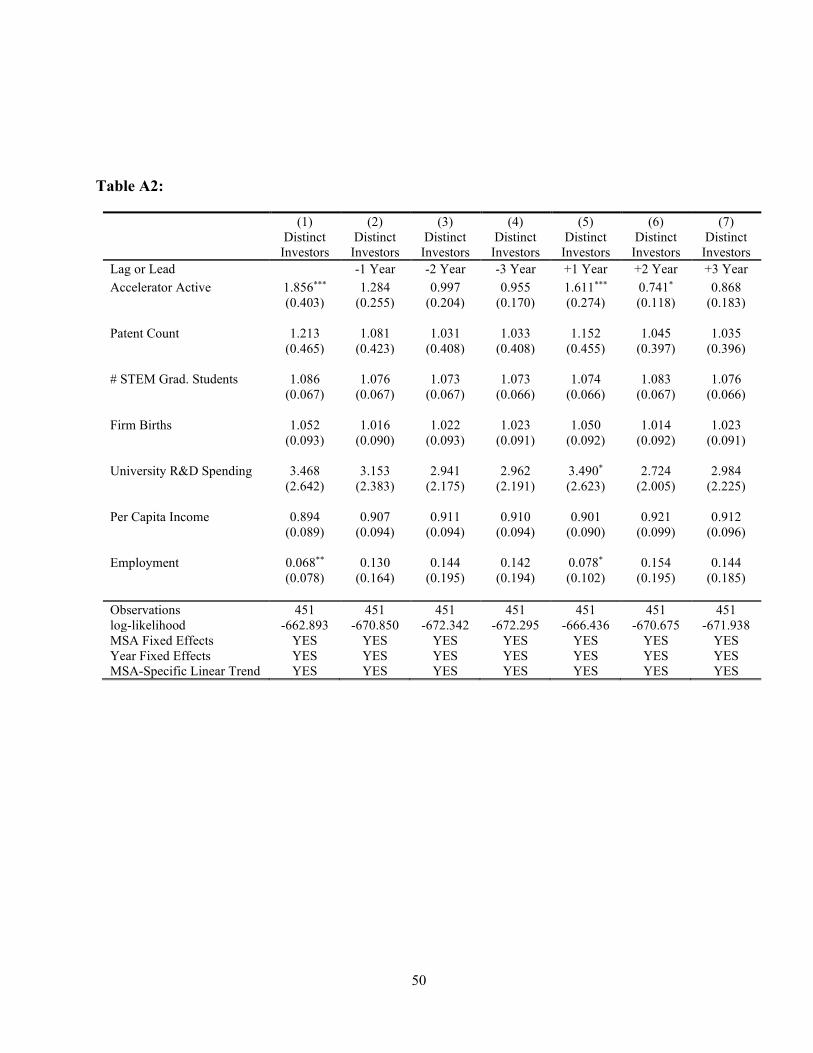
50
Table A2:
(1) (2) (3) (4) (5) (6) (7) Distinct
Investors Distinct
Investors Distinct
Investors Distinct
Investors Distinct
Investors Distinct
Investors Distinct
Investors Lag or Lead -1 Year -2 Year -3 Year +1 Year +2 Year +3 Year Accelerator Active 1.856***
(0.403) 1.284
(0.255) 0.997
(0.204) 0.955
(0.170) 1.611*** (0.274)
0.741* (0.118)
0.868 (0.183)
Patent Count 1.213
(0.465) 1.081
(0.423) 1.031
(0.408) 1.033
(0.408) 1.152
(0.455) 1.045
(0.397) 1.035
(0.396) # STEM Grad. Students 1.086
(0.067) 1.076
(0.067) 1.073
(0.067) 1.073
(0.066) 1.074
(0.066) 1.083
(0.067) 1.076
(0.066) Firm Births 1.052
(0.093) 1.016
(0.090) 1.022
(0.093) 1.023
(0.091) 1.050
(0.092) 1.014
(0.092) 1.023
(0.091) University R&D Spending 3.468
(2.642) 3.153
(2.383) 2.941
(2.175) 2.962
(2.191) 3.490* (2.623)
2.724 (2.005)
2.984 (2.225)
Per Capita Income 0.894
(0.089) 0.907
(0.094) 0.911
(0.094) 0.910
(0.094) 0.901
(0.090) 0.921
(0.099) 0.912
(0.096) Employment 0.068**
(0.078) 0.130
(0.164) 0.144
(0.195) 0.142
(0.194) 0.078* (0.102)
0.154 (0.195)
0.144 (0.185)
Observations 451 451 451 451 451 451 451 log-likelihood -662.893 -670.850 -672.342 -672.295 -666.436 -670.675 -671.938 MSA Fixed Effects YES YES YES YES YES YES YES Year Fixed Effects YES YES YES YES YES YES YES MSA-Specific Linear Trend YES YES YES YES YES YES YES

51
Table A3: Sensitivity Analysis for Funds Invested (Model 6-6 in Table 6)
(1) (2) (3) (4) (5) (6) (7) Funds
Invested Funds
Invested Funds
Invested Funds
Invested Funds
Invested Funds
Invested Funds
Invested Lag or Lead -1 Year -2 Year -3 Year +1 Year +2 Year +3 Year Accelerator Active 0.336**
(0.153) 0.017
(0.142) -0.240 (0.149)
-0.194 (0.178)
0.333** (0.149)
0.207 (0.186)
0.021 (0.129)
Patent Count 0.000
(0.261) -0.069 (0.262)
-0.084 (0.264)
-0.071 (0.260)
-0.014 (0.271)
-0.083 (0.260)
-0.072 (0.261)
# STEM Grad. Students -0.018
(0.034) -0.020 (0.034)
-0.020 (0.034)
-0.020 (0.033)
-0.023 (0.035)
-0.027 (0.036)
-0.020 (0.034)
Firm Births 0.061
(0.092) 0.047
(0.096) 0.058
(0.097) 0.050
(0.094) 0.060
(0.094) 0.050
(0.096) 0.047
(0.095) University R&D Spending 0.228
(0.493) 0.147
(0.479) 0.148
(0.481) 0.172
(0.484) 0.239
(0.498) 0.182
(0.487) 0.141
(0.481) Per Capita Income -0.095*
(0.057) -0.092 (0.058)
-0.097* (0.056)
-0.093 (0.057)
-0.094* (0.057)
-0.095* (0.057)
-0.092 (0.058)
Employment -2.730***
(1.024) -2.408** (1.015)
-2.314** (1.061)
-2.375** (1.009)
-2.603** (1.058)
-2.394** (1.063)
-2.395* (1.039)
Observations 451 451 451 451 451 451 451 log-likelihood -1443.305 -1450.968 -1446.987 -1448.493 -1444.235 -1449.297 -1450.97 MSA Fixed Effects YES YES YES YES YES YES YES Year Fixed Effects YES YES YES YES YES YES YES MSA-Specific Linear Trend YES YES YES YES YES YES YES

52
Appendix B: Synthetic Control Methodology (Cavallo et al. 2013)
We use the multiple comparative case study methodology outlined in Cavallo et al. (2013). As a
firsdt step in understanding the methodological approach, consider the case where we wish to evaluate the
effect of treatment on a single MSA (we will later aggregate the MSA-specific effects into an average
effect).
Assume we observe N + 1 MSAs. Without loss of generality, let the first MSA be that which is
exposed to the treatment (accelerator arrival), and retain the remaining N MSAs as potential controls. In the
synthetic control approach, it is assumed that the treated unit is uninterruptedly exposed to treatment after
an initial intervention. Here, we consider the establishment of the first accelerator in the MSA as the
initiation of the intervention period, which includes the years following the initial treatment.
Following Abadie et al (2010), let YitC be the number of deals (investors, dollars) that would be
observed for country i at time t in the absence of the arrival of an accelerator, for MSAs i = 1,…,N + 1, and
t = 1,…,T. Let T0 be the number of periods before the disaster, with 1 ≤ T0 < T. Let YitA be the outcome that
would be observed for MSA i at time t if MSA i is treated with an accelerator beginning in period T0 + 1 to
T. To the extent that the arrival of an accelerator is unpredictable, it has no effect on the outcome variable
prior to its arrival, i.e. for t ∈ {𝟏𝟏, … ,𝑻𝑻𝟎𝟎} and all i ∈ {𝟏𝟏, … ,𝑵𝑵}, YitC = Yit
A.
Let αit = YitA - Yit
C be the effect of an accelerator on MSA i at time t when MSA i receives an
accelerator, for periods T0 + 1, T0 +2,…T. This effect may potentially vary over time. Denote Dit as an
indicator that takes the value of 1 if MSA i receives an accelerator at time t, and zero otherwise. Then the
number of deals (investors, dollars) for MSA i at time t is:
𝒀𝒀𝒊𝒊𝒊𝒊 = 𝒀𝒀𝒊𝒊𝒊𝒊𝑨𝑨 + 𝜶𝜶𝒊𝒊𝒊𝒊𝑫𝑫𝒊𝒊𝒊𝒊
Because only one MSA (MSA 1) is exposed to the accelerator and only after period T0, we have that
𝑇𝑇𝑖𝑖𝑡𝑡 = �1, 𝑖𝑖𝑓𝑓 𝑖𝑖 = 1 𝑚𝑚𝑎𝑎𝑎𝑎 𝑡𝑡 > 𝛿𝛿00, 𝑜𝑜𝑡𝑡ℎ𝑒𝑒𝑒𝑒𝑒𝑒𝑖𝑖𝑚𝑚𝑒𝑒
The parameters of interest are (α1,T0+1,…,α1,T), the lead-specific causal effect of the arrival of an
accelerator on the outcome of interest. For t < T0,
𝜶𝜶𝟏𝟏𝒊𝒊 = 𝒀𝒀𝟏𝟏𝒊𝒊𝑨𝑨 − 𝒀𝒀𝟏𝟏𝒊𝒊𝑪𝑪 = 𝒀𝒀𝟏𝟏𝒊𝒊 − 𝒀𝒀𝟏𝟏𝒊𝒊𝑪𝑪
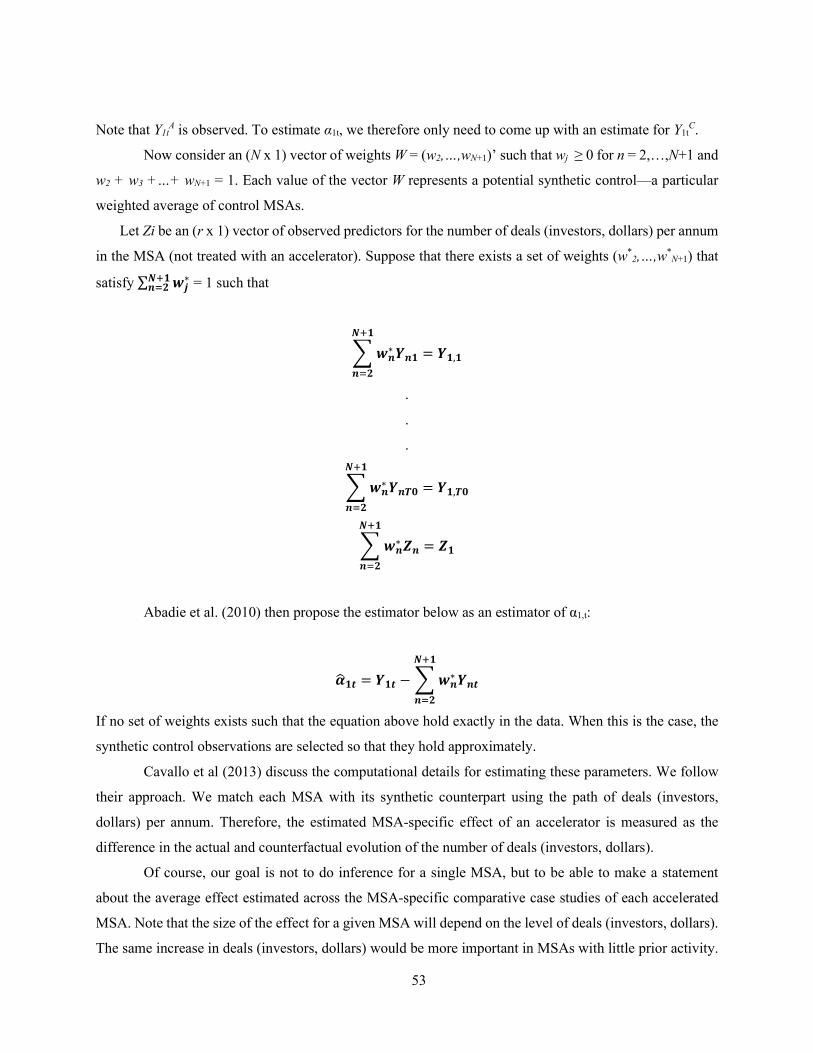
53
Note that Y1tA is observed. To estimate α1t, we therefore only need to come up with an estimate for Y1t
C.
Now consider an (N x 1) vector of weights W = (w2,…,wN+1)’ such that wj ≥ 0 for n = 2,…,N+1 and
w2 + w3 +…+ wN+1 = 1. Each value of the vector W represents a potential synthetic control—a particular
weighted average of control MSAs.
Let Zi be an (r x 1) vector of observed predictors for the number of deals (investors, dollars) per annum
in the MSA (not treated with an accelerator). Suppose that there exists a set of weights (w*2,…,w*
N+1) that
satisfy ∑ 𝒘𝒘𝒋𝒋∗𝑵𝑵+𝟏𝟏
𝒏𝒏=𝟐𝟐 = 1 such that
�𝒘𝒘𝒏𝒏∗𝒀𝒀𝒏𝒏𝟏𝟏 = 𝒀𝒀𝟏𝟏,𝟏𝟏
𝑵𝑵+𝟏𝟏
𝒏𝒏=𝟐𝟐
.
.
.
�𝒘𝒘𝒏𝒏∗𝒀𝒀𝒏𝒏𝑻𝑻𝟎𝟎 = 𝒀𝒀𝟏𝟏,𝑻𝑻𝟎𝟎
𝑵𝑵+𝟏𝟏
𝒏𝒏=𝟐𝟐
�𝒘𝒘𝒏𝒏∗𝒁𝒁𝒏𝒏 = 𝒁𝒁𝟏𝟏
𝑵𝑵+𝟏𝟏
𝒏𝒏=𝟐𝟐
Abadie et al. (2010) then propose the estimator below as an estimator of α1,t:
𝜶𝜶�𝟏𝟏𝒊𝒊 = 𝒀𝒀𝟏𝟏𝒊𝒊 − �𝒘𝒘𝒏𝒏∗𝒀𝒀𝒏𝒏𝒊𝒊
𝑵𝑵+𝟏𝟏
𝒏𝒏=𝟐𝟐
If no set of weights exists such that the equation above hold exactly in the data. When this is the case, the
synthetic control observations are selected so that they hold approximately.
Cavallo et al (2013) discuss the computational details for estimating these parameters. We follow
their approach. We match each MSA with its synthetic counterpart using the path of deals (investors,
dollars) per annum. Therefore, the estimated MSA-specific effect of an accelerator is measured as the
difference in the actual and counterfactual evolution of the number of deals (investors, dollars).
Of course, our goal is not to do inference for a single MSA, but to be able to make a statement
about the average effect estimated across the MSA-specific comparative case studies of each accelerated
MSA. Note that the size of the effect for a given MSA will depend on the level of deals (investors, dollars).
The same increase in deals (investors, dollars) would be more important in MSAs with little prior activity.

54
Thus, we need to normalize the estimates before pooling the MSA-specific results to come up with the
average effect of an accelerator. We normalize by setting the outcome variable (deals, dollars, investors) to
be equal to one in the treatment year.
Recall that our lead estimates of the effect of an accelerator on the treated MSA of interest are
denoted by �𝜶𝜶�𝟏𝟏,𝑻𝑻𝟎𝟎+𝟏𝟏, . . . ,𝜶𝜶�𝟏𝟏,𝑻𝑻� for leads 1, 2,…, T - T0. We wish to take the average across G accelerated
MSAs of interest. Then the estimated average effect for G accelerators is given by
𝜶𝜶� = �𝜶𝜶�𝑻𝑻𝟎𝟎+𝟏𝟏, . . . ,𝜶𝜶�𝑻𝑻� = 𝟏𝟏𝑮𝑮�(𝜶𝜶�𝒈𝒈,𝑻𝑻𝟎𝟎+𝟏𝟏, . . . ,𝜶𝜶�𝒈𝒈,𝑻𝑻)𝑮𝑮
𝒈𝒈=𝟏𝟏
.
To evaluate statistical significance of the estimates, we follow Cavallo et al, Abadi and Gardeazabal
(2003) and Abadie et al (2010) and use exact inference techniques, similar to permutation tests. These
methods allow valid inference regardless of the number of available control MSAs and the number of
available pre-accelerator periods.
As in classical permutation tests, we apply the synthetic control method to every potential control in
our sample. This allows us to assess whether the effect estimated by the synthetic control for the MSA
affected by the accelerator is large relative to the effect estimated for an MSA chosen at random (which
was not exposed to an accelerator). This inferential exercise is exact in the sense that regardless of the
number of available comparison MSAs and time periods, it is always possible to calculate the exact
distribution of the estimated effect of the placebos. More generally, this inferential exercise examines
whether the estimated effect of an accelerator’s arrival is large relative to the distribution of the effects
estimated for the MSAs not exposed to an accelerator. More formally, assume that we are doing inference
about point estimates at every lead l (every year after the accelerator arrives). We can then compute a lead-
specific significance level (p-value) for the estimated accelerator impact as:
𝒑𝒑 − value𝒍𝒍 = 𝑷𝑷𝑷𝑷�𝜶𝜶�𝟏𝟏,𝒍𝒍𝑷𝑷𝑷𝑷 < 𝜶𝜶�𝟏𝟏,𝒍𝒍� =
∑ �𝜶𝜶�𝟏𝟏,𝒍𝒍𝑷𝑷𝑷𝑷(𝒏𝒏) < 𝜶𝜶�𝟏𝟏,𝒍𝒍�𝑵𝑵+𝟏𝟏
𝒏𝒏=𝟐𝟐
# of control MSAs= ∑ �𝜶𝜶�𝟏𝟏,𝒍𝒍
𝑷𝑷𝑷𝑷(𝒏𝒏) < 𝜶𝜶�𝟏𝟏,𝒍𝒍�𝑵𝑵+𝟏𝟏𝒏𝒏=𝟐𝟐
𝑵𝑵
where 𝜶𝜶�𝟏𝟏,𝒍𝒍𝑷𝑷𝑷𝑷(𝒏𝒏) is the lead l-specific effect of an accelerator when control MSA n is assigned a placebo (PL)
accelerator at the same time as MSA 1. 𝜶𝜶�𝟏𝟏,𝒍𝒍𝑷𝑷𝑷𝑷(𝒏𝒏) is computed following the same computational procedure
as for the estimate 𝜶𝜶�𝟏𝟏,𝒍𝒍. By computing 𝜶𝜶�𝟏𝟏,𝒍𝒍𝑷𝑷𝑷𝑷(𝒏𝒏)for every MSA n in the control pool for MSA 1, we can
characterize the distribution of placebo effects and assess how the estimate 𝜶𝜶�𝟏𝟏,𝒍𝒍 ranks in that distribution.
To conduct valid inference for 𝜶𝜶� we need to account for the fact that the average smooths out some
noise. We then construct a distribution of average placebo effects according to the following steps:

55
1. For each disaster g of interest, we compute all the placebo effects using the available controls ng =
2,…, Ng + 1 corresponding to disaster g.
2. At each lead, we compute every possible placebo average effect by picking a single placebo
estimate corresponding to each disaster g and then taking the average across the G placebos. There
are many possible placebo averages:
𝑴𝑴𝑷𝑷𝑷𝑷���� = 𝐍𝐍𝐍𝐍𝐍𝐍𝐍𝐍𝐍𝐍𝐍𝐍 𝐨𝐨𝐨𝐨 𝐩𝐩𝐨𝐨𝐩𝐩𝐩𝐩𝐩𝐩𝐍𝐍𝐩𝐩𝐍𝐍 𝐩𝐩𝐩𝐩𝐩𝐩𝐩𝐩𝐍𝐍𝐍𝐍𝐨𝐨 𝐩𝐩𝐚𝐚𝐍𝐍𝐍𝐍𝐩𝐩𝐚𝐚𝐍𝐍𝐩𝐩 = �𝑱𝑱𝒈𝒈
𝑮𝑮
𝒈𝒈=𝟏𝟏
We index all these possible placebo averages by np = 1,…, 𝑴𝑴𝑷𝑷𝑷𝑷����. This number grows very quickly
in G and the typical Ng.
3. We rank the actual lead-specific average accelerator effect 𝜶𝜶𝒍𝒍��� in the distribution of 𝑴𝑴𝑷𝑷𝑷𝑷���� average
placebo effects (this involves 𝑴𝑴𝑷𝑷𝑷𝑷���� comparisons.)
4. Finally, we compute the lead l specific p-value for the average as:
p-value𝒍𝒍= Pr �𝟏𝟏𝑮𝑮�𝜶𝜶�𝒈𝒈𝒍𝒍𝑷𝑷𝑷𝑷𝑮𝑮
𝒈𝒈=𝟏𝟏
< 𝜶𝜶�𝒍𝒍�

56
Appendix C: Location Decisions of Accelerator Founders
In our work with startup accelerators, we have collected substantial qualitative evidence that suggests
that most startup accelerators are founded not in order to take advantage of a region’s growing
entrepreneurial activity, but rather to catalyze activity in a region in which it is lacking. We lend support to
this anecdotal evidence more formally through a series of regressions that measure the statistical differences
between startup accelerators in and out of our hazard-rate matched sample.
Column 1 of Table C1 shows that the accelerators in our matched sample have founders whose high
school was 1,668 miles closer to the location of their startup accelerator versus the founders of accelerators
in regions such as New York, San Francisco or Boston, which were unmatched because they were off the
common support.11 Column (2) uses the full distribution of data (both matched and unmatched accelerators)
to look at how the logged total level of early-stage investments in a region at the time of an accelerator’s
founding is related to the migration distance of accelerator founders. The estimates suggest a strong
relationship between "local" accelerator founders and low levels of entrepreneurial financing before
accelerator founding. This is consistent with the anecdotal evidence from surveys and interviews that
suggests that these local accelerator founders who make up our matched sample are driven by regional
growth objectives rather than pecuniary gains; that is, they are focused on making a difference in a particular
region (their home town) rather than on choosing the fiscally optimal region to found their accelerator. The
magnitude of this relationship is economically significant: a one percent increase in funding in a region is
associated with a 107 mile increase in the migration distance of the founder from their high school region.
In column (3), we additionally include a time variable that measures time since the first accelerator (Y
Combinator) was founded, and we observe a similar relationship. In column (4), we create a new binary
variable (LOCAL FOUNDER), which is set to 1 if a founder created an accelerator within a 300 mile
distance from their high school. Again, we find a statistically significant relationship, with a ten percent
increase in local funding in the year of an accelerator's founding associated with a ten percentage point
11 To put this in perspective, this is roughly the driving distance from Los Angeles to Houston or from Miami to
Boston.
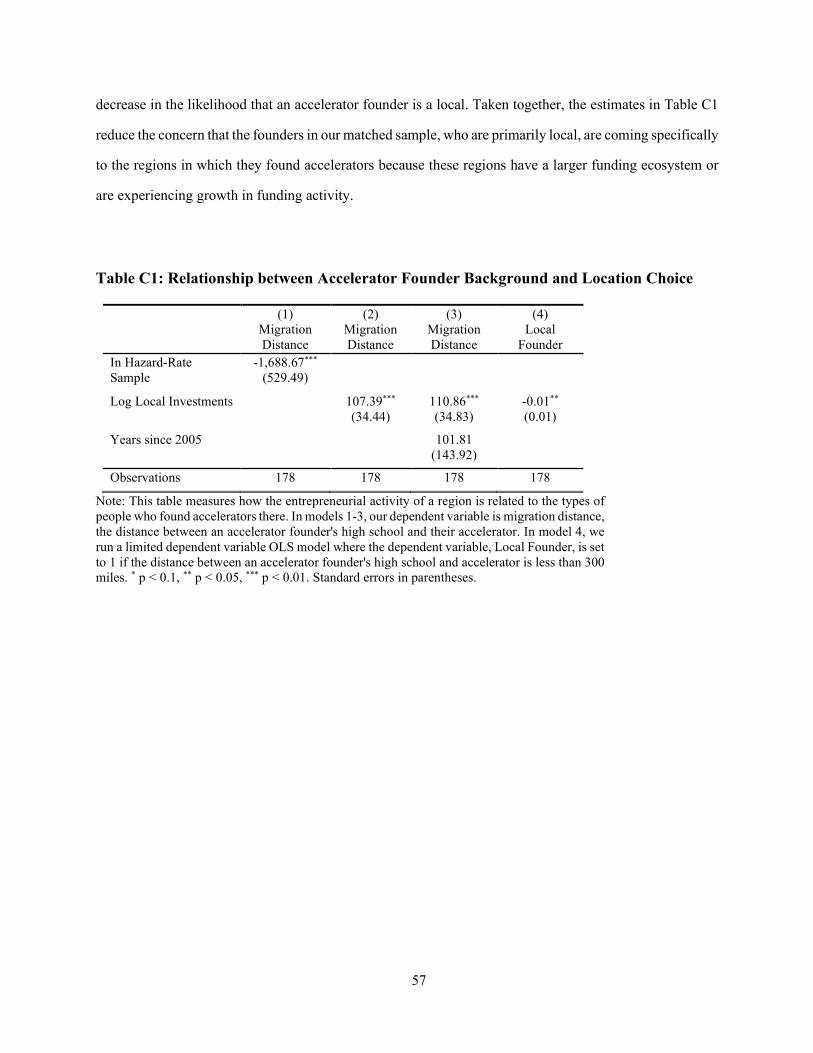
57
decrease in the likelihood that an accelerator founder is a local. Taken together, the estimates in Table C1
reduce the concern that the founders in our matched sample, who are primarily local, are coming specifically
to the regions in which they found accelerators because these regions have a larger funding ecosystem or
are experiencing growth in funding activity.
Table C1: Relationship between Accelerator Founder Background and Location Choice
(1) (2) (3) (4) Migration
Distance Migration Distance
Migration Distance
Local Founder
In Hazard-Rate Sample
-1,688.67*** (529.49)
Log Local Investments
107.39*** (34.44)
110.86*** (34.83)
-0.01** (0.01)
Years since 2005
101.81 (143.92)
Observations 178 178 178 178
Note: This table measures how the entrepreneurial activity of a region is related to the types of people who found accelerators there. In models 1-3, our dependent variable is migration distance, the distance between an accelerator founder's high school and their accelerator. In model 4, we run a limited dependent variable OLS model where the dependent variable, Local Founder, is set to 1 if the distance between an accelerator founder's high school and accelerator is less than 300 miles. * p < 0.1, ** p < 0.05, *** p < 0.01. Standard errors in parentheses.