speed recommendations during traffic light approach: a
TRANSCRIPT
Speed Recommendations During Traffic Light Approach:
A Comparison of Different Display Concepts
Thoma, Stephan1), Lindberg, Thomas1), Klinker, Gudrun2)
1) BMW Group Research and Technology, München, Germany1
2) TU München, Chair for Computer Aided Medical Procedures & Augmented Reality
Abstract
Projects like INVENT2 or Travolution3 aim at optimizing traffic flow in cities by linking vehicles
and infrastructure elements using infrastructure-to-car communication technologies. Traffic
lights equipped with transmitters are able to inform the approaching vehicles about the
current and future state of the traffic light control. This information can be used to optimize
the speed profile while approaching an intersection. As current vehicles will not perform any
speed changes autonomously, an intuitive and easy-to-read human machine interface is
needed to present the speed recommendations to the driver.
Three different ways of in-vehicle information presentation were evaluated with 27
participants in a static driving simulator. The first variant is a simple countdown which
presents the remaining seconds of the red or the green phase, respectively. The second
variant shows the minimum or maximum speed recommendation in a textual manner. The
third alternative uses a red and green area on the speed indicator scale.
All three approaches were tested regarding their comprehensibility, acceptance,
effectiveness and distraction. The results indicate that the non-textual speed indicator display
is preferred by most of the individuals and also has advantages concerning minimization of
acceleration and deceleration actions.
1 Author for correspondence: Stephan Thoma, BMW Group Research and Technology, Hanauer Str.
46, 80992 München, Phone: +49 89 382 30628, e-mail: [email protected]
2 http://www.invent-online.de
3 http://www.vt.bv.tum.de/uploads/rbraun/Travolution_Plakat_2007-07-09_TUM-VT.pdf
- 1 -

Introduction
Traffic flow optimization has always been an important research topic considering growing
cities and increasing traffic density. The main motivation behind all measures taken is to
reduce CO2 emissions and to make travelling for drivers more comfortable. This includes
expanding the road infrastructure and also improving the throughput of existing traffic routes
by establishing intelligent traffic flow management mechanisms Optimizing traffic light
control strategies is not longer a local problem addressing single intersections but rather a
global task involving many intersection points at the same time (e.g. Hewage & Ruwanpura,
2004, and De Oliveira et. al., 2006). Such measures could be even more effective by
influencing the drivers’ behaviour individually. One possible way to assist the driver is to
display information about the traffic light phases while the car is approaching an intersection.
Some countries use digital countdown displays or static green wave speed recommendations
mounted directly to traffic lights. These displays are designed to help the driver choose an
appropriate speed in order to pass the traffic light during the green phase. However, these
signals are equal for all drivers approaching the intersection and do not take individual traffic
conditions into account (e.g. vehicles driving ahead). Additionally, Kidwai et. al. (2005) state
that countdown traffic lights have only little effect on traffic throughput.
Infrastructure-to-car communication can be used to present additional information concerning
the current traffic light state to the driver within the car and with respect to his own position
and speed. It is important to choose the display type with care as intersections are highly
complex situations and additional visual cues may cause distraction.
Concepts
Three different display concepts for traffic light assistance were designed by HMI experts
during a brainstorming session and then implemented in a driving simulator environment.
Countdown Human Machine Interface (HMI)
The first one was a simple countdown which displays the remaining time in seconds of the
current traffic light phase. The information is shown directly as text and supported by a LED
display around it which gives a graphical representation of the number (further referred to as
“Countdown HMI”). Figure 1 shows a few snapshots.
Figure 1 shows a few snapshots.
- 2 -

Figure 1: Countdown HMI: Remaining seconds in the green phase4
Minimum/Maximum speed HMI
As it might be hard for drivers to deduce an appropriate velocity given only the remaining
time, an alternative display type was designed. Using the remaining time in the current phase
of the traffic light and the distance to the traffic light, the car computer is able to estimate
whether it is possible to pass the traffic light during the green phase and, in that case,
calculate a speed recommendation. Basically, the HMI needs to address four scenarios: 1. It
is not possible to pass the traffic light during green phase at all. 2. No speed change is
necessary to pass the traffic light. 3. Acceleration is required. 4. Deceleration is required.
Taking these facts into account, the second concept was a combination of symbols showing
speed recommendations in plain text (referred to as “Min/Max HMI” from now on). Figure 2
shows some examples.
Figure 2: Min/Max speed recommendation HMI
Speed indicator HMI
The “Min/Max HMI” displays the boundary speed which needs to be exceeded in case of a
minimum recommendation or must not be exceeded in case of a maximum recommendation.
However, the recommendation should rather be a velocity range than a specific speed. Thus
a third concept based on Voy et. al. (1981) and Haller (1995) was implemented which makes
use of the speed indicator. Coloured areas are overlaid onto the speed indicator: a green
area means that travelling in this speed range will allow passing the green traffic light
4 For coloured versions of the images please visit http://extras.hfes-europe.org/
- 3 -
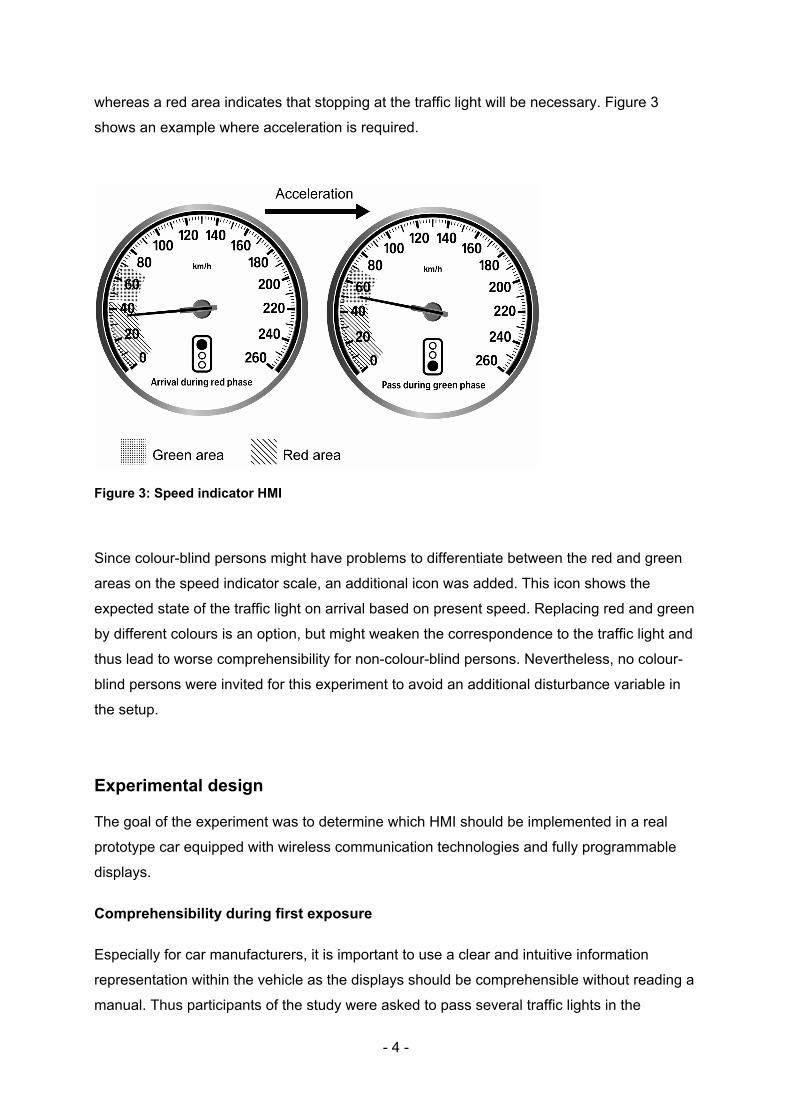
whereas a red area indicates that stopping at the traffic light will be necessary. Figure 3
shows an example where acceleration is required.
Figure 3: Speed indicator HMI
Since colour-blind persons might have problems to differentiate between the red and green
areas on the speed indicator scale, an additional icon was added. This icon shows the
expected state of the traffic light on arrival based on present speed. Replacing red and green
by different colours is an option, but might weaken the correspondence to the traffic light and
thus lead to worse comprehensibility for non-colour-blind persons. Nevertheless, no colour-
blind persons were invited for this experiment to avoid an additional disturbance variable in
the setup.
Experimental design
The goal of the experiment was to determine which HMI should be implemented in a real
prototype car equipped with wireless communication technologies and fully programmable
displays.
Comprehensibility during first exposure
Especially for car manufacturers, it is important to use a clear and intuitive information
representation within the vehicle as the displays should be comprehensible without reading a
manual. Thus participants of the study were asked to pass several traffic lights in the
- 4 -
simulator and state their understanding of the HMI during a short interview afterwards. No
additional explanation was given in advance. Every participant experienced only one of the
three HMI types during the first exposure driving session.
Effectiveness
A traffic light HMI is considered objectively effective if it leads to driving behaviour which is
optimal with respect to fuel consumption. Having a realistic consumption model of a real
vehicle in the driving simulator is quite complex, as many factors are of influence:
environmental conditions, climate controls within the vehicle, engine management system,
etc. Therefore, the requirement of minimal fuel consumption was interpreted as follows: the
main goal of the HMI is to prevent the driver from performing any unnecessary accelerations
or decelerations while approaching the traffic light. As an aggregated value for a single
approach, we use the integral of the absolute value of the vehicle’s acceleration. Any speed
changes - acceleration and deceleration - lead to a greater integral value. Therefore lower
values indicate better performance of the HMI. The integration limits were 300m before and
50m after the traffic light.
Acceptance
General data like age, gender and simulator experience was collected prior to the experiment
in a demographic questionnaire. During the main part of the experiment, participants
experienced each HMI type during a “main session” (details see “Experimental Procedure”).
After each main session participants had the opportunity to evaluate the HMI which they just
had seen before on a five-point Likert Scale with respect to various aspects (see “Single
system evaluation” in Table 1). There was also room for answers to three open questions:
Aspects they liked/disliked and suggestions for improvement. After completing all main
sessions participants compared the three HMI types on a Likert Scale with respect to
distraction and comprehensibility (see “System comparison” in Table 1).
Visual behaviour
During the whole experiment, eye tracking was used to estimate the amount of time that
drivers spent reading the additional displays. As a first approach, the time when the driver’s
glance was not on the road was accumulated from 300m before to 50m after the traffic light.
Simulator Setup
The experiment was conducted in a fixed-base driving simulator equipped with a five-screen
projector imaging system (Figure 4). Each screen had a height and width of 2.8 m. The field
- 5 -

of view for the participants was approximately 240°. No rear or mirror views were used during
this experiment.
Figure 4: Simulator and mock-up setup5
Experimental procedure
The participants were invited to take part in a simulator study without being given any
detailed information about the system under investigation. After completing a short training
session to familiarize themselves with the driving simulator, each person was confronted with
one of the three HMIs. During a short interview after the first two simulator sessions,
comprehension of the HMI was tested. A between subjects design was used since an
explanation of the first HMI would influence comprehension of all following HMIs
dramatically. Although the HMI types “Min/Max” and “Countdown” are predestined for being
presented in a head-up display, they were both shown inside the speed indicator to avoid an
unintended comparison between head-down and head-up display positions with regard to
visual behaviour.
For the four main sessions a within subjects design was used (the three HMI types and a
baseline). Prior to every session, the HMI was explained to the subjects and correct
comprehension was ensured. Participants drove through a route in an urban environment in
the simulator with traffic lights every few hundred meters. The order of the four sessions was
randomized. During every main session, subjects passed at least twelve traffic lights with six
different scenarios implemented (referred to as factor “scenario”):
1. “Always red”: It is not possible to pass the traffic light during green phase at all
2. “Always green”: No speed change is necessary to pass the traffic light
5 In this picture, only three of five projectors are active
- 6 -

3. “+5 km/h”: Acceleration by 5 km/h is required
4. “+15 km/h”: Acceleration by 15 km/h is required
5. “-5 km/h”: Deceleration by 5 km/h is required
6. “-15 km/h”: Deceleration by 15 km/h is required
Each scenario was presented twice (factor “recurrence”) and in randomized order to the
participants during each main session. All subjects were asked to maintain a constant speed
of approximately 60km/h when no reasons for changing speed existed (traffic lights or HMI
displays). Every main session (except baseline) was followed by a questionnaire prompting
(the individuals) for their subjective opinion. After finishing all sessions, the subjects filled out
a concluding questionnaire which gave them the opportunity to compare the three HMI types
directly.
Participants
27 participants, 23 men and four women, took part in the driving simulator experiment; their
mean age was 29 years; six persons had prior driving simulator experience; no spectacle
wearers were invited due to the eye tracking equipment used. For this first experiment, no
persons with colour-blindness were invited.
Results
Comprehensibility during first exposure
The responses collected during the short interviews were categorized: “Instantly understood”,
“understood after some traffic light passes” and “not understood”. It turned out that almost all
the subjects understood how the HMI worked and what its purpose was after the first
exposure session. This was true for all three HMI types.
Effectiveness
Figure 5 shows velocity profiles of the subjects, the mean value and the standard deviation
for the baseline and the speed indicator HMI relatively to the distance to the traffic light in
meters. The following scenario is shown: the traffic light is red and turns green while the
driver is approaching. The traffic light control is triggered in a way that the maximum speed
recommendation presented lies roughly 15 km/h below the current velocity of the vehicle.
- 7 -
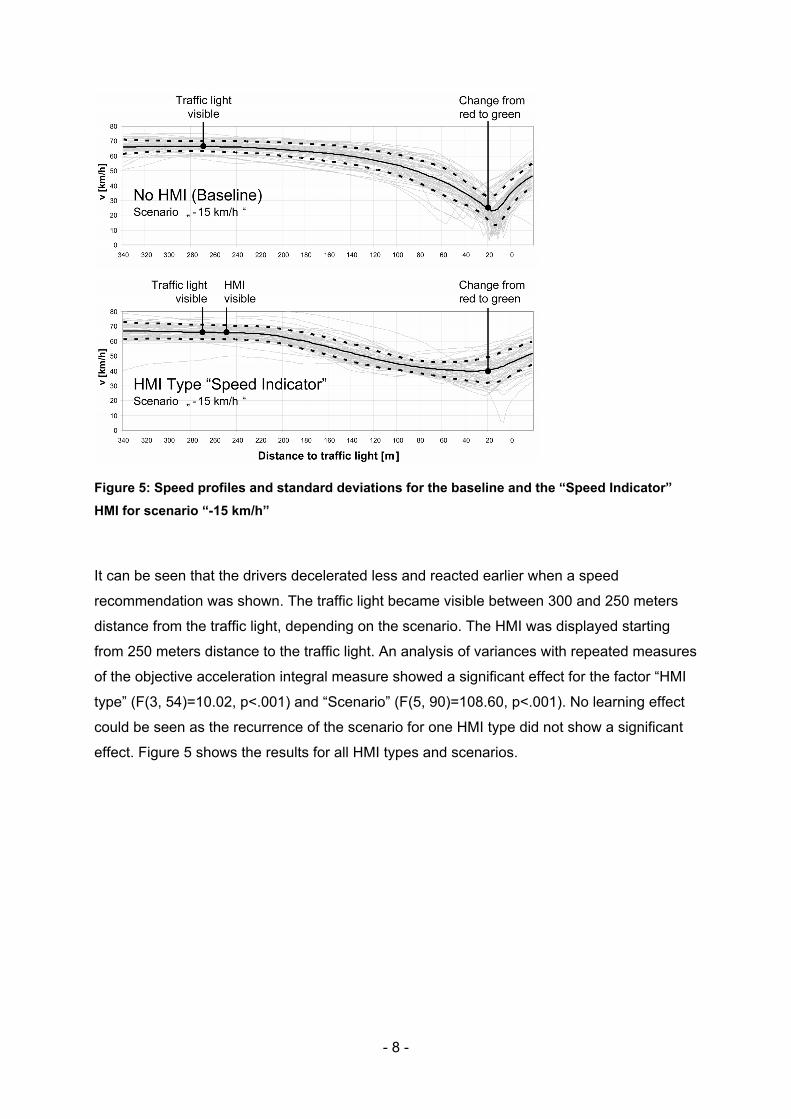
Figure 5: Speed profiles and standard deviations for the baseline and the “Speed Indicator” HMI for scenario “-15 km/h”
It can be seen that the drivers decelerated less and reacted earlier when a speed
recommendation was shown. The traffic light became visible between 300 and 250 meters
distance from the traffic light, depending on the scenario. The HMI was displayed starting
from 250 meters distance to the traffic light. An analysis of variances with repeated measures
of the objective acceleration integral measure showed a significant effect for the factor “HMI
type” (F(3, 54)=10.02, p<.001) and “Scenario” (F(5, 90)=108.60, p<.001). No learning effect
could be seen as the recurrence of the scenario for one HMI type did not show a significant
effect. Figure 5 shows the results for all HMI types and scenarios.
- 8 -

Figure 6: Effectiveness of different HMI types and standard deviation
As expected, scenario “Always green” leads to small and “Always red” to large integral
values. As deceleration and acceleration are treated equally by using the absolute value, the
scenario “Always red” sums up to approximately 120 km/h: Drivers need to decelerate from
60 km/h to zero and then accelerate again to 60 km/h after the traffic light. The other four
scenarios lie somewhere in between these two extremes.
Wilcoxon tests were used to determine significant differences in HMI performance. The
speed indicator HMI was significantly more efficient than the baseline and more efficient than
the other two HMIs in scenarios “-5 km/h” and “-15 km/h”. Even in the scenario “Always
green” all HMIs showed some advantage compared to the baseline. Scenarios “+5 km/h” and
“+15 km/h” have extremely large standard deviations: As the drivers were not forced to react
to the HMI but were instructed to behave as they would in a real world situation, some
decided to follow the recommendation – and passed the traffic light, and others did not – and
stopped in front of the traffic light. Therefore, some cases in this group tend towards scenario
“Always green” and others towards scenario “Always red”.
Generally, high speed variability might also be an indicator for a suboptimal understanding of
a certain HMI display. Thus this measure could reflect the comprehension during the driving
task (in contrast to the direct evaluation of comprehension during first exposure).
Acceptance
Acceptance was evaluated based on the questionnaires the participants filled out after each
main session and after completing all main sessions. Table 1 shows the statements
- 9 -

(meaning might vary due to translation from German) and the rating for each HMI type.
Apparently almost all the responses are in favour of the speed indicator HMI.
Table 1: Questionnaire statements and number of participants who agreed to them
Visual behaviour
Every glance at the assistance display, respectively the speed indicator, was logged from
300m before to 50m after the traffic light.
Figure 7 shows the average glance frequency distribution for one example scenario. It can
be seen that most glances are below two seconds and that on average, eight scans are
required during one traffic light pass to perceive the HMI display. The countdown HMI
produces slightly more but shorter glances than the other two HMI types. The AAM
statement of principles (AAM, 2002) for in vehicle information systems states that the 85th
percentile of all glances should be below two seconds, which is true for all display variants
(Figure 8).
- 10 -
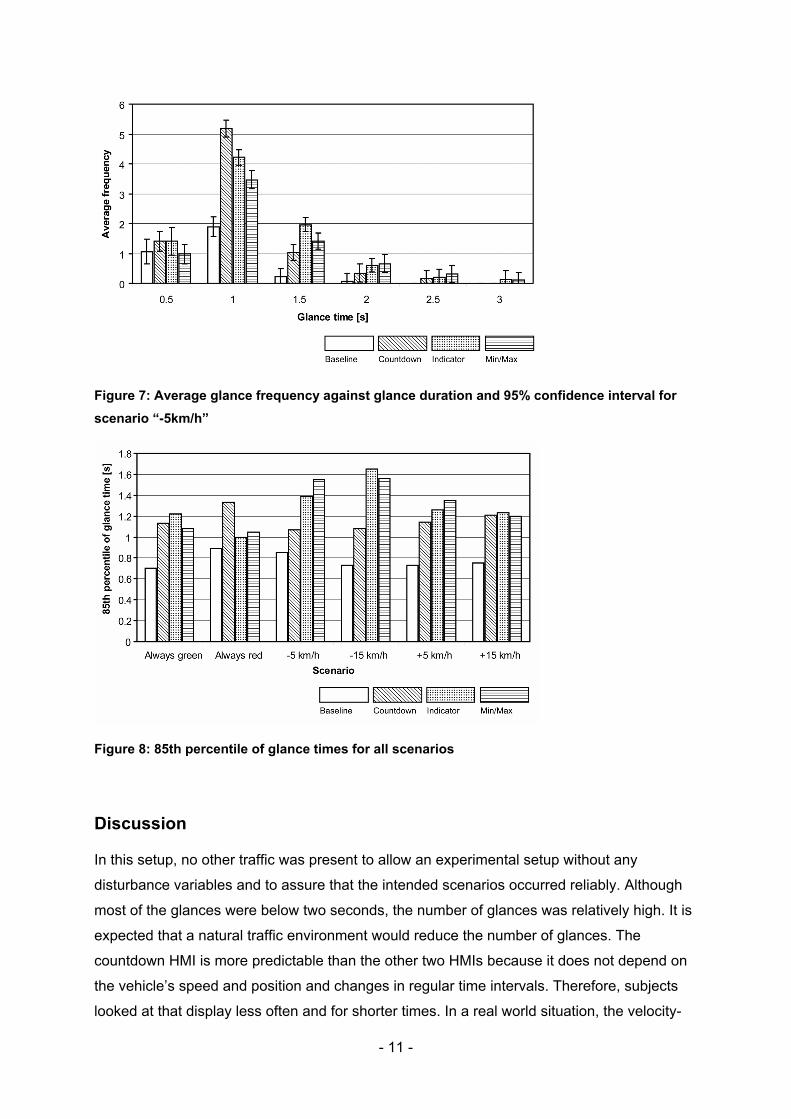
Figure 7: Average glance frequency against glance duration and 95% confidence interval for scenario “-5km/h”
Figure 8: 85th percentile of glance times for all scenarios
Discussion
In this setup, no other traffic was present to allow an experimental setup without any
disturbance variables and to assure that the intended scenarios occurred reliably. Although
most of the glances were below two seconds, the number of glances was relatively high. It is
expected that a natural traffic environment would reduce the number of glances. The
countdown HMI is more predictable than the other two HMIs because it does not depend on
the vehicle’s speed and position and changes in regular time intervals. Therefore, subjects
looked at that display less often and for shorter times. In a real world situation, the velocity-
- 11 -

based HMIs might be faster to understand as time-based displays require the driver to
extrapolate the vehicle’s future position. An additional experiment focusing on visual
behaviour will be conducted including a more complex and realistic driving course.
Besides usability aspects, many legal issues need to be solved before a system like this
could be brought to market. Not giving any recommendations above the local speed limit is a
basic requirement. How much of the amber phase is treated as green by the system for
example can have a major effect on acceptance, but also has many safety implications on
the other hand.
As the experiment was not intended to find any gender effects, the sample was unbalanced.
Future studies should include the influence of gender on acceptance and efficiency of the
HMI variants.
In order for the driver to benefit from the traffic light HMI, a high penetration grade is
desirable. If a traffic light does not transmit its current and future status, no recommendation
can be displayed. Image recognition using an on-board camera can detect the current but
not the future status of a traffic light. Thus its use is restricted to showing information
indicating the existence of a traffic light without being able to give a dedicated speed
recommendation. In case of a very high penetration grade, image recognition could avoid
confusion for the driver as the vehicle is able to display explanatory information: “There is a
traffic light but no speed recommendation can be calculated due to missing radio signal.”
Since traffic lights could potentially serve as repeaters for car-to-car communication, network
effects can be expected that may accelerate the rollout of wireless-enabled traffic lights
(Matheus, 2004).
In summary, it can be stated that the speed indicator HMI has advantages concerning
acceptance and efficiency. Therefore, it was implemented in a prototype car. Additional field
tests need to show the suitability for daily use under real traffic conditions.
References
Alliance of Automobile Manufacturers. (2002). Statement of Principles, Criteria and
Verification Procedures on Driver Interactions with Advanced In-Vehicle Information
and Communication Systems, Version 2.0 (Report of the Driver Focus-Telematics
- 12 -

Working Group). Southfield.
De Oliveira, D., Bazzan, A., Da Silva, B.C., Basso, E. & Nunes, L., Rossetti R., De Oliveira
E., Da Silva, R., Lamb, L. (2006). Reinforcement Learning based Control of Traffic
Lights in Non-stationary Environments: A Case Study in a Microscopic Simulator. In
Proceedings of EUMAS'06, Fourth European Workshop on Multi-Agent Systems.
Lisbon.
Haller, R. (1995). Anzeigevorrichtung zur Darstellung von Differenzgeschwindigkeiten.
Offenlegungsschrift Patent DE 4325721 A1. Deutsches Patent- und Markenamt,
München.
Hewage, K. &, Ruwanpura, J. (2004). Optimization of Traffic Signal Light Timing Using
Simulation. In Proceedings of the 2004 Winter Simulation Conference, Washington,
D.C.
Kidwai, F. A., Ibrahim, M, R. & Karim, M. R (2005). Traffic Flow Analysis of Digital Count
Down Signalized Urban Intersection. In Proceedings of the Eastern Asia Society for
Transportation Studies, Vol. 5 (pp. 1301 – 1308). Bangkok.
Matheus, K., Morich, R. Lübke A. (2004). Economic Background of Car-to-Car
Communication. In Proceedings of IMA 2004, Informationssysteme für mobile
Anwendungen, Gesamtzentrum für Verkehr Braunschweig e.V. (GZVB).
Braunschweig.
Voy, C., Zimdahl, W., Mainka, W., Stock, F. (1981). Einrichtung zur Verkehrsführung nach
dem Prinzip der grünen Welle. Offenlegungsschrift Patent DE 3126481 A1.
Deutsches Patent- und Markenamt, München.
- 13 -