spectrum-conservation techniques for fixed microwave systems
TRANSCRIPT

NTIA REPORT 89-243
SPECTRUM-CONSERVATIONTECHNIQUES FOR FIXED
MICROWAVE SYSTEMS
ROBERT L. HINKLEANDREW FARRAR
U.S. DEPARTMENT OF COMMERCERobert A. Mosbacher, Secretary
Alfred C. Sikes, Assistant Secretaryfor Communications and Information
MAY 1989


ABSTRACT
Since the spectrum is a limited natural resource, the spectrum management
community has a major interest in identifying spectrum conservation techniques that
will provide more efficient spectrum utilization. Advances in new technology for fixed
microwave systems in antennas, modulation schemes and signal processing techniques
offer increased efficiency in spectrum utilization. This report analyzes the spectrum
conserving properties of the various new technologies for fixed microwave systems
applying the concepts in CCIR Report 662-2, and was defined as the spectrum
conservation factor (SCF). The report concludes that the SCF technique is an
effective indicator of the spectrum conserving properties of technologies which can be
used to develop new spectrum standards.
KEYWORDS
Spectrum Efficiency
Spectrum Conservation Factor (SCF)
Fixed Microwave System
7125-8500 MHz Band
iii


TABLE OF CONTENTS
Subsection
SECTION I
INTRODUCTION
BACKGROUND.
OBJECTIVE.
APPROACH...
SECTION 2
CONCLUSIONS AND RECOMMENDATIONS
INTRODUCTION . . . . .
GENERAL CONCLUSIONS.
SPECIFIC CONCLUSIONS.
Antennas .
Modulation .
Signal Processing.
RF Filters ....
RECOMMENDATIONS.
SECTION 3
ANALYSIS FOR SPECTRUM CONSERVATION TECHNIQUES
INTRODUCTION . . . . . . . . . . . . . . . . . . . .
ANALYSIS APPROACH .
MICROWAVE REFERENCE SYSEM CHARACTERISTICS .
v
Page
1-1
1-3
1-3
2-1
2-2
2-2
2-2
2-3
2-3
2-4
2-4
3-1
3-1
3-3

TABLE OF CONTENTS
(Continued)
Subsection
SECTION 3
(Continued)
ANTENNAS .
Antenna Pattern Characteristics.
Spectrum Conservation Factor.
Antenna Cost .
MODULATION
Digital Modulation.
Digital System Occupied Bandwidth.
Digital System Transmitter Output Power
Analog Modulation. . . . . . . . .
Analog System Occupied Bandwidth.
Analog System Transmitter Output Power
Maximum Permissible Interference Level
Digital Systems.
Analog Systems.
Spectrum Conservation Factor.
SIGNAL PROCESSING.
Error Correction/Coding
Adaptive/Transversal Equalizers
Error Correction/Coding And Adaptive Equalizers.
TRANSMITTER OUTPUT DEVICES & RF FILTERS
Transmitter Output Device.
Kystrons .
Traveling-Wave Tubes (TWT}
Gallium Arnsenide Field-Effect Transistros (GaAsFET)
Radio Frequency (RF) Filters. . . .
Spectrum Conservation Factor.
VI
Page
3-3
3-3
3-6
3-9
3-11
3-11
3-12
3-13
3-14
3-15
3-15
3-17
3-18
3-18
3-20
3-25
3-26
3-30
3-30
3-32
3-32
3-32
3-33
3-33
3-33
3-34

T ABLE OF CONTENTS
(Continued)
Table
LIST OF TABLES
3':'1 SPECTRUM CONSERVATION DESIGN FACTORS.
3-2 HYPOTHETICAL HOP CHARACTERISTICS.
3-3 DIGITAL SYSTEM PARAMETERS. . . . . . . ..
3-4 ANALOG SYSTEM PARAMETERS . . . . . . . .
3-5 MAXIMUM PERMISSIBLE INTERFERENCE LEVELS FOR
DIFFERENT MODULATION TYPES. . . . . . . . . . . .
3-6 SPECTRUM CONSERVATION FACTOR FOR ANALOG AND.
DIGITAL MODULATIONS . . . . . . . . . . . . . . . .
3-7 SPECTRUM CONSERVATION FACTOR COMPARISON OF
64- AND 256-QAM FOR SHD ANTENNAS .
3-8 SPECTRUM CONSERVATION FACTOR IMPROVEMENT FOR
SHROUDED DISH AND CONICAL HORN REFLECTOR ANTENNAS
AS A FUNCTION OF MODULATION TYPE. . . . . . . . . . . . .
3-9 SPECTRUM CONSERVATION FACTOR FOR ANALOG AND
DIGITAL MODULATIONS . . . . . . . . . . . .
3-10 PROCESSING GAIN SUMMARY .
3-11 CORRECTION/CODING (64-QAM MODULATION). . .
3-12 SPECTRUM CONSERVATION FACTOR FOR ERROR
CORRECTION/CODING (64-QAM MODULATION).
EQUALIZER (64-QAM MODULATION) . . . . ..
3-13 SPECTRUM CONSERVATION FACTOR FOR
ADAPTIVE EQUALIZER (64-QAM MODULATION)
3-14 SPECTRUM CONSERVATION FACTOR FOR ERROR
CORRECTION/CODING AND ADAPTIVE
EQUALIZER (64-QAM MODULATION) .
Vll
Page
3-2
3-4
3-14
3-16
3-19
3-21
3-22
3-23
3-24
3-27
3-29
3-29
3-27
3-31
3-31

T ABLE OF CONTENTS
(Continued)
Figure
LIST OF FIGURES
Page
3-1
3-2
3-3
3-4
3-5
Fixed microwave system antenna types. . . . . . .
Radiation patterns for STD, SHD and CHR antennas
Denied area as a function of antenna type and transmitter
output power for an interference threshold of -101 dBm ..
Denied area as a function of antenna type and transmitter
output power for an interference threshold of -103 dBm.
Emission spectrum segmentation for evaluation of SCE .
LIST OF APPENDICES
3-5
3-7
3-8
3-10
3-35·
Appendix
A COMPUTER MODEL DESCRIPTION. . . . . . . . . . . . . . . . . . A-I
Vll1

SECTION 1
INTRODUCTION
BACKGROUND
The National Telecommunications and Information Administration (NTIA) is
responsible for managing the Federal Government's use of the radio frequency
spectrum. NTIA's responsibilities include establishing policies concerning spectrum
assignment, allocation and use, and providing the various departments and agencies
with guidance to ensure that their conduct of telecommunications activities is
consistent with these policies. 1 In discharging these responsibilities, NTIA assesses
spectrum utilization, identifies existing and/or potential compatibility problems among
the telecommunications systems that belong to various departments and agencies,
provides recommendations for resolving any compatibility conflicts that may exist in
the use of the frequency spectrum, and recommends changes to promote spectrum
efficiency and improve spectrum management procedures.
The radio spectrum is a limited natural resource that must be carefully managed
to ensure its availability to accommodate spectrum requirements for new
telecommunication systems. Therefore, NTIA has established a long-range plan for
management and use of the radio spectrum.2 One of NTIA's major policy initiatives
outlined in the plan is the establishment of procedures to ensure the efficient and
effective use of the spectrum. However, because of the economic burden that can be
associated with requirements for spectrum efficient communication techniques, NTIA
adopts regulatory controls only where necessary to ensure the continued availability of
the spectrum. This encourages effective and economical use of the spectrum,
development of new technologies in a less restrictive regulatory environment,and the
1
2
NTIA, Manual of Regulations and Procedures for Federal Radio FrequencyManagement, National Telecommunications and Information Administration,Washington, D.C., Revised May 1988.
Long-Range Plan for Management and Vse of the Radio Spectrum (V), V.S.Department of Commerce, National, Telecommunications and InformationAdministration, Washington, D.C., May 1988.
1-1

application of new spectrum conserving technologies only where necessary. In order to
accomplish this policy initiative, NTIA has begun:
1. the development of methods to identify heavily used geographical areas in aband,
2. the evaluation of available radiocommunication technologies with respect totheir ability to conserve the spectrum.
These two elements will allow NTIA to identify heavily used geographical areas with
sufficient lead-time to allow the identification and/or development of appropriate and
economical spectrum conservation techniques so that a spectrum crises does not occur
and regulatory and policy options are not limited.
Pursuant to element (1) above, NTIA has developed a method for identifying
heavily used geographical areas in a band and indices for degree of band use.3 With
respect to spectrum conservation techniques, the Interdepartment Radio Advisory
Committee (IRAC) has endorsed a study to identify spectrum conservation techniques
for the Fixed Service:' This report specifically investigates those techniques applicable
to fixed microwave systems.
s
4
Mayher, R.J.; Haines, R.H.; et aI, The Sum Data Base: A New Measure ofSpectrum Use, U.S. Department of Commerce, National Telecommunicationsand Information Administration, TR-88-236, Washington, D.C., August 1988.
MEMORANDUM TO: Deputy Associate Administrator, Office of SpectrumManagement; FROM: Executive Secretary IRAC; SUBJECT: SpectrumResource Assessment of the Federal Government Fixed Service Bands (Above400 MHz.) NTIA Technical Memorandura 87-127, IRAC Doc. 25498/2.
1-2

OBJECTIVE
The objective of this task was to evaluate spectrum conservation techniques for
fixed service point-to-point microwave systems to identify system-design
considerations that promote more effective and efficient spectrum use.
APPROACH
The following approach was taken to accomplish the above objective.
1. Identify major fixed microwave system design factors that conserve spectrum(e.g., antennas, modulation, signal processing, transmitter output device, andRF filters) and the available technology options within each of the majordesign factors.
2. Establish a microwave reference system to permit the determination ofrepresentative systems parameters.
3. Develop a computer model to evaluate spectrum conservation techniques forthe fixed microwave systems by applying the definition of spectrumutilization given in the International Radio Consultative Committee (CCIR)Report 662-2.5
4. Apply the computer model to determine which major design factors have themost impact on spectrum conservation and to rank available technologyoptions within each of the major design factors.
5 CCIR Report 662-2, "Definition of Spectrum Use and Efficiency," XVIthPlenary Assembly, Vol. 1, Dubrovnik, 1986.
1-3

GENERAL CONCLUSIONS
The following are general conclusions resulting from the study.
1. The spectrum conservation factor (SCF) is a technical concept that can beused to quantitatively assess the spectrum conserving potential of newtechnologies and to develop new spectrum standards.
2. The spectrum conserving potential of a system is a function of severaldesign factors all of which must be taken into consideration when evaluatingthe spectrum utilization efficiency of a system. That is one can not say thata system with a particular modulation is more spectrum conserving than asystem with another modulation without considering all other design factorssuch as antennas, signal processing, RF filters, etc.
SPECIFIC CONCLUSIONS
The following are specific conclusions related to spectrum conservation for each of
the major system design factors.
1. Antennas
Microwave system antenna characteristics (sidelobe/backlobe levels) have a
significant effect on the denial area of a system. For the three types of antennas
(dish, shrouded dish and conical horn reflector) considered in the investigation, the
following were determined.
a. The relative improvement in spectrum conservation of the shrouded dish andconical horn reflector antennas over the standard dish antenna is a functionof the system modulation. The spectrum conservation improvement isapproximately 0 to 150 percent for shrouded dish and approximately 150 to1,500 percent for a conical horn reflector. The greatest improvement occursfor 256-QAM modulation.
b. Due to the somewhat higher sidelobe levels close to the mainbeam, less than20 degrees off-axis, for shrouded dish type antennas, there is no appreciableimprovement in spectrum conservation for some modulations. However, thelow backlobe level characteristics of shrouded dish antennas enhance theaccommodation of systems in crowded cosite conditions.
2-2
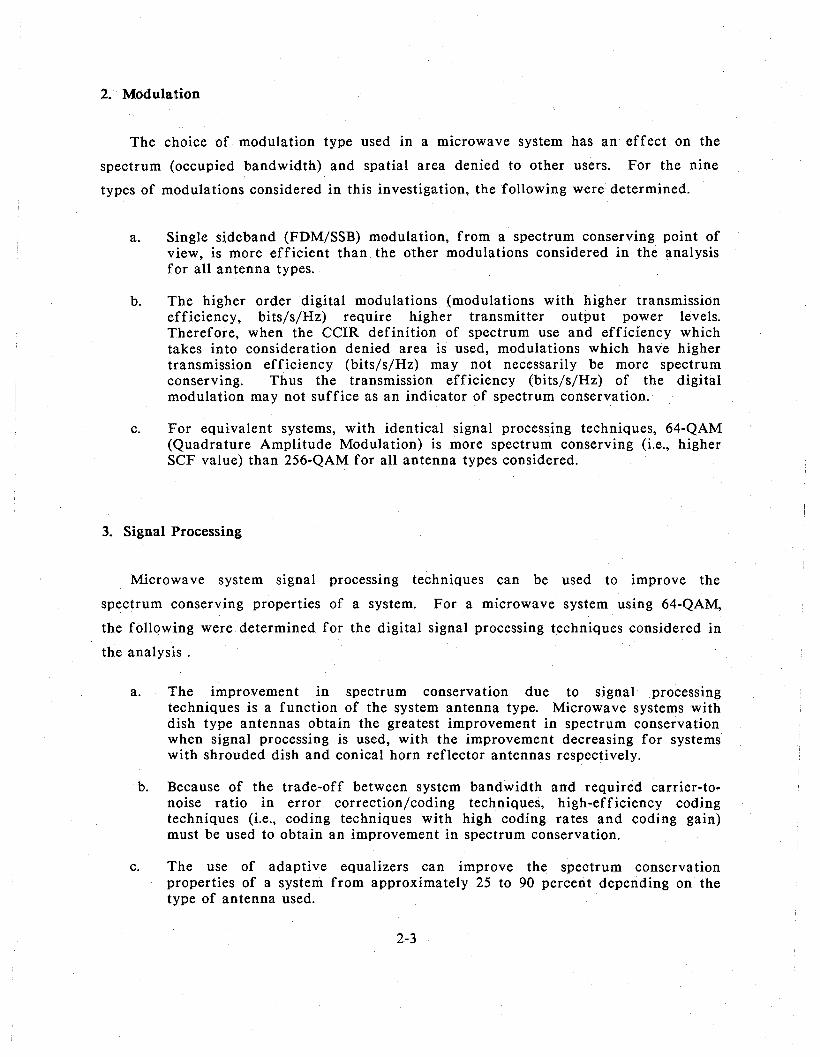
2. Modulation
The choice of modulation type used in a microwave system has an effect on the
spectrum (occupied bandwidth) and spatial area denied to other users. For the nine
types of modulations considered in this investigation, the following were determined.
a. Single sideband (FDM/SSB) modulation, from a spectrum conserving point ofview, is more efficient than the other modulations considered in the analysisfor all antenna types.
b. The higher order digital modulations (modulations with higher transmissionefficiency, bits/s/Hz) require higher transmitter output power levels.Therefore, when the CCIR definition of spectrum use and efficiency whichtakes into consideration denied area is used, modulations which have highertransmission efficiency (bits/s/Hz) may not necessarily be more spectrumconserving. Thus the transmission efficiency (bits/s/Hz) of the digitalmodulation may not suffice as an indicator of spectrum conservation.
c. For equivalent systems, with identical signal processing techniques, 64-QAM(Quadrature Amplitude Modulation) is more spectrum conserving (i.e., higherSCF value) than 256-QAM for all antenna types considered.
3. Signal Processing
Microwave system signal processing techniques can be used to improve the
spectrum conserving properties of a system. For a microwave system using 64-QAM,
the following were determined for the digital signal processing techniques considered in
the analysis.
a. The improvement in spectrum conservation due to signal processingtechniques is a function of the system antenna type. Microwave systems withdish type antennas obtain the greatest improvement in spectrum conservationwhen signal processing is used, with the improvement decreasing for systemswith shrouded dish and conical horn reflector antennas respectively.
b. Because of the trade-off between system bandwidth and required carrier-tonoise ratio in error correction/coding techniques, high-efficiency codingtechniques (i.e., coding techniques with high coding rates and coding gain)must be used to obtain an improvement in spectrum conservation.
c. The use of adaptive equalizers can improve the spectrum conservationproperties of a system from approximately 25 to 90 percent depending on thetype of antenna used.

d. Some microwave systems use both adaptive equalizers and error correction/coding techniques to improve system performance. The use of both signalprocessing techniques can improve the spectrum conservation properties of asystem from approximately 30 to 170 percent depending on the type ofante.nna used.
4. RF Filters
The use of transmitter and receiver RF filters greatly enhance the spectrum
conserving properties of microwave systems. Their application reduces
intermodulation, adjacent channel and receiver spurious response interference.
RECOMMENDATIONS
The following are NTIA staff recommendations based on the findings of this
report. NTIA management will evaluate these recommendations to determine if they
can or should be implemented from a policy, regulatory, or procedural viewpoint. Any
action to implement these recommendation will be via separate correspondence
modifying established rules, regulations and procedures. The recommendations are as
follows.
1. The NTIA in fulfillment of it's long-range planning objective of promotingmore effective and efficient use of the spectrum, should initiate follow-ontasks to continue the investigation of spectrum conservation techniques forother services.
2. In geographical areas where bands are heavily used, the SCF concept shouldbe for use in the development of spectrum standards which will promote moreefficient use of the spectrum.
2-4

SECTION 3
ANALYSIS OF SPECTRUM CONSERVATION TECHNIQUES
INTRODUCTION
This section contains a discussion of the analytical approach used to evaluate
spectrum conservation techniques for fixed point-to-point microwave systems. A
reference system was used to determine nominal system parameters for the various
design factors such as antenna, modulation, signal processing, transmitter output
device and RF filters. These nominal system parameters are then used to evaluate the
spectrum conservation trade-offs for the various design factors. The relative spectrum
utilization efficiency for the various design factors are analyzed as well as the relative,
spectrum utilization efficiency of the state-of-the-art technologies within each of the
major design factors.
The analysis is based on characteristics of microwave systems deployed in the
government fixed service band of 7125-8500 MHz. However, the analysis was extended
to consider the technology' deployed in other point-to-point microwave fixed service
bands and current state-of-the-art technology being developed.
ANALYSIS APPROACH
To assess the efficiency of the various design factors and technology options, it
is necessary to have a quantitative measure of the relative spectrum conservation
enhancement properties of that technology. In the past, analysis of spectrum
efficiency has dealt primarily with RF bandwidth, transmission efficiency
(Bits/second/Hz) or capacity y(ficie~cy(Vqice c:hannels/Hz).
To utilize the spectrum 'efficiently; anyradfated energy should be kept to a
minimum consistent with ensuring an adequate grade of service. This minimization
should be effective in the time, frequency, and spacial domains. CCIR Report 662-2
defines spectrum efficiency as the ratio of communications achieved to the spectrum
space used. Spec!rum-spac~ ,is defin,eci a,~ the product gf )ip}e, bandwidtQ, and the
3-1

spatial volume denied to other users due to potential interference. For this study on
analysis of spectrum conservation techniques for the fixed point-to-point systems, the
equation in CCIR Report 662-2 was defined as the spectrum conservation factor (SCF)
and is given as:
(3-1)
where:
VC =T =
A =B =
Number of voice channels.Fraction of time a system is used. Defined to be equal to 1 for thisanalysis.Denial area (km2)
Receiver System Bandwidth (MHz)
The above equation was chosen because it takes into consideration both spectrum
and spatial (area) denial in assessing the spectrum conservation enhancement properties
of a system. The denial area is the area in which another system can not operate
without degradation in system performance below a specified performance criteria. The
denial area is a function of the microwave system antenna pattern characteristics,
transmitter output power and interference threshold level. APPENDIX A contains a
detailed description of the computer program used to evaluate Equation 3-1 and
examples of program input and output data.
The relationship between spectrum and spacial (area) denial trade-offs for the
various design factors addressed in this section are summarized in TABLE 3-1.
TABLE 3-1
SPECTRUM CONSERVATION DESIGN FACTORS
DESIGN FACTORS TRADE-OFFS
Antenna SpaceModulation Spectrum-spaceSignal Processing Spectrum-spaceTransmitter Output Device SpectrumRF Filters Spectrum
3-2

The following is a discussion of .the application of Equation 3-1 for the design
f actors listed in TABLE 3-1. Representative system parameters for each of the design
factors and technology options within each of the design factors are identified, and the
associated spectrum conservation enhancement properties are assessed.
MICROWAVE REFERENCE SYSTEM CHARACTERISTICS
In order to apply Equation 3-1 to point-to-point microwave systems, it is
necessary to establish characteristics of a microwave reference system between two
microwave sites. TABLE 3-2 shows the system parameters for sites Alpha and Beta
used to calculate the required system gain (G.). The system parameters used in TABLE
3-2 are nominal values considered to be representative of a typical microwave hop. The
system gain of 103 dB calculated in TABLE 3-2 is representative of nominal system
gains for microwave systems in the 718 GHz band. This value of system gain will be
used to determine the required transmitter power used to evaluate the spectrum
conservation enhancement for the various design factors which follow.
ANTENNAS
The antenna of a microwave system is a key system design factor in addressing
spectrum conservation. One of the major radiocommunications system components
contributing to denial area is the system antenna. In recent years, significant
advances in the antenna-design areas of sidelobelbacklobe reduction and polarization
discrimination have provided the capability for enhanced spectrum efficiency in fixed
microwave systems. Frequency re-usecan be achieved by implementing antenna
design spectrum-conservation techniques. For example, antenna polarization
discrimination is an effective and efficient means to double the channel capacity of a
fixed point-to-point microwave system.
Antenna Pattern Characteristics
Spatial denial can be minimized if antenna pattern sidelobelbacklobe levels are
minimized. The antenna radiation patterns, and therefore sidelobe distributions, vary
3-3

with antenna type. For this analysis an eight foot antenna, approximately 43 dBi gain,
has been used. Three antenna types (see Figure 3-1) commonly used in point-to-point
microwave transmission are:
1. Standard Dish (STD)
2. Shrouded Dish, (SHD)
3. Conical Horn Reflector (CHR)
TABLE 3-2
HYPOTHETICAL HOP CHARACTERISTICS
FREQUENCY (MHz)PATH LENGTH (kMS)
SITE
SITE ELEVATION (METERS)ANTENNA HEIGHT (METERS)
PATH ATTENUATION (dB)WAVEGUIDE LOSS (dB)CONNECTOR LOSS (dB)RADOME LOSS (dB)TOTAL FIXED LOSSES (dB)
TOTAL LOSSES (dB)ANTENNA GAIN (dB)TOTAL GAIN (dB)
NET PATH LOSS (NPL) dB
RECEIVER NOISE FIGURE (dB)THEORETICAL RF C/N RATIO (dB)PRACTICAL THRESHOLD (C[MIND (dBm)FADE MARGIN (FM) dBSYSTEM GAIN (GS) dB [ FM - NPL ]TRANSMITTER POWER P(t) dBm
3-4
8000.050.0
ALPHA BETA
125.0 250.050.0 50.0
142.02.5 2.50.5 0.50.5 0.53.5 3.5
149.043.0 43.0
86.0
- 63.0
7.0 7.0SEE TABLES 3-3 & 3-4SEE TABLES 3-3 & 3-4
40.0103.0
SEE TABLES 3-3 & 3-4

wI
VI
STANDARD DISH (STD) SHROUDED DISH (SHD) CONICAL HORN REFLECTOR (CHR)
Figure 3-1. Fixed microwave system antenna types.

Standard parabolic dish (STD) antennas have unshielded reflectors and have a
relatively low front-to-back ratio. Because of this, the radiation pattern
characteristics of standard dish antennas produce larger denial areas than those for the
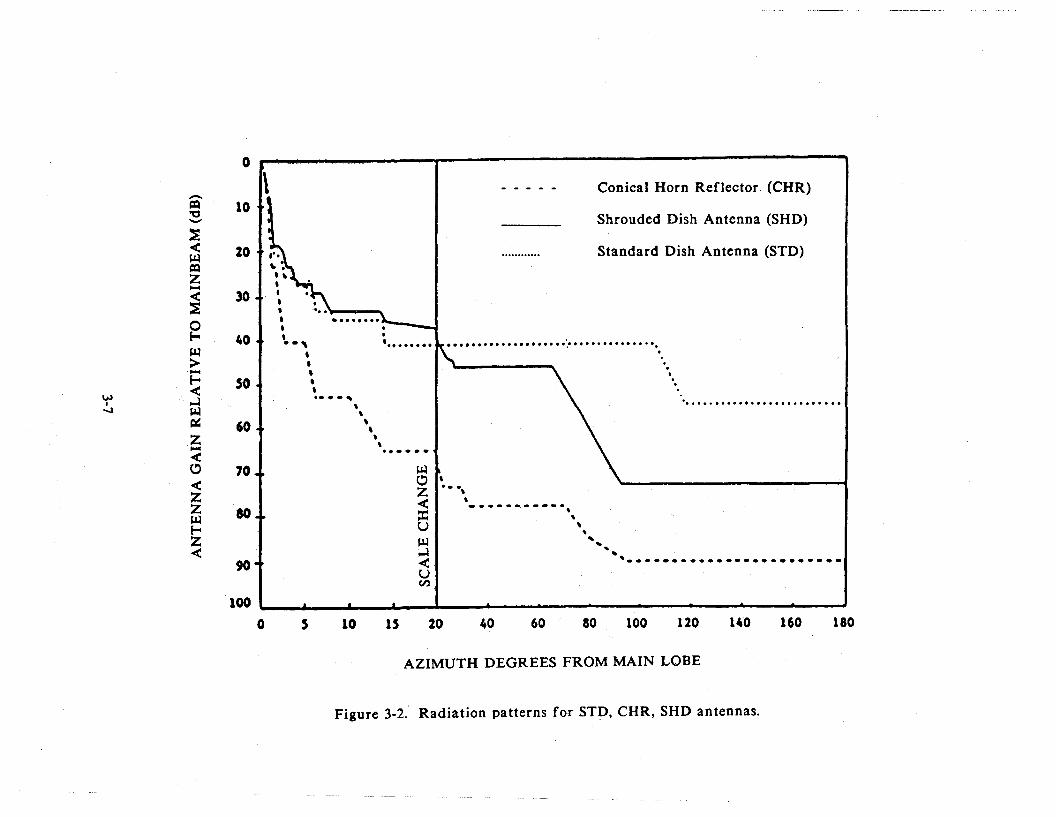
two other types of antennas. A typical radiation pattern for a standard dish antenna
with a 43 dBi gain is shown in Figure 3-2. Note that the backlobe levels for these
antennas are only 55 dB down from the main beam. Despite this shortcoming, in many
applications where frequency congestion is not serious and interference is less
restrictive, these antennas may be \Ised more economically.
The shrouded dish (SRD) type antennas are similar to the standard parabolic dish
type antennas, except that they include a cylindrical built-out shield or shroud which
improves the front-to-back ratio and wide angle radiation discrimination. A shrouded
antenna typically has a front-to-back ratio of approximately 70 dB. The SRD type
antennas are used in areas where frequency plans and operational coordination require
the suppression of relatively high levels of side and backlobe radiation. A typical
radiation pattern for a shrouded dish antenna with a 43 dBi gain is shown in Figure 3
2. One inherent characteristic of the shrouded dish antenna is the higher sidelobes
close in (less than 20°) from the main lobe (See Figure 3-2).
Conical horn reflector (CRR) antennas offer high quality radiation characteristics.
These horn reflector type antennas, are well suited for use in areas where frequency
congestion is burdensome. The feed for a CRR antenna includes a metallic conical
horn structure. The front-to-back ratio for this type of antenna is approximately 90
dB. A typical pattern for the 43 dBi horn reflector antenna is shown in Figure 3-2.
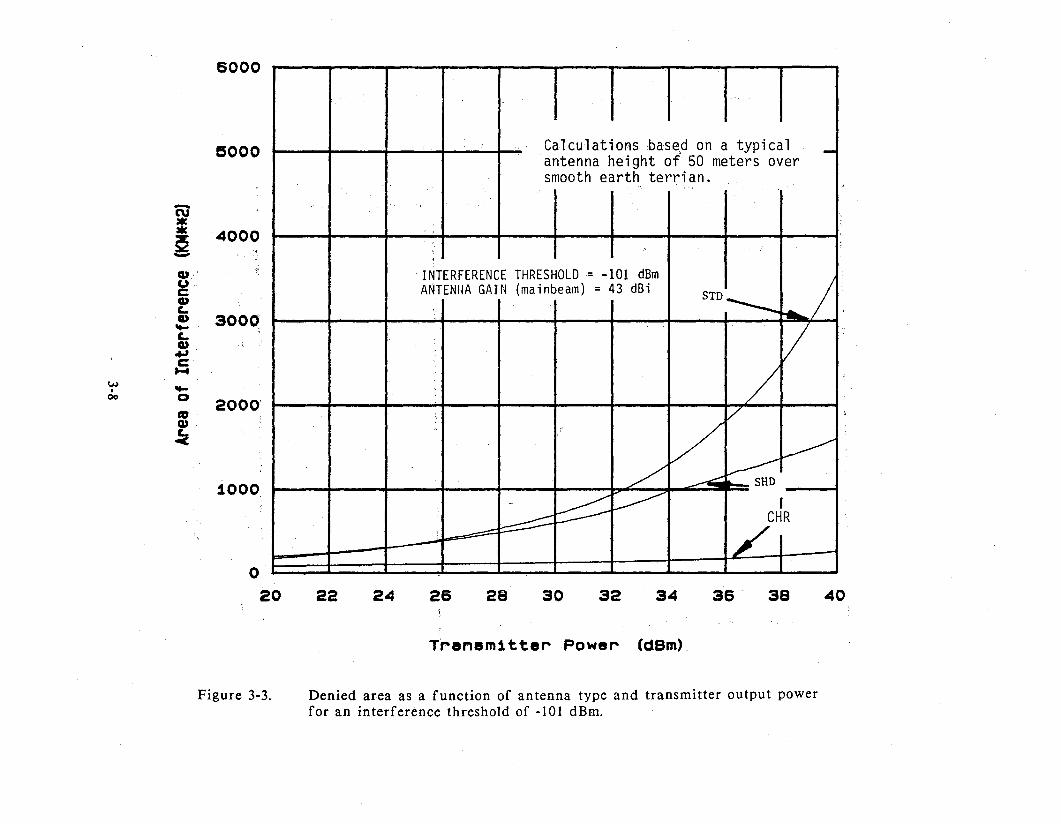
Spectrum Conservation Factor
A plot of the transmitter output power versus denial area for a receiver
interference threshold of -101 dBm is shown in Figure 3-3 for the three types of
antennas. Although, the mainbeam gain for all the antennas were the same, the results
shown in Figure 3-3 indicate that the CRR antenna has less denial area than the other
two types of antennas. Also the difference in denial area for the three types of
3-6
.... ......................
.....
Conical Horn Reflector. (CHR)
Shrouded Dish Antenna (SHD)
Standard Dish Antenna (STD)
•••••••••••••••••••• ! ••••••••••••.••.
~
d'Z •••,< '_ ..... __ ...~ "U ' ,~ " .
~ "< ' .•.•••••...•••.•.•••.•••uCI)
••t ••••••••
" .,,••,•••,..,,,,
•,.... , ,,,,,,......
5 10 IS 20 40 60 80 100 120 140 160 180
AZIMUTH DEGREES FROM MAIN LOBE
Figure 3-2. Radiation patterns for STD, CHR, SHD antennas.
6000
5000
-N= 4000~-CDUCCDe..
3000CD....e..CD...,C....
w ....I
0 200000
cvcu-e..-e
1000
Calculations based on a typical -antenna height of 50 meters oversmooth earth terri an.
,
INTERFERENCE THRESHOLD = -101 dBm
~/ANTENllA GAIN (mainbeam) = 43 dBi
STD.----.
V/
l /, 1,-
V -----~./ --- SHD
-~=---- I
--::::::. CHR,
/o
20 22 24 26 28 30 32 34 36 3S 40
Figure 3-3.
Tranem1tte~ Powe~ (dBm)
Denied area asa function of antenna type and transmitter output powerfor an interference threshold of -101 dBm.

antennas is small until the transmitter power is greater than 30 dBm. This is
understandable because the contribution to the denial area caused by sidelobe/backlobe
antenna characteristics is small until the transmitter power is increased beyond 30 dBm.
At transmitter output powers greater than 30 dBm, the difference in denial area for
the three types of antennas is significant. The denial area is also a function of the
receiver interference threshold. Figure 3-4 shows the denial area for an interference
threshold of -103 dBm. A comparison of Figures 3-3 and 3-4 shows a significant
increase in denial area for only a 2 dB decrease in the interference threshold. Hence
a general observation may be made that microwave systems that require higher
transmitter power and/or lower interference thresholds generally need to use better
antennas (i.e., antennas with lower sidelobe/backlobe characteristics).
Since the denied area for the three types of antennas is a function of the
transmitter output power and the maximum permissible interference level, the spectrum
conserving properties for the three antenna types must also be related to system
modulation type. Thus the spectrum efficiency enhancement properties of the STD,
SRD and CRR antennas will be discussed in the modulation section.
Antenna Cost
For the 7/8 GHz band, the cost of a standard parabolic dish antenna is
approximately $2,700 for single polarization, and approximately $3,700 for dual
polarization. The shrouded dish (SHD) antennas are substantially more bulkier, heavier
and more expensive than the standard dish (STD) antenna. However, they are·· often
used on the same antenna tower as the standard dish antenna. The cost of an SHD
antenna is approximately three times a STD antenna, and cost approximately $8,000 for
single polarization and $9,100 for dual polarization. A conical horn reflector (CHR)
antenna is approximately $18,500, and requires a more substantial tower.
The cost of the antenna is approximately 5 to 10 percent of the total cost of a
microwave system (building, radio equipment, tower and antenna). The relative
percentage is a function of: 1) number of antennas per tower, 2) cost of radio
communication equipment and 3) the number of transmitters and receivers using the
same antenna. Therefore, the purchase of a more spectrum efficient antenna (SHD and
CRR) generally will not have a major impact on the total system cost.
3-9

6000
eooo
N** 4000~
CDUCCDc..CD 3000....c..CD~
w CI ....-0 ....
0 2000crCDc..~
1000
Calculations based on a typicalantenna height of 50 meters oversmooth earth terri an.
STD - IINTERFERENCE THRESHOLD = -103 dBmANTENNA GAIN (mainbeam) = 43 dBi /
V/
/
~VV """/' ..--- - SHD
--- I
~~I
CHR.--:::::::::.V'..~
o20 22 24 26 28 30 32 34 36 38 40
Figure 3-4.
Transmitter Power (dBm)
Denied area as a function of antenna type and transmitter output powerfor an interference threshold of -103 dBm.

MODULATION
The evaluation of spectrum conservation properties for different modulation
schemes is very complex in that both spectrum and spacial denial are effected by the
choice of modulation type used in a system. In general, system parameters such as
occupied bandwidth, required receiver input carrier-to-noise ratio, (CjN)i, and maximum
permissible interference level are all functions of the modulation type and have a
direct bearing on spectrum utilization. For most modulations, all these factors can be
exchanged. For example, one can decrease the required occupied bandwidth, B, in a
tradeoff for an increase in the required CjN ratio or vice versa. This tradeoff is
given by the Shannon-Hartley Law.6 The occupied bandwidth, B, is directly related to
spectrum denial, and the required (CjN)i is indirectly related to spatial (area) denial
since an increase in the required (CjN)i requires an increase in required transmitter
output power.
In this analysis eight different modulation types often used in fixed service
point-to-point microwave systems were considered. The analysis utilized theoretical
parameters for the different modulation types instead of manufacturer specifications
and measured performance information to ensure a just comparison. In order to
evaluate the spectrum conservation properties for the different modulation types it was
necessary to determine the occupied bandwidth, required transmitter output power level
and maximum permissible interference level for each modulation type.
Digital Modulation
The following is a discussion of the determination of occupied bandwidth and
required transmitter output power level for the digital modulations analyzed. In order
to analyze the spectrum conservation properties of different digital modulation it is
necessary to establish reference system characteristics to do the analysis. The
reference system characteristics assumed here were:
6 B. P. Lathi, Communication Systems, John Wiley & Sons, Inc. (1965).
3-11

1.
2.
3.
4.
5.
BITS PER SAMPLE (n)
SAMPLE RATE
NUMBER OF VOICE CHANNELS
TRANSMISSION RATE (R)
BIT ERROR RATE (BER)
=
=
8
8 kHz
1344
90 Mb/s (TWO DS3 TIME-DIVISION MULTIPLEXERS)
10-6
6. THEORETICAL TRANSMISSION EFFICIENCY AND C/N
-IDEAL RECEIVER IF AND LP FILTERS
-NO INTERSYMBOL INTERFERENCE
The digital modulations considered in this investigation are: phase shift keying (4-PSK
and 8-PSK), quadrature amplitude modulation (l6-QAM, 64-QAM and 256-QAM) and
quadrature partial response signaling (9-QPRS).
Digital System Occupied Bandwidth
The occupied bandwidth, B, for the digital modulations was determined using the
reiationship
B= Rlog2 M
where:
(3-2)
RM
log2 M
Transmission Rate (b/s), 90 Mb/s= Equivalent number of states= Transmission Efficiency
The transmission efficiency and occupied bandwidth for each of the digital modulations
are given in TABLE 3-3.
3-12

Digital System Transmitter Output Power
In order to establish the required transmitter output power for each digital
modulation type, it is necessary to determine the required receiver (C/N)i, for a
specified performance criteria. For the digital modulations, a bit error rate (BER) of
10-6 was used as the performance criteria and the required receiver (C/N)i was
obtained from open literature.7,8,9
The receiver input noise level given in TABLE 3-3 was determined from the
rela tionship:
Ni = -114 dBm + 1010gB (MHz) + NF (3-3)
where NF is the receiver noise figure (assumed to be 7 dB). Th~ required minimum
carrier level C(min) at the receiver input was then determined from:
C(min) = (C/N)i + Ni (3-4)
The required transmitter output power, Pt , given in TABLE 3-3 is related to C(min) by
the expression:
Pt = C(min) + Gs
where Gs represents the system gain which was set equal to 103 dB.
(3-5)
TABLE 3-3 summarizes the required occupied bandwidth, B, required transmitter
output power level, P t , and gives the transmission efficiency (Bits/second/Hz) for all
the digital modulations studied.
7
8
9
Kamilo Feher, Digital Communications, Microwave, Applications, Prentice-HallInc., Englewood Cliffs, N.J., (1981).
Kamilo Feher, Edward M. Karkar, and John D.Y. Huang, "On 6.67 b/s/Hz256-QAM and 225-QPRS Modems for TI/SG Data'-in-Voice Applications,"IEEE (1985).
J. A. Crossett and P. R. Hartmann, "64-QAM Digital Radio TransmissionSystem Integration and Performance," IEEE (1984).
3-13

Analog Modulation
The following is a discussion of the determination of occupied bandwidth and
required transmitter output power level for the analog modulations analyzed. In order
TABLE 3-3
DIGITAL SYSTEM PARAMETERS(90 Mbjs)
MODULATION TRANSMISSION REQUIRED NOISE MINIMUM TRANSMITTERTYPE EFFICIENCY BANDWIDTH CARRIER- LEVEL CARRIER POWER
TO-NOISE LEVEL LEVEL(b/s/Hz) (MHz) (dB) (dBm) (dBm) (dBm)
4 PSK 2 45 13.6 -90.5 -76.9 26.18 PSK 3 30 19.0 -92.2 -73.2 ~9.8
9 QPRS 2 45 16.~ -90.5 -73.9 29.116 QAM 4 22.5 21.0 -93.5 -72.5 30.564 QAM 6 15 27.0 -95.2 -68.2 34.8
256 QAM 8 lL25 33.1 -96.5 -63.4 39.6
to analyze the spectrum conservation properties of different analog modulations, it is
necessary to establish reference system characteristics to do the analysis. The
reference system characteristics assumed for analysis of the spectrum conservation
properties of analog modulation systems were:
1. NUMBER OF VOICE CHANNELS (N)
2. CHANNEL BANDWIDTH (b)
600 (FDMjFM)1200 (FDMjFM)5400 (FDMjSSB)
3.1 kHz
3. OUTPUT SIGNAL-TO-NOISE RATIO (SjN)o= 30 dB
4. MAXIMUM BASEBAND FREQUENCY (fm)= 3024 kHz for 600 (FDMjFM)5772 kHz for 1200 (FDMjFM)
5. RMS TEST-TONE DEVIATION (f r )
6. NOISE LOADING FACTOR (NLF)
3-14
200 kHz for 600 (FDMjFM)140 kHz for 1200 (FDMjFM)
-15 + 1010g N (FDMjFM)-19.6 + 1010g N (FDMjSSB)

Analog System Occupied Bandwidth
The occupied bandwidth for the FDM/FM systems was determined using Carson's
rule.
Where:
B = 2[3.76gfr + f m] (3-6)
rms test-tone deviationmaximum baseband frequencylONLF/20
-15 + 1010g Nnumber of voice channels
Using Equation 3-6 and the parameters given above for the FDM/FM systems, the
occupied bandwidth for the 600 and 1200 channel FDM/FM are 13 MHZ and 18 MHz
respectively.
The occupied bandwidth for the single sideband (SSB) system was based on the
theoretical required baseband bandwidth which is 30 MHz.
TABLE 3-4 summarizes the required occupied bandwidth, B, for the analog systems
and gives the system channel efficiency (voice channels per MHz).
Analog System Transmitter Output Power
In order to establish the required transmitter output power for each analog
modulation type, it is necessary to determine the required receiver (C/N)j for a
specified performance criteria. For the analog modulations, a 30 dB output signal-to
noise ratio [(S/N)o] was used as the performance criteria. This output ratio, [(S/N)o],
is often referred to as the signal-to-noise output Test Tone ratio. The required input
carrier-to-noise ratio for the FDM/FM systems was obtained from the following
equation.
(3-7)
Where:b = Channel bandwidth = 3.1 kHzW = Pre-emphasis weighing factor = 2.5 dB
3-15
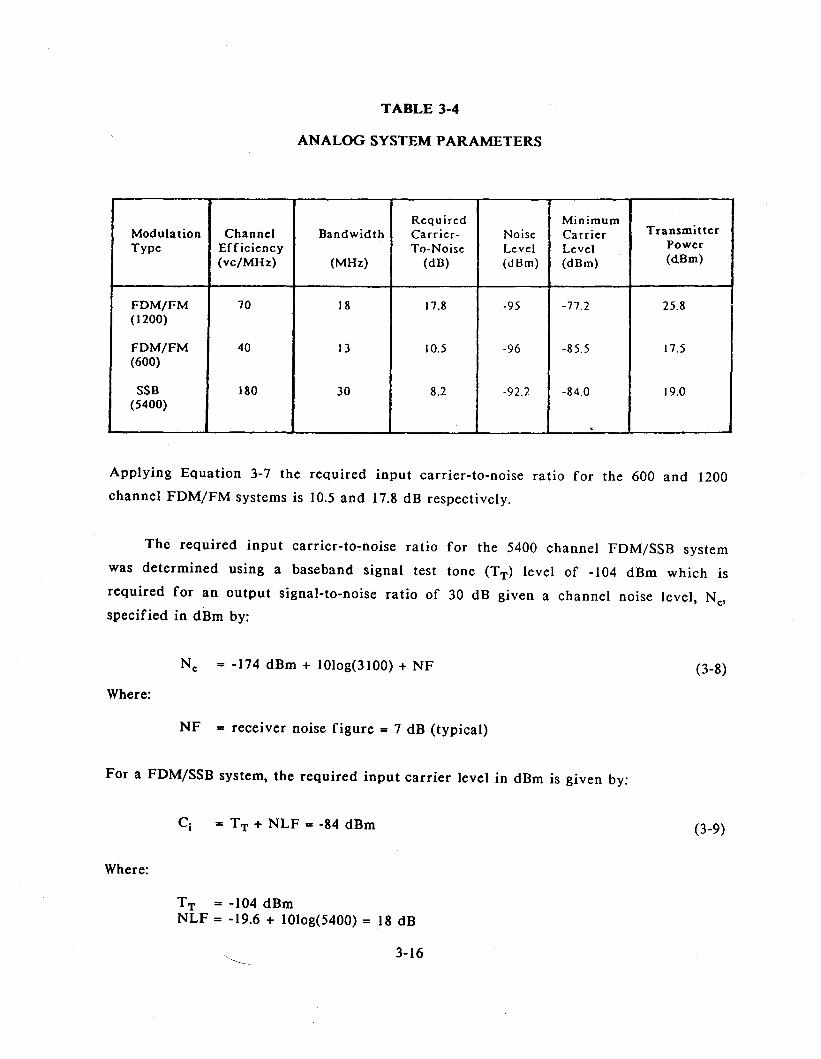
TABLE 3-4
ANALOG SYSTEM PARAMETERS
Required MinimumTransmitterModulation Channel Bandwidth Carrier- Noise Carrier
Type Efficiency To-Noise Level Level Power
(vc/MHz) (MHz) (dB) (dBm) (dBm) (dBm)
FDM/FM 70 18 17.8 -95 -77.2 25.8(1200)
FDM/FM 40 13 10.5 -96 -85.5 17.5(600)
55B 180 30 8.2 -92.2 -84.0 19.0(5400)
.
Applying Equation 3-7 the required input carrier-to-noise ratio for the 600 and 1200
channel FDM/FM systems is 10.5 and 17.8 dB respectively.
The required input carrier-to-noise ratio for the 5400 channel FDM/SSB system
was determined using a baseband signal test tone (TT) level of -104 dBm which is
required for an output signal-to-noise ratio of 30 dB given a channel noise level, Ne
,
specified in dBm by:
Ne = -174 dBm + IOIog(3100) + NF
Where:
NF = receiver noise figure = 7 dB (typical)
For a FDM/SSB system, the required input carrier level in dBm is given by:
Ci = T T + NLF = -84 dBm
Where:
TT = -104 dBmNLF = -19.6 + 1010g(5400) = 18 dB
3-16
(3-8)
(3-9)

The receiver input equivalent noise level in dBm is given by:
Ni = -114 + 1010g B(MHz) + NF = - 92.2 dBm
Where:
B = receiver occupied bandwidth = 30 MHzNF = receiver noise figure = 7 dB
(3-10)
The required receiver input carrier-to-noise ratio, (CjN)i, can now be determined from
Equations 3-9 and 3-10.
Ci - Ni = -84 dBm - (-92.2 dBm) = 8 dB (3-11 )
TABLE 3-4 summarizes the required receiver (CjN)i for the analog systems. The
receiver input noise levels, Ni, and minimum carrier levels, C(min), given in TABLE 3-4
were determined using Equation 3-3 and 3-4 respectively. The required transmitter
output power level, P t , was calculated using Equation 3-5. TABLE 3-4 also shows the
number of voice channels (VC) and channel efficiency (VCjMHz) for each of the analog
modulations.
Maximum Permissible Interference Level
The receiver maximum permissible interference level associated with each
modulation was determined assuming that the victim receiver has the same modulation
type as the transmitter. Therefore, the maximum permissible interference level will
vary as a function of the modulation type. This assumption was based on the premise
that if a standard modulation was adopted based on spectrum conservation properties,
the environment will become homogeneous. That is the interfering transmitter and the
victim receiver will have the same modulation type. In this analysis the maximum
permissible interference level was determined using the criteria established in the
Electronic Industries Association Standard (EIA Bulletin no. 10-D).1O
10 Electronic Industries Association, Telecommunications Systems Bulletin No.10D, "Interference Criteria for Microwave Systems in the Private RadioService," August 1983.

Digital Systems. For the digital systems, the performance criteria used was a
decrease in BER from 10-6 to 10-5 which corresponds to approximately a one dB
increase in receiver noise level at the receiver input ([I + N]/N = 1 dB) and is
equivalent to an interference-to-noise (I/N) ratio at the receiver input of -6 dB.
Based on the receiver input noise levels given in TABLE 3-3, the maximum permissible
interference level IMAX' for each digital modulation type was calculated using:
(3-12)
TABLE 3-5 summarizes the maximum permissible interference levels for all the digital
modulations types, and gives the corresponding faded and unfaded receiver input carrier
levels (Cj) and carrier-to-interference ratios [(C/I)j], assuming a 40 dB fade margin.
Analog Systems. For the analog systems, the performance criteria used was a 5
pWpO interference level in a channel for a single hop which is accepted by the
Electronic Industries Association (EIA Bulletin no. 10-D). For 600 and 1200 channel
FDM/FM systems, the Electronic Industries Association Standard (EIA Bulletin no. 10
D) specifies an unfaded receiver (C/I)j at the receiver input of 69 and 73 dB
respectively. EIA does not specify a receiver input carrier-to-interference ratio for a
FDM/SSB 5400 channel system; however, for a performance criteria of 5 pWpO, the
required unfaded carrier-to-interference ratio at the receiver was determined to be 66
dB. Using the carrier levels given in TABLE 3-4 and taking into account a 40 dB fade
margin, the maximum permissible interference level for the analog systems was
determined by:
(3-13)
The maximum permissible interference level for each of the analog modulation types is
given in TABLE 3-5.
3-18
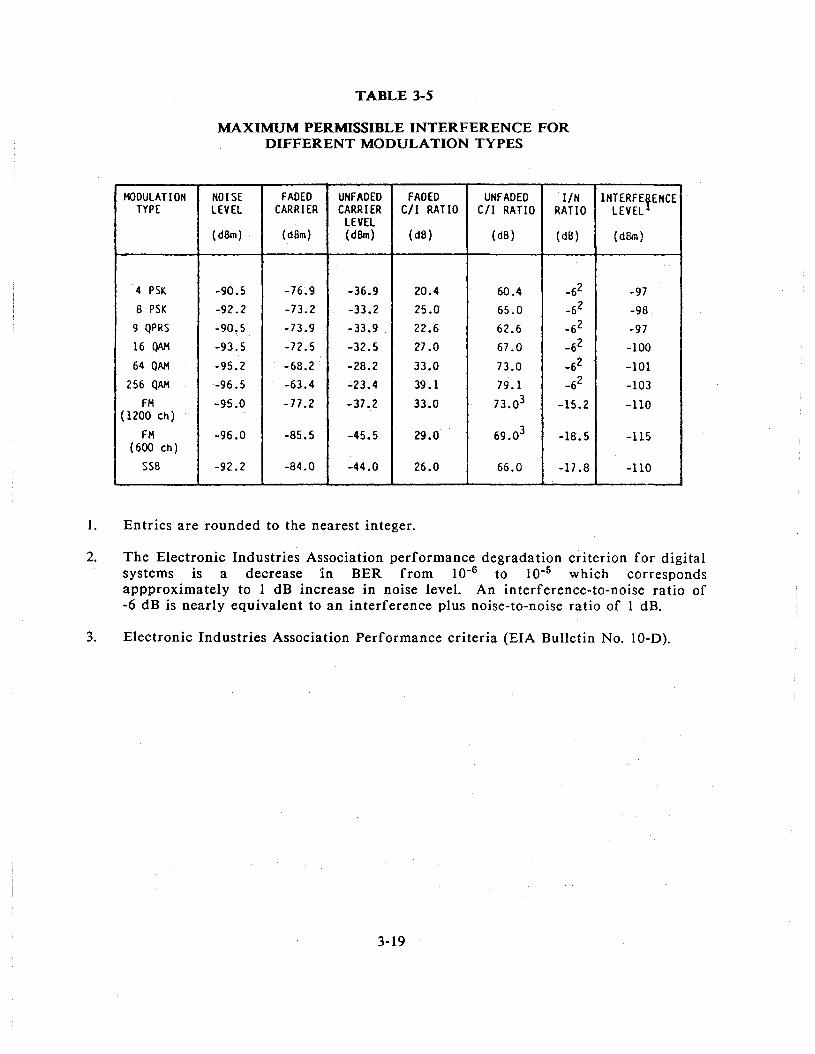
TABLE 3-5
MAXIMUM PERMISSIBLE INTERFERENCE FORDIFFERENT MODULATION TYPES
IoK>DULATl ON NOISE FADED UNFADED FADED UNFADED I/N INTERFE~ENCETYPE LEVEL CARRIER CARRIER C/I RATIO C/I RATIO RATIO LEVEL
LEVEL(dBrn) (dBm) (dBm) (dB) (dB) (dB) (dBm)
4 PSK -90.5 -76.9 -36.9 20.4 60.4 _62 -97B PSK -92.2 -73.2 -33.2 25.0 65.0 _6 2 -98
9 QPRS -90,5 -73.9 -33.9 22.6 62.6 _6 2 -9716 QAM -93.5 -72.5 -32.5 27 .0 67.0 _62 -10064 QAM -95.2 -68.2 -28.2 33.0 73.0 _62 -101
256 QAM -96.5 -63.4 -23.4 39.1 79.1 _62 -103FM -95.0 -77.2 -37.2 33.0 73.03 -15.2 -110
(1200 ch)
FM -96.0 -85.5 -45.5 29.0 69.03 -18.5 -115(600 ch)
SSB -92.2 -84.0 -44.0 26.0 66.0 -17.8 -110
1. Entries are rounded to the nearest integer.
2. The Electronic Industries Association performance degradation criterion for digitalsystems is a decrease 'in BER from 10-6 to 10-5 which correspondsappproximately to I dB increase in noise level. An interference-to-noise ratio of-6 dB is neacly equivalent to an interference plus noise-to-noise ratio of 1 dB.
3. Electronic Industries Association Performance criteria (EIA Bulletin No. 10-0).
3-19

Spectrum Conservation Factor
TABLE 3-6 contains the calculated spectrum conservation factor (SCF) value for
each of the different modulation types using the system bandwidth and transmitter
output power level given in TABLES 3-3 and 3-4 and the maximum permissible
interference level given in TABLE 3-5. The entries for SCF in TABLE 3-6 are for nine
different modulation types and three types of antennas (STD, SHD and CHR). Systems
with higher SCF values are more efficient from the spectrum conservation point-of
view. It should be emphasized that the calculated results clearly point out that for
the majority of the modulations the SCF varies considerably from one antenna type to
another. For example. the SCF for 64-QAM is 0.060 for the STD antenna as compared
to 0.086 and 0.056 for the SHD and CHR antennas. respectively. Therefore TABLE 3-6
indicates that the SCF can be optimized only when the effects of both antenna and
modulation are considered together. Improvement or even change in anyone of the
factors alone in a system does not always result in the optimum SCF for that system.
SCF may be used to select a combination of system design factors that result in an
optimum use of the spectrum.
TABLE 3-6 indicates that. regardless of the antenna type used, FDMjSSB
modulation has higher SCF values than the systems using other modulation types. This
is due to new developments capabilities in the suppression of intermodulation noise
and the ability of the FDMjSSB system to accommodate a large number of channels in
a relatively small bandwidth.
In addition. by comparison, the SCF for 64-QAM was found to be higher than
that for the 256-QAM for all three antenna types. Hence the analysis results indicate
that 64-QAM is a more spectrum conserving modulation based on the SCF concept.
TABLE 3-7 provides as explanation of why 64-QAM is more spectrum efficient than
256-QAM for a shrouded dish (SHD) antenna. The input parameters to the model are
provided in the table. The number of voice channels (VC) is the same. 1344, for both
modulations since two DS3s are assumed. The required system bandwidth, B. for 256
QAM is smaller than for 64-QAM (I 1.25 MHz as compared to 15 MHz). However, the
required transmitter power level. Pt. for 256-QAM is significantly higher than 64-QAM
(39.6 dBm as compared to 34.8 dBm). and the transmitter power has a major effect on
3-20

TABLE 3-6
SPECTRUM CONSERVATION FACTORFOR
ANALOG AND DIGITAL MODULATIONS(EIA INTERFERENCE THRESHOLD USED)·
Spectrum Conservation FactorFor Different Antenna Types
RankingOrder STD SHD CHR
(SCF) (SCF) (SCF)
1 FDMjSSB FDMjSSB FDMjSSB(0.337) (0.372) (1.553)
,~ ,.
2 4-PSK 4-PSK 64-QAM .(0.128) (0.121) (0.560)'
3 8-PSK 8-PSK 16-QAM(0.099) (0.105) (0.489)
4 16-QAM 16-QAM FM (1200)(0.092) (0.106) (0.416)
5 9-QPRS , 64-QAM 256-QAM(0.085) (0.086) (0.403)
6 64-QAM 9-QPRS 8-PSK(0:060) (0.086)" (0.402)
7 FM (600) FM (600) FM (600)(0.053) (0.065) (0.347)
8 FM (1200) FM (1200) 4-PSK(0.045) (0.064) (0.324)
9 256-QAM 256-QAM 9-QPRS(0.025) (0.064) (0.281 )
• see TABLE 3-5
3-21
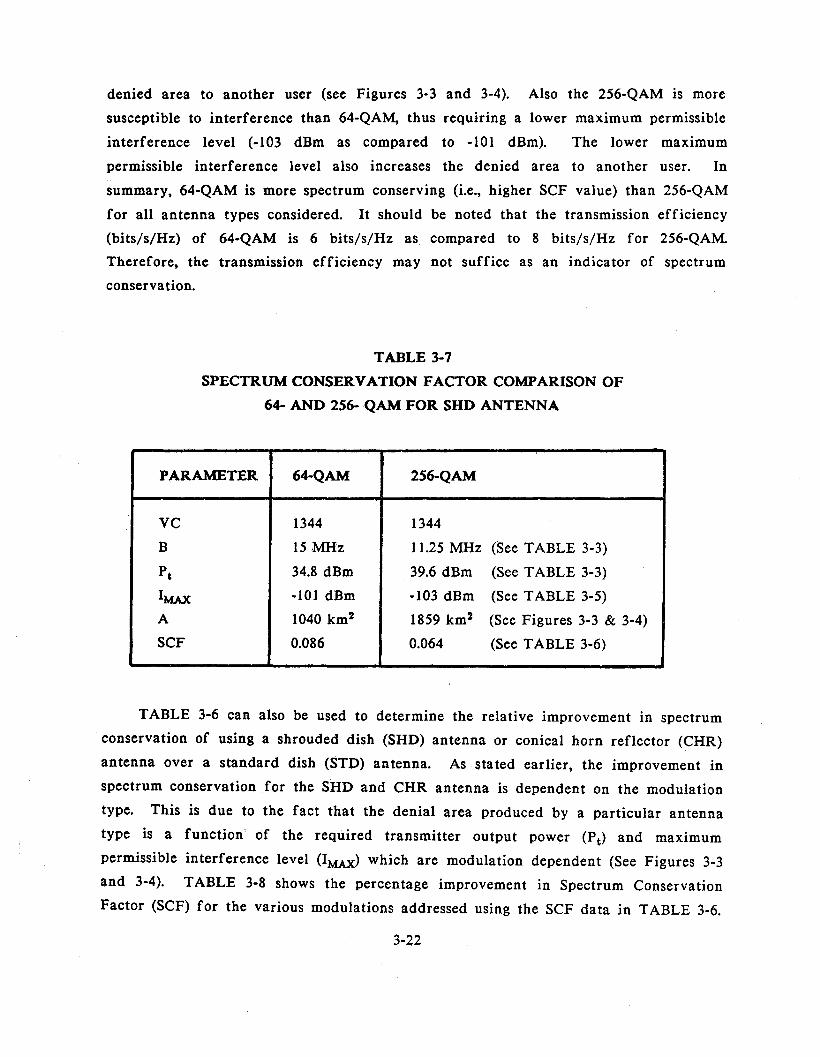
denied area to another user (see Figures 3-3 and 3-4). Also the 256-QAM is more
susceptible to interference than 64-QAM, thus requiring a lower maximum permissible
interference level (-103 dBm as compared to -101 dBm). The lower maximum
permissible interference level also increases the denied area to another user. In
summary, 64-QAM is more spectrum conserving (i.e., higher SCF value) than 256-QAM
for all antenna types considered. It should be noted that the transmission efficiency
(bits/s/Hz) of 64-QAM is 6 bits/s/Hz as compared to 8 bits/s/Hz for 256-QAM
Therefore, the transmission efficiency may not suffice as an indicator of spectrum
conservation.
TABLE 3-7
SPECTRUM CONSERVATION FACTOR COMPARISON OF
64- AND 256-QAM FOR SHD ANTENNA
PARAMETER 64-QAM 256-QAM
VC 1344 1344
B 15 MHz 11.25 MHz (See TABLE 3-3)
Pt 34.8 dBm 39.6 dBm (See TABLE 3-3)
IMAX -101 dBm -103 dBm (See TABLE 3-5)
A 1040 km2 1859 km2 (See Figures 3-3& 3-4)
SCF 0.086 0.064 (See TABLE 3-6)
TABLE 3-6 can also be used to determine the relative improvement in spectrum
conservation of using a shrouded dish (SHD) antenna or conical horn reflector (CHR)
antenna over a standard dish (STD) antenna. As stated earlier, the improvement in
spectrum conservation for the SHD and CHR antenna is dependent on the modulation
type. This is due to the fact that the denial area produced by a particular antenna
type is a function' of the required transmitter output power (P t ) and maximum
permissible interference level (IMAX) which are modulation dependent (See Figures 3-3
and 3-4). TABLE 3-8 shows the percentage improvement in Spectrum Conservation
Factor (SCF) for the various modulations addressed using the SCF data in TABLE 3-6.
3-22

TABLE 3-8
SPECTRUM CONSERVATION FACTOR IMPROVEMENTFOR
SHROUDED DISH AND CONICAL HORN REFLECTORANTENNAS AS A FUNCTION OF MODULATION TYPE_..
Improvement In Spectrum Conservation Factor (SCF)Modulation ;,.
Type Shrouded Dish Conical Horn(SHD) Reflector (CHR)
FDM/SSB 10% 360%
FDM/FM 23% 550%600 Channel
FDM/FM 42% 820%1200 Channel
4 PSK -5% 150%
8 PSK 15% 310%
9 QPRS 1% 230%
16-QAM 14% 430%
64-QAM 43% 830%
1:\ 256-QAM 156% 1500%
3-23

TABLE. 3-9
SPECTRUM CONSERVATION FACTORFOR
ANALOG AND DIGITAL MODULATIONS(EIA INTERFERENCE THRESHOLD USED)*
Spectrum Conserva tion FactorFor Different Antenna Types··
RankingOrder STD SHD CHR
(SCF) (SCF) (SCF)
1 FDM/SSB FDM/SSB FDM/SSB(0.215) (0.205) (0.588)
2 4 PSK 4 PSK 64-QAM(0.077) (0.070) (0.237)
3 8 PSK 8 PSK 16-QAM(0.063) (0.058) (0.179)
4 16-QAM 16-QAM FM (1200)(0.058) (0.057) (0.176)
5 9-QPRS 64-QAM 8 PSK(0.053) (0.047) (0.158)
6 ., 64-QAM 9 QPRS FM (600)(0.041) (0.046) (0.133)
7 FM (600) FM (600) 4 PSK(0.033) (0.035) (0.133)
8 FM (1200) FM (1200) 9 QPRS(0.030) (0.035) (0.115)
9 256-QAM 256-QAM 256-QAM(0.019) (0.030) (0.220)
• see TABLE 3-5••Antenna Heights = ISO meters
3-24

TABLE 3-7 shows that for 4-PSK modulation the shrouded dish type antenna (SHD)
does not offer an improvement in spectrum conservation. This is due to the fact that
the shrouded dish antenna has higher sidelobe levels than the standard dish antenna
for off axis angles less than 20 degrees (See Figure 3-2), and the required transmitter
power and maximum permissible interference level associated with 4-PSK modulation.
For the digital modulations, TABLE 3-8 clearly shows that as the digital modulation
order increases the spectrum conservation improvement increases for a particular
antenna type. The greatest improvement occurs for 256-QAM modulation with a 156
and 1512 percent increase for the shrouded dish (SHD) and conical horn reflector
(CHR) antennas respectively.
To determine the sensitivity of the spectrum conservation factor (SCF) to
scenario dependence, the computer model was also run for an antenna height of 150
meters. TABLE 3-9 shows the results for comparison wi th TABLE 3-6. In summary,
the ranking order of the different modulation has changed. However, the
FDM/SSB modulation remained the most spectrum efficient for all three antenna types,
and 64-QAM is more spectrum efficient than 256-QAM for all three antenna types.
SIGNAL PROCESSING
In a fixed microwave communication system, signal processing is done at the
transmitter and receiver terminal. Signal processing consists of electrical operations
on a signal in order to produce certain desired characteristics. Signal processing can
affect such parameters as amplitude, frequency, phase, signal level, reliability, etc.
The use of signal processing techniques can improve the processing gain of a
system, permitting lower transmitter output power levels for specified receiver output
performance criteria. Thus, through the use of signal processing techniques, the
transmitter output power can be lowered reducing the spatial (area) denial of a system.
However, it should be noted that signal processing techniques are used by the
microwave link designers to improve link reliability and are not generally considered
for the purpose of spectrum conservation.
3-25

Some signal processing techniques used in microwave systems are listed below.u
Companding - the compression (at transmitter) and expansion (atreceiver) of a signal to provide more gain to weak signalsthan to strong ones. Improves SIN on noisy speechcircuits.
Pre-emphasis/De-emphasis - (at the transmitter and receiver, respectively) used toensure relatively constant SIN across the baseband of asystem; this reduces transmitted carrier power, leading toa reduction in spatial denial.
Diversity - radio signals propagating along separate paths to acommon point may have noncorrelated signal levels uponarrival. Diversity transmission separates a transmittedsignal on the basis of frequency, space, time, orpolarization.
Adaptive Equalization - employed to make digital radio receivers less susceptibleto fading; can be implemented in either frequency or timedomain.
Coding - digital (block and convolution.)
Processing gains for each of the above signal processing techniques are given in
TABLE 3-10.
Since the trend of fixed microwave equipment is toward digital systems, this study
will only address error correction/coding and adaptive equalizer as a spectrum
conservation technique.
Error Correction/Coding
Forward error correction (FEe) coding is a method of improving the BER
performance of digital microwave systems, particularly when the system is power
limited. The utilization of FEC coding techniques permits a limited number of errors
to be corrected at the receiving end by means of special coding and software (or
hardware) implemented at both ends of a circuit. This improvement in BER can be
11 Freeman, R. L., Telecommunication Transmission Handbook, 2nd Edition, JohnWiley & Sons, (1981).
3-26
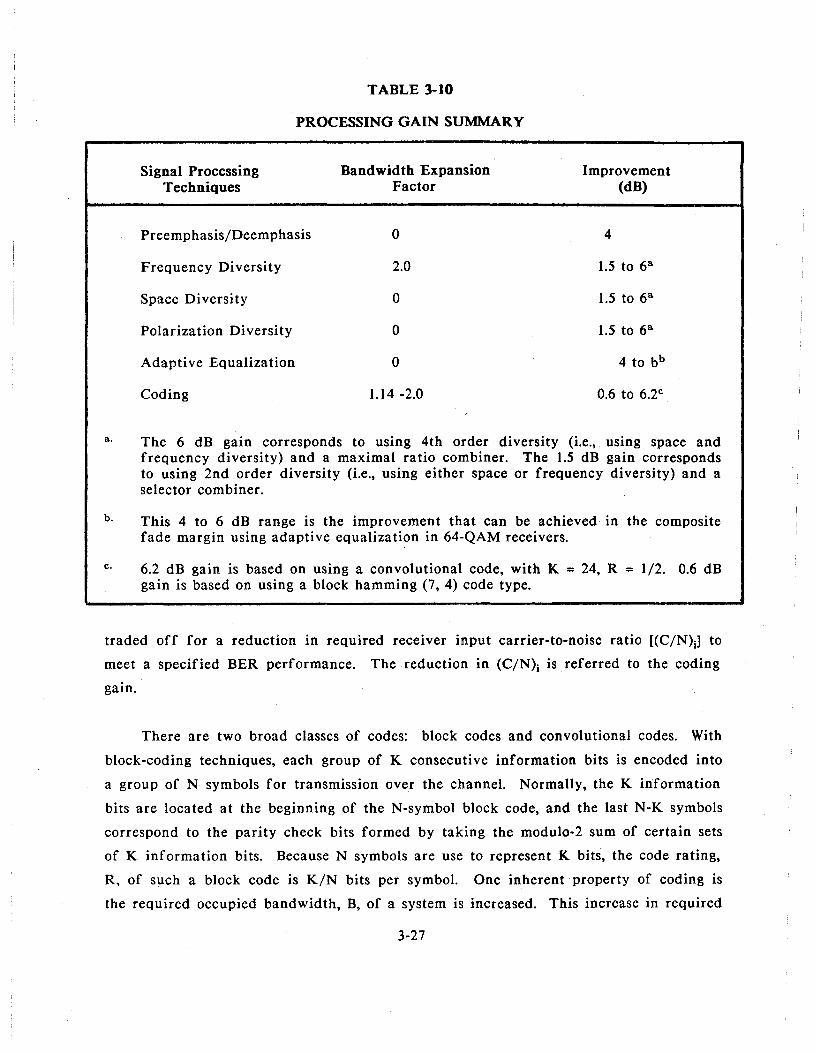
TABLE 3-10
PROCESSING GAIN SUMMARY
Signal ProcessingTechniques
Preemphasis/Deemphasis
Frequency Diversity
Space Diversity
Polarization Diversity
Adaptive Equalization
Coding
Bandwidth ExpansionFactor
o
2.0
o
o
o
1.14 -2.0
Improvement(dB)
4
0.6 to 6.2c
a.
b.
c.
The 6 dB gain corresponds to using 4th order diversity (i.e., using space andfrequency diversity) and a maximal ratio combiner. The 1.5 dB gain correspondsto using 2nd order diversity (i.e., using either space or frequency diversity) and aselector combiner.
This 4 to 6 dB range is the improvement that can be achieved in the compositefade margin using adaptive equalization in 64-QAM receivers.
6.2 dB gain is based on using a convolutional code, with K = 24, R = 1/2. 0.6 dBgain is based on using a block hamming (7, 4) code type.
traded off for a reduction in required receiver input carrier-to-noise ratio [(C/N)j] to
meet a specified BER performance. The reduction in (C/N)j is referred to the coding
gain.
There are two broad classes of codes: block codes and convolutional codes. With
block-coding techniques, each group of K consecutive information bits is encoded into
a group of N symbols for transmission over the channel. Normally, the K information
bits are located at the beginning of the N-symbol block code, and the last N-K symbols
correspond to the parity check bits formed by taking the modulo-2 sum of certain sets
of K information bits. Because N symbols are use to represent K bits, the code rating,
R, of such a block code is K/N bits per symbol. One inherent property of coding is
the required occupied bandwidth, B, of a system is increased. This increase in required
3-27

occupied bandwidth is called the bandwidth expansion factor of the code, and is equal
to 1/R.
In summary. the performance of a coding technique is described by the coding
gain and coding rate. The coding gain can be used to reduce the required receiver
input (C/N)i, thus reducing the denial area to other systems. However, the coding rate
has an impact on the system occupied bandwidth, thus increasing the denied spectrum
to other users of the spectrum.
To show the effect of coding on spectrum conservation, 64-QAM was selected as
the modulation for study. Four types of FECs12 13 14 were selected. TABLE 3-11
shows the coding rate, R, the bandwidth expansion factor, l/R, the occupied bandwidth
after coding, the reduction in (C/N)i for a BER of 10-6 and the required transmitter
output power, Pt , after taking into consideration the obtainable reduction in C/N. The,values for system bandwidth, B, and transmitter output power, Pt , shown in TABLE 3-
11 were input to the spectrum conservation factor (SCF) model to evaluate coding as a
spectrum conservation technique. TABLE 3-12 shows the SCF for the three types of
antennas: STD, SHD and CHR. The SCF for 64-QAM without coding is also shown in
the TABLE 3-12 for a baseline comparison of with and without coding.
In summary, the SCF values given in TABLE 3-12 indicate that signal processing
techniques such as error correction/coding which utilize RF bandwidth versus carrier
to-noise trade-offs only provide improvement in spectrum conservation, higher SCF
values, when high-efficiency coding techniques (Le., coding techniques with high coding
rates and coding gain) are used. Also, the relative improvement in spectrum
conservation is greater when the system has an STD type antenna than an SHD or CHR
type antenna. This is due to the fact that the reduction in denied area is greater for
standard dish antennas because of the higher sidelobe/backlobe characteristics.
12
13
14
Bell Telephone Laboratories, Transmission Systems for Communications, FifthEdition, Bell Laboratories, Inc. (1982).
G.D. Martin, "Optimal Convolutional Self-Orthoginal Codes With ANApplication of Digital Radio," ICC '85, pp. 39.4.1-39.4.5, June 1985.
M. Kavehrad, "Convolutional Coding fOr High-Speed Microwave RadioCommunications," AT&T Tech. Jour. vol. 64, no. 7, pp. 1625-1637, September1985.
3-28

TABLE 3-11
ERROR CORRECTION/CODING(64-QAM MODULATION)
Signal Coding Bandwidth Bandwidth Reduction TransmitterProcessing Rate Expansion (MHz) In C/N Power
Factor (BER=10-6) (dBm)(dB)
Error 1/2 2 30.00 6 28.8correction 3/4 1.333 20.00 3.5 31.3coding 7/8 1.142 17.14 2.0 32.8
18/19 1.055 15.83 3.0 31.8
TABLE 3-12
SPECTRUM CONSERVATION FACTOR FORERROR CORRECTION/CODING (64,..QAM MODULATION)
Spectrum Conservation FactorFor Different Antenna Types
SignalProcessing ~
Type STD SHD CHR(SCF) (SCF) (SCF)
Without signal processing 0.060 0.086 0.560
CodingRate
Error ..
1/2 0.076 0.085 0.376correction 3/4 0.080 0.097 0.510coding 7/8 0.073 0.094 0.553
18/19 0.093 0.116 0.630
3-29
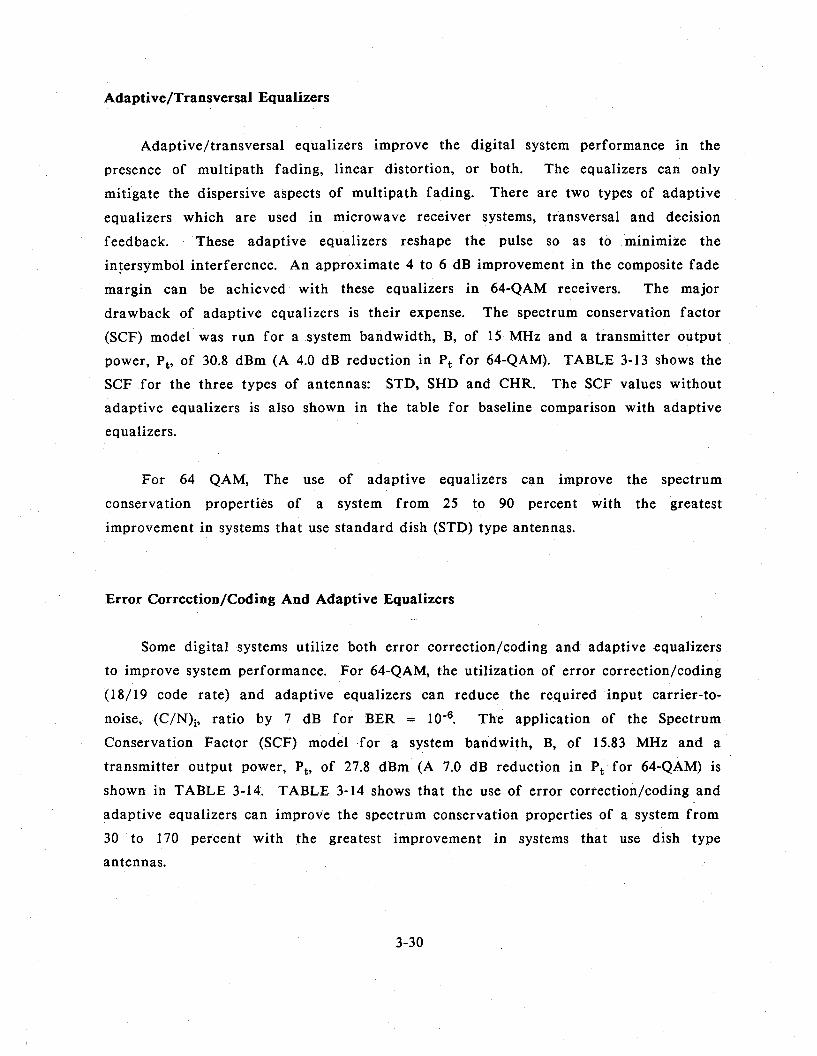
Adaptive/Transversal Equalizers
Adaptive/transversal equalizers improve the digital system performance in the
presence of multipath fading, linear distortion, or both. The equalizers can only
mitigate the dispersive aspects of multipath fading. There are two types of adaptive
equalizers which are used in microwave receiver systems, transversal and decision
feedback. These adaptive equalizers reshape the pulse so as to minimize the
in~ersymbol interference. An approximate 4 to 6 dB improvement in the composite fade
margin can be achieved with these equalizers in 64-QAM receivers. The major
drawback of adaptive equalizers is their expense. The spectrum conservation factor
(SCF) model was run for a system bandwidth, B, of 15 MHz and a transmitter output
power, Pt, of 30.8 dBm (A 4.0 dB reduction in Pt for 64-QAM). TABLE 3-13 shows the
SCF for the three types of antennas: STD, SHD and CHR. The SCF values without
adaptive equalizers is also shown in the table for baseline comparison with adaptive
equalizers.
For 64 QAM, The use of adaptive equalizers can improve the spectrum
conservation properties of a system from 25 to 90 percent with the greatest
improvement in systems that use standard dish (STD) type antennas.
Error Correction/Coding And Adaptive Equalizers
Some digital systems utilize both error correction/coding and adaptive equalizers
to improve system performance. For 64-QAM, the utilization of error correction/coding
(18/19 code rate) and adaptive equalizers can reduce the required input carrier-to
noise, (C/N)i, ratio by 7 dB for BER = 10-6• The application of the Spectrum
Conservation Factor (SCF) model for a system bandwith, B, of 15.83 MHz and a
transmitter output power, Pt , of 27.8 dBm (A 7.0 dB reduction in Pt for 64-QAM) is
shown in TABLE 3-14. TABLE 3-14 shows that the use of error correction/coding and
adaptive equalizers can improve the spectrum conservation properties of a system from
30 to 170 percent with the greatest improvement in systems that use dish type
antennas.
3-30

TABLE 3-13
SPECTRUM CONSERVATION FACTOR FOR
ADAPTIVE EQUALIZER (64-QAM MODULATION)
Spectrum Conservation FactorFor Different Antenna Types
SignalProcessing
Type STD SHD CHR(SCF) (SCF) (SCF)
Without signal processing 0.060 0.086 0.560
With adaptive equalizers 0.114 0.137 0.695
TABLE 3-14
SPECTRUM CONSERVATION FACTOR FOR
ERROR CORRECTION/CODING AND ADAPTIVE EQUALIZERS
(64-QAM MODULATION)
Spectrum Conservation FactorFor Different Antenna Types
SignalProcessing
Type STD SHD CHR(SCF) (SCF) (SCF)
Without signal processing 0.060 0.086 0.560
Error correction/coding 0.164 0.179 0.737and equalizers
3-31


APPENDIX A
COMPUTER MODEL DESCRIPTION
INTRODUCTION
This appendix contains a description of the computer model used to calculate the
spectrum conservation factor (SCF), Equation 3-1, in evaluating spectrum conservation
techniques for fixed point-to-point microwave systems. Also provided in this appendix
are a model flow diagram and model output example.
MODEL DESCRIPTION
The computer model developed during this investigation is a Fortran code which
calculates the spectrum conservation factor (SCF) defined as
(A-I)
where:VC Number of voice channels.T Fraction of time a system is used. Defined to be equal to I for this
analysis.B = Receiver System Bandwidth (MHz)A = Denial area (km2)
The number of voice channels, fraction of time and receiver system bandwidth are
model input parameters. The denial area is a function of the transmitter output power
level, Pt , maximum permissible interference level (interference threshold), IMAX, and
transmitter antenna pattern characteristics which are also input parameters to the
model.
Denial Area
The algorithm used to calculate the denial area involves the segmentation
(quantization) of the transmitter antenna gain pattern into a number of segments, n, as
A-I

y
1
en
n
Rh~
n-l ~ Rn-2
Tx
Figure A-I. Representation of antenna pattern by n circular sectors eachrepresenting a lobe.
shown in Figure A-l. The transmitter antenna gain pattern is an input to the model.
The program calculates the denial area by summing the area in each segment from 0
to 180 degrees and multiplies the area by two to obtain the total denied area 360
degrees around the microwave transmitter. The antenna gain for each segment was
obtained from measured antenna pattern data (see Figure 3-2). TABLE A-I shows the
segmented antenna pattern gain data l;lsed in the model for each of the antenna types
discusseJ in SECTION 3. Geometrically, each segment is a circular sector, the area of
which may be calculated using the formula
A-2
where:
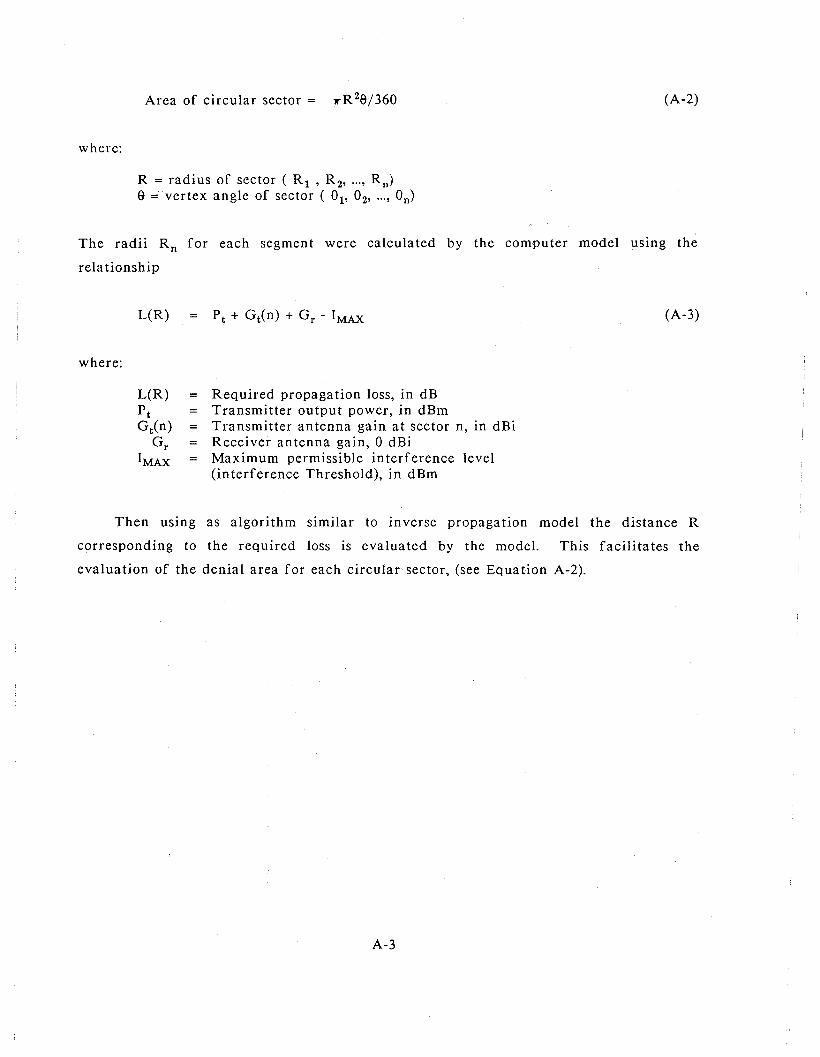
Area of circular sector = T R 28/360
R = radius of sector ( R 1 ' R 2, ... , R n )
e = vertex angle of sector ( 01' 02' ... , On)
(A-2)
The radii R n for each segment were calculated by the computer model using the
rela tionship
where:
L(R)
L(R)PtGt(n)
GrI MAX
Required propagation loss, in dBTransmitter output power, in dBmTransmitter antenna gain at sector n, in dBiReceiver antenna gain, °dBiMaximum permissible interference level(interference Threshold), in dBm
(A-3)
Then using as algorithm similar to inverse propagation model the distance R
corresponding to the required loss is evaluated by the model. This facilitates the
evaluation of the denial area for each circular sector, (see Equation A-2).
A-3

TABLE A-I
ANTENNA PATTERN DATA USED IN TUE ANALYSIS
STD Antenna SUD Antenna CUR Antenna
Antenna Antenna AntennaNo. Sector Angle Sector Angle Sector Angle
Gain (dBi) (deg.) Gain (dBi) (deg.) Gain (dBi) (deg.)
1 43.0 0.005 43.0 0.005 43.0 0.0102 42.1 0.395 42.3 0.495 42.9 0.1003 39.1 0.400 39.8 0.300 42.6 0.1004 30.9 0.500 35.1 0.300 42.2 0.1005 22.7 0.200 24.2 1.100 41.4 0.100
6 21.8 0.800 23.5 00400 40.0 0.2007 17.9 0.500 19.9 1.000 36.6 0.2008 17.2 1.100 17.1 0.400 33.4 0.1009 15.5 1.300 17.0 0.300 26.2 0.300
10 13.5 0.200 16.1 0.100 20.0 0.600
11 13.4 0.700 16.0 1.500 2.5 3.2012 9.8 0.200 13.9 1.000 -10.0 5.00013 9.7 1.700 9.8 1.000 -22.0 10.00014 7.9 5.900 9.7 5.800 -30.2 10.00015 3.0 0.200 7.2 4.400 -35.0 40.000
16 2.0 0.200 5.5 0.200 -42.1 10.00017 1.8 91.500 5.4 2.500 -47.0 100.00018 -12.0 74.200 3.0 0.30019 0.5 1.30020 -1.1 1.700
21 -1.7 2.70022 -3.0 39.10023 -12.0 12.00024 -21.0 12.00025 -30.0 90.000
A-4

COMPUTER MODEL FEATURES
The computer model has several special features. The parameter IMODE is used
to evaluate the denial area for a single transmitter power level (IMODE=I) or a
number of transmitter power levels (IMODE=2). The program output is stored in two
separate files with the file menus selected by the user. One file contains the detail of
the calculation as well as the input data which help the user to check again the
original data. The other file is for plotting the calculated results. The data is this
file are arranged in two columns. One column contains the data on the transmitter
power and the other column the corresponding data on the denial area. The data in
this file has a format compatible with TCPLT, an interactive plot routine which may be
accessed through VAX or PCs. A model flow diagram is shown in Figure A-2.
PROGRAM INPUT PARAMETERS
TABLE A-2 given below contains a description of the input parameters for the
SCF model.
TABLE A·2
DESCRIPTION OF MODEL PARAMETERS
IMODEBANDWTHRESNCHANELTFREQPTIHTXMHRXMNUMANTNLOBES
SCF MODEL OUTPUT EXAMPLE
=
=
=
==
Mode of operationReceiver system bandwidth (MHz)Interference threshold (dBm)Number of voice channelsTransmitter frequency (MHz)Initial Transmitter power (dBm)Transmitter antenna height (km)Receiver antenna height (km)Number of antennaNumber of antenna segments
TABLE A-3 shows an example output for 64 QAM modulation with a shrouded dish
(SHD) antenna.
A-5

VAX termln,,1
Read I> ed1 tuser inputs
Calculaterequ1red
lotiti
Call IPSmodel to
geldistance
Calculatearee of
1nterference
r ComputeSpectrulO
Conti.rvationFactor
LlRl •Pt+Gtlnl+Gr-Imex
IPS
AREA •PI*R**2*THETR/360
SCF • VCIT*B*A
1 1Print fl1. or
Tx Power vs- calculat.d R.cord ofAr.a plot ,...sul ts us.r inputs
data
1
~SCF plot Listing of Listing orr.sults inputs
Figure A-2. Spectrum Conservation Factor (SCF) Model Flow Diagram.
A-6

TABLE A-3
MODEL EXAMPLE OUTPUT
OOQOOOOOOOO~O~OOD*OOOOOOO*OOOOOOOOOOOOOOOOOOOO*OOOOOOO0000000
o 5 P ~ C T ~ U ~ C 0 ~ S E R V A T ION F ACT a R *o PROGkA~ SCF •o NTI~ VAX/V~S •4.oooooo.oooooooooo~ooooooo •• ooo*o.ooooooooooooo**o.*o000••••
A~Tt~NA N8. 2T~ANSMITTER FRE~UENCY (~HZ) = ecoc.oT~~MS~ITTER ANTeNNA ~EIG~T (101) ~ 50.00~[CEIVE~ A~TE~~A HEIGHT (~): !c.oorl~E It) = 1.0~ANC~IDTH IMHZ): 15.~
0~NI€~ ~FCEIVc~ THRFSHOLC (DB~) : -101.0""'J~8f:'" :1F CHAN"I=L5 = 1344
A~ T;: "l~,t. MrE"l~~
S':CT'JR SECTI)R REQU IIU:O SeCTOR SECTORPOW!:'i!. sec Tr:R GAl' A"lGl!: LOSS HADIUS AREA02(08101) NUMeF~ I D!! I ) (D:oGREI'$ ) ( 031 (KIoI ) (KMOIl<Zl
------ ------ ------- --------- -------- ------ -------.\It.800
,43.00:' 0.005 178.800 69.281 0.42~
311.800 2 '12.3GO 0.495 17'3.100 68.eS4 40.96\ 4.800 3 39.300 0.30:) 175.600 61.339 23.74~4.eOO 4 35.10:) O.30C 170.900 64.534 21.81H .eoo 'i 24.200 1.10C 100.000 58.241 (,5.1434.800 6 23.5CO 0.400 159.300 51.854 23.31~4.800 7 19.9JO 1.000 155.100 :i5.853 54.4534.800 oj 11.100 C).lo00 152.900 54.319 70.6034.800 c: 17.000 o. "!OC 1'52.~00 54.266 15.42H.8JO 11) le.101) O. lOt: 151.900 53.171 5.0534.800 11 H .001) 1.50C l!'l.BOO r.3.123 15.56H.80C 1? 1~.900 1.000 14 Q .100 52.592 4e.21"34.800 I; 9.301) 1.COO 145.~00 50.420 44.31.i4.800 14 9.1CO 5.80C 145.500 5C.367 :?56.81;4.'1)0 1:; 7.200 4.1,.00 143.000 42.152 136.45~4.eOO 16 5.501) O.ZOC 141.300 34.659 4.19340800 11 5.400 2.500 141.2QC 34.263 51.22'4.800 1:3 3.00') 0.30e 13'3.BOC 25.991 3.54~4.ebo 1<; 0.500 1."30') 136.3.)0 1'1.490 8.62~4.eOO 70 -1 • 1~0 1.70C 134.100 16.211 7.801".800 21 -1.11)1) 2.100 134.11)0 15.129 10.19~4.aiJO 22 '. "3 .00 ) 39.11)C 132.'lI)O 13.C2b 115.80:; 4.8') 0 23 -12.00) 12.00C 123.R00 4.62? 4.4134.90') 24 -11.00C 1Z.C01 114.800 1.640 0.56'i4.800 ?5 -J r). Of'.) ~,...:)oc 10';.1\00 O.'.ie2 0.S3
TOTAL ARE4 IV. \!t;l1QI2 l " 10)<).'1;~
SCF ;II C.CPb
A-7

FORM NTIA-29 U.S. DEPARTMENT OF COMMERCE(4-80) NAT"L. TELECOMMUNICATIONS AND INFORMATION ADMINISTRATION
BIBLIOGRAPHIC DATA SHEET
-- r---'",1. PUBLICATION NO. 2. Gov't Accession No. 3. Recipient's Accession No.
NTIA REPORT89-243
4. TITLE AND SUBTITLE 5. Publication Date
SPECTRUM-CONSERVATION TECHNIQUES FOR May 1989FIXED MICROWAVE SYSTEr~S
6. Performing Organization Code
7. AUTHOR(S) 9. ProjecVTasklWork Unit No.
Robert L. Hinkle, Andrew Farrar8. PERFORMING ORGANIZATION NAME AND ADDRESS
National Telecommunications & Information AdministrationAnnapolis Office 10. ContracVGrant No.
179 Admiral Cochrane DriveAnnapolis, Maryland 2140111. Sponsoring Organization Name and Address 12. Type o( Report and Period Covered
U.S. Department Commerce/NTIA179 Admiral Cochrane Drive Technical'ReportAnnapolis, Maryland 21401 13.
14. SUPPLEMENTARY NOTES
15. ABSTRACT (A 200-word or less faclual summary of mosl significant information. If document includes a significant bibliography or literaturesurvey, mention it here.)
Since the spectrum is a limited natural resource, the spectrum management community
has a major interest in identifying spectrum conservation techniques that will provide more
efficient spectrum utilization. Advances in new technology for fixed microwave systems in
antennas, modulation schemes and signal processing techniques offer increased efficiency in
spectrum utilization. This report analyzes the spectrum conserving properties of the various
new technologies for fixed microwave systems applying the concepts in CCIR Report 662-2,
and was defined as the spectrum conservation factor (SCF). The report concludes that the
SCF technique is an effective indicator of the spectrum conserving properties of
technologies which can be used to develop new spectrum standards.
16. Key Words (Alphabetical order, separated by semicolons),
Spectrum Efficiency
Spectrum Conservation Factor (SCF)
Fixed Microwave System
7125-8500 MHz Band
17. AVAILABILITY STATEMENT 18. Security Class. (This report) 20. Number o( pages
IKI UNLIMITED. UNCLASS IFI ED 5519. Security Class. (This page) 21. Price:
0 FOR OFFICIAL DISTRIBUTION.UNCLASSIFIED N/A
1l- u.s. Government Printing Office: 1980-678·495/521