spectrum analysis back to basics - united states … · • specifications • modern spectrum...
TRANSCRIPT

Aerospace and Defense Symposium 2007EuMw 2007 Agilent Workshop
Spectrum Analysis Back to Basics
Beyond S-Parameters© Agilent Technologies, Inc. 2007
Page M6- 1

Aerospace and Defense Symposium 2007EuMw 2007 Agilent WorkshopAgenda
• Introduction• Overview:
– What is Signal Analysis?– What Measurements are available?
• Theory of Operationy p• Specifications• Modern spectrum analyzer designs & capabilities
» Wide Bandwidth Vector Measurements» Wide Bandwidth Vector Measurements
Beyond S-Parameters© Agilent Technologies, Inc. 2007

Aerospace and Defense Symposium 2007EuMw 2007 Agilent WorkshopOverviewWhat is Signal, Vector and Spectrum Analysis?
•Display and measure amplitude versus frequency for RF & MW signals
•Separate or demodulate complex signals into their base components (sine waves)
Spectrum Analysis
Beyond S-Parameters© Agilent Technologies, Inc. 2007
Separate or demodulate complex signals into their base components (sine waves)

Aerospace and Defense Symposium 2007EuMw 2007 Agilent WorkshopOverviewFrequency versus Time Domain
Amplitude(power)
Time domainMeasurements
(Oscilloscope)
Frequency DomainMeasurements
(Spectrum Analyzer)
Beyond S-Parameters© Agilent Technologies, Inc. 2007
(Oscilloscope) ( p y )

Aerospace and Defense Symposium 2007EuMw 2007 Agilent WorkshopOverviewTypes of Measurements Available
• Frequency, power, modulation, distortion & noise
• Spectrum monitoring Modulation• Spectrum monitoring• Spurious emissions• Scalar network analysis• Noise figure & phase noiseNoise figure & phase noise• Harmonic & intermodulation distortion• Analog, digital, burst & pulsed RF Modulation• Wide bandwidth vector analysis
El i i f
NoiseNoise
• Electromagnetic interference
• Measurement range (-168 dBm to +30 dBm)• Frequency range (3 Hz to 325 GHz) q y g ( )
Spur SearchSpur Search
Beyond S-Parameters© Agilent Technologies, Inc. 2007
DistortionDistortion

Aerospace and Defense Symposium 2007EuMw 2007 Agilent WorkshopOverviewDifferent Types of Analyzers
FFT Analyzer
Parallel filters measured simultaneouslyA
LCD shows full spectral display
ff1 f2
Beyond S-Parameters© Agilent Technologies, Inc. 2007
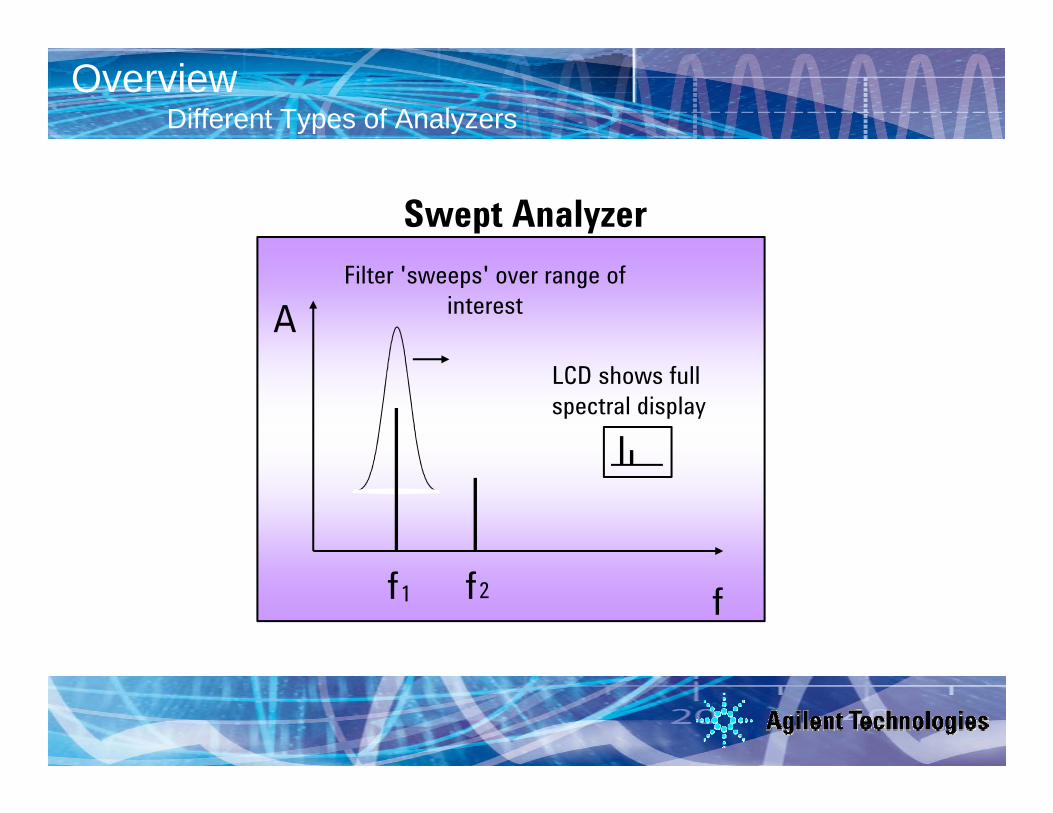
Aerospace and Defense Symposium 2007EuMw 2007 Agilent WorkshopOverviewDifferent Types of Analyzers
Swept Analyzer
AFilter 'sweeps' over range of
interest
LCD shows full spectral display
ff1 f2
Beyond S-Parameters© Agilent Technologies, Inc. 2007

Aerospace and Defense Symposium 2007EuMw 2007 Agilent WorkshopAgenda
• IntroductionIntroduction• Overview• Theory of Operation:
– Swept Spectrum Analyzer Hardware
• Specifications• Modern spectrum analyzer designs & capabilitiesp y g p
» Wide Bandwidth Vector Measurements
Beyond S-Parameters© Agilent Technologies, Inc. 2007
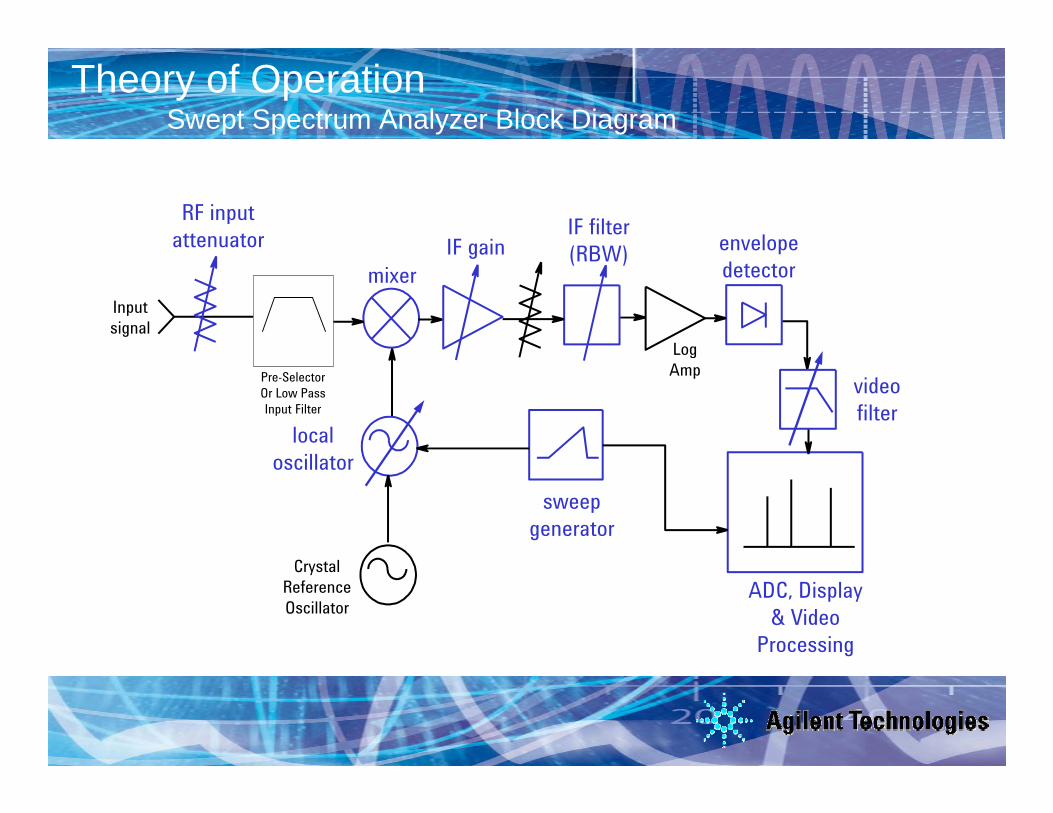
Aerospace and Defense Symposium 2007EuMw 2007 Agilent WorkshopTheory of OperationSwept Spectrum Analyzer Block Diagram
RF inputattenuator IF filter
(RBW) envelope IF gain
Log
mixer(RBW) p
detectorIF gain
Inputsignal
Pre-SelectorOr Low PassInput Filter
gAmp
videofilter
localill t
C l
oscillatorsweep
generatorCrystal
Reference Oscillator
ADC, Display & Video
Processing
Beyond S-Parameters© Agilent Technologies, Inc. 2007
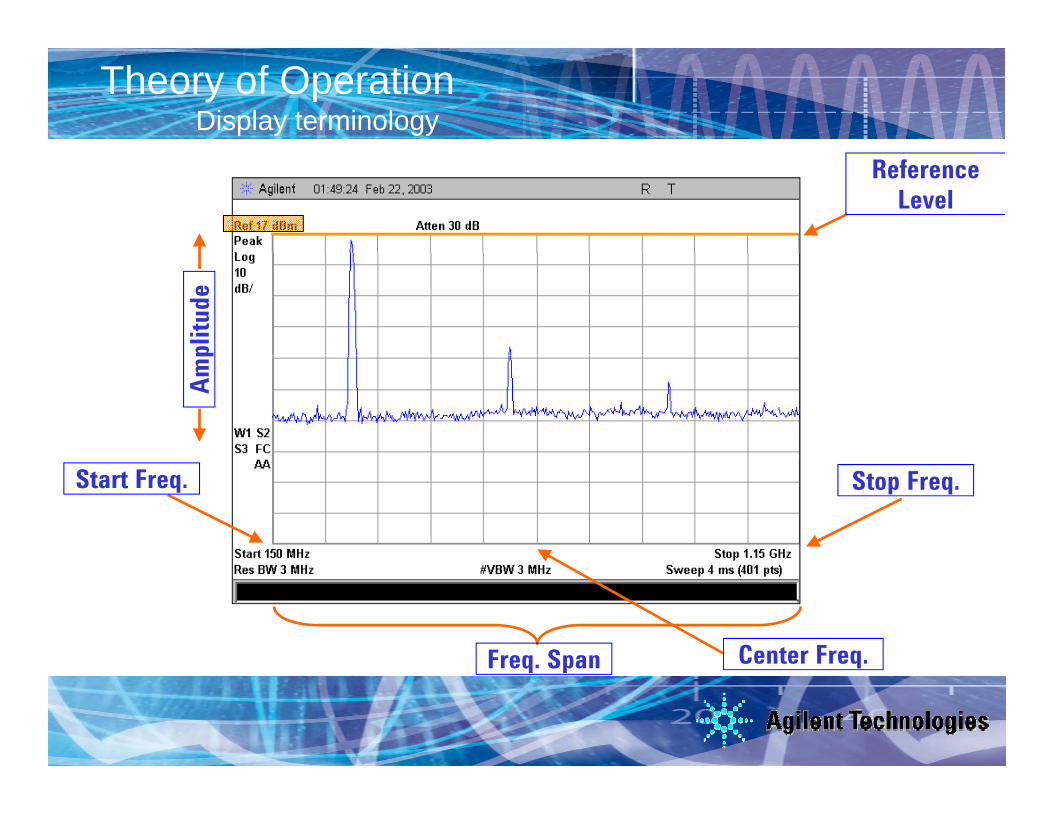
Aerospace and Defense Symposium 2007EuMw 2007 Agilent WorkshopTheory of OperationDisplay terminology
Reference Level
plitu
deAm
p
Start Freq. Stop Freq.
Freq Span Center Freq.
Beyond S-Parameters© Agilent Technologies, Inc. 2007
Freq. Span Center Freq.

Aerospace and Defense Symposium 2007EuMw 2007 Agilent WorkshopTheory of OperationMixer
MIXERMIXER
f sig f sig LOf
LOf f sig- LOf f sig+RFLO
IF
1.5 GHz
LOf3,6 GHz 6.5 GHz
Beyond S-Parameters© Agilent Technologies, Inc. 2007
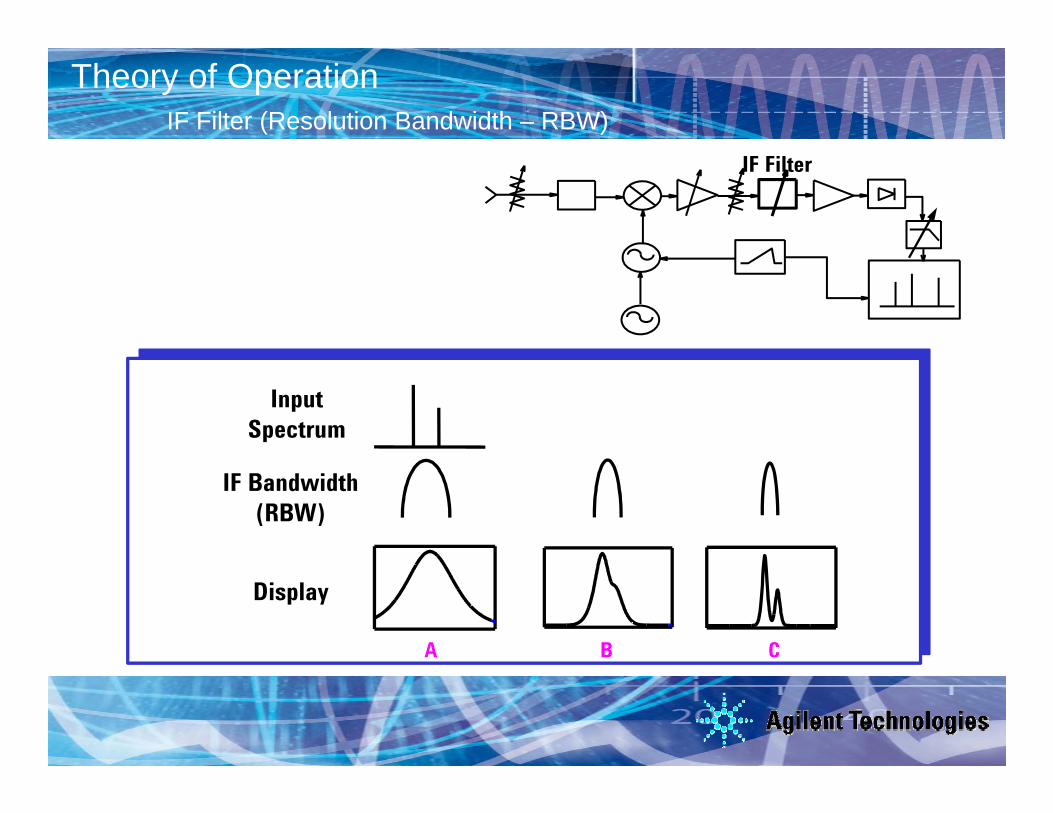
Aerospace and Defense Symposium 2007EuMw 2007 Agilent WorkshopTheory of OperationIF Filter (Resolution Bandwidth – RBW)
IF Filter
InputSpectrum
IF Bandwidth(RBW)
Display
A B C
Beyond S-Parameters© Agilent Technologies, Inc. 2007
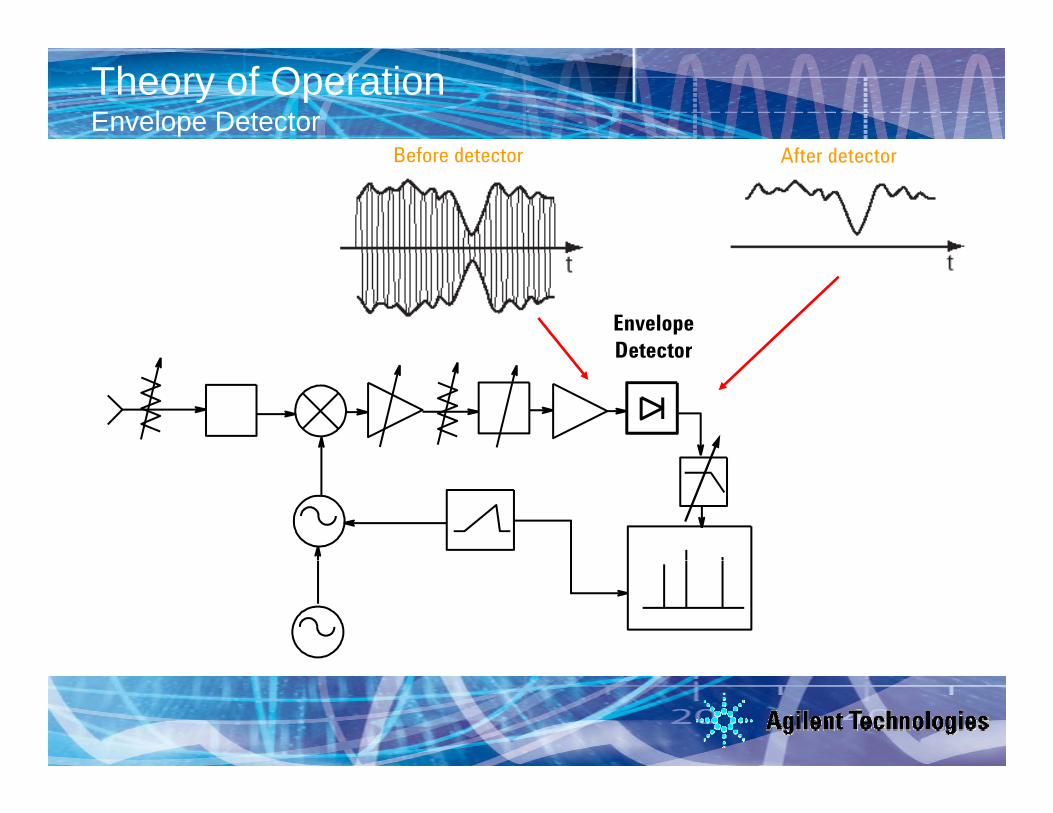
Aerospace and Defense Symposium 2007EuMw 2007 Agilent WorkshopTheory of OperationEnvelope Detector
B f d t t Aft d t tBefore detector After detector
Envelope DetectorDetector
Beyond S-Parameters© Agilent Technologies, Inc. 2007
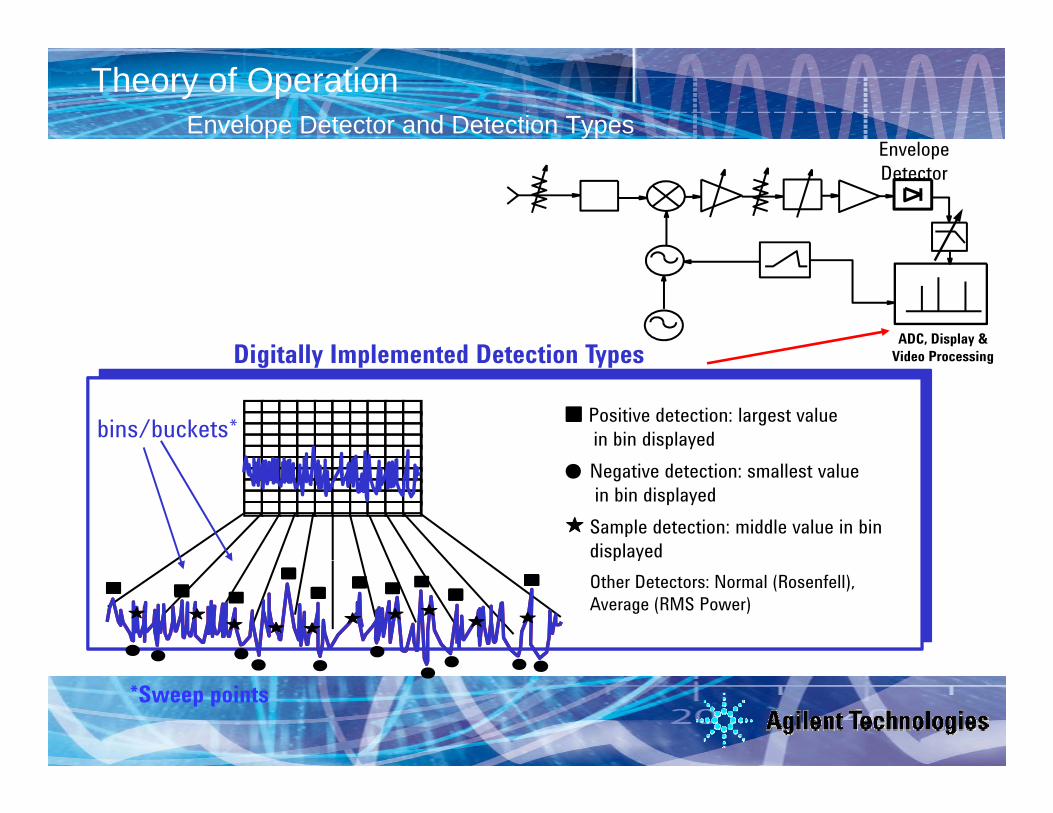
Aerospace and Defense Symposium 2007EuMw 2007 Agilent WorkshopTheory of OperationEnvelope Detector and Detection Types
Envelope Envelope Detector
Digitally Implemented Detection TypesADC, Display &
Video Processing
Positive detection: largest valuein bin displayedbins/buckets*
Digitally Implemented Detection Types Video Processing
Negative detection: smallest valuein bin displayedSample detection: middle value in bin displayedp yOther Detectors: Normal (Rosenfell), Average (RMS Power)
Beyond S-Parameters© Agilent Technologies, Inc. 2007
*Sweep points
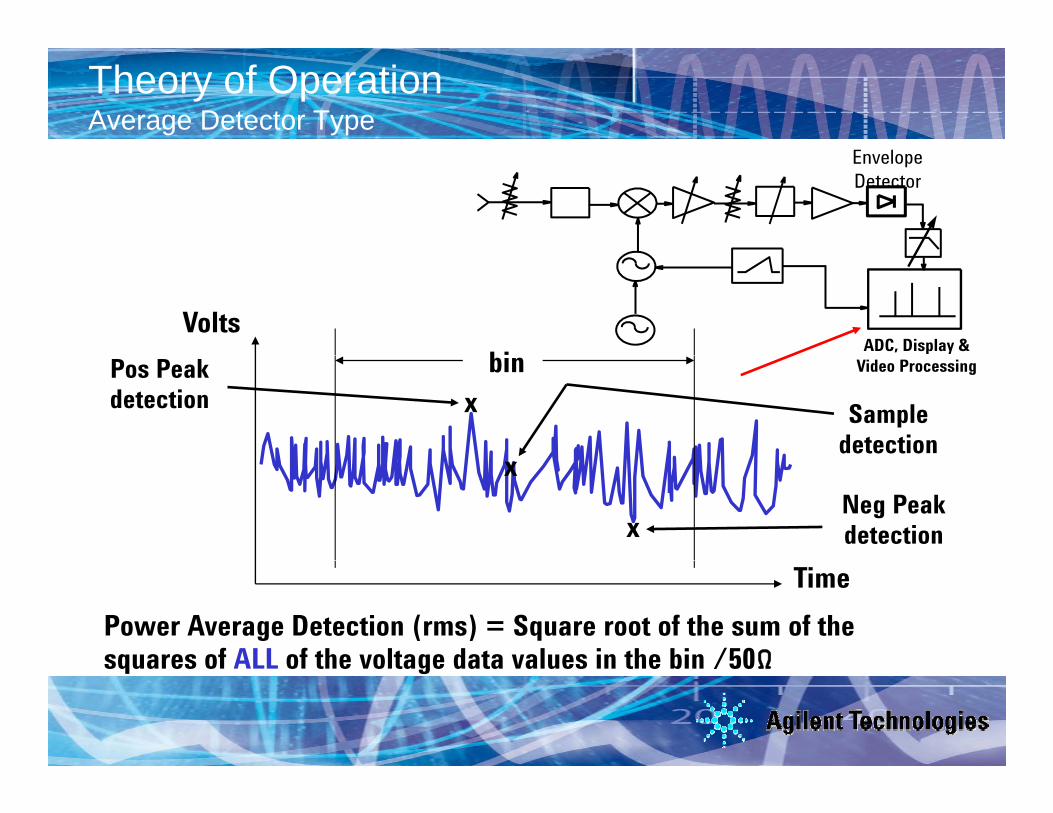
Aerospace and Defense Symposium 2007EuMw 2007 Agilent WorkshopTheory of OperationAverage Detector Type
E l Envelope Detector
Voltsbi
ADC, Display & bin
Sample detection
xPos Peak detection
Video Processing
xNeg Peak detectionx
TimePower Average Detection (rms) = Square root of the sum of the squares of ALL of the voltage data values in the bin /50Ω
Beyond S-Parameters© Agilent Technologies, Inc. 2007
squares of ALL of the voltage data values in the bin /50Ω
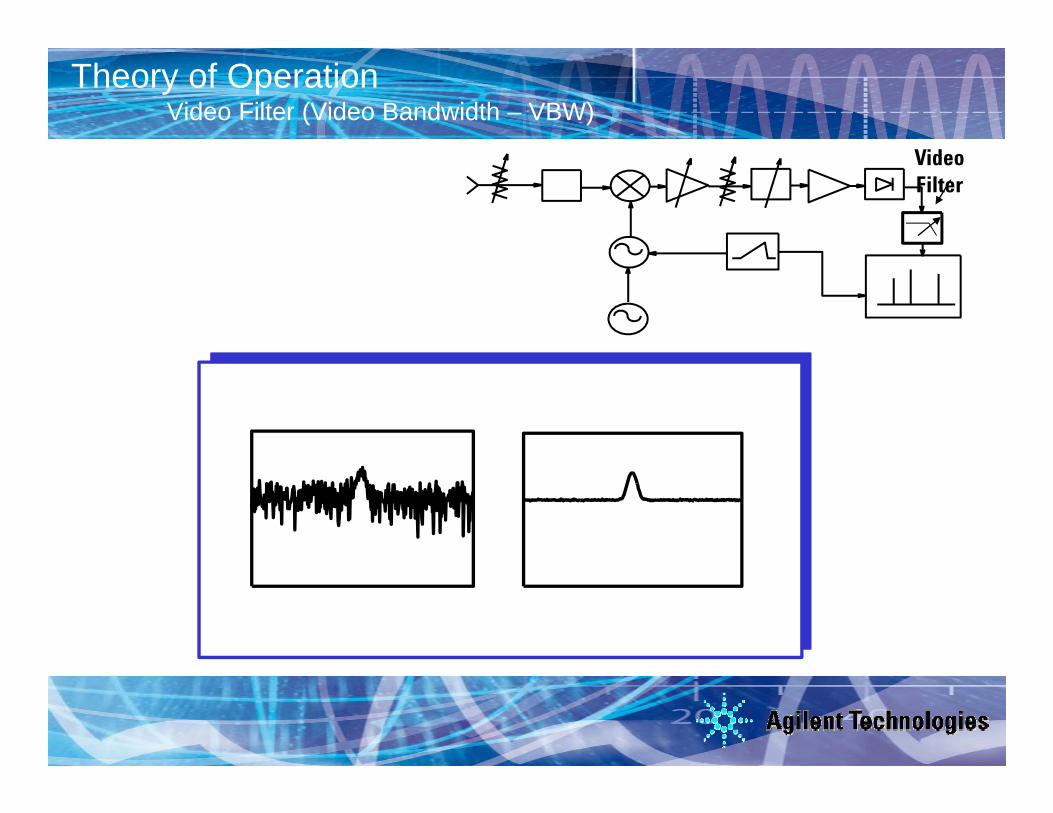
Aerospace and Defense Symposium 2007EuMw 2007 Agilent WorkshopTheory of OperationVideo Filter (Video Bandwidth – VBW)
Vid Video Filter
Beyond S-Parameters© Agilent Technologies, Inc. 2007

Aerospace and Defense Symposium 2007EuMw 2007 Agilent WorkshopTheory of OperationVideo Filter vs. Trace/Video averaging
Vid FilVideo Filter
ADC, Display & Video Processing
• Video Filter operates as the sweep progresses, sweep time may be required to slow down by the transient response of the VBW filterVBW filter.
• Trace/Video Average takes multiple sweeps, sweep time for each sweep is not affectedaffected
• Many signals give the same results with either video filtering or trace averagingTrace averaging for 1, 5, 20, and 100 sweeps, top to
bottom (trace position offset for each set of sweeps)
Beyond S-Parameters© Agilent Technologies, Inc. 2007
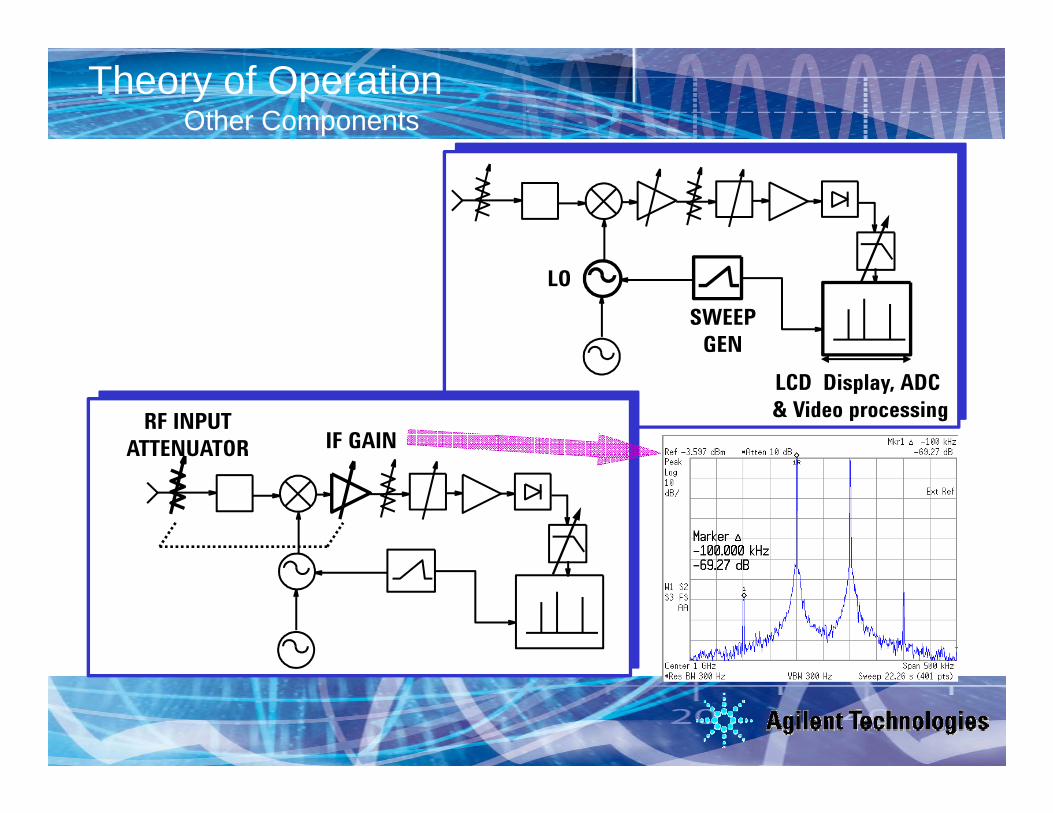
Aerospace and Defense Symposium 2007EuMw 2007 Agilent WorkshopTheory of OperationOther Components
SWEEP GEN
LO
LCD Display, ADC& Video processing
IF GAINRF INPUT
ATTENUATOR
Beyond S-Parameters© Agilent Technologies, Inc. 2007

Aerospace and Defense Symposium 2007EuMw 2007 Agilent WorkshopTheory of OperationHow it All Works Together - 3 GHz spectrum analyzer
(GHz)0 31 2
Signal Range LO Rangef s
ff sf LO- f sf LO
+f LO
0 3 61 2 4 5
input
mixerIF filter
detector
f s
3.6 6.5
3.6 GHz
f IFsweep generator Ag
LO
A
f LO
3.6(GHz)3 64 5
(GHz)0 31 2LCD display
fLO
6.5
Beyond S-Parameters© Agilent Technologies, Inc. 2007

Aerospace and Defense Symposium 2007EuMw 2007 Agilent WorkshopAgenda
• Overview• Theory of Operation• Theory of Operation• Specifications:
– Which are important and why?y
• Modern spectrum analyzer designs & capabilities» Wide Bandwidth Vector Measurements
Beyond S-Parameters© Agilent Technologies, Inc. 2007
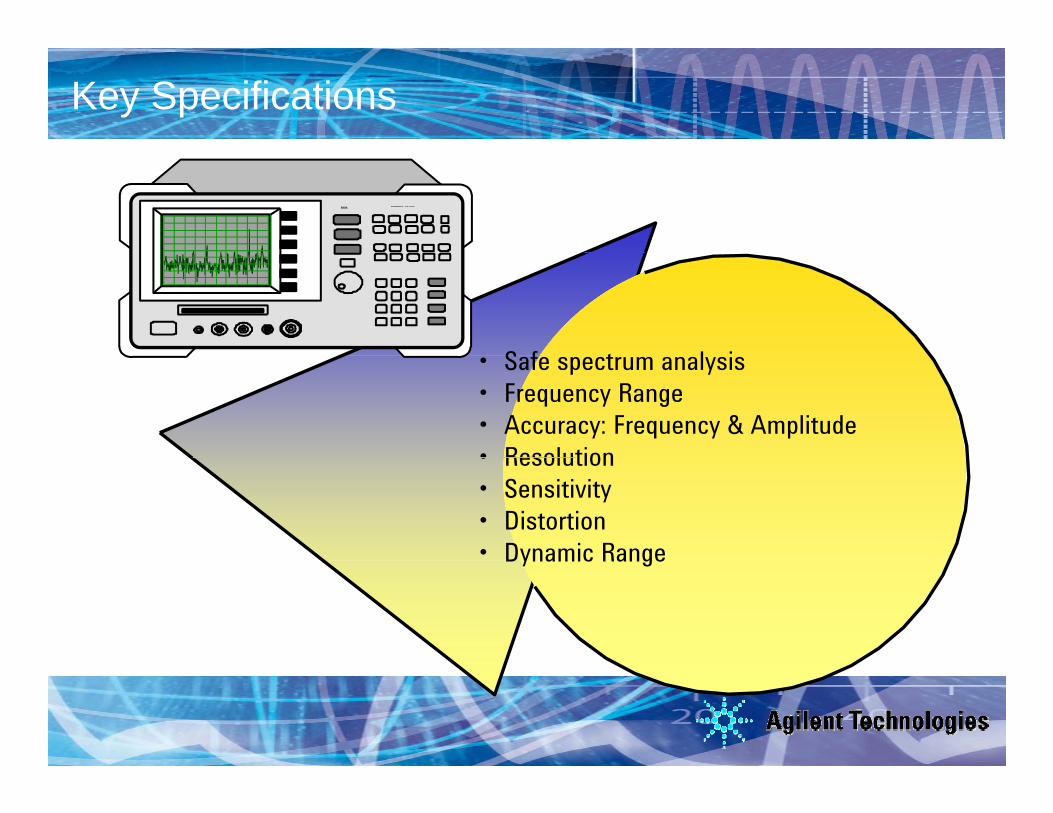
Aerospace and Defense Symposium 2007EuMw 2007 Agilent WorkshopKey Specifications
8563A SPECTRUM ANALYZER 9 kHz - 26.5 GHz
S f t l i• Safe spectrum analysis• Frequency Range• Accuracy: Frequency & Amplitude• Resolution• Resolution• Sensitivity• Distortion• Dynamic RangeDynamic Range
Beyond S-Parameters© Agilent Technologies, Inc. 2007

Aerospace and Defense Symposium 2007EuMw 2007 Agilent WorkshopSpecifications?A Definition
• Specifications describe the performance of parameters covered by the product warranty (temperature = 0 to 55°C, unless otherwise noted)otherwise noted).
• Typical values describe additional product performance information that is not covered by the product warranty It isinformation that is not covered by the product warranty. It is performance beyond specification that 80 % of the units exhibit with a 95 % confidence level over the temperature range 20 to 30° C Typical performance does not include measurement30 C. Typical performance does not include measurement uncertainty.
Nominal values indicate expected performance or describe• Nominal values indicate expected performance, or describe product performance that is useful in the application of the product, but is not covered by the product warranty.
Beyond S-Parameters© Agilent Technologies, Inc. 2007

Aerospace and Defense Symposium 2007EuMw 2007 Agilent WorkshopSpecificationsPracticing safe spectrum analysis - Safe Hookups to RF Input
•Use best practices to eliminate static discharge to the RF input!•Do not exceed the Damage Level on the RF Input!•Do not input signals with DC bias!
!!0 V DC MAX
+30dBm (1W) MAX
Beyond S-Parameters© Agilent Technologies, Inc. 2007

Aerospace and Defense Symposium 2007EuMw 2007 Agilent WorkshopSpecificationsFrequency Range
Description SpecificationsInternal Mixing
Bands• 0 3 Hz to 3.0 GHz• 1 2.85 to 6.6 GHz• 2 6.2 to 13.2 GHz• 3 12 8 to 19 2 GHz• 3 12.8 to 19.2 GHz• 4 18.7 to 26.8 GHz• 5 26.4 to 31.15 GHz
6 31 0 0 0 G• 6 31.0 to 50.0 GHz
External mixing 18 to 325 GHz
Beyond S-Parameters© Agilent Technologies, Inc. 2007

Aerospace and Defense Symposium 2007EuMw 2007 Agilent WorkshopSpecificationsAccuracy: Frequency & amplitude
Components which contribute to uncertainty are:p y
• Input mismatch (VSWR)
• RF Input attenuator (Atten. switching uncertainty)
• Mixer and input filter (frequency response)
• IF gain/attenuation (reference level accuracy)
• RBW filters (RBW switching uncertainty)
• Log amp (display scale fidelity)
• Reference oscillator (frequency accuracy)
• Calibrator (amplitude accuracy)
Beyond S-Parameters© Agilent Technologies, Inc. 2007

Aerospace and Defense Symposium 2007EuMw 2007 Agilent WorkshopSpecificationsAbsolute and relative Accuracy: Frequency & amplitude
AbsoluteAbsoluteAmplitude
in dBm
RelativeAmplitudein dB
AbsoluteFrequency
FrequencyAmpli
tude
RelativeFrequency
FrequencyA
Note: Absolute accuracy is also “relative” to the calibrator reference point
Beyond S-Parameters© Agilent Technologies, Inc. 2007
y p

Aerospace and Defense Symposium 2007EuMw 2007 Agilent WorkshopSpecificationsAccuracy: Frequency Readout Accuracy
• From the PSA Data Sheet:
Determined by Reference Accuracy
± (freq readout x freq reference error +0.25%*span + 5% of RBW + 2Hz + 0.5 x Horiz. Res.*)
RBW ErrorIF filter center frequency error
Span Accuracy Residual Error
*Horizontal resolution is span/(sweep points – 1)
Beyond S-Parameters© Agilent Technologies, Inc. 2007

Aerospace and Defense Symposium 2007EuMw 2007 Agilent WorkshopSpecificationsAccuracy: Frequency Readout Accuracy Example
Frequency: 1 GHzSpan: 400 kHzpRBW: 3 kHzSweep points: 1000
Calculation: (1x10⁹Hz) x (±1.8x10⁻⁷/Year ref. Error) = 180Hz400kHz Span x 0.25% = 1000H3kHz RBW x 5% = 150Hz2Hz + 0.5 x 400kHz/1000-1 = 202H
Total uncertainty = ±1532Hz
Utilizing internal frequency counter improves accuracy to ±180Hz
Beyond S-Parameters© Agilent Technologies, Inc. 2007
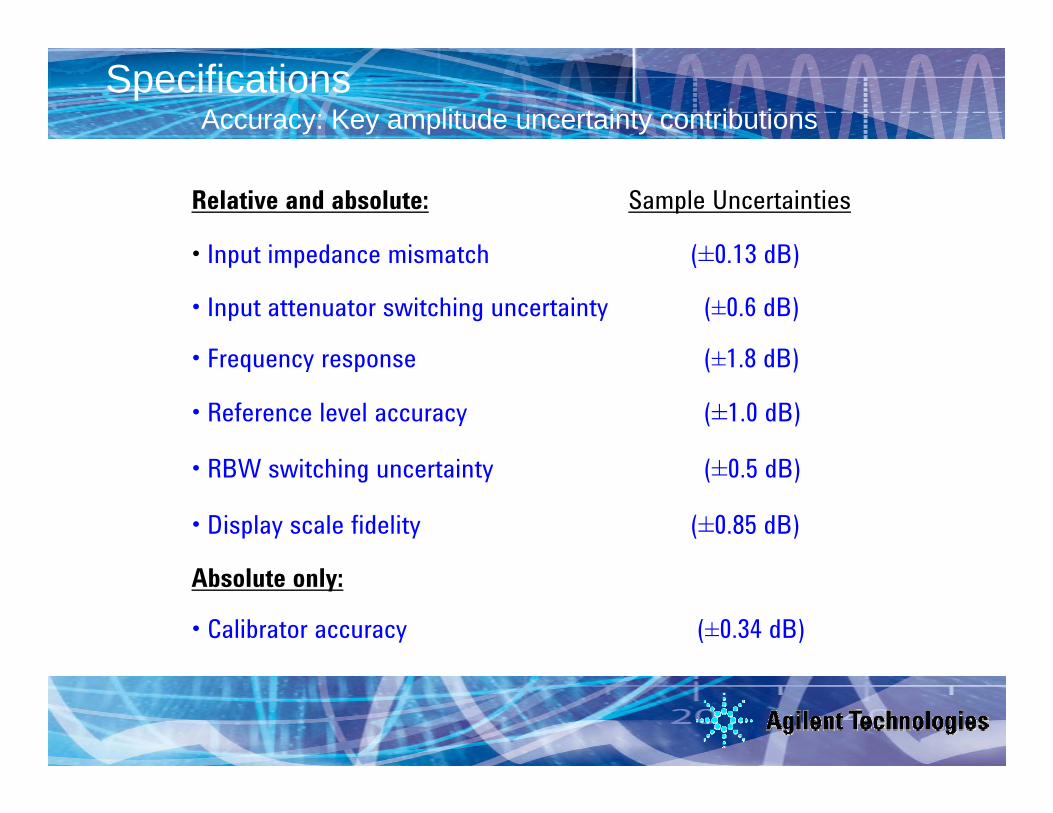
Aerospace and Defense Symposium 2007EuMw 2007 Agilent WorkshopSpecificationsAccuracy: Key amplitude uncertainty contributions
Relative and absolute: Sample Uncertainties
• Input impedance mismatch (±0 13 dB)• Input impedance mismatch (±0.13 dB)
• Input attenuator switching uncertainty (±0.6 dB)
• Frequency response (±1 8 dB)• Frequency response (±1.8 dB)
• Reference level accuracy (±1.0 dB)
• RBW switching uncertainty (±0.5 dB)
• Display scale fidelity (±0.85 dB)
Absolute only:
• Calibrator accuracy (±0.34 dB)
Beyond S-Parameters© Agilent Technologies, Inc. 2007
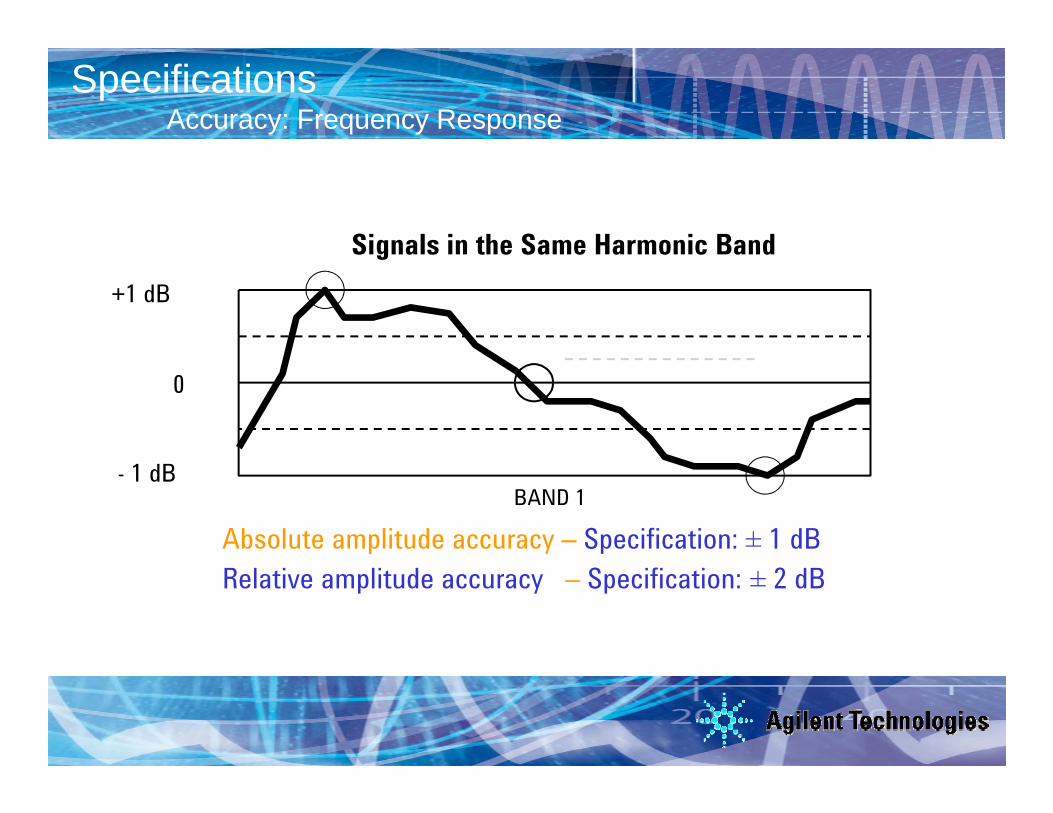
Aerospace and Defense Symposium 2007EuMw 2007 Agilent WorkshopSpecificationsAccuracy: Frequency Response
Signals in the Same Harmonic Band+1 dB
Signals in the Same Harmonic Band
0
- 1 dBBAND 1
Absolute amplitude accuracy – Specification: ± 1 dBRelative amplitude accuracy – Specification: ± 2 dB
Beyond S-Parameters© Agilent Technologies, Inc. 2007

Aerospace and Defense Symposium 2007EuMw 2007 Agilent WorkshopSpecificationsAccuracy: Display Fidelity
• Display Fidelity includes:– Log Amp Fidelity– Envelope Detector Linearity– Digitizing Circuit Linearity
• Display fidelity error applies when elity
sp ay de ty e o app es esignals are not at the same reference level amplitude when measured
• In the past, technique for best ispl
ay F
ide
accuracy was to move each measured signal to the reference line, eliminating display fidelity error.
Di
Beyond S-Parameters© Agilent Technologies, Inc. 2007

Aerospace and Defense Symposium 2007EuMw 2007 Agilent WorkshopSpecificationsAmplitude Accuracy: Reference Level Switching
• Uncertainty applies when changing the Ref. Level
• Also called IF Gain Uncertainty• Decision: Do I change the
reference level or live with the display fidelity uncertainty in my measurements?measurements?
Beyond S-Parameters© Agilent Technologies, Inc. 2007
Aerospace and Defense Symposium 2007EuMw 2007 Agilent WorkshopSpecificationsAmplitude Accuracy - Summary
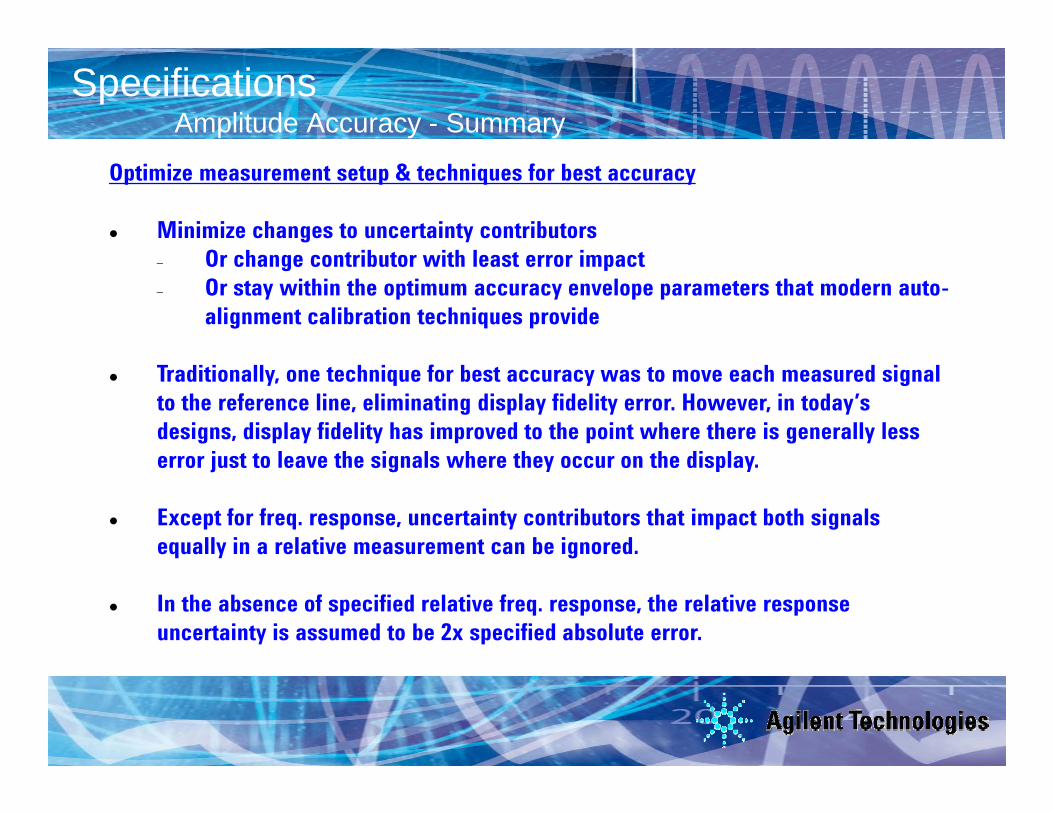
Optimize measurement setup & techniques for best accuracy
Minimize changes to uncertainty contributors O h t ib t ith l t i t– Or change contributor with least error impact
– Or stay within the optimum accuracy envelope parameters that modern auto-alignment calibration techniques provide
Traditionally, one technique for best accuracy was to move each measured signal to the reference line, eliminating display fidelity error. However, in today’s designs, display fidelity has improved to the point where there is generally less error just to leave the signals where they occur on the displayerror just to leave the signals where they occur on the display.
Except for freq. response, uncertainty contributors that impact both signals equally in a relative measurement can be ignored.
In the absence of specified relative freq. response, the relative response uncertainty is assumed to be 2x specified absolute error.
Beyond S-Parameters© Agilent Technologies, Inc. 2007
Aerospace and Defense Symposium 2007EuMw 2007 Agilent WorkshopSpecificationsResolution
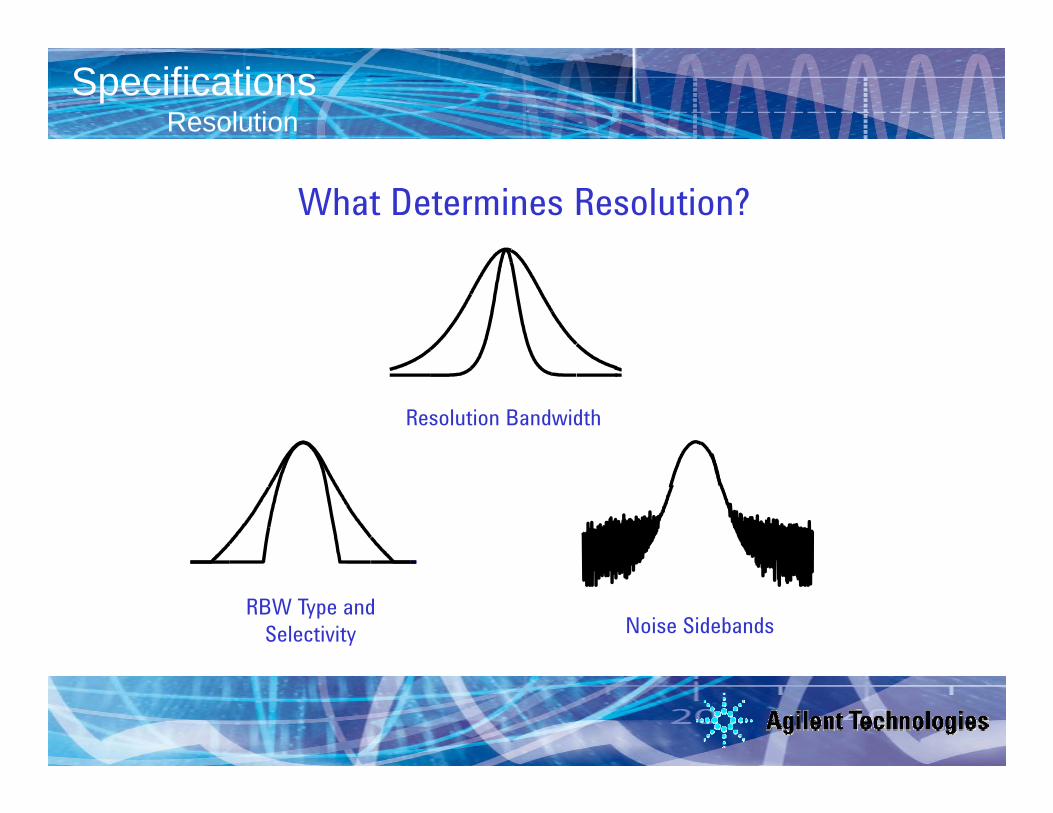
What Determines Resolution?
Resolution Bandwidth
Noise SidebandsRBW Type and
Selectivity
Beyond S-Parameters© Agilent Technologies, Inc. 2007
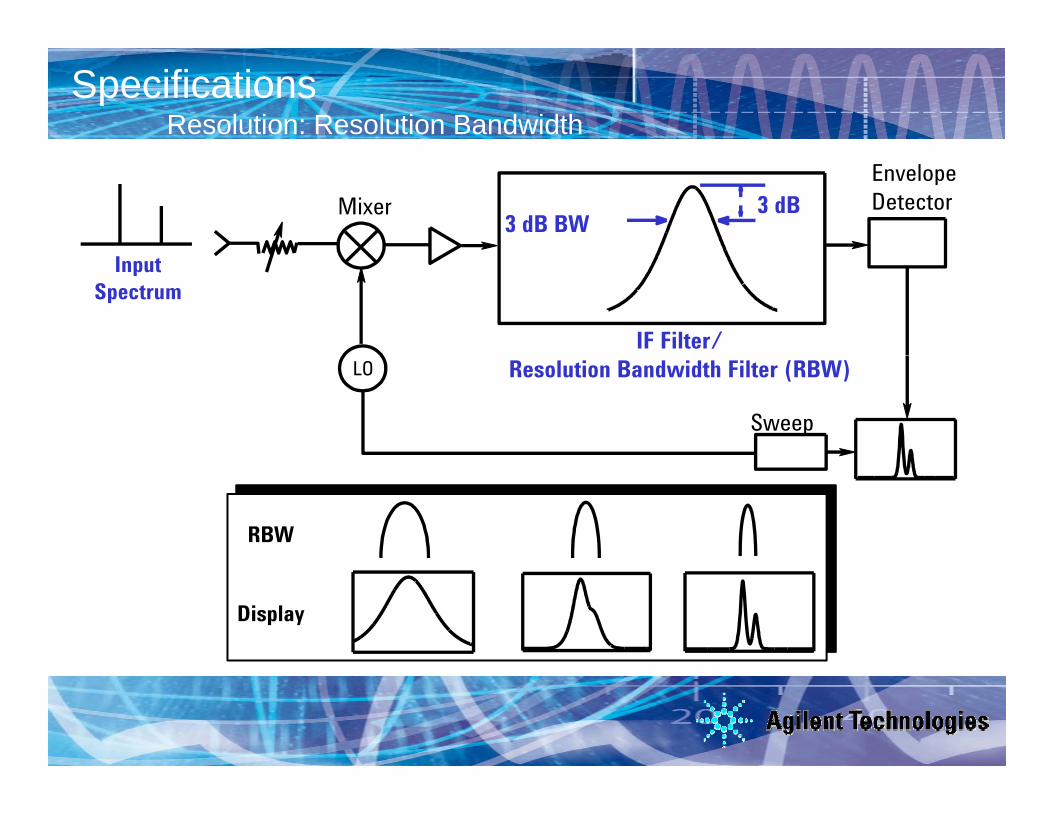
Aerospace and Defense Symposium 2007EuMw 2007 Agilent WorkshopSpecificationsResolution: Resolution Bandwidth
3 dB3 dB BW
MixerEnvelope Detector
IF Filter/
InputSpectrum
LO Resolution Bandwidth Filter (RBW)
Sweep
RBW
Display
Beyond S-Parameters© Agilent Technologies, Inc. 2007
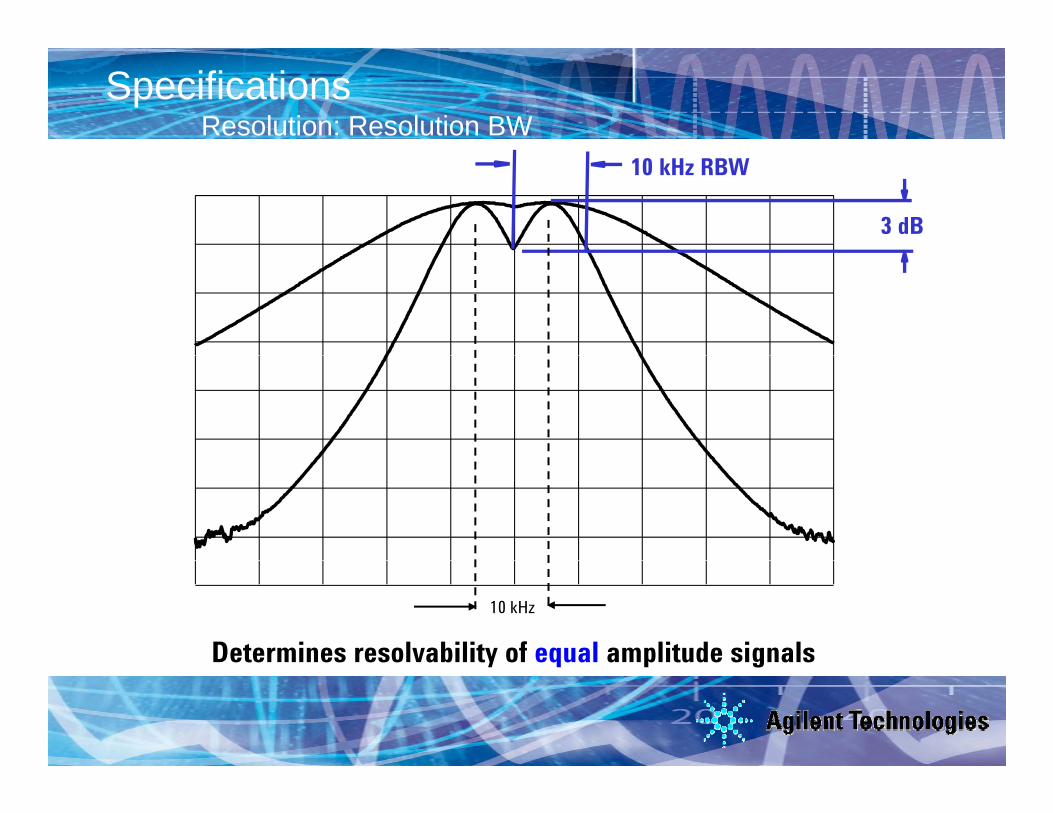
Aerospace and Defense Symposium 2007EuMw 2007 Agilent WorkshopSpecificationsResolution: Resolution BW
3 dB
10 kHz RBW
10 kHz
Determines resolvability of equal amplitude signals
Beyond S-Parameters© Agilent Technologies, Inc. 2007
y q p g
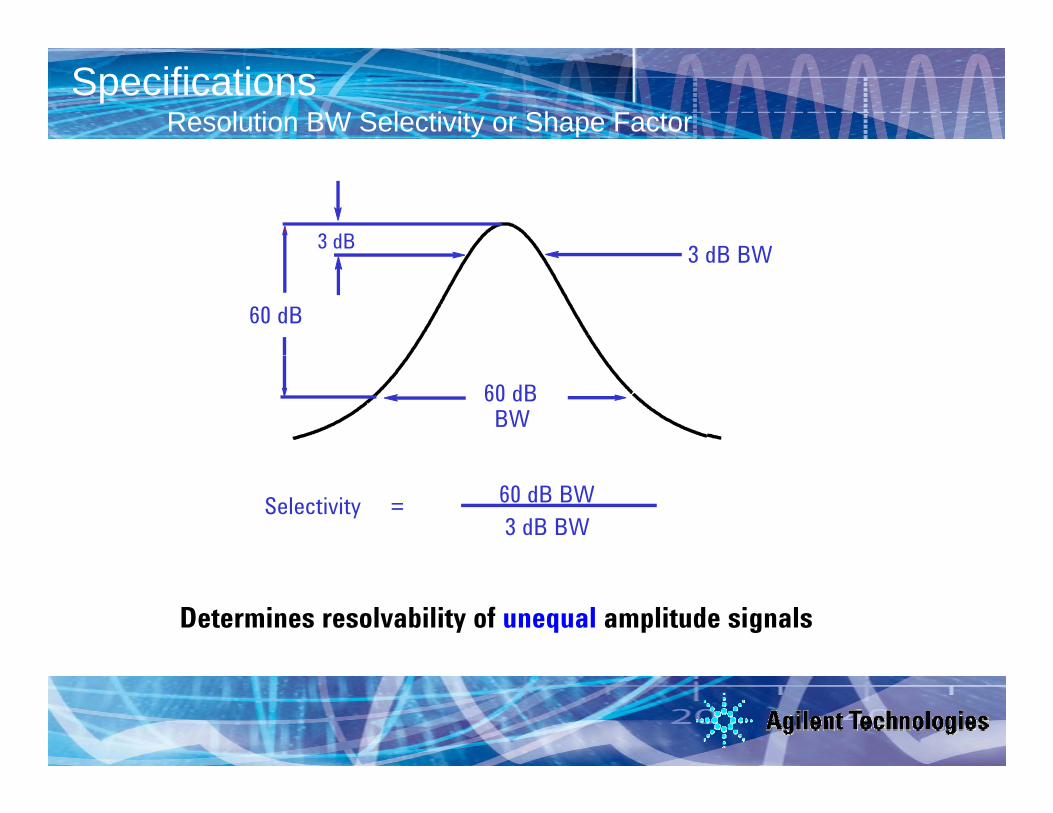
Aerospace and Defense Symposium 2007EuMw 2007 Agilent WorkshopSpecificationsResolution BW Selectivity or Shape Factor
3 dB 3 dB BW
60 dB
3 dB BW
60 dBBW
60 dB BW3 dB BW
Selectivity =
Determines resolvability of unequal amplitude signals
Beyond S-Parameters© Agilent Technologies, Inc. 2007

Aerospace and Defense Symposium 2007EuMw 2007 Agilent WorkshopSpecificationsResolution BW Selectivity or Shape Factor
RBW = 10 kHzRBW = 1 kHzSelectivity 15:1
3 dB
distortion products
7.5 kHz
60 dB BW = 15 kHz
60 dB
10 kHz10 kHz
Beyond S-Parameters© Agilent Technologies, Inc. 2007

Aerospace and Defense Symposium 2007EuMw 2007 Agilent WorkshopSpecificationsResolution: RBW Type and Selectivity
Typical SelectivityAnalog 15:1Digital ≤5:1
ANALOG FILTER
Digital ≤5:1
DIGITAL FILTER
SPAN 3 kHzRES BW 100 Hz
Beyond S-Parameters© Agilent Technologies, Inc. 2007

Aerospace and Defense Symposium 2007EuMw 2007 Agilent WorkshopSpecificationsResolution: Noise Sidebands
Phase Noise
Noise Sidebands can prevent resolution of unequal signals
Beyond S-Parameters© Agilent Technologies, Inc. 2007
resolution of unequal signals

Aerospace and Defense Symposium 2007EuMw 2007 Agilent WorkshopSpecificationsResolution: RBW Determines Sweep Time
Meas Uncal
Swept too fast
Penalty For Sweeping Too FastIs An Uncalibrated Display
Beyond S-Parameters© Agilent Technologies, Inc. 2007
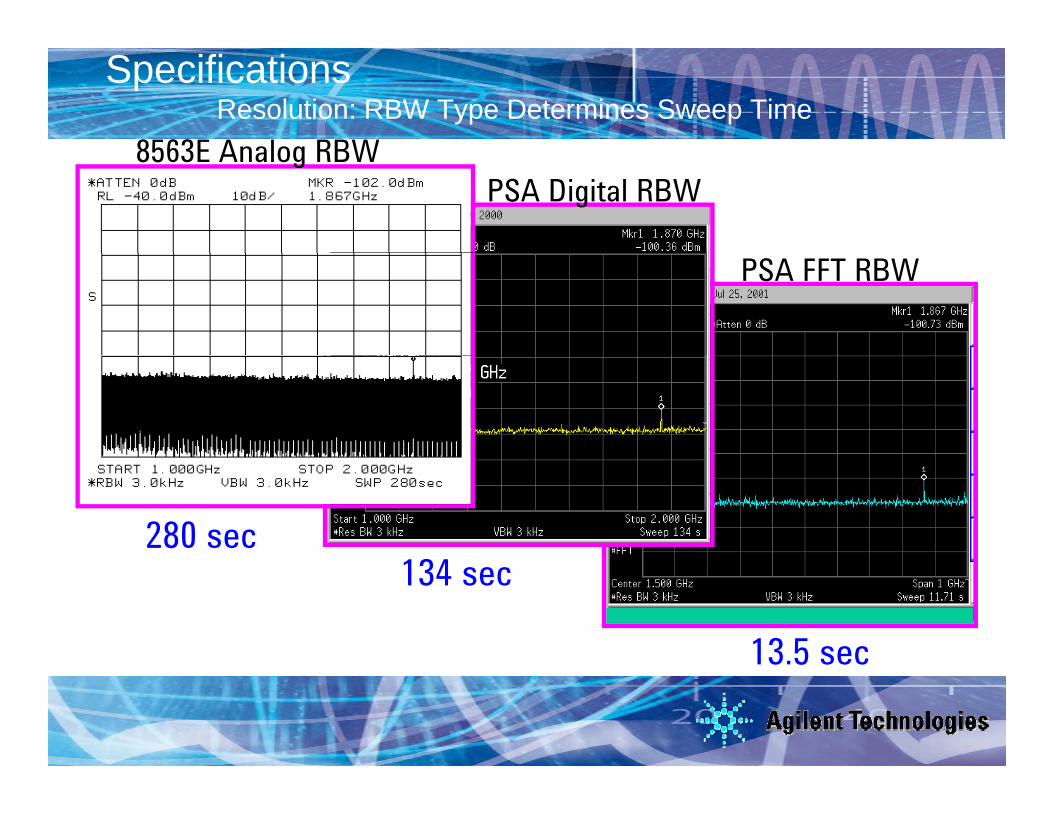
Aerospace and Defense Symposium 2007EuMw 2007 Agilent WorkshopSpecificationsResolution: RBW Type Determines Sweep Time
8563E Analog RBW8563E Analog RBWPSA Digital RBW
PSA FFT RBW
280 sec134 134 sec
13.5 sec
Beyond S-Parameters© Agilent Technologies, Inc. 2007
13.5 sec

Aerospace and Defense Symposium 2007EuMw 2007 Agilent WorkshopSpecificationsSensitivity/DANL
MixerRF
Input
Detector
InputRES BW
Filter
LO
Sweep
yA Spectrum Analyzer Generates and Amplifies Noise Just
Like Any Active Circuit
Beyond S-Parameters© Agilent Technologies, Inc. 2007
yy
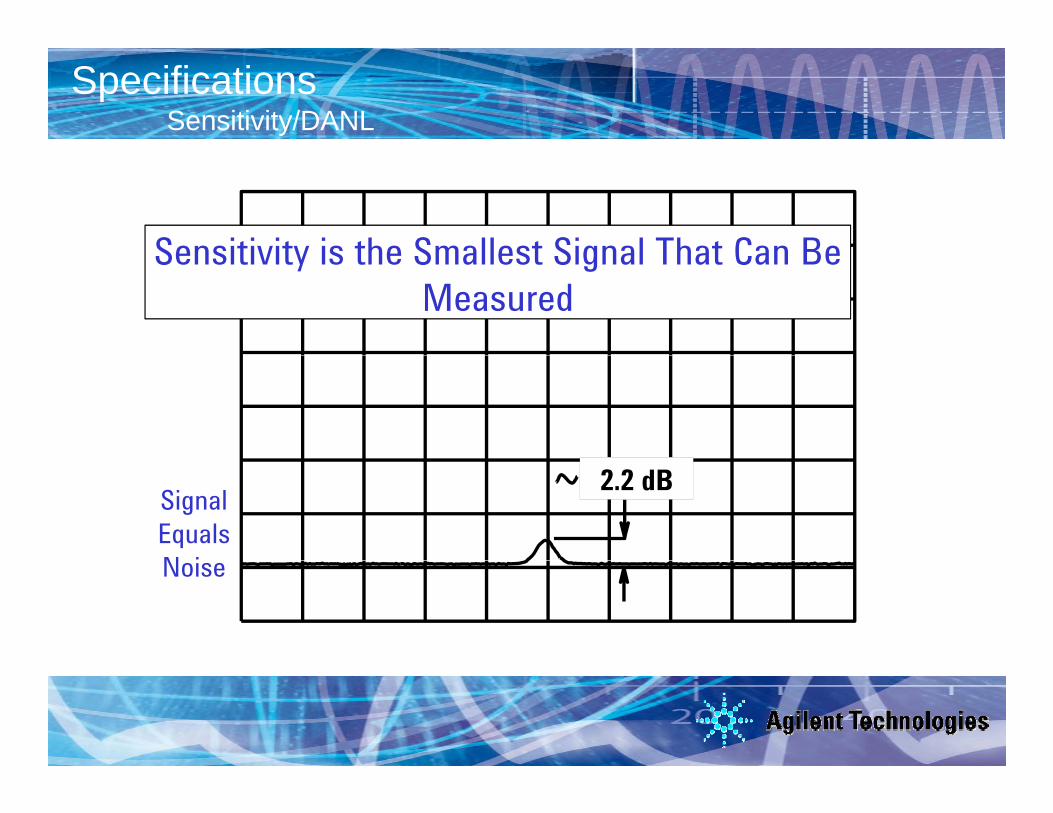
Aerospace and Defense Symposium 2007EuMw 2007 Agilent WorkshopSpecificationsSensitivity/DANL
Sensitivity is the Smallest Signal That Can Be Sensitivity is the Smallest Signal That Can Be Sensitivity is the Smallest Signal That Can Be Measured
SignalEqualsN i
2.2 dB
Noise
Beyond S-Parameters© Agilent Technologies, Inc. 2007
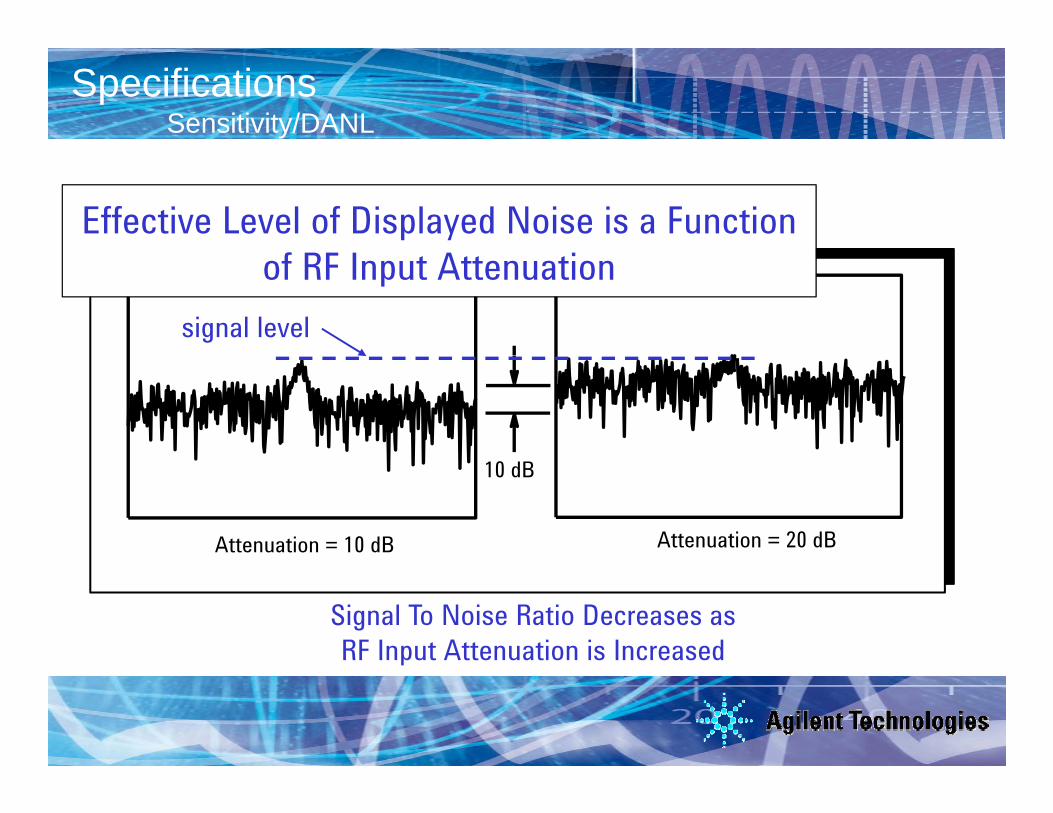
Aerospace and Defense Symposium 2007EuMw 2007 Agilent WorkshopSpecificationsSensitivity/DANL
Effective Level of Displayed Noise is a Function f RF I A i
signal level
of RF Input Attenuation
10 dB
Attenuation = 10 dB Attenuation = 20 dB
Signal To Noise Ratio Decreases as RF Input Attenuation is Increased
Beyond S-Parameters© Agilent Technologies, Inc. 2007
p

Aerospace and Defense Symposium 2007EuMw 2007 Agilent WorkshopSpecificationsSensitivity/DANL: IF Filter(RBW)
Displayed Noise is a Function of IF Filter
100 kHz RBW
Bandwidth
100 kHz RBW
10 kHz RBW
1 kHz RBW
10 dB
10 dB
Decreased BW = Decreased Noise
Beyond S-Parameters© Agilent Technologies, Inc. 2007

Aerospace and Defense Symposium 2007EuMw 2007 Agilent WorkshopSpecificationsSensitivity/DANL: Video BW filter (or Trace Averaging)
gVideo BW or Trace Averaging Smoothes Noise for Easier Identification of Low Level Signals
Beyond S-Parameters© Agilent Technologies, Inc. 2007
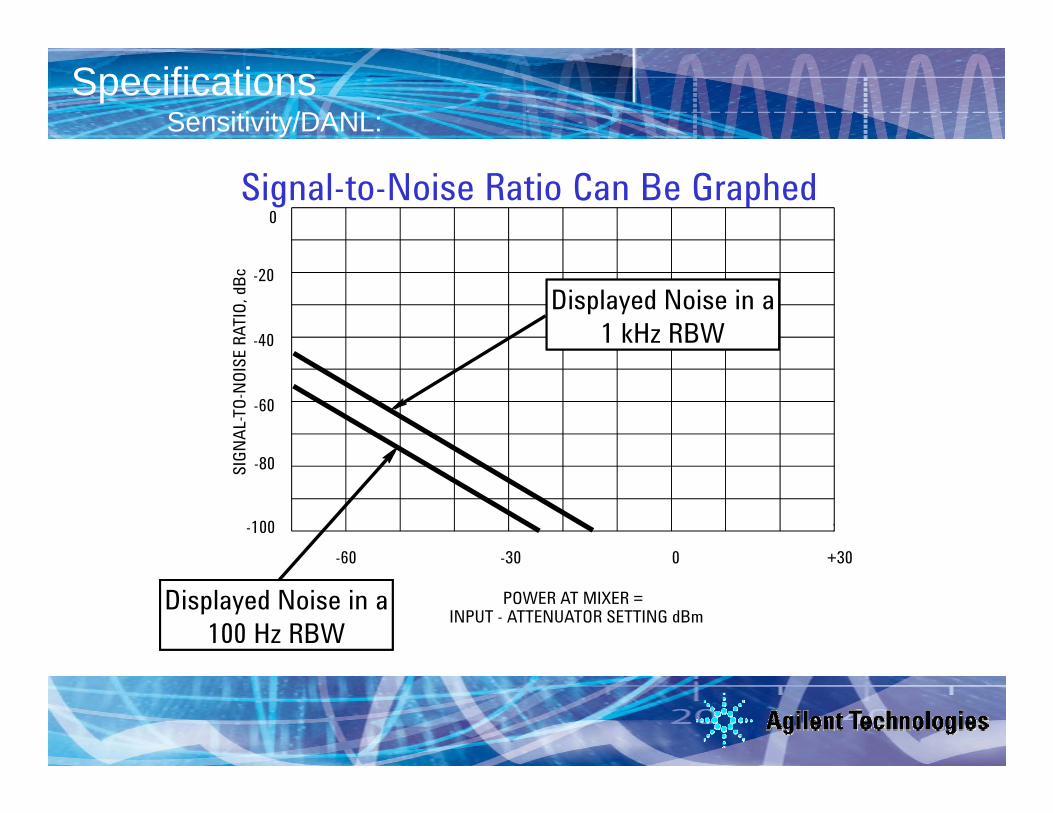
Aerospace and Defense Symposium 2007EuMw 2007 Agilent WorkshopSpecificationsSensitivity/DANL:
0.
Signal-to-Noise Ratio Can Be GraphedE
RATI
O, d
Bc -20
-40
Displayed Noise in a Displayed Noise in a 1 kHz RBW
GNAL
-TO-
NOIS
E
-60
80SIG -80
-100-60 -30 0 +30
POWER AT MIXER =INPUT - ATTENUATOR SETTING dBm
60 30 0 +30
Displayed Noise in a Displayed Noise in a 100 Hz RBW
Beyond S-Parameters© Agilent Technologies, Inc. 2007

Aerospace and Defense Symposium 2007EuMw 2007 Agilent WorkshopSpecificationsSensitivity/DANL: Summary
For Best Sensitivity Use:
Narrowest Resolution BW
Minimum RF Input Attenuationp
S ffi i A i ( id )Sufficient Averaging (video or trace)
Beyond S-Parameters© Agilent Technologies, Inc. 2007

Aerospace and Defense Symposium 2007EuMw 2007 Agilent WorkshopSpecificationsDistortion
Mixers Generate Distortion
Frequency TranslatedSignals
Resultant
Signal ToBe Measured
Mixer GeneratedDistortion
Beyond S-Parameters© Agilent Technologies, Inc. 2007
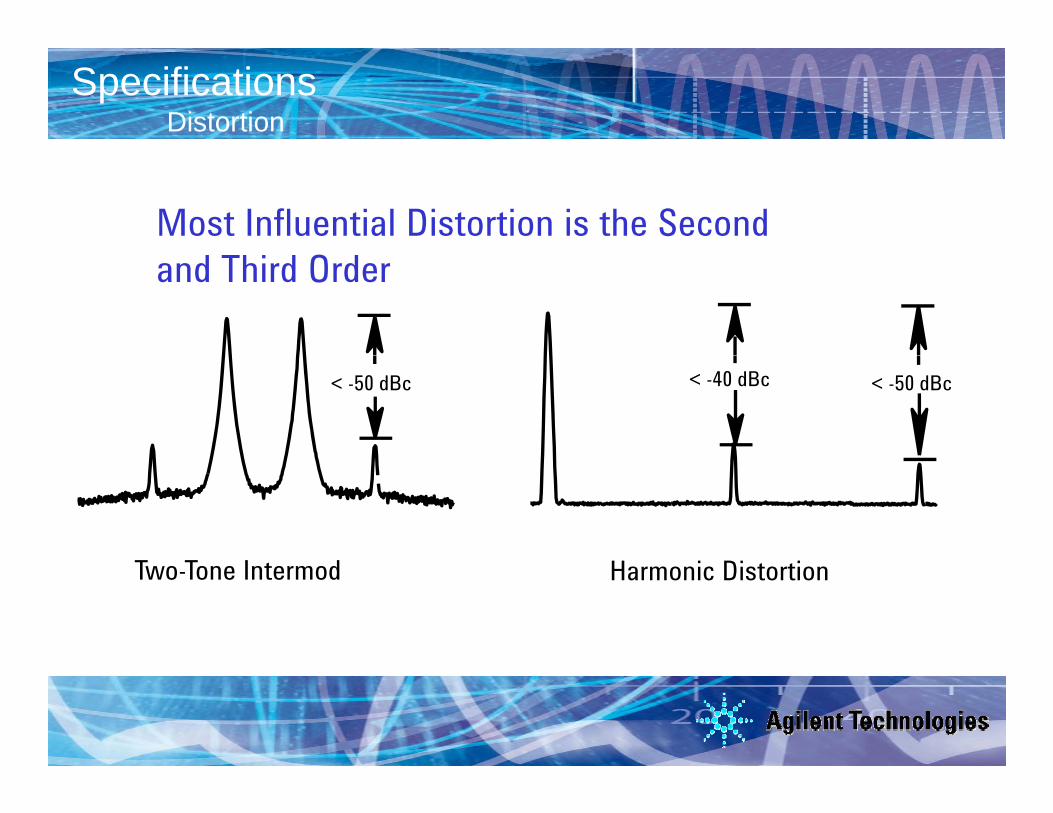
Aerospace and Defense Symposium 2007EuMw 2007 Agilent WorkshopSpecificationsDistortion
Most Influential Distortion is the Second and Third Order
< -50 dBc < -50 dBc< -40 dBc
T T I dTwo-Tone Intermod Harmonic Distortion
Beyond S-Parameters© Agilent Technologies, Inc. 2007

Aerospace and Defense Symposium 2007EuMw 2007 Agilent WorkshopSpecificationsDistortion
Distortion Products Increase as a Function of Fundamental's Power
Power33
Third-order distortion
f f2f - f1 2 1 2
Powerin dB
2 12f - f
Third order distortion
Second-order distortion
3Power
2
Two-Tone Intermod
Second Order: 2 dB/dB of Fundamental
f 2f 3f
Powerin dB
Harmonic Distortion
Second Order: 2 dB/dB of FundamentalThird Order: 3 dB/dB of Fundamental
Beyond S-Parameters© Agilent Technologies, Inc. 2007
Harmonic Distortion
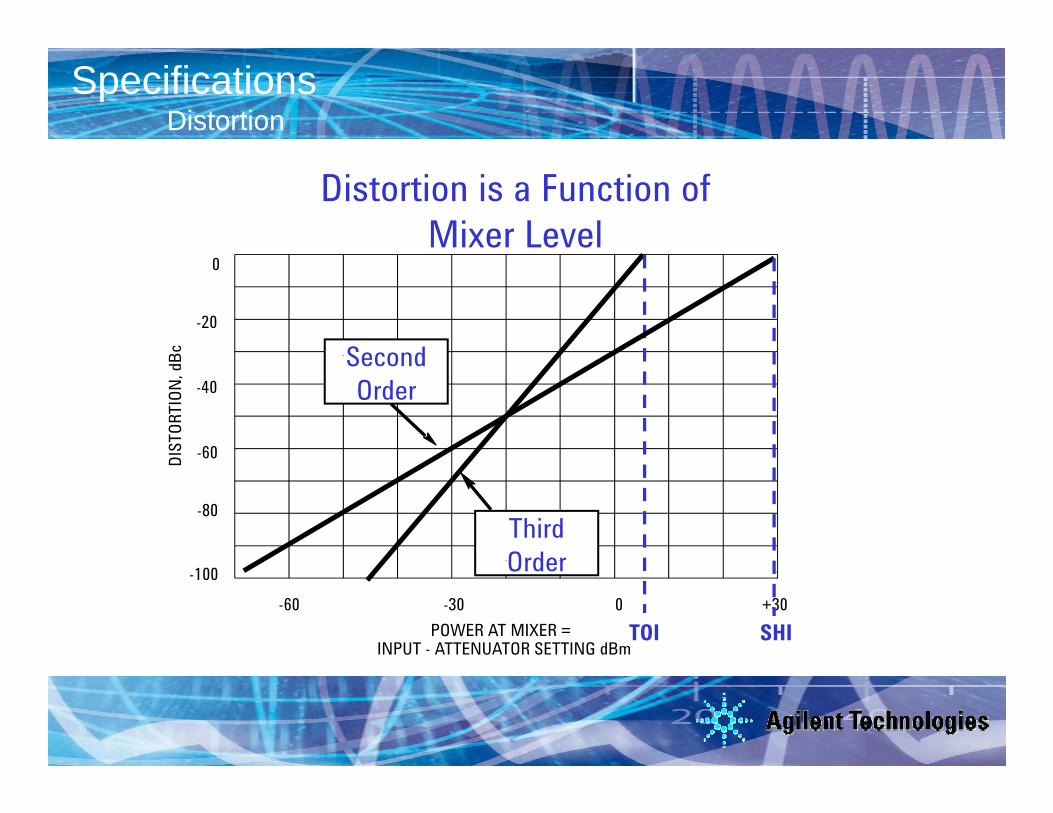
Aerospace and Defense Symposium 2007EuMw 2007 Agilent WorkshopSpecificationsDistortion
Distortion is a Function of Mixer Level
Bc
0
-20
Second
DIST
ORTI
ON, d
B
-40
-60
SecondOrder
D 60
-80ThirdOrder
POWER AT MIXER =INPUT - ATTENUATOR SETTING dBm
-100-60 -30 0 +30
TOI
Order
SHI
Beyond S-Parameters© Agilent Technologies, Inc. 2007
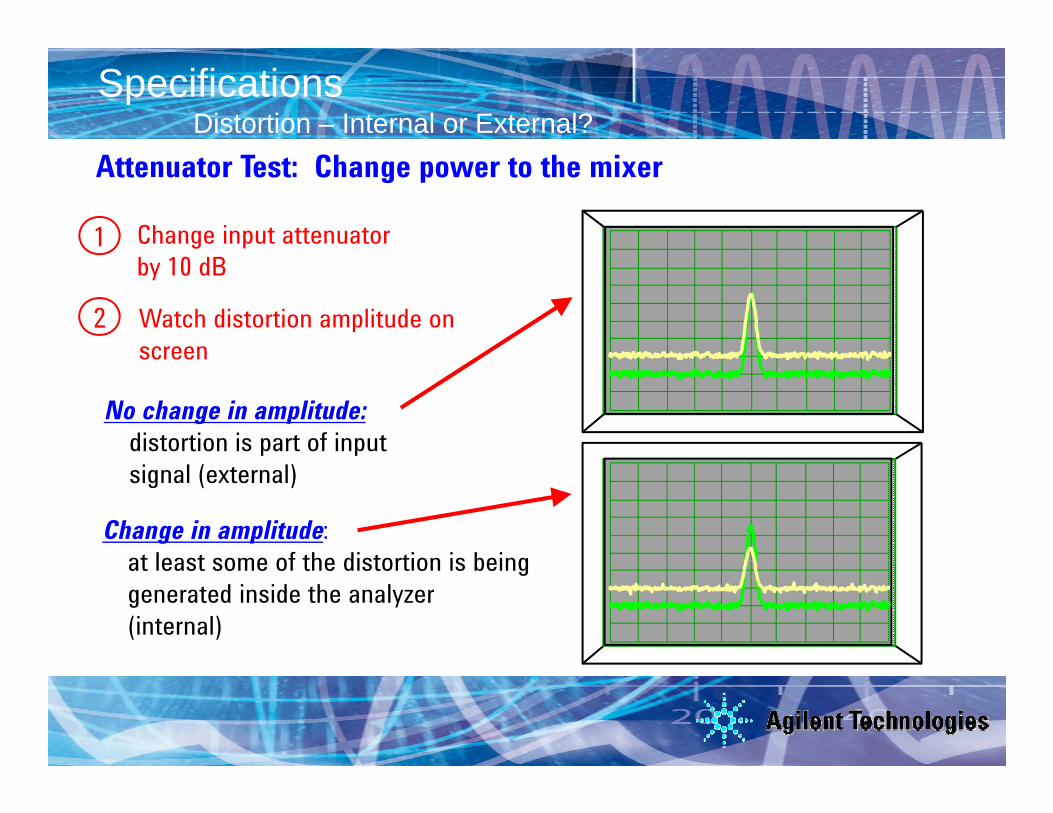
Aerospace and Defense Symposium 2007EuMw 2007 Agilent WorkshopSpecificationsDistortion – Internal or External?
Attenuator Test: Change power to the mixer
Change input attenuator1by 10 dB
Watch distortion amplitude on screen
2
No change in amplitude:distortion is part of input
screen
signal (external)
Change in amplitude:at least some of the distortion is being at least some of the distortion is being generated inside the analyzer (internal)
Beyond S-Parameters© Agilent Technologies, Inc. 2007
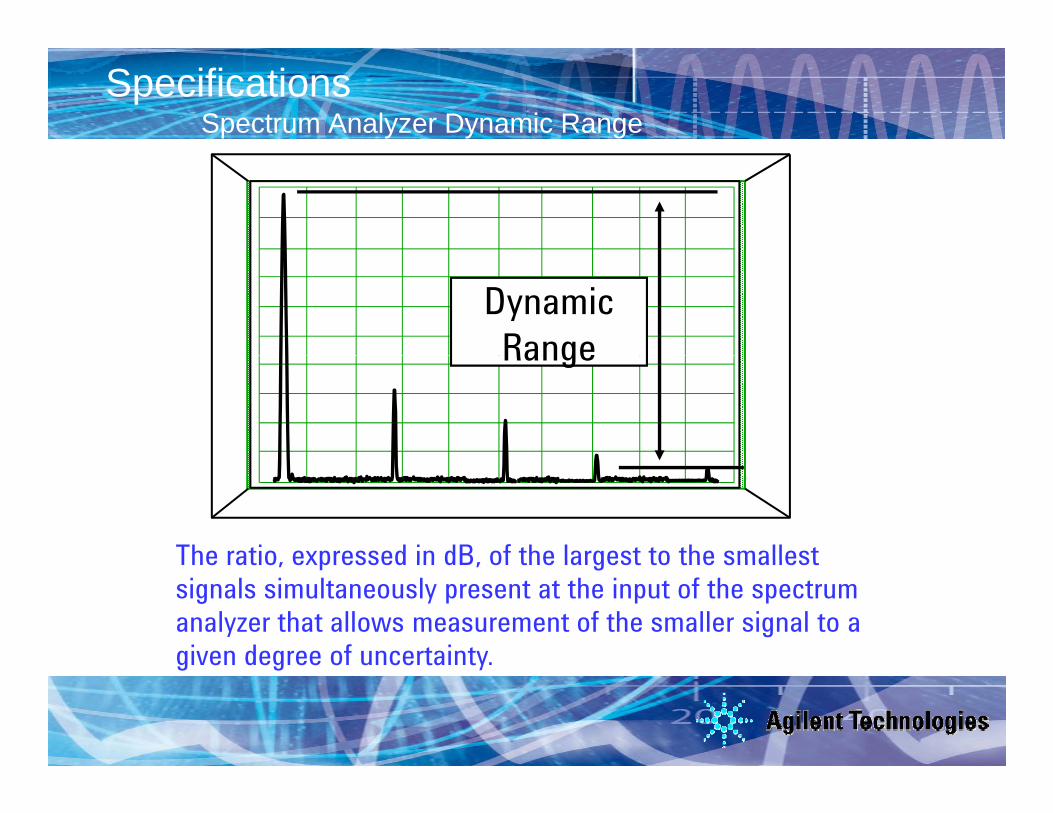
Aerospace and Defense Symposium 2007EuMw 2007 Agilent WorkshopSpecificationsSpectrum Analyzer Dynamic Range
DynamicRangegRange
The ratio expressed in dB of the largest to the smallest The ratio, expressed in dB, of the largest to the smallest signals simultaneously present at the input of the spectrum analyzer that allows measurement of the smaller signal to a given degree of uncertainty.
Beyond S-Parameters© Agilent Technologies, Inc. 2007
given degree of uncertainty.

Aerospace and Defense Symposium 2007EuMw 2007 Agilent WorkshopSpecificationsDynamic Range
Dynamic Range Can Be Presented Graphically..Maximum 2nd Order
RATI
O, d
Bc -20
40
Dynamic Range
Maximum 3rd Order Dynamic Range
NAL-T
O-NO
ISE
R -40
-60
SIGN -80
-100
POWER AT MIXER =INPUT - ATTENUATOR SETTING dBm
-60 -30 0 +30TOI
Optimum Mixer Levels
SOI
Beyond S-Parameters© Agilent Technologies, Inc. 2007
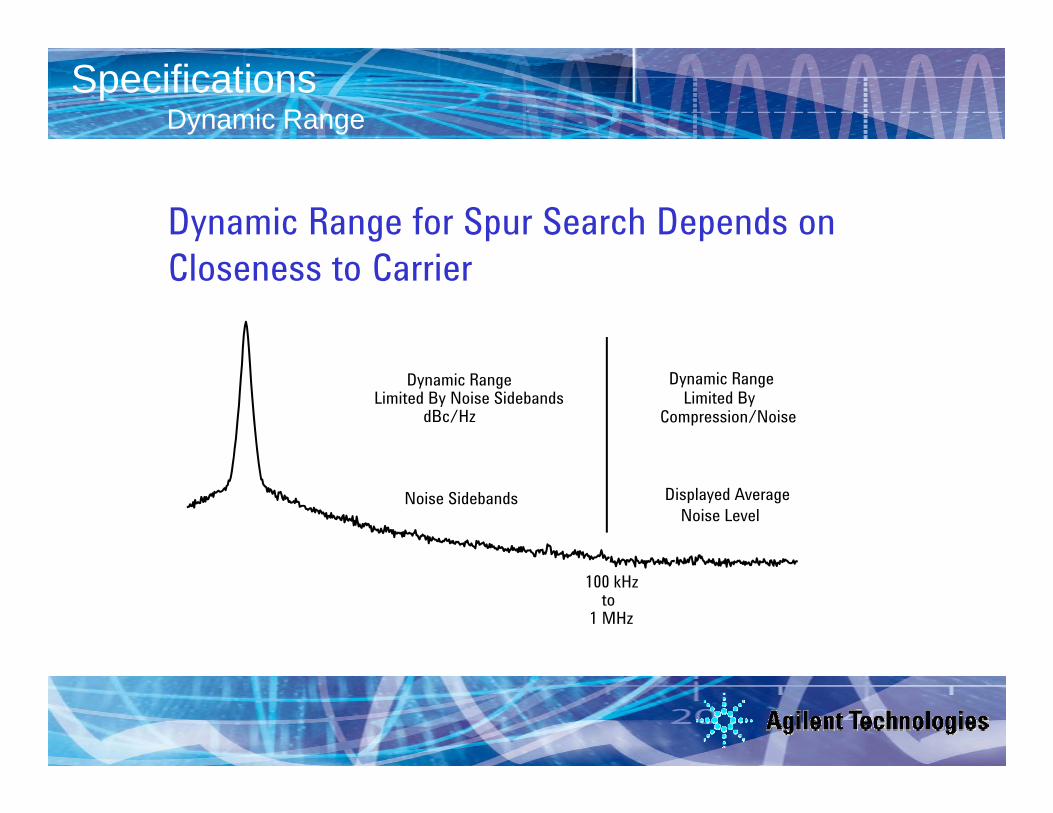
Aerospace and Defense Symposium 2007EuMw 2007 Agilent WorkshopSpecificationsDynamic Range
Dynamic Range for Spur Search Depends on Closeness to Carrier
Dynamic Range Limited By Noise Sidebands
dBc/Hz
Dynamic Range
Compression/NoiseLimited By
Noise Sidebands Displayed AverageNoise Level
100 kHzto
1 MHz
Beyond S-Parameters© Agilent Technologies, Inc. 2007

Aerospace and Defense Symposium 2007EuMw 2007 Agilent WorkshopSpecificationsDynamic Range – Distortion, Noise Floor, LO phase noise
Dynamic Range is actually:
Maximum dynamic range calculation
Calculated from distortion products and sensitivity/DANL
bounded by
-dBc/Hz Phase Noise sidebands @ close-in offset frequencies
y
Determined by the phase noise specifications of the SA
Beyond S-Parameters© Agilent Technologies, Inc. 2007

Aerospace and Defense Symposium 2007EuMw 2007 Agilent WorkshopSpecificationsDynamic Range vs. Measurement Range
+30 dBm MAXIMUM POWER LEVEL
+3 dBm MIXER COMPRESSION
DISPLAY RANGE100 dB @ 10 dB/Div
-41 dBm
51 dBm SECOND ORDER DISTORTION
THIRD-ORDER DISTORTIONMEASUREMENT
RANGE(Dynamic Range)
100 dB @ 10 dB/Div(200 dB @ 20dB/Div)
-51 dBm SECOND-ORDER DISTORTIONSIGNAL/NOISE
RANGE157 dB
RANGE198 dB
0 dBc NOISE SIDEBANDSSIGNAL /3rd ORDER(Dynamic Range)
(Dynamic Range)
DISTORTION113 dB range SIGNAL/ 2nd ORDER
DISTORTION103 dB RANGE
SIGNAL/NOISE SIDEBANDS
-116 dBc @ 10kHz OFFSETINCREASING
RBW OR
(Dynamic Range)
-154 dBm (1 Hz BW & 0 dB ATTENUATION) MINIMUM NOISE FLOOR (DANL)
116 dBc @ 10kHz OFFSET
-168 dBm with preamp
RBW ORATTENUATION
Beyond S-Parameters© Agilent Technologies, Inc. 2007
p p

Aerospace and Defense Symposium 2007EuMw 2007 Agilent WorkshopSpecificationsSummary: Optimizing Dynamic Range
•What settings provide the best sensitivity?•Narrowest resolution bandwidthNarrowest resolution bandwidth•Minimal input attenuation•Sufficient averaging
•How do you test for analyzer distortion?•Increase the input attenuation and look for signal amplitude changes•Then set the attenuator at the lowest setting without amplitude change
•What determines dynamic range?A l di t ti i l l d id b d/ h i•Analyzer distortion, noise level, and sideband/phase noise
Beyond S-Parameters© Agilent Technologies, Inc. 2007

Aerospace and Defense Symposium 2007EuMw 2007 Agilent WorkshopAgenda
• IntroductionO i• Overview
• Theory of OperationSpecifications• Specifications
• Modern spectrum analyzer designs & capabilities– Wide Analysis Bandwidth MeasurementsWide Analysis Bandwidth Measurements
Beyond S-Parameters© Agilent Technologies, Inc. 2007

Aerospace and Defense Symposium 2007EuMw 2007 Agilent WorkshopModern Spectrum Analyzer Block Diagram
Analog IFFilter
Digital IF Filter Digital Detectors
FFT
Pre-amp
Digital Log AmpSwept vs . FFTAttenuation
YIGADC
Replacedby
Beyond S-Parameters© Agilent Technologies, Inc. 2007

Aerospace and Defense Symposium 2007EuMw 2007 Agilent WorkshopModern Spectrum Analyzer Block Diagram
Digital IF Filters• 160 RBW filters
Digital Detectors•Normal •RMS• 4.1:1 Shape factor
Auto Alignment• Temp & time calibration
AnalogPre-Filter
(Single Pole)
• 1 Hz to 8 MHz• ±0.03 dB switching error
•Peak•Min•SampleDANL -153dBm
3 to 50 GHz Pre-ampImprove 1 GHz
to -168dBm
•QPD •Avg
• Fast sweep • EMI RBW’s
Digital Log Amp
FFT
FFT vs Swept RBW F S
Attenuation
Digitally Synthesized LO• Fast tuning
14 bit ADC• Wider dynamic range
ith t i
g g p• ±0.07 dB Scale Fidelity• >100 dB Dynamic range• ±0.0 dB reference level error
p• Faster Sweep
w/Max DR2 dB stepto 50 GHz
Frequency CounterDigital Video Filters• Close-in phase noise• Far-out phase noise
with autoranging• Dither on/off
• Fast (0.1s)• High resolution (mHz)
• Power, voltage,log filtering
Beyond S-Parameters© Agilent Technologies, Inc. 2007

Aerospace and Defense Symposium 2007EuMw 2007 Agilent WorkshopModern Spectrum Analyzer - SpecificationsDigital IF provides improved accuracy
PSA vs. Traditional
• Input impedance mismatch ±0.13 ±0.29 dB
• Input attenuator switching uncertainty ±0.18 ±0.6 dB
• Frequency response ±0.38 ±1.8 dB
• Reference level accuracy ±0.0 ±1.0 dB
• RBW switching uncertainty ±0.03 ±0.5 dB
• Display scale fidelity ±0.07 ±0.85 dB
• Calibrator accuracy ±0.24 ±0.34 dB
Total accuracy (up to 3 GHz) ±0.62 dB vs. ±1.8 dB95% Confidence ±0.24 dBTypical ±0.17 dB
Beyond S-Parameters© Agilent Technologies, Inc. 2007

Aerospace and Defense Symposium 2007EuMw 2007 Agilent WorkshopModern Spectrum Analyzer FeaturesBuilt-in One-Button Power Measurements
F S
Occupied BandwidthGSM/EDGE cdma2000
Power MeasurementsFormat Setups
Channel Power Multi-Offset ACP – fast ACP
W-CDMA cdmaOne NADC/PDC Multi-carrier Power
CCDFHarmonic Distortion
NADC/PDC BluetoothTetra (Ch. Pwr, ACP)
Harmonic DistortionBurst PowerTOI
802.11a/b (SEM)HiperLAN2 (SEM)DVB-TTOI
Spurious Emissions Spectral Emissions Mask
DVB-TUWBS-DMB
Beyond S-Parameters© Agilent Technologies, Inc. 2007
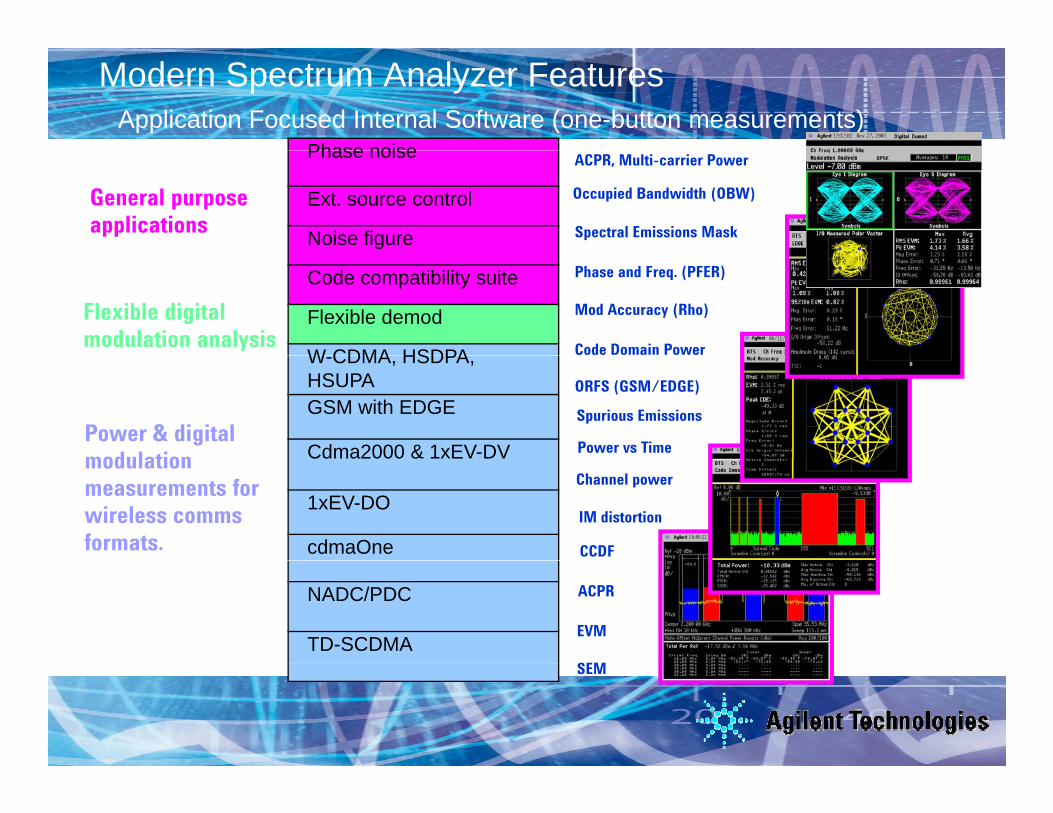
Aerospace and Defense Symposium 2007EuMw 2007 Agilent WorkshopModern Spectrum Analyzer FeaturesApplication Focused Internal Software (one-button measurements)
Phase noisePhase noise
Ext. source control
Noise figure
General purpose applications
ACPR, Multi-carrier Power
Occupied Bandwidth (OBW)
Spectral Emissions Mask
Code compatibility suite
Flexible demod
W CDMA HSDPA
Flexible digital modulation analysis Code Domain Power
Phase and Freq. (PFER)
Mod Accuracy (Rho)
W-CDMA, HSDPA, HSUPAGSM with EDGE
Cdma2000 & 1xEV-DVPower & digital modulation
ORFS (GSM/EDGE)
Power vs Time
Spurious Emissions
Cdma2000 & 1xEV DV
1xEV-DO
cdmaOne
modulation measurements for wireless comms formats. CCDF
IM distortion
Channel power
NADC/PDC
TD-SCDMAEVM
SEM
ACPR
Beyond S-Parameters© Agilent Technologies, Inc. 2007
SEM

Aerospace and Defense Symposium 2007EuMw 2007 Agilent WorkshopM d d i d d b d idth f t i hi h d t t
Who needs wide analysis BW?
• Aerospace and Defense
Modern designs demand more bandwidth for capturing high data rate signals and analyzing the quality of digitally modulated bandwidths
Radar – Chirp errors & modulation quality Satellite – Capture 36/72 MHz BW’s w/high data
ratesMilitary communications Capture high data rateMilitary communications – Capture high data rate
digital comms & measure EVM • Emerging communications
W LAN 802 16 (wireless last mile) mesh networksW-LAN, 802.16 (wireless last mile), mesh networks- Measure EVM on broadband, high data rate signals
• Cellular CommunicationsW CDMA ACPR & Multi carrier Pre DistortionW-CDMA ACPR & Multi-carrier Pre-Distortion- High dynamic range over 60 MHz BW to see low level 3rd order distortion for 4 carrier pre-distortion algorithms
Beyond S-Parameters© Agilent Technologies, Inc. 2007

Aerospace and Defense Symposium 2007EuMw 2007 Agilent WorkshopPSA Wide Analysis Bandwidth
A/D ASIC
SweptResults
14 bit30 Msps Pre-filter
CPUExisting Narrowband
IF A/D ASIC
I/QDetectorsLog AmpRBW filters
Autorange
DisplayProc
DemodFFT Display
IF(10 MHz)
Decimation
A/DASIC
A/D &FPGA
I/Q DetectorsFilters
14 bit200 Msps
Sweptand
S
Wideband IF/DigitizerDemod
FFTFiltersDecimationResampling
SteppedLO
(80 MHz)FFTMemoryCalibration
Beyond S-Parameters© Agilent Technologies, Inc. 2007

Aerospace and Defense Symposium 2007EuMw 2007 Agilent Workshop
THANK YOU!
Beyond S-Parameters© Agilent Technologies, Inc. 2007