spectroscopy and spectrophotometry - princeton universitygk/ast542/mike.pdf · outline • basic...
TRANSCRIPT
Spectroscopy and Spectrophotometry
Mikhail Belyaev 4/20/2011
Princeton University
Outline • Basic elements of spectroscopy – Mathema@cs of spectrometry – Basic components of a spectroscope – U@lizing CCDs effec@vely – Calibra@ng the wavelength scale – Calibra@ng fluxes
• Case study: the Harps spectrograph • 1D and 2D spectroscopy – Long‐slit and integral field spectroscopy – Fiber spectroscopy
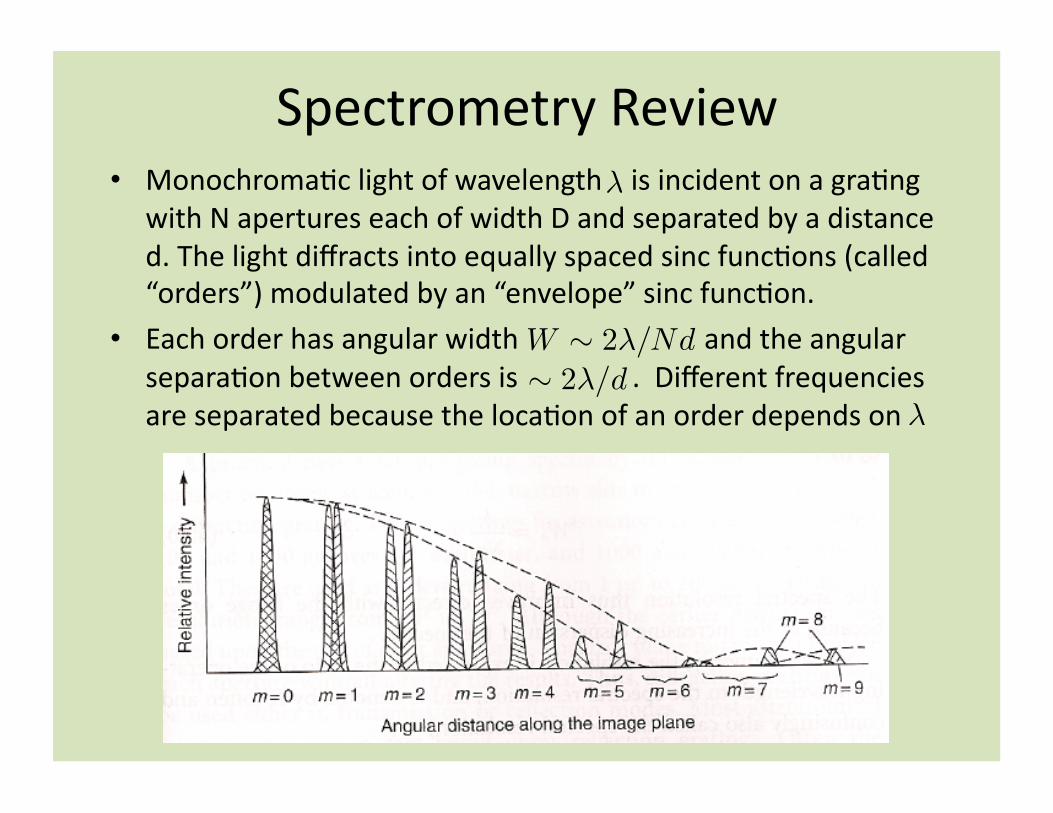
Spectrometry Review • Monochroma@c light of wavelength is incident on a gra@ng
with N apertures each of width D and separated by a distance d. The light diffracts into equally spaced sinc func@ons (called “orders”) modulated by an “envelope” sinc func@on.
• Each order has angular width and the angular separa@on between orders is . Different frequencies are separated because the loca@on of an order depends on
W ! 2!/Nd
!
! 2!/d!
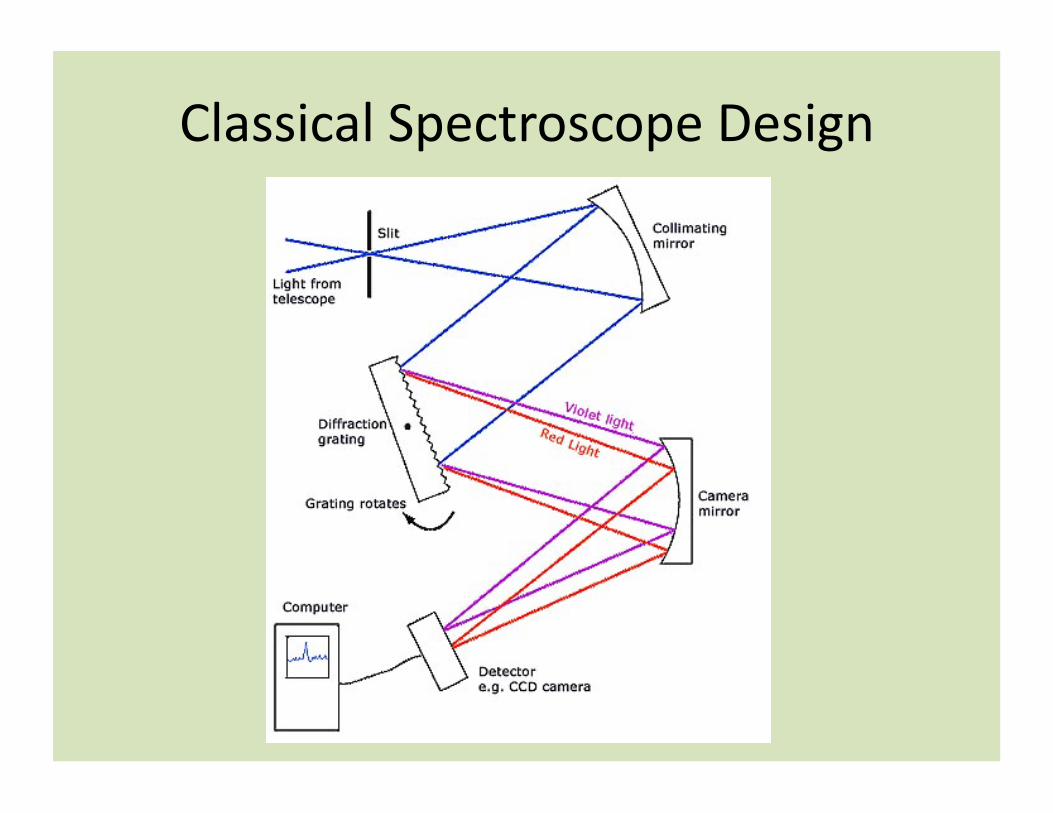
Classical Spectroscope Design
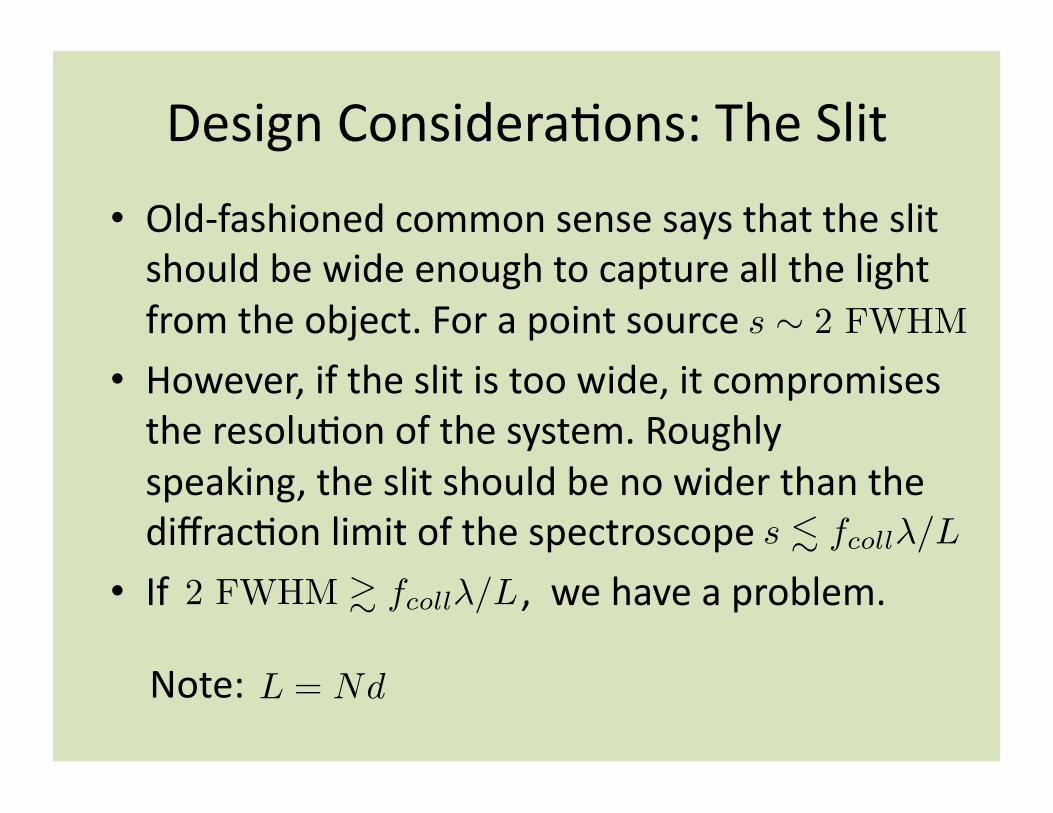
Design Considera@ons: The Slit
• Old‐fashioned common sense says that the slit should be wide enough to capture all the light from the object. For a point source
• However, if the slit is too wide, it compromises the resolu@on of the system. Roughly speaking, the slit should be no wider than the diffrac@on limit of the spectroscope
• If , we have a problem.
s ! 2 FWHM
s ! fcoll!/L
2 FWHM ! fcoll!/L
Note: L = Nd

Design Considera@ons: Resolu@on • In order to find the center of a line in a spectrum, we need to fit a profile to it.
• In order to fit a profile, each line must spread over a few pixels of the CCD.
• Since CCDs have a spacing between pixels of ~15 microns, this means
• We can then deduce the resolu@on
W ! 50µm/fim
10!5
!lCCD
50µm
" !10F
" !1m
L
" !500mm!1
R
" !3m
" !500nm
!
"(W/!)d!/d" = !!/! =
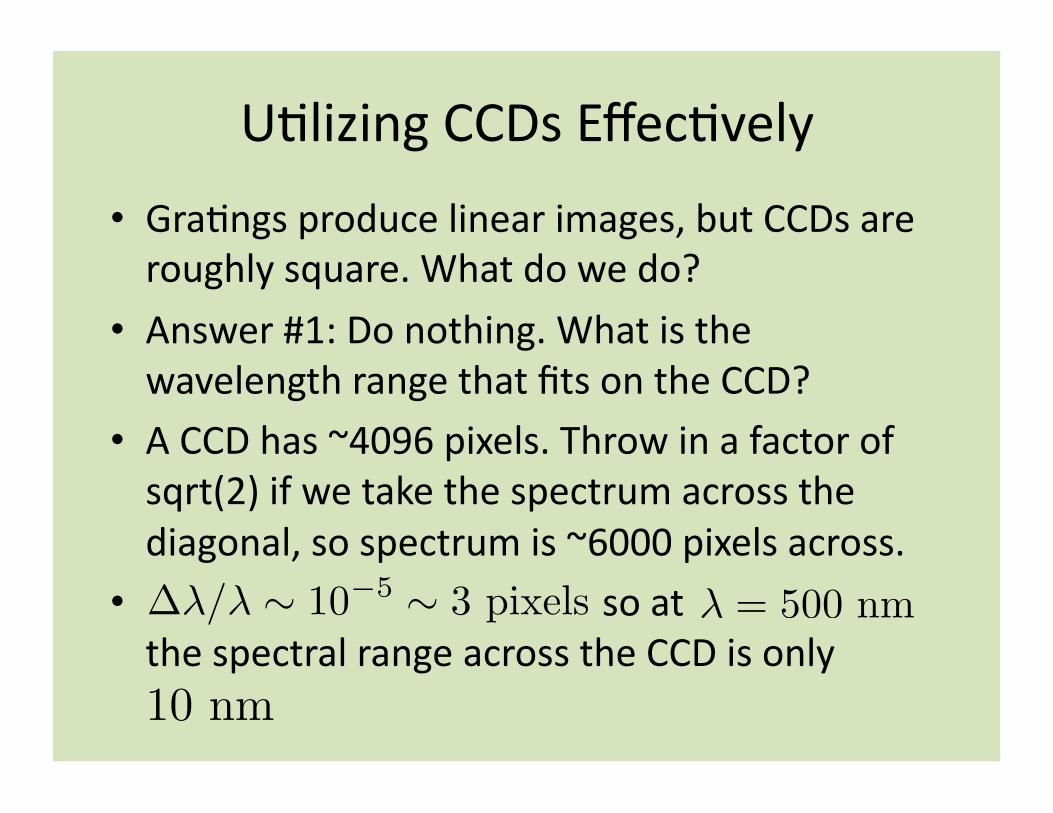
U@lizing CCDs Effec@vely
• Gra@ngs produce linear images, but CCDs are roughly square. What do we do?
• Answer #1: Do nothing. What is the wavelength range that fits on the CCD?
• A CCD has ~4096 pixels. Throw in a factor of sqrt(2) if we take the spectrum across the diagonal, so spectrum is ~6000 pixels across.
• so at the spectral range across the CCD is only !!/! ! 10!5 ! 3 pixels ! = 500 nm
10 nm
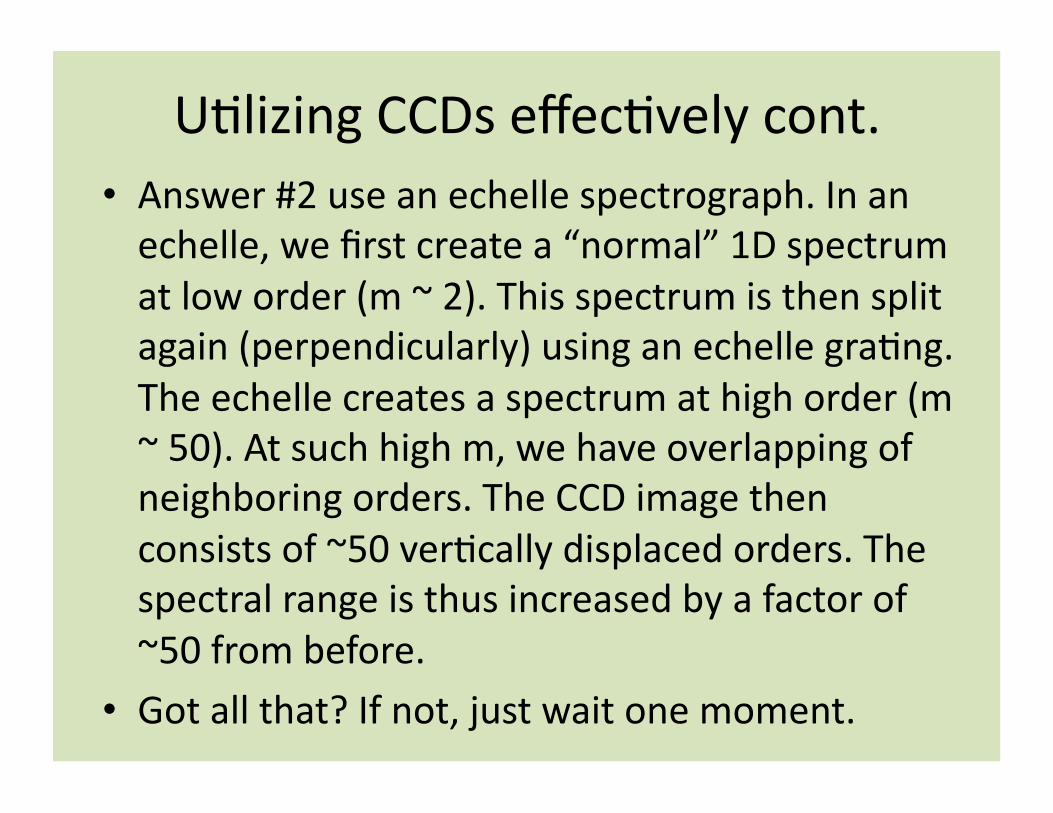
U@lizing CCDs effec@vely cont. • Answer #2 use an echelle spectrograph. In an echelle, we first create a “normal” 1D spectrum at low order (m ~ 2). This spectrum is then split again (perpendicularly) using an echelle gra@ng. The echelle creates a spectrum at high order (m ~ 50). At such high m, we have overlapping of neighboring orders. The CCD image then consists of ~50 ver@cally displaced orders. The spectral range is thus increased by a factor of ~50 from before.
• Got all that? If not, just wait one moment.
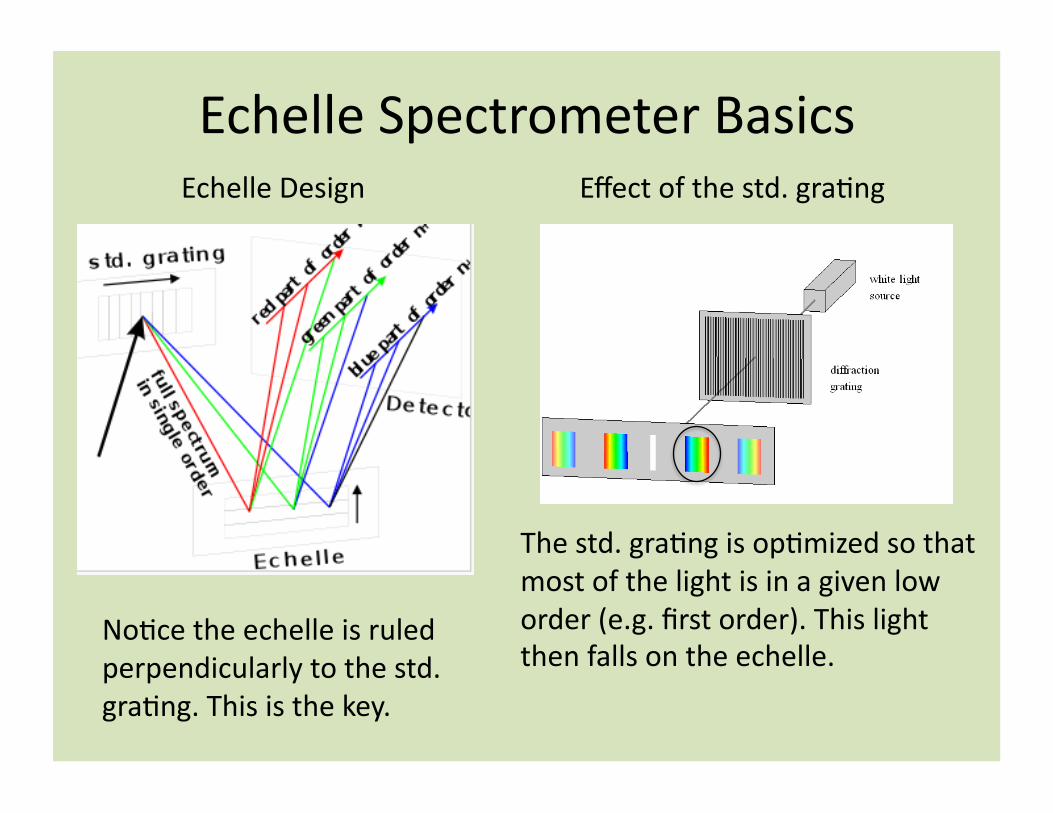
Echelle Spectrometer Basics Echelle Design Effect of the std. gra@ng
The std. gra@ng is op@mized so that most of the light is in a given low order (e.g. first order). This light then falls on the echelle.
No@ce the echelle is ruled perpendicularly to the std. gra@ng. This is the key.
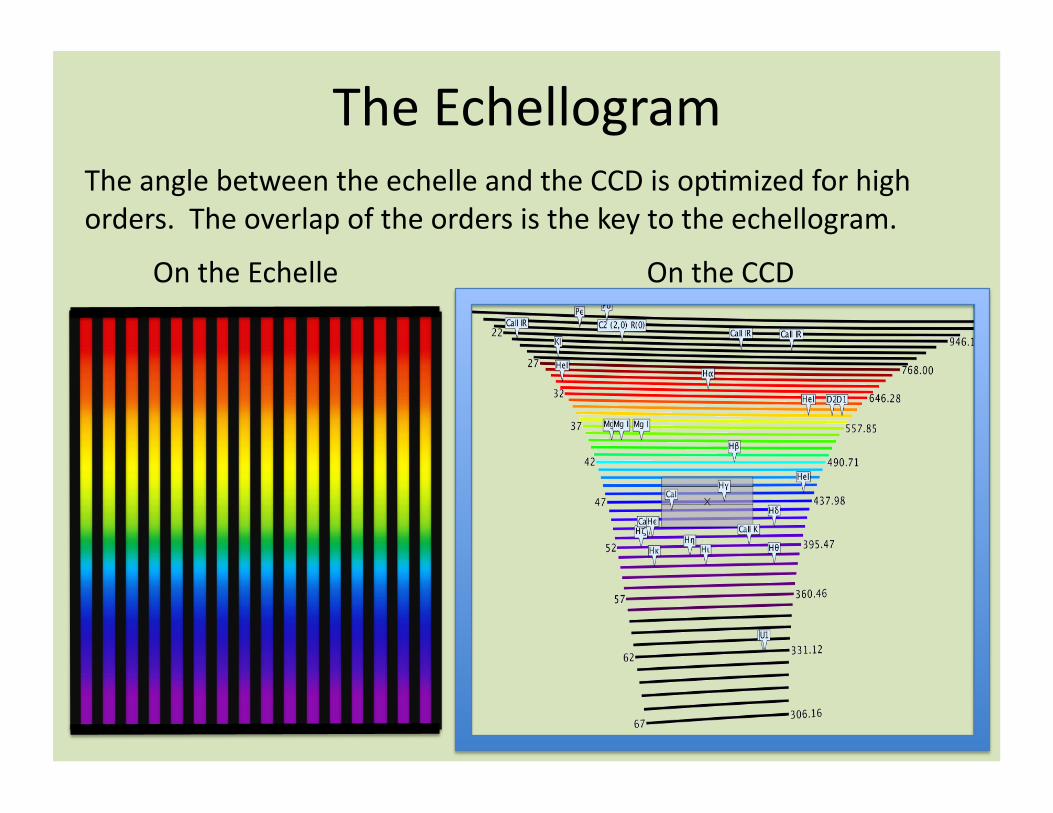
The Echellogram
On the Echelle On the CCD
The angle between the echelle and the CCD is op@mized for high orders. The overlap of the orders is the key to the echellogram.
Calibra@ng the Wavelength Scale • Typically a reference spectrum is used. • In absorp@on, an iodine cell is placed between the gra@ng and the slit. The imaged spectrum thus has iodine absorp@on features.
• In emission a second reference spectrum is generated that is spa@ally separated on the CCD e.g. using a Thorium lamp.
• A new technique being considered is to use a femtosecond laser to generate a series of short pulses at regular intervals (effec@vely a Dirac comb). This creates a uniform “ruler” in frequency space as the Fourier transform of a Dirac comb is also a Dirac comb.

Calibra@ng Fluxes (Spectrophotometry) • Basic idea:
– Measure the spectrum of a reference star near the source.
– Generate a model spectrum for the star. Normalize the it to give the same broadband flux as the reference star.
– Divide the observed spectrum of the reference star by the model spectrum. Call this ra@o
– The flux‐calibrated spectrum is then given by
• Pifalls: – For a strong atmospheric absorp@on line, – If the star has strong spectral features it is impossible to
calibrate at these wavelengths. This is especially problema@c if the source has lines at these wavelengths also.
– Atmospheric absorp@on varies in @me and space. The reference star must be nearby to the source and must be monitored ogen.
R(!)f(!) =
f0(!)R(!)
R(!) = 0
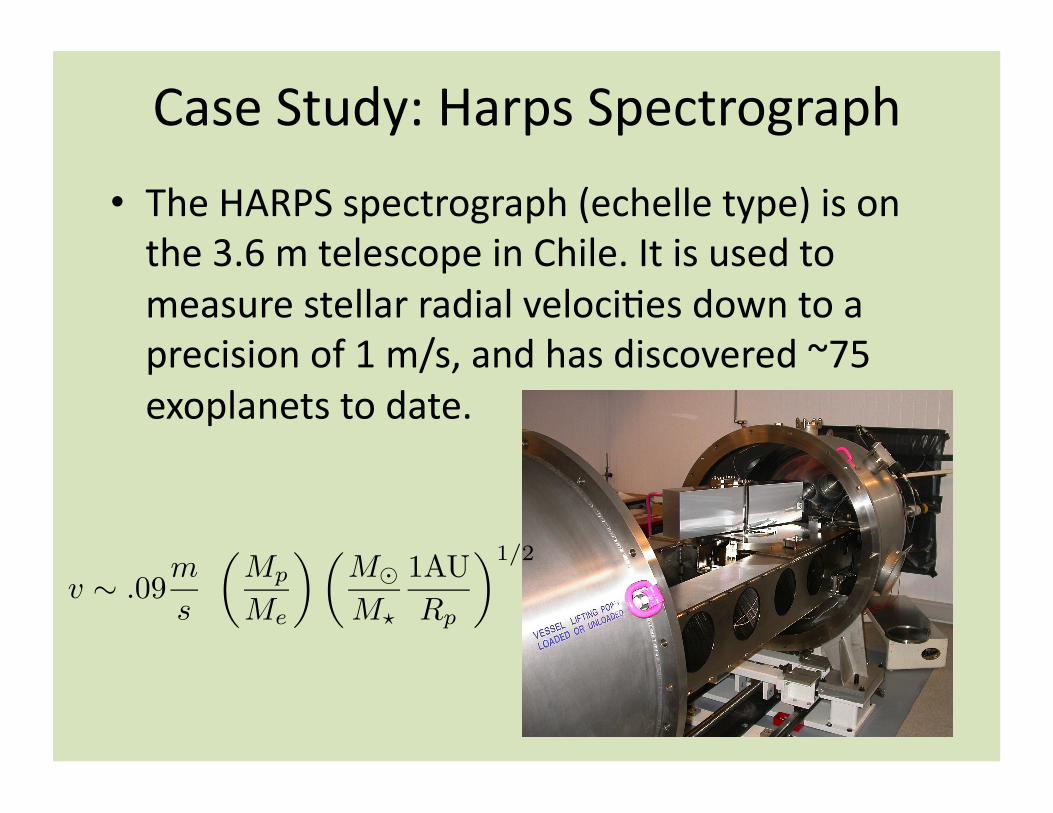
Case Study: Harps Spectrograph
• The HARPS spectrograph (echelle type) is on the 3.6 m telescope in Chile. It is used to measure stellar radial veloci@es down to a precision of 1 m/s, and has discovered ~75 exoplanets to date.
v ! .09m
s
!Mp
Me
" !M!
M!
1AURp
"1/2
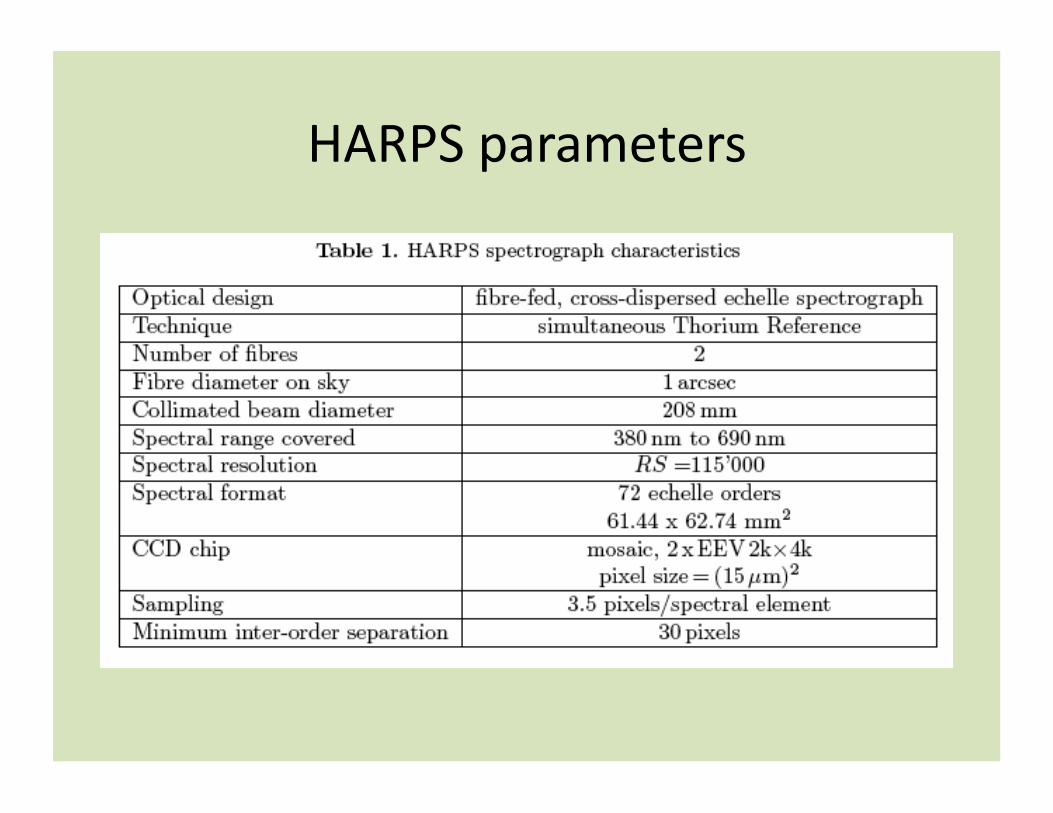
HARPS parameters
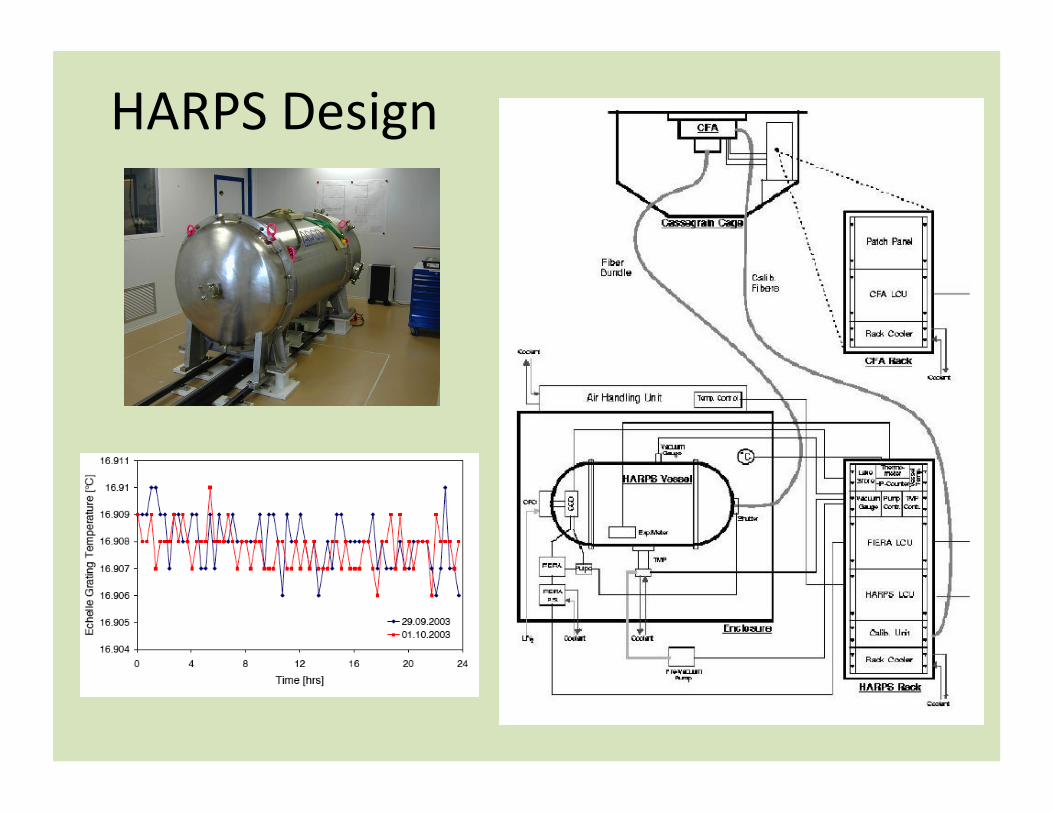
HARPS Design
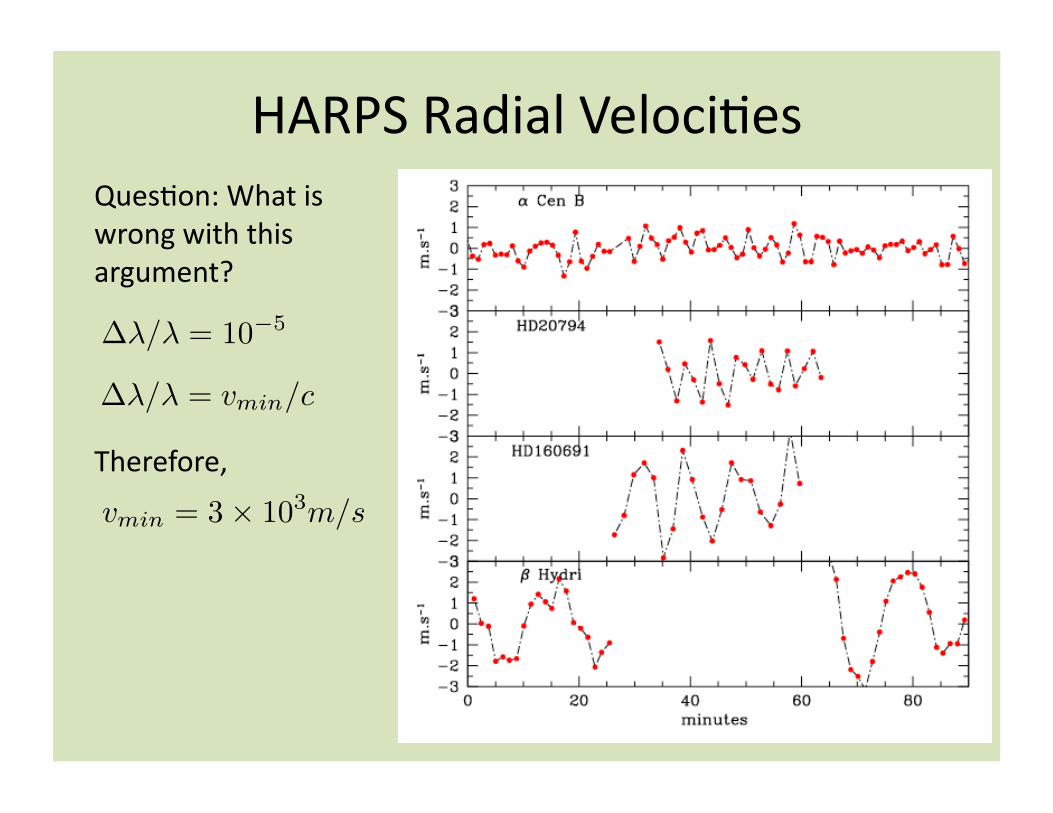
HARPS Radial Veloci@es Ques@on: What is wrong with this argument?
Therefore,
!!/! = 10!5
!!/! = vmin/c
vmin = 3! 103m/s
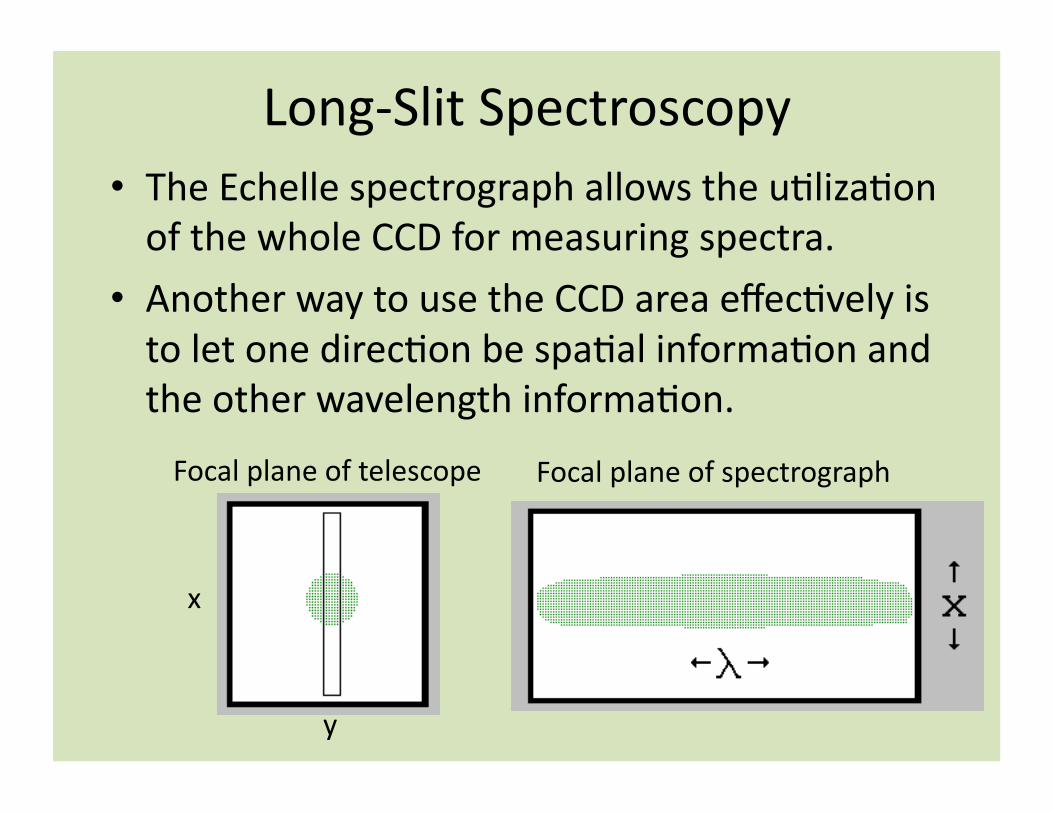
Long‐Slit Spectroscopy • The Echelle spectrograph allows the u@liza@on of the whole CCD for measuring spectra.
• Another way to use the CCD area effec@vely is to let one direc@on be spa@al informa@on and the other wavelength informa@on.
y
x
Focal plane of spectrograph Focal plane of telescope

Long‐Slit Spectra
Emission from PAH molecules heated by a B‐star in a molecular cloud.

Integral Field Spectroscopy • Same idea as long slit spectroscopy, but now we have a “spectral cube” of data, i.e. !(x, y)
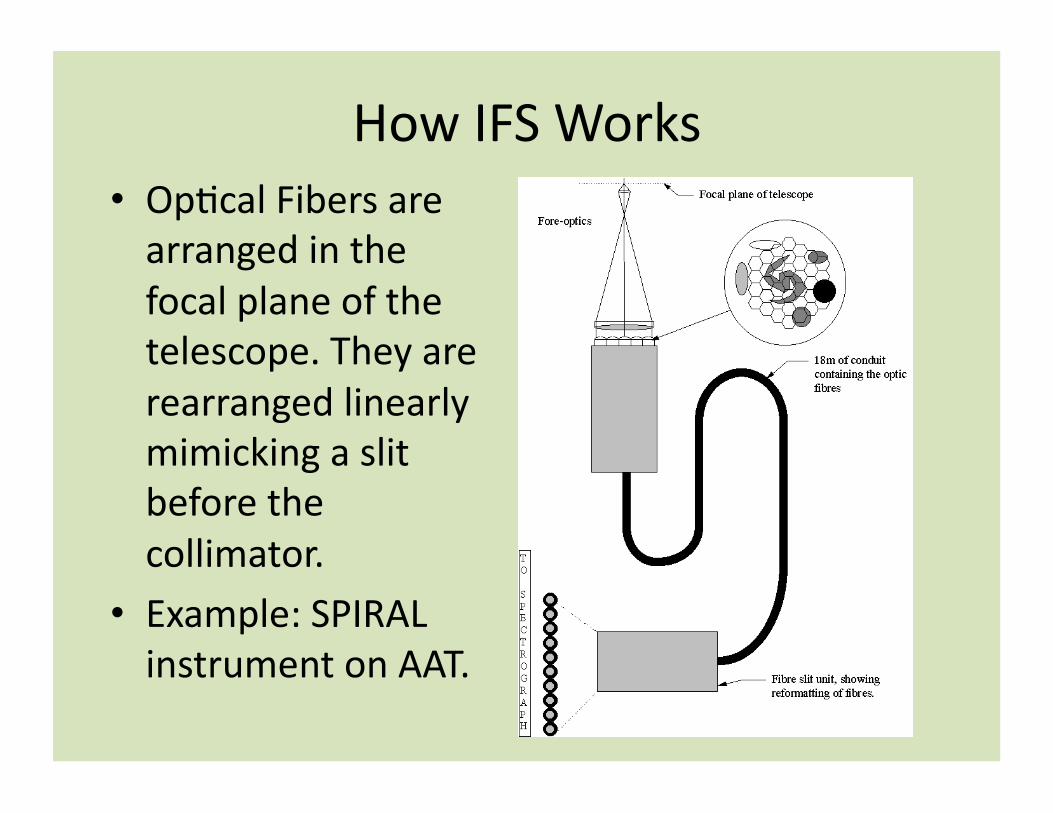
How IFS Works • Op@cal Fibers are arranged in the focal plane of the telescope. They are rearranged linearly mimicking a slit before the collimator.
• Example: SPIRAL instrument on AAT.
Mul@‐Object Spectrography
• Put op@cal fibers at the loca@ons of objects in the focal plane of the telescope.
• Op@cal fibers feed into the spectrograph, crea@ng a series of spectra in x, separated in y. This is similar to echelle, but spectra are now of different objects.
• Because objects move through the sky, fibers must be rearranged during the course of a night. Several strategies exist for doing this.
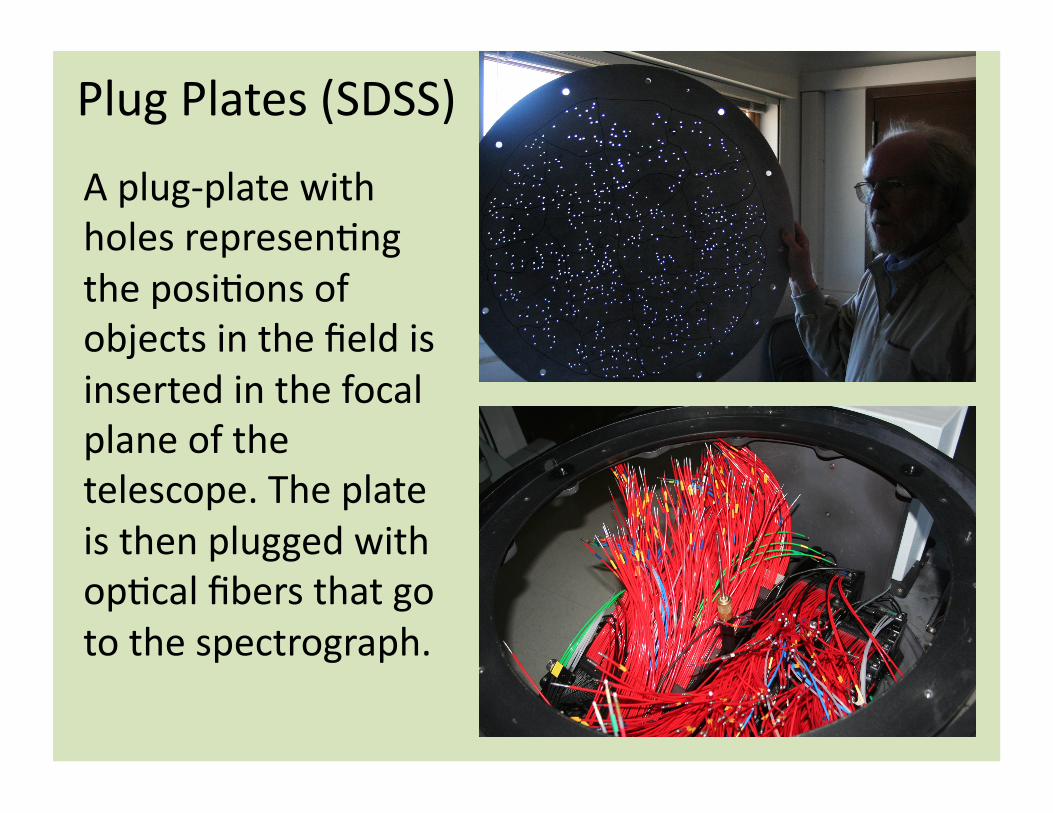
Plug Plates (SDSS)
A plug‐plate with holes represen@ng the posi@ons of objects in the field is inserted in the focal plane of the telescope. The plate is then plugged with op@cal fibers that go to the spectrograph.
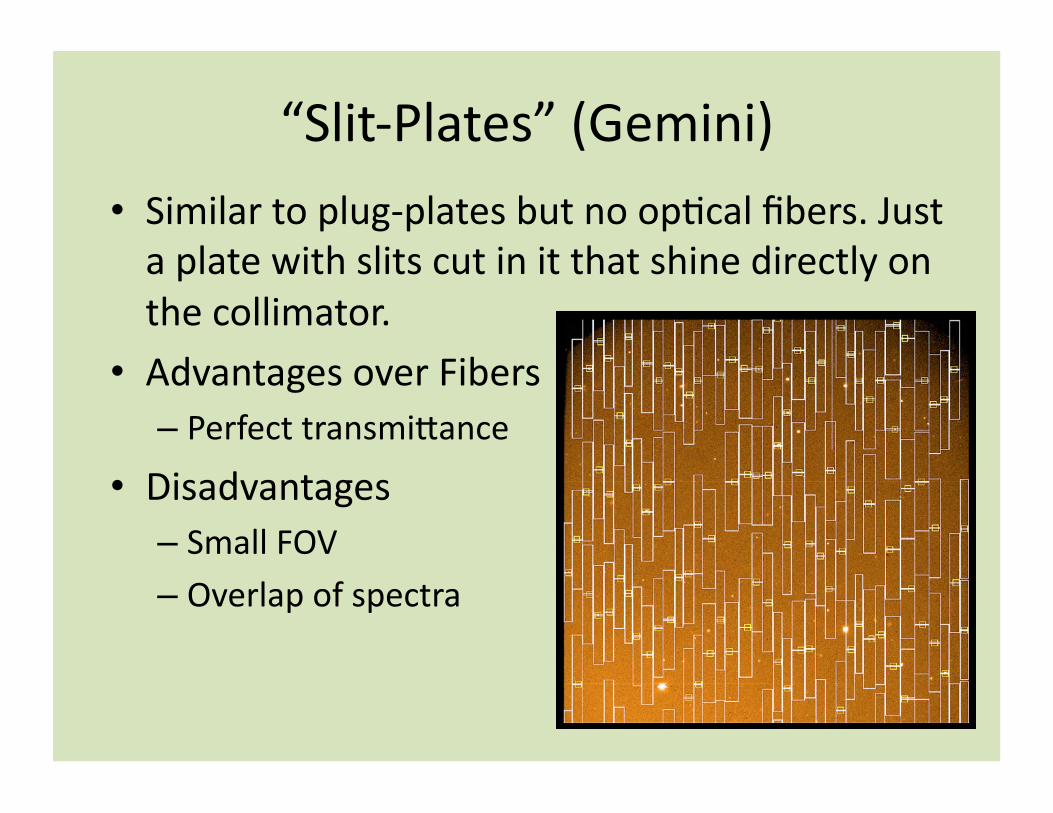
“Slit‐Plates” (Gemini) • Similar to plug‐plates but no op@cal fibers. Just a plate with slits cut in it that shine directly on the collimator.
• Advantages over Fibers – Perfect transmimance
• Disadvantages – Small FOV – Overlap of spectra

Echidna System (Subaru)
• The instrument consists of a series of spines that can be posi@oned mechanically in the focal plane of the telescope. Each spine contains an op@cal fiber that goes to the spectrograph.
• Advantages – No plates to cut
• Disadvantages – Expensive
Summary • Slit Size and Resolu@on are implicitly set by the other parameters of the spectroscope.
• Spectra are linear. To u@lize the CCD area effec@vely it is necessary to use an echelle spectrograph or to do mul@‐D (long‐slit/IFS) or mul@‐object spectroscopy.
• Mul@‐object spectroscopy can be done with op@cal fibers or slit‐masks.
• A reference spectrum is used to calibrate spectrographs either in transmission or absorp@on.
• A reference star nearby to the source can be used to calibrate the flux, but atmospheric lines and lines in the source make it difficult.
Ques@ons?