spectroscopic study of precipitates formed during … contamination by selenate (se(vi)) potentially...
TRANSCRIPT
283
Geochemical Journal, Vol. 42, pp. 283 to 294, 2008
*Corresponding author (e-mail: [email protected])
Copyright © 2008 by The Geochemical Society of Japan.
Spectroscopic study of precipitates formed during removal of selenium frommine drainage spiked with selenate using permeable reactive materials
KEIKO SASAKI,1* DAVID W. BLOWES2 and CAROL J. PTACEK2
1Department of Earth Resources Engineering, Faculty of Engineering, Kyushu University, Fukuoka 819-0395, Japan2Department of Earth Sciences, University of Waterloo, ON, N2L 3G1, Canada
(Received August 21, 2007; Accepted February 26, 2008)
The potential for Se removal from mine drainage water using permeable reactive materials was evaluated by a labora-tory column experiment. The column materials, organic carbon and zero valence iron (ZVI), were exposed to mine drain-age containing 630 mg L–1 SO4
2–. The influent water was spiked with 40 mg L–1 Se(VI) to assess the potential for Seremoval. This high Se(VI) concentration was selected to ensure that there would be a sufficient mass of Se-bearing reac-tion products available for mineralogical characterization. The experiment was conducted in an anaerobic chamber toreplicate the anaerobic conditions that prevail in permeable reactive barrier systems. After loading 10.8 pore volumes ofinput solution, the column effluent contained <0.002 mg L–1 Se and <300 mg L–1 SO4
2–. After the column experiments wascomplete the reactive materials were sampled in the anaerobic chamber and examined using scanning electron microscopy(SEM) coupled with energy dispersion X-ray analysis (SEM-EDAX), X-ray photoelectron spectroscopy (XPS) and byRaman spectroscopy. Sulfate was reduced to sulfide and elemental sulfur, which accumulated on the surfaces of thecolumn materials. Se-bearing precipitates were observed at the base of column. Scanning electron microscopy (SEM)showed the presence of elemental Se, suggesting that Se(VI) was partly reduced to metallic Se(0). The XPS results re-vealed that selenate was reduced mainly to iron selenide (FeSe and/or FeSe2) on the surface of the column substances.These observations suggest that both chemical reduction and biologically mediated reduction of Se(VI) occurred.
Keywords: selenium, X-ray photoelectron spectroscopy, zero valence iron, permeable reactive barrier, anaerobic condition
sites and mine sites (Scherer et al., 2000; Blowes et al.,2000). Groundwater contamination by selenate (Se(VI))potentially is amenable to treatment using a PRB.
Understanding the chemical speciation of the Se re-tained in the reactive materials is important because Sesolubility, bioavailability, and toxicity are strongly influ-enced by speciation (Presser and Swan, 1990). Selenate(Se(VI)) and selenite (Se(IV)) are more mobile and toxicthan elemental selenium (Se(0)) and selenide (Se(-II)).Myneni et al. (1997) observed that Se(VI) was reducedto Se(0) by green rust through an abiotic transformationin the presence of Fe(II, III) oxides. The Se speciation ofthe reaction products was examined using X-ray absorp-tion near edge structure (XANES) and extended X-rayabsorption fine structure (EXAFS) spectroscopy studiesconducted on aqueous and solid-phase samples. Zhang etal. (2005) reported Se(VI) was reduced to Se(IV) andadsorbed onto iron oxyhydroxides formed during the cor-rosion of zero valence iron (ZVI) under the aerobic con-ditions, and that the efficiency of Se removal was not sig-nificantly inhibited by other anions except for phosphate.Stolz and Oremland (1999) reported that most selenium-reducing bacteria reduce Se(VI) and Se(IV) to Se(0), andnot to Se(-II).
INTRODUCTION
Groundwater contamination by Se originates frommine sites, industrial sites and in agricultural drainage(Frankenberg and Benson, 1994). Selenium-bearing min-erals are rare, but can be abundant at individual mine sites.Furthermore, Se can substitute for S in sulfide minerals,and therefore Se occurs as an impurity in some sulfideores. Selenium is an essential element for many speciesincluding humans. However, there is a narrow range ofSe intake that is beneficial to health. Outside of this range,deficiency diseases and toxicity occur (Fishbein, 1991).As a consequence, regulatory agencies have establishedwater quality guidelines and limits for Se in groundwater.
Permeable reactive barriers (PRB) provide an alter-native to conventional pump and treat systems forremediation of contaminated groundwater. PRB systemsfor the removal of heavy metals, radionuclides, nitrate,phosphate, and arsenic have been utilized at industrial

284 K. Sasaki et al.
The rates of chemical and microbiological reductionare key factors that govern the performance of PRB sys-tems. Microbiological reduction can be sustained throughbacterial growth and multiplication, which is maintainedby an adequate supply of suitable electron donors for ex-ample CH2, H2 etc. Chemical reduction requires an ad-equate supply of a reactive reductant.
The potential for Se(VI) removal using permeable re-active materials was examined through a laboratory scalecolumn experiment in the present study. To understandthe process resulting in Se removal, column materialswere characterized following the treatment of Se-contain-ing mine drainage using several spectroscopic techniques.
EXPERIMENTAL
Background water chemistryThe column experiment methodology is described in
detail by Sasaki et al. (in press). Solids collected at thetermination of the experiment were characterized in thisstudy. A brief description of the experiment is providedhere. The mine-drainage water for the column influentsolution was collected from a mine site near Soda Springs,Idaho. The ore at this site is overlain by the Se-bearingPhosphoria Formation. Oxidation of Se-bearing mineralscontained in the overburden results in the release of Se tothe groundwater flow system. The groundwater compo-sition is provided in Table 1. The input solution Se con-centration was increased to 40 mg L–1 as Se, by addingNa2SeO4 to the site groundwater. Use of water contain-ing this higher Se concentration facilitated the determi-nation of Se removal mechanisms and rates of Se removal.This increased Se concentration provided the opportunityto detect the chemical speciation of Se after loading Se-impacted water over a limited period. Water derived fromthe mine site was used to determine whether potentiallycompeting constituents interact with reactive materialsto form precipitates and thereby alter the reactivity orpermeability of the barrier materials. As previously re-ported (Sasaki et al., in press), the geochemical calcula-tions indicated that the solution was supersaturated withSe (hexagonal, amorphous), FeSe, and FeSe2 (ferroselite).
Column experimentsThe column was 40 cm in length with an inner diam-
eter of 7.5 cm. The internal volume of the column was1700 mL. The pore volume of the reactive materials was662 mL. The calculated porosity of the column was 0.39.The reactive zone in the column (34 cm in length), wasfilled with reactive material; thin zones at the top (1.8cm) and bottom (4 cm) were packed with 100% silicasand to isolate the reactive material from the columnendplates. The reactive material contained 10 (v/v) % ZVI(ETI-CC-1004; Connelly-GPM, Inc, Chicago), 30(v/v) %silica sand, 20(v/v) % gravel, and 40(v/v) of organic car-bon. The organic carbon consisted of 50(v/v) %composted leaf mulch, 25 (v/v) % wood chips, and 25(v/v) % sawdust. In the column, the reactive material con-tained 29.06 g ZVI. The ZVI ranged in grain size fromless than U.S. Standard Mesh 8 (2.38 mm in grain diam-eter) to a medium to coarse sand. A small amount of or-ganic stream sediment was added to the reactive mixture.This sediment was taken from an anoxic zone of a smallstream that flows through the University of Waterloo. Thesediment was not exposed to air prior to being loaded inthe column. The sediment was blackish and had a rottenegg-smell. The stream sediment was added to provide anactive bacterial consortium which included sulfate reduc-ing bacteria. The presence and the enumeration of sulfate-reducing bacteria in the sediment using the most prob-able number (MPN) method have been reported to be atleast 105 cells/g elsewhere (Sasaki et al., in press).
Prior to loading the site water, the column was flushed
Al As B Ba Ca Cd Co Cr Cu Fe K Li Mg Mn Mo<0.37 <0.002 0.029 0.049 236 <0.005 <0.009 <0.004 0.01 <0.03 1.82 <0.004 69.2 <0.001 0.029
Na Ni P Pb S Se Si Sn Sr Ti Tl V Zn pH<0.014 <0.014 <0.16 <0.068 211 2.24 9.16 <0.055 0.529 0.007 <0.074 0.015 0.019 7.57
Table 1. Water chemistry of the mine drainage (mg L–1)
Fig. 1. Assembly of the PRB column experiment.

Spectroscopic study on removal of selenium in mine drainage using permeable reactive materials 285
sampling-port locations. These samples were labeledP2~P10 in order from the bottom to the top (Fig. 1). As aprimary reactive material, ZVI was hand picked and al-lowed to dry in the anaerobic chamber overnight, prior tothe spectroscopic study.
X-ray photoelectron spectroscopyX-ray photoelectron spectra were collected for ZVI
granules from each sample over the binding energy rangefrom 0 to 1200 eV using a VG scientific ESCALab 250operating in the Al Kα (hν = 1486.6 eV) X-ray radiationmode with the neutralization gun to avoid the differentialcharging effect, under the following conditions for re-gional scan: pass energy 20 eV, step energy 0.1 eV, dwelltime (time/step) 100 ms, the number of scan 3–20 de-pending upon the XPS features. The pressures in theanalysis and preparation chambers were 10–9 and 10–5
Torr, respectively. The powders were fixed on conduc-tive carbon tape.
The spectral sets acquired were viewed and processedusing the Casa XPS software (Ver. 2.3.12). Background
Table 2. Electron binding energy (EB) for some related substances
*1Iron foil 99.99% (ALFA) after sputtering for 20 min.*2Zero valence iron (ZVI) is supplied by Connelly-GPM, Ins. (Chicago, IL).*3Very broad.
with CO2 gas for 6 hours to displace less soluble air. Thecolumn was then saturated with a 1000 mg L–1 (as sulfate)CaSO4 solution containing 5% Na-lactate. The CaSO4/Na-lactate solution was retained in the column for 48hours to serve as the electron donor to establish sulfatereduction in the column.
The column experiment was conducted in a flexiblevinyl anaerobic chamber (Coy Laboratory Products Inc.,USA) filled with 7% H2 and 93% N2. After the columnwas sealed inside the anaerobic chamber, the influentwater was pumped from an input container to the columnby a high-precision peristaltic pump in the anaerobicchamber, as shown in Fig. 1. Flow through the columnwas upward. The average flow rate was 0.144 L d–1, cor-responding to 0.217 pv d–1. This flow rate corresponds toan average linear groundwater velocity of 3.26 cm d–1 inthe column, and to the residence time of 4.77 d. A total of7.2 L Se-spiked water was pumped through the columnover a period of 1200 h. After the flow was terminated,the column material in a reactive zone was divided intonine vertical sections (3.8 cm thick) corresponding to the
Substances Fe 2p3/2 Fe 3p3/2 Se 3p3/2 Se 3d5/2 Se L3M45M45 S 2p3/2 References
Se — — 161.7 55.5 — — Canava et al. (2002)— — — 55.2 — — Cahen et al. (1985)— — — 54.7 — — Iwakuro et al. (1982)— — 161.6 55.3 180.6 — the present work
ZnSe — — — 54.1 — — Canava et al. (2002)— — — 54.2 180.6 — Islam and Rao (1996)— — 161.0 54.9 180.9 — the present work
GaSe — — — 54.4 180.2 — Iwakuro et al. (1982)FeSe 712.0 — — 53.7 — — Hamdadou et al. (2002)CdSe — — — 53.9 — — Canava et al. (2002)
— — — 54.2 — — Islam and Rao (1996)In2Se3 — — — 53.6 — — Canava et al. (2002)As2Se3 — — 161.0 — — — Ueno and Odajima (1982)H2SeO3 — — 163.9 59.0 — — Bahl et al. (1979)SeO2 — — 165.1 58.8 — — Bahl et al. (1979)H2SeO4 — — 164.4 61.0 — — Bahl et al. (1979)Fe 706.8 — — — — — Konno and Nagayama (1980)Fe*1 706.9 52.4 — — — — the present workFeS2 707.0 — — — — 162.2 Sasaki et al. (1993)S — — — — — 164.3 Wagner et al. (1990)α-Fe2O3 711.0 — — — — — Konno and Nagayama (1980)
FeSO47H2O 711.1 — — — — 168.8 Konno et al. (1991)γ-FeOOH 711.3 — — — — — Konno and Nagayama (1980)
Na2SO3 — — — — — 166.6 Wagner et al. (1990)Na2S2O3 central S — — — — — 162.5 Wagner et al. (1990)Na2S2O3peripheral S — — — — — 168.6 Wagner et al. (1990)Untreated ZVI*2 712.1*3 55.6 — — — — the present workCleaned ZVI*2 710.4 55.5 — — — — the present work

286 K. Sasaki et al.
Sam
ple
Fe
2p3/
2 (1
)F
e 2p
3/2
(2)
Fe
2p3/
2 (3
)F
e 3p
3/2
(1)
Fe
3p3/
2 (2
)F
e 3p
3/2(
3)S
e 3d
5/2
Se
L3M
45M
45
Se
3p3/
2S
2p 3
/2 (
1)S
2p 3
/2 (
2)S
2p 3
/2 (
3)N
1s
P2E
B/e
V70
6.8
709.
571
4.1
52.8
54.7
56.0
53.3
178.
616
0.2
162.
0
39
9.7
FWH
M0.
93.
78.
70.
72.
24.
11.
32.
11.
72.
0P3
EB/e
V70
6.2
709.
271
3.7
52.8
53.6
55.6
wea
k17
8.4
160.
516
0.8
162.
0
399.
8
FWH
M0.
83.
98.
61.
82.
44.
43.
01.
31.
31.
6P4
EB/e
V70
6.3
709.
471
3.7
53.2
54.1
56.8
16
1.2
162.
8
399.
8
FWH
M1.
13.
96.
41.
53.
24.
01.
21.
21.
9P5
EB/e
V70
6.4
709.
471
3.9
52.3
54.1
56.6
16
1.0
162.
2
399.
8
FWH
M1.
44.
17.
21.
72.
63.
01.
11.
11.
9P7
EB/e
V70
6.4
709.
771
5.1
52.4
54.0
56.8
16
1.4
163.
0
399.
9
FWH
M0.
94.
65.
71.
52.
93.
11.
01.
01.
8P1
0E
B/e
V70
6.5
708.
671
2.7
52.1
53.5
56.2
16
1.4
162.
916
4.2
399.
9
FWH
M1.
004.
17.
71.
32.
84.
70.
80.
80.
81.
7
Ave
.E
B/e
V70
6.4
± 0.
270
9.3
± 0.
471
3.9
± 0.
752
.6 ±
0.4
54.0
± 0
.456
.3 ±
0.4
53.3
178.
516
0.4
161.
2 ±
0.3
162.
6 ±
0.4
164.
239
9.8
± 0.
1
FW
HM
1.00
± 0
.24.
1 ±
0.3
7.4
± 1.
11.
4 ±
0.3
2.7
± 0.
33.
9 ±
0.6
1.3
1.2
± 0.
31.
1 ±
0.2
0.8
1.8
± 0.
1
Tabl
e 3.
B
indi
ng e
ner g
y (E
B)
and
full
wid
th a
t ha
lf m
axim
um (
FW
HM
) fo
r su
rfac
e pr
oduc
ts o
n co
lum
n m
ater
ials
aft
er w
ater
tr e
atm
ent
for
1200
hou
rs
P1,
0–4
.0 c
m;
P2,
4.0
–7.8
cm
; P
3, 7
.8–1
1.6
c m;
P4,
11.
6–15
.4 c
m;
P5,
15.
4–19
.2 c
m;
P6,
19.
2–23
.0 c
m;
P7,
23.
0–26
.8 c
m;
P8,
26.
8–30
.6 c
m;
P9,
30.
6–34
.4 c
m;
P10
, 34.
4–38
.2 c
m;
P1 1
, 38.
2–40
.0 c
m.
corrections were made using the Shirley method (Shirley,1972) for the Se 3d, Se L3L45L45, S 2p, Ca 2p, N 1s, Si2s, C 1s, and O 1s orbitals and by the Shirley-Tougaardmethod for the Fe 2p orbital. Peak shapes were definedusing a Gaussian-Lorentzian function. The C–C bond hasa well-defined position at EB[C 1s] = 284.6 eV, whichwas used as a reference peak to correct for charging ef-fects. XP-spectra were collected in the same manner forthe reference materials: Se powder (99.999%, –100 mesh,Aldrich, 22986-5), ZnSe powder (99.99%, 5 µm, Aldrich,24461-9), Fe-foil (99.99%, ALFA), ZVI, and ZVI washedwith methanol. The XPS measurement is the mostsurface-sensitive of the techniques used, with escapedepths of ≤25 Å.
Raman spectroscopyRaman spectra were obtained with a Renishaw 1000
Raman microscope system. Excitation was accomplishedby light of a single wavelength (514.5 nm) from Ar ionlaser. The incident power was about 38 mW at the sam-ple point. It is possible to distinguish between selenideand metallic selenium by Raman spectroscopy, becauseselenide has a Raman shift at 250.8 cm–1 whereas metal-lic selenium has a Raman shift at 232.8 cm–1. Ramanspectroscopy has a penetration range of 100 µm in depthand 5 µm in diameter, which is very coarse compared withthe other techniques.
Electron spectroscopyScanning electron microscopy (SEM) and energy dis-
persive X-ray analysis (EDAX) were performed to ob-tain the information on the morphology and the composi-tion of Se-bearing phases using a LEO 1530 SEM-EDAXoperating at 20 kV. SEM-EDAX usually has analyticalvolumes of several cubic microns that are 2–3 µm in depthand diameter.
RESULTS AND DISCUSSION
XPS spectral data from the column specimens(P2~P10) and the reference materials are summarized inTables 2 and 3. The peak binding energies (EB) for Fe,Se, and S compounds, including ZVI and ZVI washedwith methanol indicate that there is a strong overlap be-tween the Se 3d and the Fe 3p binding energy ranges, andbetween the Se 3p and the S 2p binding energy ranges inTable 3.
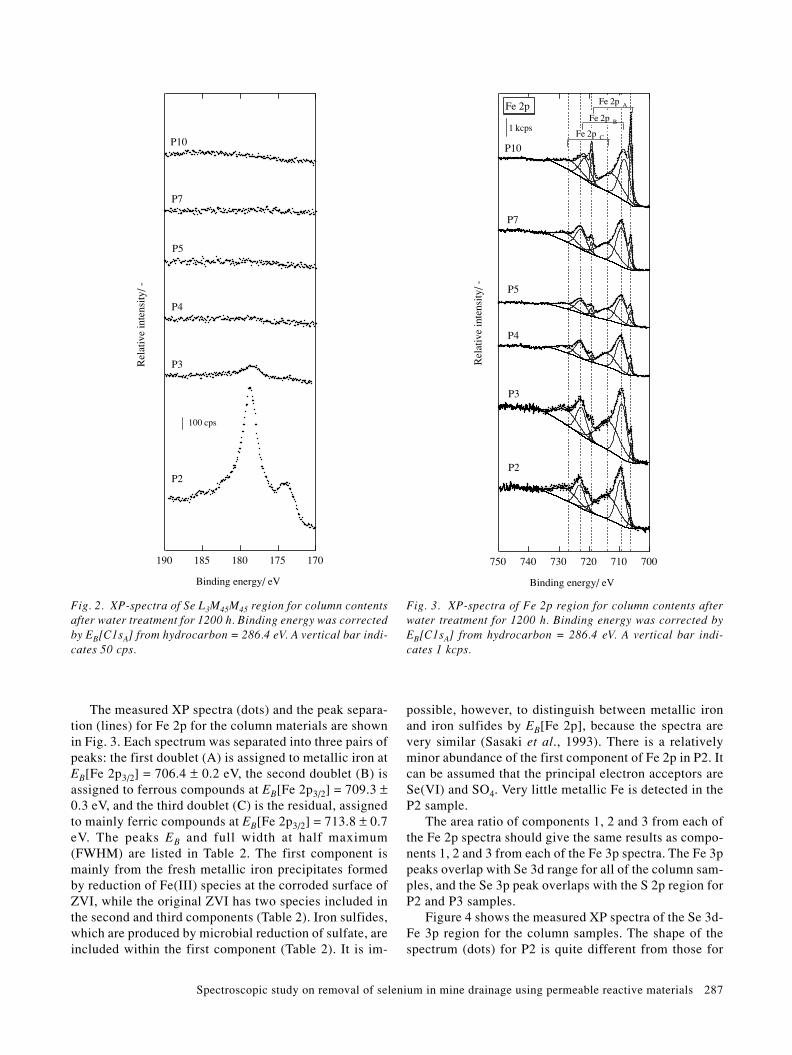
The Se L3M45M45 Auger spectra measured for the col-umn samples P2, P3, P4, P5, P7 and P10 are shown inFig. 2. There is no spectral interference from other ele-ments found in these samples. The spectra show that Sespecies are most abundant in the P2 sample. The P3 sam-ple has a trace amount of Se species. Samples P4~P10have very little Se.
Spectroscopic study on removal of selenium in mine drainage using permeable reactive materials 287
The measured XP spectra (dots) and the peak separa-tion (lines) for Fe 2p for the column materials are shownin Fig. 3. Each spectrum was separated into three pairs ofpeaks: the first doublet (A) is assigned to metallic iron atEB[Fe 2p3/2] = 706.4 ± 0.2 eV, the second doublet (B) isassigned to ferrous compounds at EB[Fe 2p3/2] = 709.3 ±0.3 eV, and the third doublet (C) is the residual, assignedto mainly ferric compounds at EB[Fe 2p3/2] = 713.8 ± 0.7eV. The peaks EB and full width at half maximum(FWHM) are listed in Table 2. The first component ismainly from the fresh metallic iron precipitates formedby reduction of Fe(III) species at the corroded surface ofZVI, while the original ZVI has two species included inthe second and third components (Table 2). Iron sulfides,which are produced by microbial reduction of sulfate, areincluded within the first component (Table 2). It is im-
possible, however, to distinguish between metallic ironand iron sulfides by EB[Fe 2p], because the spectra arevery similar (Sasaki et al., 1993). There is a relativelyminor abundance of the first component of Fe 2p in P2. Itcan be assumed that the principal electron acceptors areSe(VI) and SO4. Very little metallic Fe is detected in theP2 sample.
The area ratio of components 1, 2 and 3 from each ofthe Fe 2p spectra should give the same results as compo-nents 1, 2 and 3 from each of the Fe 3p spectra. The Fe 3ppeaks overlap with Se 3d range for all of the column sam-ples, and the Se 3p peak overlaps with the S 2p region forP2 and P3 samples.
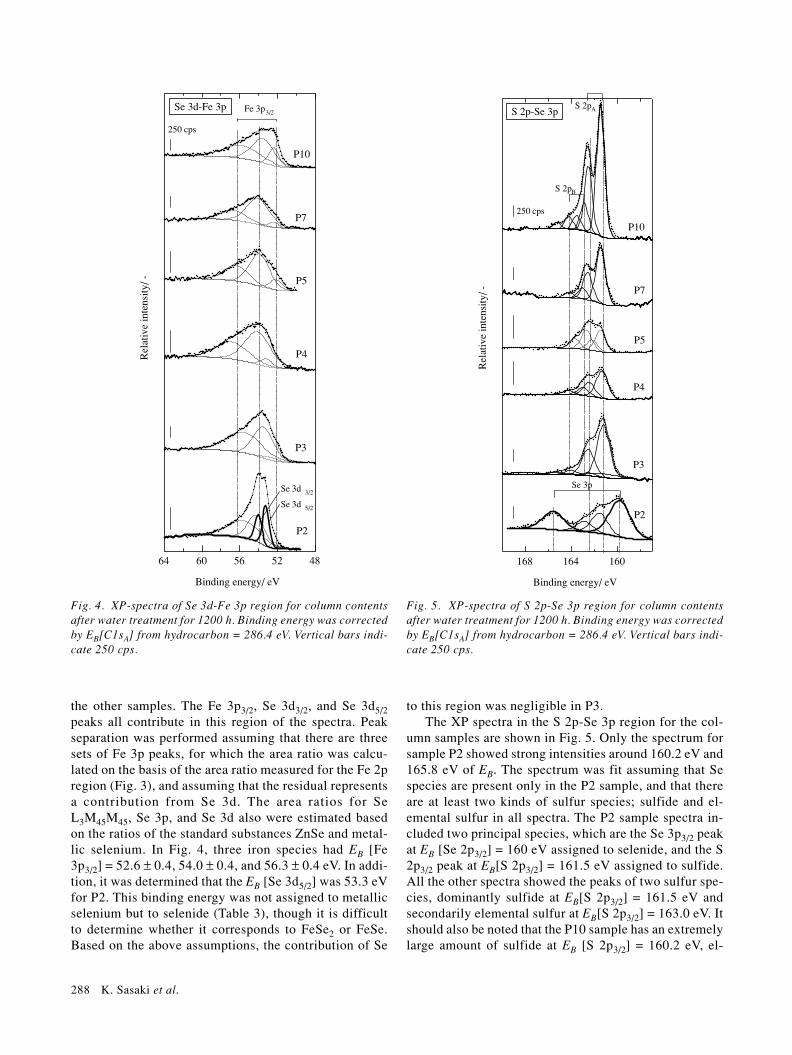
Figure 4 shows the measured XP spectra of the Se 3d-Fe 3p region for the column samples. The shape of thespectrum (dots) for P2 is quite different from those for
Rel
ativ
e in
tens
ity/ -
190 185 180 175 170
Binding energy/ eV
P2
P3
P4
P5
P7
P10
100 cps
Fig. 2. XP-spectra of Se L3M45M45 region for column contentsafter water treatment for 1200 h. Binding energy was correctedby EB[C1sA] from hydrocarbon = 286.4 eV. A vertical bar indi-cates 50 cps.
Fig. 3. XP-spectra of Fe 2p region for column contents afterwater treatment for 1200 h. Binding energy was corrected byEB[C1sA] from hydrocarbon = 286.4 eV. A vertical bar indi-cates 1 kcps.
Rel
ativ
e in
tens
ity/ -
750 740 730 720 710 700
Binding energy/ eV
P2
P3
P4
P5
P7
P10
Fe 2p
1 kcps
Fe 2p A
Fe 2p B
Fe 2p C
288 K. Sasaki et al.
the other samples. The Fe 3p3/2, Se 3d3/2, and Se 3d5/2peaks all contribute in this region of the spectra. Peakseparation was performed assuming that there are threesets of Fe 3p peaks, for which the area ratio was calcu-lated on the basis of the area ratio measured for the Fe 2pregion (Fig. 3), and assuming that the residual representsa contribution from Se 3d. The area ratios for SeL3M45M45, Se 3p, and Se 3d also were estimated basedon the ratios of the standard substances ZnSe and metal-lic selenium. In Fig. 4, three iron species had EB [Fe3p3/2] = 52.6 ± 0.4, 54.0 ± 0.4, and 56.3 ± 0.4 eV. In addi-tion, it was determined that the EB [Se 3d5/2] was 53.3 eVfor P2. This binding energy was not assigned to metallicselenium but to selenide (Table 3), though it is difficultto determine whether it corresponds to FeSe2 or FeSe.Based on the above assumptions, the contribution of Se
to this region was negligible in P3.The XP spectra in the S 2p-Se 3p region for the col-
umn samples are shown in Fig. 5. Only the spectrum forsample P2 showed strong intensities around 160.2 eV and165.8 eV of EB. The spectrum was fit assuming that Sespecies are present only in the P2 sample, and that thereare at least two kinds of sulfur species; sulfide and el-emental sulfur in all spectra. The P2 sample spectra in-cluded two principal species, which are the Se 3p3/2 peakat EB [Se 2p3/2] = 160 eV assigned to selenide, and the S2p3/2 peak at EB[S 2p3/2] = 161.5 eV assigned to sulfide.All the other spectra showed the peaks of two sulfur spe-cies, dominantly sulfide at EB[S 2p3/2] = 161.5 eV andsecondarily elemental sulfur at EB[S 2p3/2] = 163.0 eV. Itshould also be noted that the P10 sample has an extremelylarge amount of sulfide at EB [S 2p3/2] = 160.2 eV, el-
Rel
ativ
e in
tens
ity/ -
64 60 56 52 48
Binding energy/ eV
P2
P3
P4
P5
P7
P10
Se 3d-Fe 3p Fe 3p3/2
Se 3d 5/2
Se 3d 3/2
250 cps
Rel
ativ
e in
tens
ity/ -
168 164 160
Binding energy/ eV
P2
P4
P5
P7
P10
Se 3p
S 2pAS 2p-Se 3p
P3
S 2pB
250 cps
Fig. 4. XP-spectra of Se 3d-Fe 3p region for column contentsafter water treatment for 1200 h. Binding energy was correctedby EB[C1sA] from hydrocarbon = 286.4 eV. Vertical bars indi-cate 250 cps.
Fig. 5. XP-spectra of S 2p-Se 3p region for column contentsafter water treatment for 1200 h. Binding energy was correctedby EB[C1sA] from hydrocarbon = 286.4 eV. Vertical bars indi-cate 250 cps.

Spectroscopic study on removal of selenium in mine drainage using permeable reactive materials 289
Rel
ativ
e in
tens
ity/ -
292 288 284 280Binding energy/ eV
P2
C 1sC 1s A
C 1s B
C 1s C
P3
P10
P5
P7
P4
1 kcps
Rel
ativ
e in
tens
ity/ -
404 402 400 398 396Binding energy/ eV
N 1s
P2
P3
P4
P5
P7
P10
250 cps
Fig. 6. XP-spectra of C 1s region for column contents afterwater treatment for 1200 h. Binding energy was corrected byEB[C1sA] from hydrocarbon = 286.4 eV. A vertical bar indi-cates 1 kcps.
Fig. 7. XP-spectra of N 1s region for column contents afterwater treatment for 1200 h. Binding energy was corrected byEB[C1sA] from hydrocarbon = 286.4 eV. A vertical bar indi-cates 250 cps.
ent of the column depth. The binding energy of Ca 2p,EB[Ca 2p3/2], was 347.3 ± 0.16 eV, assigned to calciumcarbonate. The column effluent is saturated with respectto calcite and dolomite according to MINTEQA2 calcu-lations (Sasaki et al., in press). The binding energy of N1s, EB[N 1s], was 399.8 ± 0.07 eV (Fig. 7), which is as-signed to amine compounds probably derived from thewood chips or saw dust, and is not likely a product micro-biological reduction of nitrate and nitrite in the columnbecause the biological denitrification produces N2 notammonium (Konhauser, 2007). The binding energy forSi 2s, EB[Si 2s], was 153.3 ± 0.08 eV, independent of thecolumn depth, which is assigned to silicon oxides fromvery fine grains of silica sand and gravels. Sand and gravelwere included in the column mixture as unreactive com-ponents.
emental sulfur at EB[S 2p3/2] = 163 eV, and a trace amountof an oxide form of sulfur at EB[S 2p3/2] = 164.2 eV, whichmight indicate incomplete sulfate reduction in this sec-tion of the column.
The C 1s spectrum was separated into three compo-nents (Fig. 6): the first one (A) is assigned to long chainsof hydrocarbons, from air, pump oil vapor, reactants withwater and the tape holding the powder, at EB[C 1s] = 284.6eV, the second one (B) is assigned to alcohol compoundsat EB [C 1s] = 286.3 eV, and the third one (C) is assignedto carboxyl and ketone compounds at EB[C 1s] = 288.0eV (Herbert et al., 1998). The hydrocarbon intensity wasused to normalize the relative intensity of the other com-ponents.
Positions and relative intensities of Ca 2p, N 1s andSi 2s to the first C 1s peak were constant and independ-
290 K. Sasaki et al.
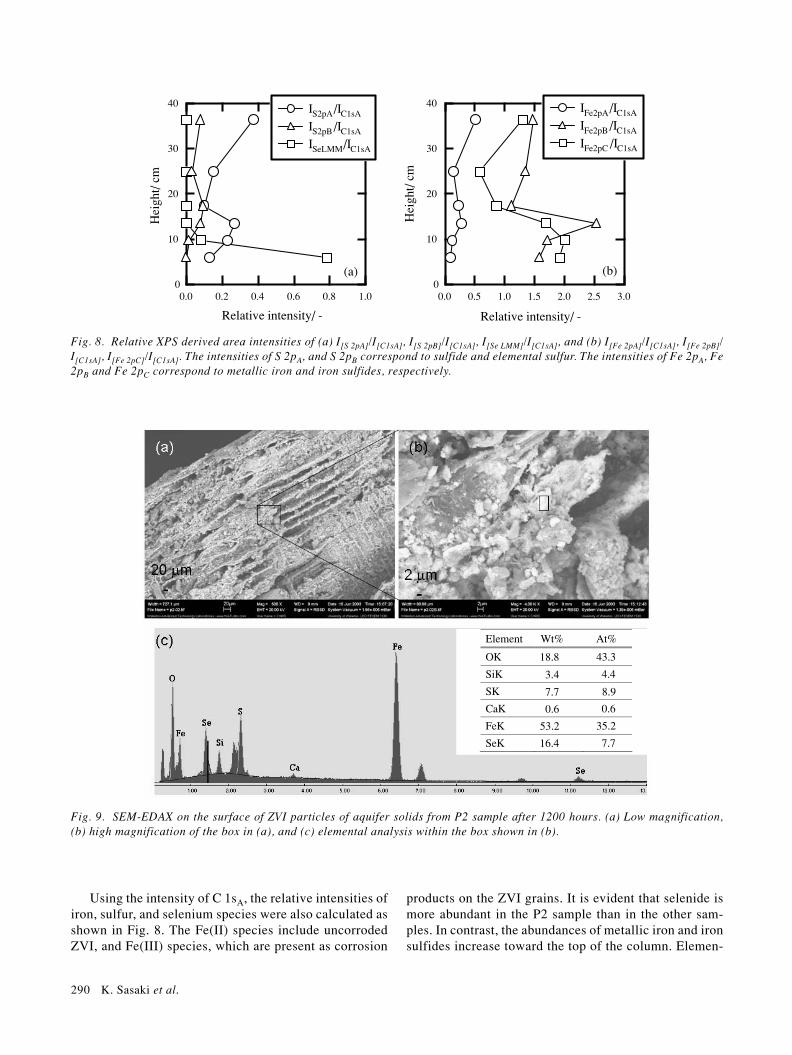
Using the intensity of C 1sA, the relative intensities ofiron, sulfur, and selenium species were also calculated asshown in Fig. 8. The Fe(II) species include uncorrodedZVI, and Fe(III) species, which are present as corrosion
products on the ZVI grains. It is evident that selenide ismore abundant in the P2 sample than in the other sam-ples. In contrast, the abundances of metallic iron and ironsulfides increase toward the top of the column. Elemen-
40
30
20
10
0
Hei
ght/
cm
1.00.80.60.40.20.0
Relative intensity/ -
IS2pA/IC1sA
IS2pB /IC1sA
ISeLMM/IC1sA
(a)
40
30
20
10
0
Hei
ght/
cm
3.02.52.01.51.00.50.0
Relative intensity/ -
IFe2pA/IC1sA
IFe2pB /IC1sA
IFe2pC /IC1sA
(b)
Element Wt%
OK 43.3
SiK 4.4
SK 8.9
CaK 0.6
FeK 35.2
SeK 7.7
At%
18.8
3.4
7.7
0.6
53.2
16.4
Fig. 8. Relative XPS derived area intensities of (a) I[S 2pA]/I[C1sA], I[S 2pB]/I[C1sA], I[Se LMM]/I[C1sA], and (b) I[Fe 2pA]/I[C1sA], I[Fe 2pB]/I[C1sA], I[Fe 2pC]/I[C1sA]. The intensities of S 2pA, and S 2pB correspond to sulfide and elemental sulfur. The intensities of Fe 2pA, Fe2pB and Fe 2pC correspond to metallic iron and iron sulfides, respectively.
Fig. 9. SEM-EDAX on the surface of ZVI particles of aquifer solids from P2 sample after 1200 hours. (a) Low magnification,(b) high magnification of the box in (a), and (c) elemental analysis within the box shown in (b).

Spectroscopic study on removal of selenium in mine drainage using permeable reactive materials 291
tal sulfur is much less abundant than sulfide. More el-emental sulfur was present in the P4~P10 samples thanin the P2 and P3 samples.
Figure 9 shows SEM images and EDAX analyses ofthe surfaces of ZVI particles from sample P2. The mor-phology of the ZVI is very porous with many pits, result-ing in a high surface area and potentially an abundanceof reaction sites (Fig. 9(a)). Figure 9(b) shows an enlarge-ment of framboidal particles, and a standardless semi-quantitative analysis for the selected area indicated ~8atom% Se (Fig. 9(c)). These high Se concentration wasdetected on framboidal particles in the P2 sample. HighFe concentrations may be due to the presence of iron com-pounds other than iron sulfides and iron selenides. It isassumed that Se deposition on the surface of the ZVI wascaused mainly by chemical reduction, because Se-reducing bacteria including Sulfurodpirillum barnesiii,Euterobactor cloacae, Thauera selenatis, Enterobactertaylorae and Citerobacter frendii have been reported tobe capable of reducing Se(VI) to insoluble Se(0) (Cantafioet al., 1996; Losi and Frankenberger, 1997; Oremland etal., 1999; Zahir et al., 2003; Zhang et al., 2004). A few
framboidal particles containing large amounts of Se werealso observed in the P3 sample materials. However, theoverall Se content was much lower in the P3 sample thanin the P2 sample.
Figure 10 shows an SEM image and EDAX analysisof two clusters of fresh precipitates on the surface of asilica sand particle from the P2 sample. Two points wereanalyzed by EDAX. Although the two morphologies aresimilar, the selenium contents were quite different. Clus-ter A has a Se/Fe atomic ratio of 0.8 whereas cluster Bhas a Se/Fe atomic ratio of 0.2. This observation suggeststhat Se is not always stoichiometrically involved in freshiron precipitates but partly associated with fresh iron pre-cipitates in the P2 sample. Elemental mapping of a thinsection reveals that the high concentration of Se is presentas needle-shaped particles which are up to a few microm-eters in length. These needles are most likely elementalselenium (Fig. 11). Besides the elemental Se particles,Se is predominantly associated with Fe, indicating thatSe in the P2 sample is deposited mostly in associationwith iron, and partly as elemental selenium. The ZVI re-moves oxygen in the column according to the reaction of
Fig. 10. SEM-EDAX of parts on the surface of silica sand particles from P2 sample after 1200 hours. (a) SEM image, (b)elemental spectra of A and B in (a), and (c) elemental compositions features A and B in (a).

292 K. Sasaki et al.
2Fe(0) + 2H2O + O2 = 2Fe2+ + 4OH–, and serves electrondonors by releasing hydrogen in the reaction of Fe(0) +2H2O = Fe2+ + 2OH– + H2, resulting in reduction ofselenate to selenide and in stimulation of anaerobic mi-croorganisms including sulfate-reducing bacteria andselenate-reducing bacteria. The magnitude of the micro-biological contribution to the precipitation of elementalselenium might be clarified by determination of the sele-nium isotopic ratios.
Different from the P2 and P3 samples, precipitates in
the P4, P7 and P10 samples are fibrous particles with noSe detected (Fig. 12). The P4 sample contains mainly ironsulfides with iron oxides as a secondary precipitate.
The P2 sample also was examined by Ramanspectroscopy to provide another indication of seleniumspeciation. Figure 13 shows the Raman spectra for the P2sample and the reference compounds. There is an observedbroad Raman band which has the maximum at 253.2cm–1 and shoulder peaks in the lower than the maximumposition in the P2 spectrum (Fig. 13(a)), which may indi-
5 m
(a) SEM
(b) Se
(c) Fe (f) Si
(e) Ca
(d) S (g) O
Fig. 11. Thin section SEM images and elemental mapping of Se, S, Fe, O, Si and Ca in aquifer solids from P2 samples after 1200hours.

Spectroscopic study on removal of selenium in mine drainage using permeable reactive materials 293
Fig. 13. Raman spectra of (a) the P2 sample, (b) ZnSe, and (c)metallic selenium.
40.660.8FeK
3.43.7CaK
23.920.6SK
2.82.1SiK
0.90.7AlK
28.412.2OK
At%Wt%Element
Inte
nsity
/ arb
. uni
t
600500400300200
Raman shift/ cm–1
(a) P2
(b) ZnSe
(c) metallic selenium
Fig. 12. SEM-EDAX on the surface of a fibrous particle on aquifer solids from P4 sample after 1200 hours. (a) SEM image and(b) elemental analysis of a star in (a).
cate that P2 sample contains selenide with minor metal-lic selenium. The observation of a greater abundance ofselenide appears to be consistent with the XPS results forselenium speciation. However, metallic selenium was notdetected by XPS, probably because the XPS measurementis the most surface-sensitive of the techniques used, withescape depths of ≤25 Å.
An integrated interpretation of the results from theXPS, SEM-EDX, and Raman spectroscopy studies sug-gest that Se is precipitated as an iron selenide likeferroselite on the surface of ZVI, and a very minor amountas elemental selenium inside the framboidal particles.Additionally it was confirmed that the surface of ZVIgranules was still in reactive phases of sulfides and Fe(0)over the Se-accumulated zone. The longevity of thepresent PRB column was estimated to be more than 75years, assuming that the contaminated groundwater plumehaving 2 mg dm–3 selenate as Se at an average of linearvelocity of 20 m per year is treated using the PRB, basedon the efficiency and capacity of ZVI for Se removal, aswell as sustenance of permeability (Sasaki et al., in press).The present observations further provided the direct as-surance that the surface of ZVI in upper zone is not cov-ered with less reactive and less soluble Fe(III)-bearingminerals but still reactive. The PRBs are known as “pas-sive” treatment of the contaminated groundwaters. The
present PRB designed with concept of chemical and bio-logical remediation shows that selenate would be returnedto the originally mineralogical phases like ferroselite andelemental selenium.

294 K. Sasaki et al.
Acknowledgments—Research support was provided by theJapan Society for the Promotion of Science (JSPS), by theCanada Research Chair program, by the Canadian Water Net-work, and by the NSERC Discovery Grant program. We arethankful to Prof. T. K. Leung for the XPS and SEM-EDX meas-urements conducted in the Department of Chemistry, the Uni-versity of Waterloo, to Dr. M. Odziemkowski for discussionwith the Raman spectroscopy, and to L. E. Groza, J. G. Bainand C. J. Hanton-Fong of the University of Waterloo for tech-nical support.
REFERENCES
Bahl, M. K. (1975) Relaxation during photoelectron and LMMAuger decay in arsenic and some of its compounds. J. Chem.Phys. 64(3), 1210–1218.
Blowes, D. W., Ptacek, C. J., Benner, S. G., McRae, C. W. T.,Bennett, T. A. and Puls, R. W. (2000) Treatment of inor-ganic contaminants using permeable reactive barriers. J.Contam. Hydrol. 45, 123–137.
Cahen, D., Ireland, P. J., Kazmerski, L. L. and Thiel, F. A. (1985)X-ray photoelectron and Auger spectroscopic analysis ofsurface treatment and electrochemical decomposition ofCuInSe2 photoelectrodes. J. Appl. Phys. 57(10), 4761–4771.
Canava, B., Vigneron, J., Etcheberry, A., Guillemoles, J. F. andLincot, D. (2002) High resolution XPS studies of Se chem-istry of a Cu(In, Ga)Se2 surface. Appl. Sur. Sci. 202, 8–14.
Cantafio, A. W., Hagen, K. D., Lewis, G. E., Bledsoe, T. L.,Nunan, K. M. and Macy, J. M. (1996) Pilot-scale seleniumbioremediation of San Joaquin drainage water with Thaueraselenatis. Appl. Environ. Microbiol. 62, 3298–3303.
Fishbein, L. (1991) Metals and Their Compounds in the Envi-ronment: Occurrence, Analysis, and Biological Relevance(Merian, E., ed.), 1153–1190, VCH, Weinheim.
Frankenberg, W. T. and Benson, S. (1994) Selenium in the En-vironment. Marcel Dekker, Inc., 456 pp.
Hamdadou, N., Bernede, J. C. and Khelil, A. (2002) Prepara-tion of iron selenide films by selenization technique. J.Crystal Growth 241, 313–319.
Herbert, R. B., Benner, S. G., Pratt, A. R. and Blowes, D. W.(1998) Surface chemistry and morphology of poorly crys-talline iron sulfides precipitated in media containing sulfate-reducing bacteria. Chem. Geol. 144, 87–97.
Islam, R. and Rao, D. R. (1996) X-ray photoelectronspectroscopy of Zn1–xCdxSe thin films. J. ElectronSpectrosc. 81, 69–77.
Iwakuro, H., Tatsuyama, C. and Ichimura, S. (1982) XPS andAES studies on the oxidation of layered semiconductorGaSe. Jpn. J. Appl. Phys. 21(1), 94–99.
Konhauser, K. (2007) Introduction to Geochemistry. BlackwellPublishing, MA, U.S.A., pp. 266–268.
Konno, H. and Nagayama, M. (1980) X-ray photoelectron spec-tra of hexavalent iron. J. Electron Spectrosc. Relat. Phenom.18, 341–343.
Konno, H., Sasaki, K., Tsunkawa, M., Takamori, T. and Fruichi,R. (1991) X-ray photoelectron spectroscopic analysis ofsurface products on pyrite formed by bacterial leaching.Bunseki Kagaku 40, 609–616.
Losi, M. E. and Frankenberger, W. T., Jr. (1997) Reduction ofselenium oxyanions by Enterobacter cloacae strain SLDaa-1: Isolation and growth of the bacterium and its expulsionof selenium particles. Appl. Environ. Microbiol. 63, 3079–3084.
Myneni, S. C. B., Tokunaga, T. K. and Brown, G. E., Jr. (1997)Abiotic selenium redox transformations in the presence ofFe(II, III) oxides. Science 278, 1106–1109.
Oremland, R. S., Blum, J. S., BindiI, A. B., Dowdle, P. R.,Herbel, M. and Stolz, J. F. (1999) Simultaneous reductionof nitrate and selenate by cell suspensions of selenium-res-pirating bacteria. Appl. Environ. Microbiol. 65, 4385–4392.
Presser, T. S. and Swan, W. C. (1990) Geochemical evidencefor Se mobilization by the weathering of pyretic shale, SanJoaquin Valley, California, U.S.A. Appl. Geochem. 5, 703–717.
Sasaki, K., Tsunekawa, M., Konno, H., Hirajima, T. andTakamori, T. (1993) Leaching behaviour and surface char-acterization of pyrite in bacterial leaching with Thiobacillusferrooxidans. J. Min. Mat. Proc. Inst. Jpn. 109, 29–35.
Sasaki, K., Blowes, D. W. and Ptacek, C. J. (in press) Immobi-lization of Se(VI) in mine drainage by permeable reactivebarriers: column performance. Appl. Geochem.
Scherer, M. M., Richer, S., Valentine, R. L. and Alvarez, P. J. J.(2000) Chemistry and microbiology of permeable reactivebarriers for in situ groundwater clean up. Critical Reviewsin Environmental Science and Technology 30, 363–411.
Shirley, D. A. (1972) High-resolution X-ray photoelectron spec-trum of the valence bands of gold. Phys. Rev. B5, 4709–4714.
Stolz, J. F. and Oremland, R. S. (1999) Bacterial respiration ofarsenic and selenium. FEMS Microbiology Reviews 23, 615–627.
Ueno, T. and Odajima, A. (1982) X-ray photoelectronspectroscopy of Ag- and Cu-doped amorphous As2Se3 andGeSe2. Jpn. J. Appl. Phys. 21(2), 230–234.
Wagner, C. D. (1990) Photoelectron and Auger energies andthe Auger parameter: A data set. Practical Surface Analysis(2nd ed.), (Beiggs, D. and Seah, M. P., eds.), John Wiley &Sons, Ltd., NJ.
Zahir, A. Z., Zhang, Y. Q. and Frankenberger, W. T., Jr. (2003)Fate of selenate metabolized by Enterobacter taylorae. J.Agric. Food Chem. 51, 3609–3613.
Zhang, Y., Siddique, T., Wang, J. and Frankenberger, W. T., Jr.(2004) Selenate reduction in water by Citerobacter freundiiisolated from a selenium-contaminated sediment. J. Agric.Food Chem. 52, 1594–1600.
Zhang, Y., Wang, J., Amrheim, C. and Frankenberger, W. T., Jr.(2005) Removal of selenium from water by zero valenceiron. J. Environ. Quality 34, 487–495.