spectroscopic investigation (ft-ir, ft-raman, uv and nmr ... · compound has two chlorine atoms and...
TRANSCRIPT

IOSR Journal of Applied Physics (IOSR-JAP)
e-ISSN: 2278-4861.Volume 9, Issue 4 Ver. II (Jul. – Aug. 2017), PP 42-58
www.iosrjournals.org
DOI: 10.9790/4861-0904024258 www.iosrjournals.org 42 | Page
Spectroscopic Investigation (FT-IR, FT-RAMAN, UV and NMR),
NBO, NLO Analysis and Fukui Function of 2, 5-Dichloroaniline
by DFT Calculations
*G.Shakila
1, Dr.H. Saleem
2
1Department of Physics, Bharathidasan Government College for Women, Puducherry-605003, India.
2Department of Physics, Annamalai University, Annamalainagar-608002, Tamilnadu, India.
Corresponding Author: G.Shakila
Abstract: The spectral characterization of 2,5- Dichloro aniline (2,5 DCA) were carried out by using FT-IR,
FT-Raman, the NMR and UV-Vis spectroscopic techniques. The simulated vibrational spectra of the molecule
are compared with the experimental spectra. The structural optimization has been performed on the title
molecule using HF and density functional theory (DFT) with basis sets 6-31+G(d,p) and 6-311++G(d,p). The
optimized bond parameters of 2,5 DCA were compared with the experimental data of related molecule. Using
Veda program, the vibrational wave number assignments were made on the basis of total energy distribution
(TED) calculations. To study the intra-molecular charge transfers within the molecule, the Lewis (bonding) and
Non-Lewis (anti-bonding) calculation was performed. The orbital gap of the molecule was determined from
HOMO and LUMO calculations. The Non-linear optical properties of the molecule were studied using first
hyperpolarizability calculation. The molecular electrostatic potential (MEP), chemical descriptors and thermo
dynamical properties of the molecule have also been calculated and analysed. In addition, the Mulliken atomic
charges and the 1H and
13C NMR chemical shift values of 2,5 DCA was calculated. Also the local reactivity of
the molecule was studied using the Fukui function.
Keywords: FT-IR, FT-Raman, NMR, UV analysis and Fukui function.
-------------------------------------------------------------------------------------------------------------------------------------- -
Date of Submission: 04-07-2017 Date of acceptance: 15-07-2017
----------------------------------------------------------------------------------------------------------------------------- ----------
I. Introduction
Aniline and its derivatives are widely used in chemical dye industries, to manufacture nano cables in
electronic industries, pesticides and also used for several industrial and commercial purposes [1]. Aniline is used
in the chemical industry for the synthesis of many compounds such as dye antioxidants, drugs, rubber
accelerators etc. Some of the derivatives of aniline molecules are used as local anaesthetics, since the amino
group in these molecules plays an important role in the interaction with the receptor. The investigation of the
molecular properties and the natures of chemical reaction of Aniline and its derivatives are of great importance.
Hence, the study on the molecular structures and the spectral investigation of aniline and substituted anilines are
carried out increasingly. The substitution of two chlorine atoms in aniline and the enhanced interaction between
the aromatic ring, chlorine atom and the amino group affects the charge distribution in the molecule. This
greatly leads to variations in the structural, electronic and vibrational properties [2]. Because of their
spectroscopic properties and chemical significance, various spectroscopic studies of halogen and methyl
substituted molecules were reported in many literatures [3,8].
Therefore, a complete spectroscopic study of the molecule 2,5 DCA has been reported using Ab initio
HF and DFT (B3LYP) Calculations. The vibrational assignments and the molecular, thermodynamic properties
of 2, 5-DCA was discussed and interpreted.
II. Experimental Details The molecule 2,5DCA is purchased from Sigma-Aldrich chemicals, USA and it was used for the
present investigation. The FT-IR spectrum in the range of 4000-400 cm-1
was recorded using KBr pellet
technique with a FT-IR-Shimadzu spectrometer. The spectrum was recorded in Central Instrumentation facility,
Pondicherry University. FT-Raman spectrum of the compound was also observed using Bruker IFS 66v
spectrophotometer equipped with a FRA 106 FT-Raman module accessory in the region 100-4000 cm-1
. The
FT-Raman spectrum was recorded in the same laboratory. The UV-Vis absorption spectrum of 2,5 DCA was
recorded in the range of 200-500 nm using a Shimadzu – 2600 spectrometer in the Department of Chemistry,
Jamal Mohamed College, Thiruchirappalli, Tamilnadu.

Spectroscopic Investigation (FT-IR, FT-RAMAN, UV and NMR), NBO, NLO Analysis and Fukui
DOI: 10.9790/4861-0904024258 www.iosrjournals.org 43 | Page
2.1. Quantum Chemical Calculations
The entire calculations of 2,5 DCA were performed at HF and B3LYP functional combined with
standard 6-31+G and 6-311++G basis sets on a personal computer using Gaussian 09W program package. The
optimized structural parameters were used in the vibrational frequencies calculation at different level of theories.
The output of this program results in the data such as, the theoretical wave numbers, reduced mass, force
constant, infrared intensity, Raman activity, and depolarization ratios. To compare the theoretical and the
experimental wave numbers, the scaling factors have been introduced. After scaling by suitable scale factors, the
deviation from the experimental wave numbers is ±10 cm-1
with a few exceptions. The assignments of
calculated vibrational modes were done on basis of the TED calculation using VEDA4 program [9]. Gauss view
Program [10] was used for the verification of the vibrational modes assignment from the visual animation.
The electronic transition of the title molecule was calculated from UV-Visible analysis for the
optimized molecule with the time dependent DFT at B3LYP/6311++G(d,p) level in gas phase and solvent
(DMSO and chloroform). Furthermore, the nonlinear optic (NLO) activity of title molecule such as, the dipole
moment, linear polarizability and first hyperpolarizability were calculated. Moreover, the thermodynamic
functions namely, the heat capacity, entropy, and enthalpy were investigated for the different temperatures from
the B3LYP calculation of the molecule 2,5 DCA. Using the gauge independent atomic orbital method, the 1H,
13C nuclear magnetic resonance chemical shifts of the molecule were calculated in chloroform and compared
with experimental results.
III. Results And Discussion 3.1. Molecular Geometry:
The total energy, zero point vibrational energy, rotational constant and entropy obtained by the DFT
structure optimization based on B3LYP/6-311++G basis set of 2,5- DCA is listed in Table 1.The optimized
molecular structure of the molecule belonging to Cs point group symmetry is depicted in Fig.1. The title
compound has two chlorine atoms and amino group connected with Benzene ring. The parameters namely bond
lengths, bond angles and dihedral angles at HF/ 6-31+G and B3LYP/ 6-311++G (d, p) levels are given in the
Table .2. These calculated data of 2, 5-DCA are compared with the experimental data of aniline and Nitro
aniline.
Table 1 The calculated total energy (a.u), zero point vibrational energies (Kcal/mol), rotational constants (GHz)
and entropy (cal/mol K-1
) for 2,5 DCA.
Parameters B3LYP/6-311++G(d,p)
Total Energies -1206.93393495
Zero-point Energy 61.30972 (Kcal/Mol)
Rotational constants (GHZ): 2.92449
0.63488
0.52180
Entropy
Total 89.618
Translational 41.137
Rotational 30.185
Vibrational 18.296
Fig 1. Molecular structure of 2,5 DCA

Spectroscopic Investigation (FT-IR, FT-RAMAN, UV and NMR), NBO, NLO Analysis and Fukui
DOI: 10.9790/4861-0904024258 www.iosrjournals.org 44 | Page
From the Table 2, it is evident that majority of the bond lengths are slightly more than the experimental
values. Many authors [11, 12] investigated the variations in the wave numbers or C-H bond length due to
distribution of charge on the carbon atom of the benzene ring. The substitution of a halogen for hydrogen in
benzene ring decreases the electron density at the ring carbon atom. To verify this, the C-H and C-Cl bond
lengths were compared with the respective experimental values of Aniline and Nitro aniline [13]. The average
values of bond lengths of C–C and C–H calculated by HF method are 1.387 and 1.074 Å, respectively. Also that
by B3LYP method is 1.395 and 1.082 Å, respectively.
The benzene breakdown due to the elongation of C1–C2 (~1.40 Å) and C1–C6 (~1.40 Å) from the
remaining C–C bond lengths (~1.39 Å) for the B3LYP/6-311+G (d, p) method. The negative deviation of C2–
C1–C6 (117◦) and positive deviation of C1–C2–C3 (121°) from the normal value of 120° shows that the benzene
ring is slightly distorted. The C–N bond distance of 1.3823 Å by B3LYP/ 6-311+G (d, p) method shows just
0.02 Å smaller than the experimental value of 1.402 Å, for Aniline [13]. This is probably due to the electron
withdrawing property of chlorine. Substitution of chlorine atoms at the position of the hydrogen atoms in the
ring reduces the electron density at the ring attached to N. Thus, the attraction of ring carbon atom is more on
the valence electron cloud of nitrogen atom, causing increase in C–N force constant and decrease in the
corresponding bond length.
The C–Cl bond length increases when the H atom is replaced by Cl atom. This is observed even in
benzene derivatives [14]. The C2–Cl10 bond length is found to be 1.7467 Å (HF) and 1.7627 Å (B3LYP). The
C5–Cl11 bond length is found to be 1.7414 Å (HF) and 1.7591 Å (B3LYP). G.D.Lister et al. [13] calculated this
bond length to be 1.784 Å for Aniline by using force field calculations.
3.2. Vibrational assignments
The title molecule has 14 atoms and has 36 normal vibrational modes. The modes that are in the plane of the
molecule are represented as A’ and out of plane as A’’ Thus the 36 normal modes of vibrations are distributed
as
Γvib = 24 A’ + 12A’’ (1)
To study the vibrational assignment of the molecule, the TED calculation is performed and is compared with
theoretically scaled wave numbers by B3LYP method. The theoretical and experimental infrared and Raman
spectra of 2,5-DCA was shown in Fig.2 and 3 respectively. The observed, scaled theoretical frequencies, the IR
Intensities and Raman Activities using DFT (B3LYP) with 6-311++G(d,p) basis set with TEDs were listed in
Table 3.
Table 2 Optimized geometric parameters of 2,5 DCA Bond parameter HF/6-31+G(d,p) B3LYP/6-311++G (d,p) Experimental Value
Bond length(Å) Aniline Nitro aniline
C1-C2 1.3939 1.4062 1.394 1.408
C1-C6 1.3979 1.4055 1.397 1.415
C1-N12 1.38 1.3823 1.402 1.371
C2-C3 1.3828 1.3878 1.396 1.377
C2-CL10 1.7467 1.7627 1.745
C3-C4 1.3827 1.3918 - 1.390
C3-H7 1.074 1.0826 - 0.95
C4-C5 1.3848 1.3915 - 1.395
C4-H8 1.0726 1.0812 1.082
C5-C6 1.3775 1.386 1.394 1.373
C5-CL11 1.7414 1.7591 1.745 -
C6-H9 1.0742 1.0832 1.08 0.83
N12-H13 0.9946 1.0078 1.001 0.96
N12-H14 0.9945 1.0087 - -
Bond angles(°)
C2-C1-C6 117.5914 117.3229 118.92 118.9
C2-C1-N12 122.3272 121.9738 - 121.2
C6-C1-N12 120.0341 120.6565 - 119.9
C1-C2-C3 121.3307 121.6678 - 120.8
C1-C2-CL10 119.7675 119.1054 - -
C3-C2-CL10 118.9016 119.2263 120.70 -
C2-C3-C4 120.8051 120.5631 - 119.2
C2-C3-H7 119.1473 119.2867 - 118
C4-C3-H7 120.0475 120.1499 - 115.0
C3-C4-C5 118.0282 118.0976 - 121.2
C3-C4-H8 121.0094 120.9618 - -

Spectroscopic Investigation (FT-IR, FT-RAMAN, UV and NMR), NBO, NLO Analysis and Fukui
DOI: 10.9790/4861-0904024258 www.iosrjournals.org 45 | Page
4000 3500 3000 2500 2000 1500 1000 500
0
20
40
60
80
100
FT-IR/EXPERIMENTAL
T
ran
sm
itta
nce (
%)
Wavenumber (cm-1)
Fig.2 The Theoretical and Experimental IR spectra of 2,5 DCA
4000 3500 3000 2500 2000 1500 1000 500 0
0.00
0.02
0.04
0.06
0.08
0.10RAMAN/EXPERIMENTAL
Ram
an
In
ten
sit
y
Wavenumber (cm-1)
3500 3000 2500 2000 1500 1000 500 0
0
1
2
3
4
5
6
7 RAMAN/B3LYP/6-311++G(d,p)
Ram
an
In
ten
sit
y
Wavenumber (cm-1)
Fig.3 The Theoretical and Experimental Raman spectra of 2,5 DCA
3.2.1. C–H vibrations
In aromatic hydrocarbons, various C-H stretching vibration usually appear in the region 3100 – 3000
cm-1
[15-17]. In 2,5 DCA, three bands at 3221, 3194 and 3188 cm-1
in the IR region were assigned to C-H ring
stretching vibrations. The respective calculated unscaled values are 3216, 3196 and 3188 cm-1
. It is evident that
all the C-H stretching vibrations in IR region appear in the higher frequency range due to chlorine atom and
nitrogen atom. The C-H in-plane bending vibrations in both FT-IR and Raman fall in the region 1290-900 cm-1
.
The modes at 1516, 1471, 1354, 1277, 1207 and 1117 cm-1
are due to C-H in-plane bending vibrations. The
modes at 1516, 1471 and 1354 cm-1
are outside the expected range, due to Cl atom and NH 2 group. The band at
1516 cm-1
is described as a mixed mode (mode no.28) with PED 16% and 1471 cm-1
(mode no.27) with TED
21%. From TED calculations it is observed that all six C-H in-plane bending vibrations are described as mixed
modes. Compared with the theoretically computed unscaled frequencies by B3LYP/6-311++G (d, p) method for
C-H in-plane bending vibrations, the corresponding observed vibrations are obtained in the higher frequency
end except the value at 1516 cm-1
.This is because of the chlorine atom and nitrogen atom. For the mode no.24
which has IR band at1277 cm-1
, Raman band is also produced at 1266 cm-1
.
The C-H out-of-plane bending vibrations of Aniline derivatives appear in the range 1000-675 cm-1
[18-
20]. In this title compound, one IR band at 944 cm-1
is observed as C-H out-of-plane bending vibrations. This C-
H out-of-plane bending vibration agrees well with the literature values and also well supported by TED values.
3.2.2. Ring vibrations
The ring C=C and C-C stretching vibrations, mostly appear in the region 1200-1625 cm-1
[21]. The
C=C stretching vibrational mode of the present compound are observed at 1638, 1597, 1516, 1471 and1399 cm-1
in the IR region. All these assignments coincide well with the literature data and calculated unscaled values. The
bands at 1277,1207 and 1117, 1084 and 1066 cm-1
are due to C-C stretching vibrations. The C=C stretching
vibrations, shifts to the higher wave number range and it is due to the presence of NH2 atoms. There is a
considerable decrease in wave numbers of C-C stretching vibrations, when compared to literature values.
Table 3 Detailed vibrational assignment of 2,5 DCA using B3LYP/6-311++G(d,p) level along with TED
calculation.
4000 3500 3000 2500 2000 1500 1000 500
600
500
400
300
200
100
0
IR In
ten
sity
Wavenumber cm-1
IR/B3LYP/6-311++G(d,p)

Spectroscopic Investigation (FT-IR, FT-RAMAN, UV and NMR), NBO, NLO Analysis and Fukui
DOI: 10.9790/4861-0904024258 www.iosrjournals.org 46 | Page
S.No Calculated
Frequencies(cm-1)
Observed
Frequencies(cm-1)
IR Raman
Intensity Intensity Vibrational assignments
Un
Scaled Scaled FT-IR
FT-
Raman Abs. Abs.
1 98 94.75 100.00 101.61 0.42 0.23 τC1C6C4C5(25)+ τC1C6C2C3(40)+ ΓCL10C1C3C2(17)+ ΓCL11C4C5C6(15)
2 206 199.16 197.00
4.14 0.59
τC1C6C4C5(22)+ τC1C6C2C3(34)+
ΓCL11C4C5C6(18)+ ΓN12C1C2C6(13)
3 220 212.70 224.00
0.45 0.06 βC3C2CL10(38)+ βC6C5CL11(47)
4 272 262.86 280.00 279.38 1.71 2.00 βC6C1N12(30)+ βC3C2CL10(31)+ βC6C5CL11(17)
5 299 288.98 297.00
6.64 0.20
τC2C3C4C5(15)+ ΓCL10C1C3C2(46)+
ΓC4C5C6CL11(22)
6 326 315.46
327.63 0.08 10.39 νCL10C2(23)+ νCL11C5(22)+ βC6C5C4(25)
7 360 348.48 367.00
14.66 0.48 τN12H13C1 C2 (46) + τH14C1C2C1N12(35)
8 447 432.62 448.00
58.32 0.22
τC1C6C4C5(22) + τC2C3C4C5(25)+
ΓN12C1C2C6(11)
9 451 436.32
11.88 1.17 νCL11C5(14)+ βC6C1N12(37)+ βC6C5CL11(13) +βC3C2CL10(12)
10 476 460.20 479.40
206.23 1.33 τN12H13C1 C2 (24)+ τH14C1C2C1N12(45)
11 545 526.91 521.50
26.16 2.83
νCL10C2(16)+ νCL11C5(15)+ βC1C2C6(26)+
βC6C1N12(13)
12 580 560.74
580.25 15.80 7.52 νCL10C2(21)+ βC4C3C2(16)+ βC2C1C6(26)
13 604 584.40 620.50
10.53 0.35
τH8C4C5C6(16)+ τC2C3C4C5(15)+
ΓCL11C4C5C6(26)+ ΓN12C1C2C6(25)
14 716 692.52
705.78 0.47 19.37 νC1C2(15)+ βC4C5C6(14)+ βC4C3C2(30)
15 734 709.31 738.70
0.20 1.33 τN12H9C1C6(12) )+ τC1C6C4C5(10) + τC2C3C4C5(18)+ ΓN12C1C2C6(34)
16 797 770.47 799.00
30.82 0.16 ΓC3C4C5H7(28)+τH8C4C5CL11(61)
17 856 827.48 847.20
24.12 0.36 τC6C1N12H9(77)
18 913 882.99 959.30
44.58 1.16 νN12C1(18)+ νCL11C5(18)+ βC4C5C6(27)
19 944 912.85 1010.50
0.74 0.14
τC3C4C5H7(50)+τH8C4C5C6(27)
+τC2C3C4C5(16)
20 1044 1009.79 1066.10 1039.68 32.83 21.66
νC1C6(20)+ νCL10C2(11)+ βC4C3C2(12)+
βC2C1C6(14)
21 1089 1052.66 1084.00
107.57 0.34 νC1C2(14)+ βH13N12C1(33)
22 1113 1076.41 1117.00
3.87 14.75
νC4C3(16) + νC5C4(14) + βH13N12C1(15)
+βH9C6C1(22)
23 1161 1122.54 1207.90
7.82 1.43 νC4C3(21)+ βH7C3C4(15)+ βH8C4C5(38)
24 1288 1245.33 1277.90 1266.72 15.56 7.71 νC2C3(33) )+ νN12C1(18)+ βH7C3C4(28)
25 1300 1257.07 1354.70
15.27 4.28 νN12C1(10) )+ βH8C4C5(15)+ βH9C6C1(40)
26 1337 1292.72 1399.30
12.12 6.82
νC6C5(19)+ νC4C3(15)+ νC5C4(11)
+νC1C2(16)
27 1445 1396.64 1471.20
33.76 0.48 νC5C6(18)+ νC1C6(15)+ νN12C1(14)+ βH8C4C5(21)
28 1512 1461.75 1516.90
118.71 1.94
νC2C3(11)+ νC4C5(11)+ βH7C3C4(21)+
βH9C6C1(16)
29 1599 1546.27 1597.20
12.97 11.12 νC3C4(19)+ νC4C5(18)+ νC1C6(18)+ νC1C2(17)
30 1624 1570.45 1638.90
29.88 18.96 νC2C3(18)+ νC5C6(20)+ βH13N12H14(19)
31 1658 1603.20 1665.00 1612.36 206.51 22.98 βH13N12H14(64)
32 3188 3081.69 3188.00
2.18 66.57 νC6H9(99)
33 3196 3089.50 3194.00
0.60 70.55 νC3H7(85)+ νC4H8(14)
34 3216 3211.00 3221.00
0.14 128.76 νC3H7(14)+ νC4H8(86)
35 3582 3589.00 3576.00
42.04 170.12 νN12H13(43) )+ νN12H14(56)
36 3688 3693.00 3699.00
34.41 40.77 νN12H13(56)+ νN12H14(43)
The βC4C5C6(27) CCC in-plane bending mode in FT-IR region is observed at 959 cm-1
(mode no.18)
and that corresponding to calculation is 913 cm-1
. The βC1C2C6(26) and βC2C3C4(16) vibrations are observed at
580 cm-1
in FT-Raman and the corresponding calculated value is 580 cm-1
(mode no.12). The βC4C5C6 (14) and
βC4C3C2 (30) vibrations is observed at 705 cm-1
(mode no.14) in FT-Raman region and the βC1C2C6 (26)
vibration is observed 521 cm-1
(mode no.11) in FT-IR region and the respective theoretical value is 545 cm-1
.
Also the βC6C5C4 (25) vibration is observed in FT-Raman region at327 cm-1
and that of the calculated value is
326 cm-1
(mode no.6). The CCC in-plane bending vibrations are in excellent agreement with the literature data
[22].
The CCC FT-IR twisting vibrations are observed at 1010,620 and297 cm-1
and the respective calculated
values are 944, 604 and299 cm-1
(mode nos.19, 13 and 5). The τC3C4C5H7 (50) and τH8C4C5C6 (27) vibrations
also contributes to the mode no.19.The τH8C4C5C6 (16) and τC2C3C4C5 (15) contributes to wave number 620

Spectroscopic Investigation (FT-IR, FT-RAMAN, UV and NMR), NBO, NLO Analysis and Fukui
DOI: 10.9790/4861-0904024258 www.iosrjournals.org 47 | Page
cm-1
(mode no.13). The TED contribution of C1C6C4C5 twisting vibration is 47% and that of the C1C6C2C3
twisting vibration is 74%.
3.2.3. N-H vibrations
In aromatic compounds, N-H stretching vibration mostly occur in the region 3500-3300 cm−1
. The anti
symmetric NH2 stretching vibrations is observed in the range 3500–3420 cm-1
, while the symmetric stretching
appeared in the range 3420 - 3340cm−1
[23–26]. The two NH2 anti symmetric stretching vibrations are
observed in IR spectra at 3699 and 3576 cm-1
, respectively in this study. The theoretical values are 3688 and
3582 cm-1
(mode no.36 and 35) respectively. The TED of both of these modes is contributing 99% for the anti
symmetric NH2 stretching vibrations. The assignment proposed in this case is in line with the earlier works and
it is a unique occurrence of NH2.
For aromatic compounds, the in-plane bending deformation vibration of the NH2 group appear in the
region 1650-1580 cm-1
[27] . Two bands are observed in this case in IR region at 1665 and 1638 cm-1
(mode
no.31 and 30) for this NH2 in-plane bending. The out-of-plane NH2 deformation vibration is usually observed in
the region 775 – 660 cm1 [28]. The NH2 deformation is found at 847 cm
-1 (mode no.17) in this study. The wave
number value of this vibration is higher than the literature value, and it may be due to the substitute of Cl atom.
Also the modes observed at 738 and 479 cm-1
(mode no.15 and 10) are attributed toNH2 twisting vibration and
the corresponding theoretical value is 734 and 476 cm-1
. The rocking mode (mode no.21) is also observed at
1084 cm-1
in the FT-IR region. Also all the assignments of NH2 group are in line with the literature data (23-26).
3.2.4. Carbon–nitrogen vibrations
The C-N stretching vibrations of amino group appear in the region 1382-1266 cm-1
[29-31].The FT-IR
C-N stretching band is observed at 1277 and 1354 cm-1
and the FT-Raman at 1266 cm-1
. These assignments
agree well with the reported values. The TED calculation of C-N stretching predicts that, these modes are mixed
modes. The twisting mode of C6C1N12H9 is observed at847 cm-1
in FT-IR region with TED value of 77% and it
is a pure mode (mode no.17).
3.2.5. C–Cl vibration
According to earlier works [32-35], strong characteristic absorptions due to the C-Cl stretching motion
are found at 1066, 959 and 521 cm-1
in FT-IR (mode no.20, 18 and 11) and in FT-Raman at 580 cm-1
(mode
no.12).They are produced as a mixed mode because of the substitution of heavy atoms. But the C-Br
stretching vibration gives generally strong band in the region 650-485 cm-1
[36-38]. The bands appearing at 280
and 224 cm-1
(mode no.4&3) are due to C-Cl in-plane vibration.and the out-plane of C-Cl is observed at 297,197
and 100 cm-1
(mode no.5,2&1). This observation indicates that the C-Cl in-plane and out-plane bending
vibrations are deviated appreciably and influenced by the substitution in the ring.
3.3. Homo-Lumo analysis
The highest occupied molecular orbitals (HOMOs) and lowest unoccupied molecular orbitals
(LUMOs) are called frontier molecular orbitals. The HOMO-LUMO are the main orbitals responsible for
chemical stabiity. The HOMO energy describes the ability to donate an electron and LUMO energy describes
the ability to obtain an electron. The orbital gap between HOMO and LUMO is an important parameter in
determining the molecular chemical stability [39], Optical properties [40] and biological activity [41], Kinetic
stability and chemical softness-hardness of a compound. The chemical hardness is a good indicator of the
chemical stability. The small orbital gap of the molecule is associated with high chemical reactivity and low
kinetic stability.
The HOMO-LUMO orbitals of 2,5 DCA calculated in gas phase using B3LYP/6-311++G(d,p) is
shown in Fig.4. In addition, HOMO-2, HOMO-1, LUMO+2 and LUMO+1 molecular orbitals were represented
in the Fig .4. The calculated energy values of HUMO, HOMO-1 and HUMO-2 are -6.2667 eV,-7.0563eV and -
8.6288 eV respectively. The calculated energy values of LUMO, LUMO-1 and LUMO-2 are -0.9901 eV,-
0.5518eV and -0.4233 eV respectively. The energy gap value between the HOMO and LUMO is 5.2766 eV.
The green and red colors represent positive phase and negative phase respectively. It is clear from the
figure that, the LUMO of the compound represents charge density localized on the ring, but HOMO represents
charge distribution on the entire molecule. Both the HOMO and LUMO are mostly antibonding type orbitals.

Spectroscopic Investigation (FT-IR, FT-RAMAN, UV and NMR), NBO, NLO Analysis and Fukui
DOI: 10.9790/4861-0904024258 www.iosrjournals.org 48 | Page
Homo = -6.2667 eV Lumo = -0.9901 eV
Energy gap = 5.2766 eV
Homo-1 = -7.0563 eV Lumo+1 = -O.5518 eV
Homo-2 = -8.6288 eV Lumo+2 = -0.4233 eV
Fig.4 The Homo-Lumo diagram of 2,5DCA
3.4. Global softness and Local region reactivity
Molecular charge distribution, molecular orbital surfaces and Homo-Lumo energies are used as
reactivity descriptors in DFT study. Besides these reactivity descriptors, there are a set of the chemical reactivity
descriptors of molecules [42, 43] and they are calculated using koopman’s theorem for closed-shell molecules as
follows: The global hardness of the molecule is the measure of resistance of an atom to a charge transfer and is
given by:
η= (I-A)/2 (2)
The chemical potential of the molecule is:
μ = - (I+A)/2 (3)
The global softness of the molecule describes the capacity of an atom or group of atoms to receive electrons and
is defined by:
S=1/2η (4)
The electro negativity of the molecule is the measure of ability of an electron or group of atoms to attract
electrons towards it and is given by:
χ= (I+A)/2 (5)
The electrophilicity index of the molecule is:
ω=μ2/2η (6)
A high value of electrophilicity index describes a good electrophile, while a small value of
electrophilicity index describes a good nucleophile. Where A is the ionization potential and I is the electron
affinity of the molecule. I and A can be defined through HOMO and LUMO orbital energies as I=-EHOMOand
A=-ELOMO.The electron affinity I and Ionization potential A of the molecule 2,5 DCA is calculated by basis set
B3LYP/6-311++G(d,p). The values of the softness, hardness, chemical potential, electro negativity and,
electrophilicity index of the molecule is calculated as 0.1895 eV-1
, 2.6383eV, -3.6284eV, 3.6284eV, and
2.4950eV respectively. The soft molecule has a small HOMO-LUMO gap and that of the hard molecule is large.
The hard molecules are not easily polarizable than soft one, since they require more energy to excite the levels.

Spectroscopic Investigation (FT-IR, FT-RAMAN, UV and NMR), NBO, NLO Analysis and Fukui
DOI: 10.9790/4861-0904024258 www.iosrjournals.org 49 | Page
Fukui indices are measurement of chemical reactivity, indicator of reactive regions and the
nucleophilic and electrophilic reaction of the molecules. The regions of the molecule where the fukui function
are large are chemically softer than the regions where the fukui function is small. It is also used to recognize the
electron acceptor center and donor centers. If f+ for any given site is positive, then it is the preferred site for
nucleophilic attack and the negative value of f- implies electrophilic attack.
The fukui function for addition of electron to a molecule is given by:
f+ (r) = ρN+1 (r) - ρN (r) (7)
The fukui function for removal of electron from a molecule is given by:
f- (r) = ρN (r) - ρN-1 (r) (8)
The f+ function represents the initial part of a nucleophilic reaction. The f-, on the other hand,
represents the initial part of an electrophilic reaction. The fukui function (f), global and local softness (S) and
global and local electrophilicity index (ω) of 2,5 DCA is presented in Table 4.From the Table, it is seen that the
atoms C1,C3 and C6 are good nucleophiles having negative local electrophilic index ∆ω and they are ready to
donate electron pair to form a bond. That is they are ready for electrophilic attack. The atoms C2,C4 and C5 are
good electrophiles having positive local electrophilic index ∆ω and they are ready to accept electron pair to a
form a bond. That is they are ready for nucleophilic attack.
Table 4: Fukui function and global and local softness, and electrophilicity index of 2,5DCA f+ = (q+1) - q f- = q - (q-1) Δf =(f+) -(f-) ΔS=Δf Sgs Δω=Δf ωei
-0.764744 0.546898 -1.311642 -0.2485562 -3.272547
0.681082 -0.635724 1.316806 0.24953474 3.285431
0.373258 0.541425 -0.168167 -0.0318676 -0.419577
0.148295 -0.228919 0.377214 0.07148205 0.9411489
-0.005294 -1.462288 1.456994 0.27610036 3.6352
-0.262823 0.151584 -0.414407 -0.0785301 -1.033945
∆S = local softness, Sgs- global softeness; -∆ω local electophilic index, ωgei- global electrophilic index.
Also the Gauss sum 2.2 program is used to calculate the group contribution to molecular orbitals and to
represent the density of states DOS spectrum of 2,5 DCA. It is shown in Fig.5. The spectrum is used to explain
the contribution of electrons to the conduction and valence band. The spectrum gives idea about how many
states are available at certain energy states. The lines at the starting end of the energy axis of the plot that is from
-20 ev to -5 ev, are called filled orbital and from -5 ev to 0 ev, are called virtual orbital. The virtual orbital are
not occupied and are also called acceptor orbital, whereas the filled orbital are called donor orbital. A high
intensity DOS at a specific energy levels means that there are many states available for occupation. A DOS of
zero intensity represents that no states can be occupied by the system. The variation in the peak height indicates
the movement of electrons between the C=C and C-C in the ring of the molecule.
Fig.5 DOS Spectrum of 2,5 DCA
3.5. Molecular Electrostatic Potential
Spectroscopic Investigation (FT-IR, FT-RAMAN, UV and NMR), NBO, NLO Analysis and Fukui
DOI: 10.9790/4861-0904024258 www.iosrjournals.org 50 | Page
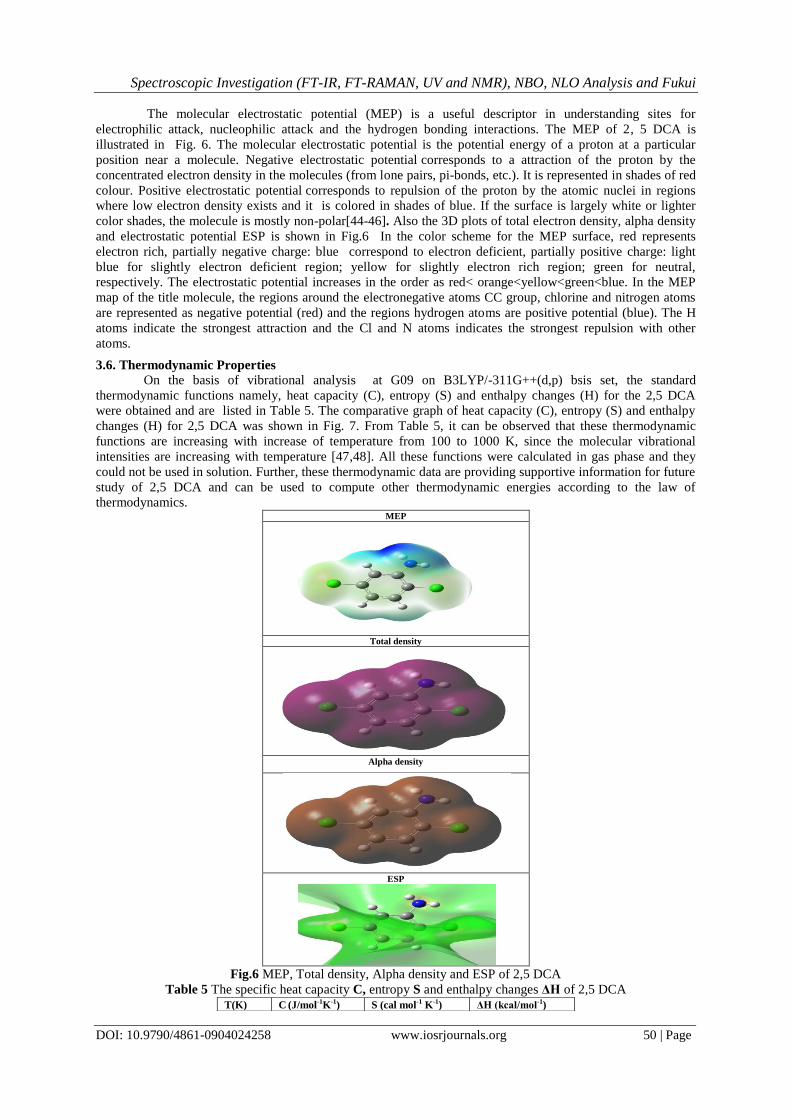
The molecular electrostatic potential (MEP) is a useful descriptor in understanding sites for
electrophilic attack, nucleophilic attack and the hydrogen bonding interactions. The MEP of 2, 5 DCA is
illustrated in Fig. 6. The molecular electrostatic potential is the potential energy of a proton at a particular
position near a molecule. Negative electrostatic potential corresponds to a attraction of the proton by the
concentrated electron density in the molecules (from lone pairs, pi-bonds, etc.). It is represented in shades of red
colour. Positive electrostatic potential corresponds to repulsion of the proton by the atomic nuclei in regions
where low electron density exists and it is colored in shades of blue. If the surface is largely white or lighter
color shades, the molecule is mostly non-polar[44-46]. Also the 3D plots of total electron density, alpha density
and electrostatic potential ESP is shown in Fig.6 In the color scheme for the MEP surface, red represents
electron rich, partially negative charge: blue correspond to electron deficient, partially positive charge: light
blue for slightly electron deficient region; yellow for slightly electron rich region; green for neutral,
respectively. The electrostatic potential increases in the order as red< orange<yellow<green<blue. In the MEP
map of the title molecule, the regions around the electronegative atoms CC group, chlorine and nitrogen atoms
are represented as negative potential (red) and the regions hydrogen atoms are positive potential (blue). The H
atoms indicate the strongest attraction and the Cl and N atoms indicates the strongest repulsion with other
atoms.
3.6. Thermodynamic Properties
On the basis of vibrational analysis at G09 on B3LYP/-311G++(d,p) bsis set, the standard
thermodynamic functions namely, heat capacity (C), entropy (S) and enthalpy changes (H) for the 2,5 DCA
were obtained and are listed in Table 5. The comparative graph of heat capacity (C), entropy (S) and enthalpy
changes (H) for 2,5 DCA was shown in Fig. 7. From Table 5, it can be observed that these thermodynamic
functions are increasing with increase of temperature from 100 to 1000 K, since the molecular vibrational
intensities are increasing with temperature [47,48]. All these functions were calculated in gas phase and they
could not be used in solution. Further, these thermodynamic data are providing supportive information for future
study of 2,5 DCA and can be used to compute other thermodynamic energies according to the law of
thermodynamics. MEP
Total density
Alpha density
ESP
Fig.6 MEP, Total density, Alpha density and ESP of 2,5 DCA
Table 5 The specific heat capacity C, entropy S and enthalpy changes ΔH of 2,5 DCA T(K) C (J/mol-1K-1) S (cal mol-1 K-1) ΔH (kcal/mol-1)

Spectroscopic Investigation (FT-IR, FT-RAMAN, UV and NMR), NBO, NLO Analysis and Fukui
DOI: 10.9790/4861-0904024258 www.iosrjournals.org 51 | Page
Fig.7 Comparative graph of Heat capacity, Entropy and Enthalpy of 2,5 DCA
3.7. Atomic Charge
In the application of quantum chemical calculation, the atomic charges play an important role, since
atomic charges affect the dipole moment, molecular polarizability, electronic structure and a lot of
electronic properties of systems. The atomic charges were calculated at HF and B3LYP/6-311++G(d,p) basis
set level for comparison and are listed in Table 6 and the mulliken atomic charges plot for 2,5 DCA is plotted in
Fig.8. This study shows that some carbon atoms have most positive and negative charges and hydrogen atoms
all most positive charges. In this Table 6, it is seen that the nitrogen atom has small negative charge for both
basis sets. For the HF calculation, the H8 and H9 atoms shows the higher positive charge. The C1, C3 C 4 and C5
atoms have highest negative charges and C2 and C6 atoms have highest positive charge. The same result is
obtained for B3LYP calculation except for C 5 atom which is positive. From the calculated atomic charges of
Aniline, the charge of C1 atom is 0.5452 e- and that of the title molecule is -0.93747 e
- [49]. The increase in
negative charge is because of the presence of two chlorine atoms and NH2 group and thus it leads to the
redistribution of electron density.
Table 6 Mulliken atomic charge of 2,5 DCA Atoms HF/6-31+G(d,p) B3LYP/6-311++G(d,p)
C1 -1.60976 -0.93747
C2 1.200542 0.880028
C3 -0.68905 -0.65278
C4 -0.2678 -0.90584
C5 -0.38884 0.637308
C6 0.701298 -0.43742
H7 0.198935 0.193558
H8 0.19367 0.169707
H9 0.186336 0.153688
CL10 0.183843 0.305828
CL11 0.223058 0.332137
N12 -0.5538 -0.248
H13 0.296085 0.238284
H14 0.325482 0.270978
0 200 400 600 800 1000
0
50
100
150
200
250
300
350
400
450
500
550
600
650
Funct
ions
Temperatures(K)
Specific heat capacity
Entropy
Enthalpy
100 57.2 273.82 4.14
200 97.06 325.85 11.87
298.15 132.31 371.32 23.16
300 132.93 372.14 23.41
400 163.63 414.72 38.29
500 188.51 454.01 55.94
600 208.19 490.19 75.81
700 223.84 523.51 97.45
800 236.5 554.25 120.48
900 246.96 582.73 144.67

Spectroscopic Investigation (FT-IR, FT-RAMAN, UV and NMR), NBO, NLO Analysis and Fukui
DOI: 10.9790/4861-0904024258 www.iosrjournals.org 52 | Page
Fig.8 Mulliken atomic charge plot for 2,5 DCA
3.8 NLO Properties
The molecular electronic dipole moments μ(Debye), Polarizability (α0) and first order
hyperpolarizability (β0) values of 2,5 DCA calculated using B3LYP/with two different basis set was listed in
Table 7. The first order hyperpolarizability is a tensor represented by 3X3X3 matrix. The output from the above
basis set provides 3 components of dipole moment namely μx, μy, μz, 6 componenets of polarizability α and 10
components of hyperpolarizability β. From these values, the total dipole moment μ , Polarizability (α0) and
hyperpolarizability (β0) values can be calculated using the following equations:
μ = (μx²+μy²+μz²)1/2
(9)
α0 = αxx+αyy+αzz/3 (10)
β0 = (βx²+βy²+βz²)½ (11)
Where,
β x = βxxx+βxyy+βxzz (12)
β y = βyyy+βxxy+βyzz (13)
β z = βzzz+βxxz+βyyz (14)
The values of polarizability (α0) and hyperpolarizability (β0) of B3LYP/6-31+G(d,p) and B3LYP/6-
311++G(d, p) output are reported in atomic units (a.u), the values shown in table have been converted into
electrostatic units (esu) (for α0 ; 1 a.u = 0.1482 X 10⁻²⁴
esu, for β0; 1 a.u = 8.6393 X10⁻³³
esu). The value of
dipole moment μ was found to be 0.7923 Debye for B3LYP/6-31+G(d,p) basis set and 0.7028 Debye for
B3LYP/6-311++G(d,p) level. The B3LYP/6-311++G(d,p) calculated polarizability α0 and first
hyperpolarizability value β0 of 2,5-DCAwas found to be 0.2749 X10⁻³⁰
esu and 2.3136 X10⁻³⁰
esu respectively.
But the HF/6-311G(d,p) calculated polarizability α0 and first hyperpolarizability value β0 of 2,4,5-Trichloro
Aniline was calculated as 0.4554 X10⁻³⁰
esu and 1.118551 X10⁻³⁰
esu respectively. The molecular dipole
moment and first hyperpolarizability μ and β0 of urea are 1.5285 Debye and 0. 343272 X10-30
esu obtained by
HF/6-311G(d,p) method. The magnitude of the molecular hyperpolarizability β0, is one of important key factors
in a NLO system. From these results, it is clear that the value of hyperpolarizability of the molecule under study
is greater and this leading to more attractive molecule for future NLO studies.
Table 7 The molecular electric dipole moments μ(Debye), Polarizability (α0) and hyperpolarizability (β0)
values of 2,5 DCA.
C1 C2 C3 C4 C5 C6 H7 H8 H9 CL10CL11 N12 H13 H14
-1.5
-1.0
-0.5
0.0
0.5
1.0
Ch
arg
es
Atoms
HF/6-31+G(d,p)
B3LYP/6-311++G(d,p)
Parameters B3LYP/6-31+G(d,p) B3LYP/6-311++G(d,p)
Dipole moment ( μ ) Debye Debye
μx 0.4559 -0.5268
μy 0.6480 -0.3488
μz 0.0 -0.3077
μ 0.7923 0.7028
Polarizability ( α0 ) x10-30esu x10-30esu
αxx 146.6876 108.0411

Spectroscopic Investigation (FT-IR, FT-RAMAN, UV and NMR), NBO, NLO Analysis and Fukui
DOI: 10.9790/4861-0904024258 www.iosrjournals.org 53 | Page
Standard value for urea (μ=1.3732 Debye, β0=0.3728x10⁻³⁰
esu): esu-electrostatic unit
3.9. UV-Analysis
The UV-Vis absorption spectrum of 2,5 DCA is recorded in the range 200-800 nm. Aniline has strong
UV-Vis absorption at 232 nm and 285 nm. The UV-Vis spectral analyses of the molecule have been
investigated in Gas phase, Chloroform and DMSO by, TD-DFT/B3LYP/6-311++G(d,p) calculations. The
electronic transitions and the corresponding excitation energies for the three phases are presented Table 8. It is
obvious that, , the calculated absorption maxima values have been found to be 260, 236 and 223 nm for gas
phase, 260, 236 and 223 nm for chloroform and 259, 235 and 222 nm for DMSO method. This shows that, the
calculations performed at gas phase and chloroform is identical. The corresponding value for DMSO is closer to
that of other two. Comparing the corresponding calculation of 2,4,5-Trichloro Aniline, this structure allow
strong π-π* transition in the UV-Vis region with high oscillator strengths and low absorption wavelength for
all the three phases. Thereby giving rise to significant electronic properties. The experimental UV-Vis
absorption spectrums of 2,5 DCA was depicted Fig.9.
Table 8 The electronic transition of 2,5 DCA using DFT-B3LYP/6-311++G(d,p) basis set
In Gas phase.
Calculated at Oscillator strength Calculated Experimental
B3lyp/6-311++g(d,p) Band gap(ev/nm) Band of Aniline( nm)
Excited State 1 Singlet-A(f=0.0356) 4.7590eV/ 260.53nm
40 -> 42 0.12603
40 -> 43 -0.28975 280
41 -> 42 0.61236
41 -> 43 0.12789
Excited State 2 Singlet-A(f=0.0546) 5.2491eV/236.20nm 230
39 -> 43 0.10589
40 -> 42 0.33050
40 -> 43 0.22142
41 -> 43 0.56164
Excited State 3 Singlet-A(f=0.1076) 5.5358 eV/223.97nm
39 -> 42 0.34664
40 -> 42 0.44762
40 -> 43 0.21219
41 -> 43 -0.32600
In Chloroform
Excited State 1: Singlet-A (f=0.0356) 4.7590 eV / 260.53 nm
40 -> 42 0.12603
40 -> 43 -0.28975
41 -> 42 0.61236
41 -> 43 0.12789
Excited State 2: Singlet-A (f=0.0546) 5.2491 eV / 236.20 nm
αxy 4.0399 4.4505
αyy 107.6582 14.3401
αxz 0 -1.5806
αyz 0 3.4990
αzz 57.4581 58.5855
α0 0.2734 0.2749
Hyperpolarizability ( β0 ) x10-30esu x10-30esu
βxxx 13.1078 143..31
βxxy -100.3905 153.3
βxyy -176.4785 70.91
βyyy -185.2833 -12.7882
βxxz 0 -5.7418
βxyz 0 -2.8146
βyyz 0 -18.9268
βxzz 5.8398 -0.7080
βyzz -5.0261 15.1391
βzzz 0 -17.6982
β0 2.8564 2.3136

Spectroscopic Investigation (FT-IR, FT-RAMAN, UV and NMR), NBO, NLO Analysis and Fukui
DOI: 10.9790/4861-0904024258 www.iosrjournals.org 54 | Page
39 -> 43 0.10589
40 -> 42 0.33050
40 -> 43 0.22142
41 -> 43 0.56164
Excited State 3: Singlet-A (f=0.1076) 5.5358 ev/ 223.97 nm
39 -> 42 0.34664
40 -> 42 0.44762
40 -> 43 0.21219
41 -> 43 -0.32600
IN DMSO
Excited State 1: Singlet-A (f=0.0327) 4.7795 eV/ 259.41 nm
40 -> 42 0.12946
40 -> 43 -0.29704
41 -> 42 0.60719
41 -> 43 0.13452
Excited State 2: Singlet-A( f=0.0536) 5.2678 eV/ 235.36 nm
39 -> 43 0.11141
40 -> 42 0.32098
40 -> 43 0.21870
41 -> 42 -0.10064
41 -> 43 0.56618
Excited State 3: Singlet-A( f=0.1014) 5.5612 eV/ 222.95 nm
39 -> 42 0.35586
40 -> 42 0.43800
40 -> 43 0.2310
41 -> 42 0.10540
41 -> 43 -0.31007
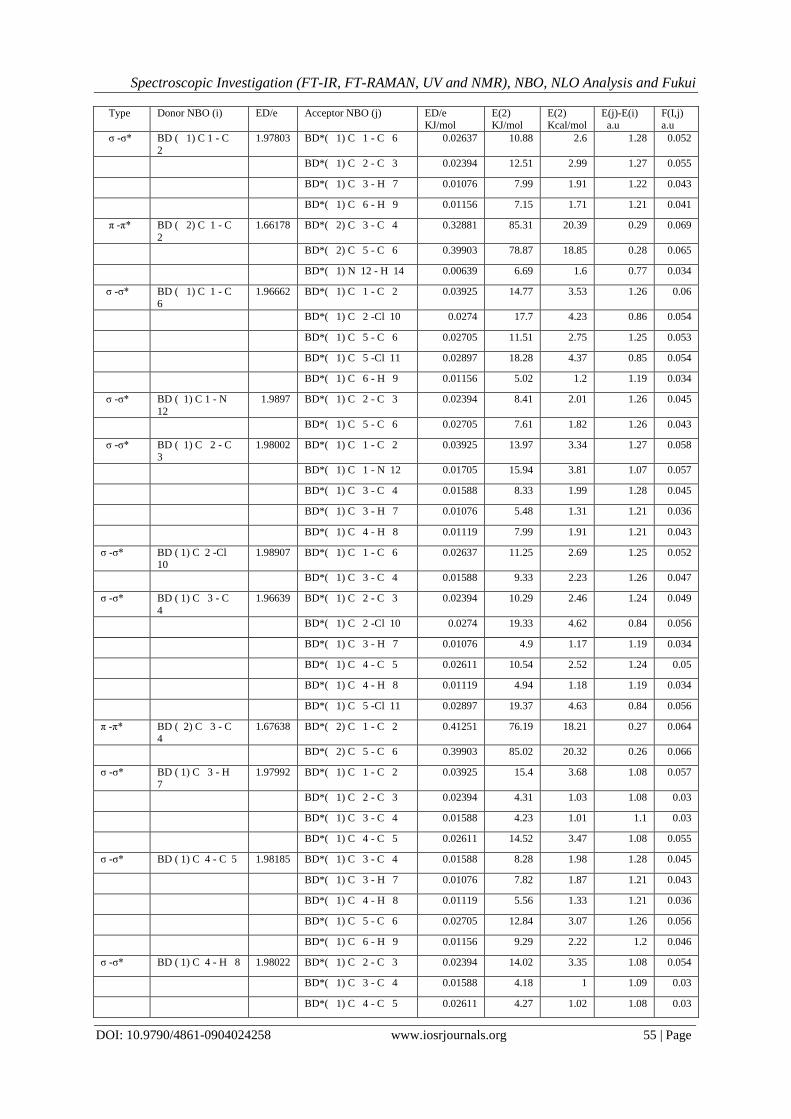
IV. NBO Analysis Natural bond orbital analysis is used for understanding the charge transfer interactions between the
bonds. The Lewis and Non-Lewis NBO assessment of 2,5 DCA is as shown in Table 9. The NBO calculation
was performed for the molecule at B3LYP/6-311++G(d,p) level.This interaction energy gives the estimate of the
off-diagonal NBO Fock matrix elements F(i,j). It is deduced from the second-order perturbation approach [50,
51]. The large value of interaction energy E(2) reveals that the interaction between Lewis and Non-Lewis bond
is strong and hence the conjugation of the system is greater.Delocalization of electron density between bond or
lone pair NBO orbitals and anti bond or Rydberg NBO orbitals correspond to a stabilizing donor–acceptor
interaction.
Fig.9 experimental UV spectrum of 2,5 DCA
Table 9 The second-order perturbation interaction energy E(2) and the off-diagonal NBO Fock matrix elements
F(i,j) of 2,5 DCA.
Spectroscopic Investigation (FT-IR, FT-RAMAN, UV and NMR), NBO, NLO Analysis and Fukui
DOI: 10.9790/4861-0904024258 www.iosrjournals.org 55 | Page
Type Donor NBO (i) ED/e Acceptor NBO (j) ED/e KJ/mol
E(2) KJ/mol
E(2) Kcal/mol
E(j)-E(i) a.u
F(I,j) a.u
σ -σ* BD ( 1) C 1 - C
2
1.97803 BD*( 1) C 1 - C 6 0.02637 10.88 2.6 1.28 0.052
BD*( 1) C 2 - C 3 0.02394 12.51 2.99 1.27 0.055
BD*( 1) C 3 - H 7 0.01076 7.99 1.91 1.22 0.043
BD*( 1) C 6 - H 9 0.01156 7.15 1.71 1.21 0.041
π -π* BD ( 2) C 1 - C
2
1.66178 BD*( 2) C 3 - C 4 0.32881 85.31 20.39 0.29 0.069
BD*( 2) C 5 - C 6 0.39903 78.87 18.85 0.28 0.065
BD*( 1) N 12 - H 14 0.00639 6.69 1.6 0.77 0.034
σ -σ* BD ( 1) C 1 - C
6
1.96662 BD*( 1) C 1 - C 2 0.03925 14.77 3.53 1.26 0.06
BD*( 1) C 2 -Cl 10 0.0274 17.7 4.23 0.86 0.054
BD*( 1) C 5 - C 6 0.02705 11.51 2.75 1.25 0.053
BD*( 1) C 5 -Cl 11 0.02897 18.28 4.37 0.85 0.054
BD*( 1) C 6 - H 9 0.01156 5.02 1.2 1.19 0.034
σ -σ* BD ( 1) C 1 - N
12
1.9897 BD*( 1) C 2 - C 3 0.02394 8.41 2.01 1.26 0.045
BD*( 1) C 5 - C 6 0.02705 7.61 1.82 1.26 0.043
σ -σ* BD ( 1) C 2 - C 3
1.98002 BD*( 1) C 1 - C 2 0.03925 13.97 3.34 1.27 0.058
BD*( 1) C 1 - N 12 0.01705 15.94 3.81 1.07 0.057
BD*( 1) C 3 - C 4 0.01588 8.33 1.99 1.28 0.045
BD*( 1) C 3 - H 7 0.01076 5.48 1.31 1.21 0.036
BD*( 1) C 4 - H 8 0.01119 7.99 1.91 1.21 0.043
σ -σ* BD ( 1) C 2 -Cl 10
1.98907 BD*( 1) C 1 - C 6 0.02637 11.25 2.69 1.25 0.052
BD*( 1) C 3 - C 4 0.01588 9.33 2.23 1.26 0.047
σ -σ* BD ( 1) C 3 - C
4
1.96639 BD*( 1) C 2 - C 3 0.02394 10.29 2.46 1.24 0.049
BD*( 1) C 2 -Cl 10 0.0274 19.33 4.62 0.84 0.056
BD*( 1) C 3 - H 7 0.01076 4.9 1.17 1.19 0.034
BD*( 1) C 4 - C 5 0.02611 10.54 2.52 1.24 0.05
BD*( 1) C 4 - H 8 0.01119 4.94 1.18 1.19 0.034
BD*( 1) C 5 -Cl 11 0.02897 19.37 4.63 0.84 0.056
π -π* BD ( 2) C 3 - C 4
1.67638 BD*( 2) C 1 - C 2 0.41251 76.19 18.21 0.27 0.064
BD*( 2) C 5 - C 6 0.39903 85.02 20.32 0.26 0.066
σ -σ* BD ( 1) C 3 - H
7
1.97992 BD*( 1) C 1 - C 2 0.03925 15.4 3.68 1.08 0.057
BD*( 1) C 2 - C 3 0.02394 4.31 1.03 1.08 0.03
BD*( 1) C 3 - C 4 0.01588 4.23 1.01 1.1 0.03
BD*( 1) C 4 - C 5 0.02611 14.52 3.47 1.08 0.055
σ -σ* BD ( 1) C 4 - C 5 1.98185 BD*( 1) C 3 - C 4 0.01588 8.28 1.98 1.28 0.045
BD*( 1) C 3 - H 7 0.01076 7.82 1.87 1.21 0.043
BD*( 1) C 4 - H 8 0.01119 5.56 1.33 1.21 0.036
BD*( 1) C 5 - C 6 0.02705 12.84 3.07 1.26 0.056
BD*( 1) C 6 - H 9 0.01156 9.29 2.22 1.2 0.046
σ -σ* BD ( 1) C 4 - H 8 1.98022 BD*( 1) C 2 - C 3 0.02394 14.02 3.35 1.08 0.054
BD*( 1) C 3 - C 4 0.01588 4.18 1 1.09 0.03
BD*( 1) C 4 - C 5 0.02611 4.27 1.02 1.08 0.03

Spectroscopic Investigation (FT-IR, FT-RAMAN, UV and NMR), NBO, NLO Analysis and Fukui
DOI: 10.9790/4861-0904024258 www.iosrjournals.org 56 | Page
BD*( 1) C 5 - C 6 0.02705 16.11 3.85 1.08 0.058
σ -σ* BD ( 1) C 5 - C 6
1.97921 BD*( 1) C 1 - C 6 0.02637 9.41 2.25 1.28 0.048
BD*( 1) C 1 - N 12 0.01705 14.69 3.51 1.07 0.055
BD*( 1) C 4 - C 5 0.02611 12.84 3.07 1.26 0.056
BD*( 1) C 4 - H 8 0.01119 8.95 2.14 1.21 0.046
BD*( 1) C 6 - H 9 0.01156 6.4 1.53 1.2 0.038
π -π* BD ( 2) C 5 - C
6
1.69118 BD*( 2) C 1 - C 2 0.41251 85.35 20.4 0.28 0.069
BD*( 2) C 3 - C 4 0.32881 76.4 18.26 0.29 0.065
σ -σ* BD ( 1) C 5 -Cl 11
1.99072 BD*( 1) C 1 - C 6 0.02637 8.2 1.96 1.26 0.045
BD*( 1) C 3 - C 4 0.01588 9.16 2.19 1.27 0.047
σ -σ* BD ( 1) C 6 - H
9
1.97846 BD*( 1) C 1 - C 2 0.03925 17.15 4.1 1.09 0.06
BD*( 1) C 1 - C 6 0.02637 5.15 1.23 1.1 0.033
BD*( 1) C 4 - C 5 0.02611 15.73 3.76 1.08 0.057
BD*( 1) C 5 - C 6 0.02705 4.77 1.14 1.08 0.031
σ -σ* BD ( 1) N 12 - H13 1.98901 BD*( 1) C 1 - C 2 0.03925 13.43 3.21 1.18 0.055
BD*( 2) C 1 - C 2 0.41251 4.69 1.12 0.64 0.027
σ -π* BD ( ) N 12 - H 14 1.97923 BD*( 2) C 1 - C 2 0.41251 15.69 3.75 0.64 0.049
n -σ* LP ( 1) Cl 10 1.99329 BD*( 1) C 1 - C 2 0.03925 4.27 1.02 1.46 0.035
BD*( 1) C 2 - C 3 0.02394 7.15 1.71 1.46 0.045
n -σ* LP ( 2) Cl 10 1.96999 BD*( 1) C 1 - C 2 0.03925 19.71 4.71 0.85 0.057
BD*( 1) C 2 - C 3 0.02394 14.9 3.56 0.85 0.049
n -π* LP ( 3) Cl 10 1.92829 BD*( 2) C 1 - C 2 0.41251 52.05 12.44 0.32 0.061
n -σ* LP ( 1) Cl 11 1.99236 BD*( 1) C 4 - C 5 0.02611 6.86 1.64 1.46 0.044
BD*( 1) C 5 - C 6 0.02705 6.49 1.55 1.47 0.043
n -σ* LP ( 2) Cl 11 1.97179 BD*( 1) C 4 - C 5 0.02611 16.74 4 0.86 0.052
BD*( 1) C 5 - C 6 0.02705 16.9 4.04 0.86 0.053
n -π* LP ( 3 ) Cl 11 1.93117 BD*( 2) C 5 - C 6 0.39903 51.92 12.41 0.32 0.062
n -σ* LP ( 1) N 12 1.93802 BD*( 1) C 1 - C 2 0.03925 9.04 2.16 0.85 0.039
BD*( 2) C 1 - C 2 0.41251 18.45 4.41 0.32 0.037
BD*( 1) C 1 - C 6 0.02637 25.82 6.17 0.86 0.066
π*-π* BD*( 2) C 1 - C
2
0.41251 BD*( 2) C 3 - C 4 0.32881 1023.62 244.65 0.01 0.078
π*-π* BD*( 2) C 5 - C
6
0.39903 BD*( 2) C 3 - C 4 0.32881 763.08 182.38 0.02 0.079
The strong intramolecular interaction are formed by the orbital overlap between σ (C-C), σ*(C-C), σ
(C-N), σ*(C-N), σ (C-Cl), σ*(C-Cl) and π(C-C),π*(C-C) bond orbitals. This leads to intramolecular charge
transfer (ICT) and thereby causing stabilization of the system. These intramolecular charge transfer (σ→ σ*, π
→π*) will cause large nonlinearity of the molecule. The strong intramolecular hyper conjugation interaction of
the σ and π electrons of C-C and C-N to the anti C-C, C-H, C-N and N-H bonds, give rise to the stabilization of
some part of the ring as evident from Table 9. The interaction of the σ electron of (C1–C6) distribute to σ* (C1–
C2), (C2–CL10), (C5–C6), ( C5-CL11 )and (C6–H9) of the ring. Also, the π bond of C1–C2 in the ring transfers
energy of 85.32 KJ/mol to the antibonding orbital of the π*(C3-C4) and an energy of 78.87KJ/mol to the
antibonding orbital π*(C5-C6). The intra-molecular interaction is formed due to the orbital overlap of π (C5–
C6) with π*(C1-C2) π*(C3-C4) with energy of 85.35 and 76.4 KJ/mol respectively. Also the π (C3-C4) interacts
with π*(C1-C2) and π*(C5-C6) with energies of 76.19 and 85.02 KJ /mole respectively. Apart from π-π*, σ-σ*
and π*-π*interactions, n-σ*, n-π*and σ- π* interactions also occur in the hyper conjugative interactions of 2,5
DCA. There by predicting the charge transfer between lone pair bonds and acceptor bonds with in the molecule.
Spectroscopic Investigation (FT-IR, FT-RAMAN, UV and NMR), NBO, NLO Analysis and Fukui
DOI: 10.9790/4861-0904024258 www.iosrjournals.org 57 | Page
The more energy transfer takes place during π to π* transition rather than σ to σ*. The maximum stabilization
energy E(2) associated with hyper conjugative interaction π(C5-C6)→π*(C1-C2) is obtained as 85. 35 KJ/mol,
which is due to two chlorine atoms attached with C2 and C5 atoms.
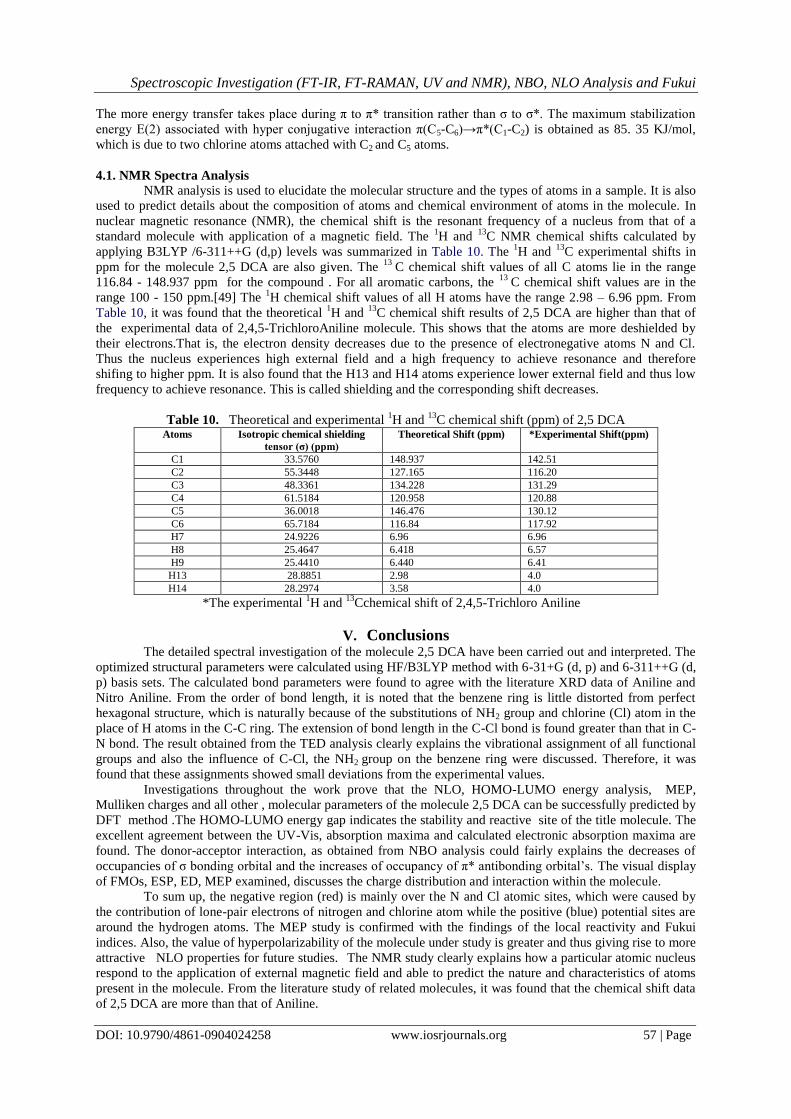
4.1. NMR Spectra Analysis
NMR analysis is used to elucidate the molecular structure and the types of atoms in a sample. It is also
used to predict details about the composition of atoms and chemical environment of atoms in the molecule. In
nuclear magnetic resonance (NMR), the chemical shift is the resonant frequency of a nucleus from that of a
standard molecule with application of a magnetic field. The 1H and
13C NMR chemical shifts calculated by
applying B3LYP /6-311++G (d,p) levels was summarized in Table 10. The 1H and
13C experimental shifts in
ppm for the molecule 2,5 DCA are also given. The 13
C chemical shift values of all C atoms lie in the range
116.84 - 148.937 ppm for the compound . For all aromatic carbons, the 13
C chemical shift values are in the
range 100 - 150 ppm.[49] The 1H chemical shift values of all H atoms have the range 2.98 – 6.96 ppm. From
Table 10, it was found that the theoretical 1H and
13C chemical shift results of 2,5 DCA are higher than that of
the experimental data of 2,4,5-TrichloroAniline molecule. This shows that the atoms are more deshielded by
their electrons.That is, the electron density decreases due to the presence of electronegative atoms N and Cl.
Thus the nucleus experiences high external field and a high frequency to achieve resonance and therefore
shifing to higher ppm. It is also found that the H13 and H14 atoms experience lower external field and thus low
frequency to achieve resonance. This is called shielding and the corresponding shift decreases.
Table 10. Theoretical and experimental 1H and
13C chemical shift (ppm) of 2,5 DCA
Atoms Isotropic chemical shielding
tensor (σ) (ppm)
Theoretical Shift (ppm) *Experimental Shift(ppm)
C1 33.5760 148.937 142.51
C2 55.3448 127.165 116.20
C3 48.3361 134.228 131.29
C4 61.5184 120.958 120.88
C5 36.0018 146.476 130.12
C6 65.7184 116.84 117.92
H7 24.9226 6.96 6.96
H8 25.4647 6.418 6.57
H9 25.4410 6.440 6.41
H13 28.8851 2.98 4.0
H14 28.2974 3.58 4.0
*The experimental 1H and
13Cchemical shift of 2,4,5-Trichloro Aniline
V. Conclusions
The detailed spectral investigation of the molecule 2,5 DCA have been carried out and interpreted. The
optimized structural parameters were calculated using HF/B3LYP method with 6-31+G (d, p) and 6-311++G (d,
p) basis sets. The calculated bond parameters were found to agree with the literature XRD data of Aniline and
Nitro Aniline. From the order of bond length, it is noted that the benzene ring is little distorted from perfect
hexagonal structure, which is naturally because of the substitutions of NH2 group and chlorine (Cl) atom in the
place of H atoms in the C-C ring. The extension of bond length in the C-Cl bond is found greater than that in C-
N bond. The result obtained from the TED analysis clearly explains the vibrational assignment of all functional
groups and also the influence of C-Cl, the NH2 group on the benzene ring were discussed. Therefore, it was
found that these assignments showed small deviations from the experimental values.
Investigations throughout the work prove that the NLO, HOMO-LUMO energy analysis, MEP,
Mulliken charges and all other , molecular parameters of the molecule 2,5 DCA can be successfully predicted by
DFT method .The HOMO-LUMO energy gap indicates the stability and reactive site of the title molecule. The
excellent agreement between the UV-Vis, absorption maxima and calculated electronic absorption maxima are
found. The donor-acceptor interaction, as obtained from NBO analysis could fairly explains the decreases of
occupancies of σ bonding orbital and the increases of occupancy of π* antibonding orbital’s. The visual display
of FMOs, ESP, ED, MEP examined, discusses the charge distribution and interaction within the molecule.
To sum up, the negative region (red) is mainly over the N and Cl atomic sites, which were caused by
the contribution of lone-pair electrons of nitrogen and chlorine atom while the positive (blue) potential sites are
around the hydrogen atoms. The MEP study is confirmed with the findings of the local reactivity and Fukui
indices. Also, the value of hyperpolarizability of the molecule under study is greater and thus giving rise to more
attractive NLO properties for future studies. The NMR study clearly explains how a particular atomic nucleus
respond to the application of external magnetic field and able to predict the nature and characteristics of atoms
present in the molecule. From the literature study of related molecules, it was found that the chemical shift data
of 2,5 DCA are more than that of Aniline.
Spectroscopic Investigation (FT-IR, FT-RAMAN, UV and NMR), NBO, NLO Analysis and Fukui
DOI: 10.9790/4861-0904024258 www.iosrjournals.org 58 | Page
References
[1] J. Whysner, L. Vera, G.M.Williams, Pharmacol. Ther. 71 (1996) 107.
[2] A. Altun, K. GOlc ¨u´k, M. Kumru, J. Mol. Struct. (Theochem.) 625 (2003) 17.
[3] N. Sundaraganesana, J. Karpagama, S. Sebastiana, J.P. Cornard, Spectrochimica Acta Part A 73 (2009) 11–19.
[4] Amareshwar Kumar Raia, Sanjay Kumarb, Anita Raic, Vibrational Spectroscopy, 42 ( 2006) 397-402.
[5] Mehmet Karabacak, Mustafa Kurt, Ahmet Ataç, Journal of Physical Organic Chemistry, 22 (2009) 321–330.
[6] Halina Szatyłowicz, Tadeusz M. Krygowski, Pavel Hobza, Journal of Physical Organic Chemistry A, 111( 2007) 170–175.
[7] M. Kurta, M. Yurdakulb, Ş. Yurdakula, Journal of Molecular Structure THEOCHEM711( 2004) 25-32.
[8] V.Arjunana and S.Mohan, Spectrochimica Acta Part A,72( 2009) 436-444.
[9] M.H. Jamróz, Vibrational Energy Distribution Analysis VEDA 4, Warsaw, 2004.
[10] A. Frisch, A.B. Nielson, A.J. Holder, GAUSSVIEW User Manual, Gaussian Inc., (Pittsburgh, PA, 2000).
[11] M.K. Ahmed, B.R. Henry, J. Phys. Chem. 90 (1986) 1737.
[12] J.V. Prasad, S.B. Rai, S.N. Thakur, Chem. Phys. Lett. 164 (6) (1989) 629.
[13] G.D. Lister, J.K. Tyler, J.H. Hog, N.W. Larsen, J. Mol. Struct. 23 (1974) 253.
[14] J.R. Durig, T.S. Little, T.K. Gounev, J.K. Gargner Jr., J.F. Sullivan, J. Mol. Struct. 375 (1996) 83.
[15] V. Krishnakumar, V. Balachandran, T. Chithambarathann, Spectrochimica Acta part A 62 (2005) 918-925.
[16] W.O. George and P.S. Mcintyre, Infrared Spectroscopy, (John Wiley & Sons, London, 1987).
[17] J. Coates, R.A. Meyers, Interpretation of Infrared Spectra: A Practical Approach,(John Wiley and Sons Ltd., Chichester, 2000).
[18] V. Krishna kumar, N. Prabavathi, Spectrochimica Acta part A 71 (2008) 449-457.
[19] A. Altun, K. Golcuk, M. Kumru, Journal of Molecular structure (Theochem.) 155. (2003)637-639.
[20] V. Krishna kumar, R. John Xavier, Spectrochimica Acta part A 61 (2005) 253-258.
[21] S. George, Infrared and Raman Characteristic Group Frequencies—Tables and Charts, third ed., (Wiley, New York, 2001).
[22] A. R. Prabakaran and S. Mohan, Indian Journal of Physics, vol.63B, (1989) 468-473.
[23] G. Varsanyi, Assignments of Vibrational Spectra of 700 Benzene Derivatives,(Wiley, New York, 1974).
[24] S.J.Singh, S.M.Pandey, J. Pure Appl. Phys. 12 (1974) 300-303.
[25] R.Shankar, R.A.Yadav , I.S.Singh, O.S.Singh,J . Pure Appl. Phys. 23 (1985) 339-345.
[26] M. H.Jamroz, J.Cz Dobrowolski, R.Brzozwski, J. Mol. Struct. 787 (2006) 172-185.
[27] L.J. Bellamy, The Infrared Spectra of Complex Molecules, (vol. 2, Chapman and Hall, London, 1980).
[28] S. Mancy,W.L. Peticoles, R.S. Toblas, Spectrochim. Acta 35A (1979) 315.
[29] A. Usha Rani, N. Sundaraganesan, M. Kurt, M. Cinar, M. Karabacak, Spectrochim. Acta A 75 (2010) 1523–1529.
[30] M. Karabacak, M. Kurt, M. Çinar, A. Çoruh, Mol. Phys. 107 (2009) 253–264.
[31] M. Karabacak, M. Cinar, Z. Unal, M. Kurt, J. Mol. Struct. 982 (2010) 22–27.
[32] V.S. Madhavan, H.T. Varghese, S. Mathew, J. Vinsova, C.Y. Panicker, Spectrochim. Acta A 72 (2009) 547–553.
[33] M. Rogojerova, G. Keresztury, B. Jordanova, Spectrochim. Acta A 61 (2005) 1661–1670.
[34] C.S. Hiremath, J. Yenagi, J. Tonannavar, Spectrochim. Acta A 68 (2007) 710–717.
[35] V. Sortur, J. Yenagi, J. Tonannavar, V.B. Jadhav, M.V. Kulkarni, Spectrochim. Acta A 71 (2008) 688–694.
[36] D.H. Wiffen, Spectrochimica Acta 7 (1955) 253-256.
[37] V.Sortur, Jayashree Yenagi, J. Tonannavar, V.B. Jadhav, M.V. Kulkarni, Spectrochimica Acta A 71 (2008) 688-694.
[38] J.H. Risgin, Fluorocarbons and related compounds, (Vol II. Academic press, New York, 1954) 449-452
[39] I. Fleming, Frontier Orbitals and Organic Chemical Reactions, (Wiley, London, 1976).
[40] D.Sajan,K.U.Lakshmi,Y.Erdogdu,I.H.Joe,Spectrochim, Acta 78A (2011) 113.
[41] B.Eren, A.Unal,Spectrochim, Acta Part A 103 (2013) 222-23.
[42] R.Parr,L.Szentpaly,S.Liu,Am,Chem.Soc.(121,1999) 1922-1924.
[43] P.Chattraj, B.Maiti, U.Sarkar, J.Phys.Chem.A107 (2003) 4973-4975.
[44] J.S. Murray, K. Sen, Molecular Electrostatic Potentials, Concepts and Applications, Elsevier, Amsterdam,1996.
[45] E.Scrocco, J.Tomasi, in:P.Lowdin(Ed), Advances in quantum chemistry.(Academic press, New York , 1978).
[46] J. Sponer, P. Hobza, Int. J. Quant. Chem. 57 (1996) 959.
[47] J. Bevan Ott, J. Boerio-Goates, Calculations from Statistical Thermodynamics, (Academic Press 2000).
[48] R. Zhang, B. Dub, G. Sun, Y. Sun, Spectrochim. Acta A 75 (2010) 1115–1124.
[49] M.Govindarajan, M.Karabacak, S.Periyandi, D.Tanuja, Spectrochim. Acta A 97 (2012) 231-245.
[50] C. James, A. AmalRaj, R. Reghunathan, I. Hubert Joe, V.S. JayaKumar, J. Raman Spectrosc. 37 (2006) 1381–1392.
[51] L.J. Na, C.Z. Rang, Y.S. Fang, J. Zhejiang Univ. Sci. 6B (2005) 584–589.
IOSR Journal of Applied Physics (IOSR-JAP) is UGC approved Journal with Sl. No. 5010,
Journal no. 49054.
G.Shakila. "Spectroscopic Investigation (FT-IR, FT-RAMAN, UV and NMR), NBO, NLO
Analysis and Fukui Function of 2, 5-Dichloroaniline by DFT Calculations." IOSR Journal of
Applied Physics (IOSR-JAP) 9.4 (2017): 42-58.