spectroscopic effects of organized media on a cyanine dye/phenanthrene derivative
TRANSCRIPT

Spectroscopic Effects of Organized Media on a Cyanine Dye/Phenanthrene Derivative
M I C H A E L D. GREEN, G A B O R PATONAY,* T H I L I V H A L I N D O U , t a n d I S I A H M. W A R N E R Department of Chemistry, Georgia State University, Atlanta, Georgia 30303 (M.D.G., G.P.); and Department of Chemistry, Emory University, Atlanta, Georgia 30322 (T.N., I.M.W.)
Absorbance and fluorescence characteristics of a cyanine dye/phenan- threne derivative are studied in the presence of ~- and ~f-cyclodextrin, Brij 35, cetyltrimethyl ammonium bromide (CTAB), and sodium dodecyl sulfate (SDS). The apparent association constant for the dye cyclodextrin complex is estimated with the use of Benesi-Hildebrand equations. Ab- sorbance measurements are used to estimate the dimerization constant of the dye in aqueous solution. Index Headings: Fluorescence; Cyanine dye; ~-cyclodextrin; Cyclodex- trin; Surfactant.
INTRODUCTION
Cyanine dyes possess many characteristics which are applicable in photographic processes, as laser compo- nents, in chemotherapy, and in the evaluation of biolog- ical structures. Useful properties of these dyes include an enhanced fluorescence in low-polarity solvents and an intense absorption at longer wavelengths. Other fea- tures include self-aggregation, solvatochromic effects, and hydrophobicity. TM Cyanine dyes are considered to be a subset of a much larger group known as polymethine dyes, which are characterized by a chain of methine groups (-CH=) terminated at each end by an electron acceptor and an electron donor. 2,5
Solvent polarity can influence the formation of dye aggregates. For example, aqueous alcoholic solutions have been shown to decrease the aggregation of thionine by forming relatively strong solvation complexes. 6 The self- aggregation of dyes often results in color changes because the color exhibited by the aggregate form of a dye is often different from the monomeric form.
Hydrophobic dyes such as thionine, methylene blue, and acridine orange have been shown to exhibit self- aggregation in aqueous solution at higher concentra- tions2 ,v The self-aggregation of cyanine dyes has been shown to result in fluorescence quenching. 4 These prop- erties have been used to evaluate biological structures such as lipid membranes and mitochondria, s,9
Organized media such as the cyclodextrin cavity and surfactants have been reported to influence the absor- bance and fluorescence properties of many dyes. Cy- clodextrins (CDs) are torus-shaped polysaccharides that possess a hydrophobic interior which includes molecules of appropriate size and polarity. Considerable attention has been given to CDs because of their use in areas of analytical separation and pharmaceutics. The CDs are
Received 11 June 1992. * Author to whom correspondence should be sent. t Present address: Gillette Research Institute, Gaithersburg, MD 20879.
available with varying inner diameters of about 6, 8, and 10 /~ for a-, fl-, and ~-CD, respectively. 1° Interactions between CDs and certain-sized compatible molecules are influenced by many factors including van der Waals forc- es, hydrogen bonding, displacement of high-energy water from the CD cavity, and release of cyclodextrin strain energy upon complexation21
The ability of cyclodextrins to alter the photophysical properties of a guest molecule upon complexation is of significant interest. The changes in the absorbance and fluorescence properties (solvatochromic effect) of dye/ CD complexes have been attributed to the association of the dyes to the hydrophobic microenvironment of the CD cavity and the deaggregation of multimeric dyes by the selective inclusion of the monomeric form. For ex- ample, Dan et al. have reported the enhanced fluores- cence of cationic dyes such as methylene blue and pin- acyanol chloride by use of cyclodextr ins2 2 Also, cyclodextrins have been reported to enhance the fluo- rescence intensity of xanthene dyes23 The ability of CDs to enhance the fluorescence intensity of these self-ag- gregating dyes has also been attributed to the selective inclusion of the fluorescent monomeric form, thus shift- ing the equilibrium away from the fluorescence quench- ing aggregate form. ~2,~
Surfactants have also been known to enhance the flu- orescence emission of certain molecules2 ~ Surfactants are molecules that have a hydrophobic moiety and a head group that may be anionic, cationic, or nonionic. The concentration at which surfactants organize themselves into micelles is termed the critical micellar concentration (CMC). The formation of micelles can have an effect on the fluorescence and absorbance properties of a chro- mophore, n As with cyclodextrins, enhanced fluorescence has been shown to result from the deaggregation of dyes to their monomeric forms24-1s Surfactant micelles can also enhance fluorescence by shielding the chromophore from any quenching effects originating from the bulk aqueous solution21
Below the CMC, anionic surfactants were found to enhance the self-association of cationic dyes, which re- sulted in fluorescent quenching. The use of sodium do- deceyl sulfate (SDS) has been known to induce aggregate formation of cationic dyes below the critical micelle con- centrations. Above the CMC, cationic dyes are individ- ually bound to micelles, preventing the formation of dye aggregations24
As part of a larger investigation encompassing several polyaromatic hydrocarbon dyes, this paper s p e c i f i c a l l y examines the effects of methanol, cyclodextrins, and sur-
1724 Volume 46, Number 11, 1992 ooo3-7o2s/s2/4~11.172452.oo/o APPLIED SPECTROSCOPY © 1992 Society for Applied Spectroscopy
factants on a cyanine dye/phenanthrene derivative, 1 - ( 9 ' - p h e n a n t h r o n y l ) -2 (2 ' - (N-e thy l ) -benzo th iazo - lium)-ethylene bromide (PABT). The structure of PABT is illustrated below.
PABT The association constant (Kdim) for dimer formation
of PABT in aqueous media is estimated with the use of absorbance measurements. The apparent formation con- stant (Kf) for the PABT/CD complex is estimated by use of Benesi-Hildebrand plots of fluorescence data. In ad- dition, the effects of various micellar media on PABT fluorescence are evaluated.
EXPERIMENTAL
Apparatus. Steady-state fluorescence measurements were acquired with a SPEX Fluorolog Model F2T21I fluorescence spectrophotometer equipped with a ther- mostated cell housing and a cooled photomultiplier tube. The emission spectra were measured at an excitation wavelength of 345 nm, with the use of excitation and emission bandwidths of 5 and 3 nm, respectively. Ab- sorbance measurements were obtained with a Cary 3 UV- Vis spectrophotometer. All measurements were per- formed at 25 +_ 1°C.
Materials. The PBT was prepared as follows: The starting material was 3-ethyl-2-methylbenzothiazolium bromide obtained by heating a solution of ethyl bromide and 2-methylbenzothiazole in dimethylformamide at 150°C for 12 hours. Workup of this reaction mixture in- cluded cooling to 23°C and slow addition of diethyl ether to crystallize the product. The crystals were filtered, washed with diethyl ether, and dried under reduced pres- sure to give analytically pure 3-ethyl-2-methylbenzo- thiazolium bromide, m.p. 241-243°C. A mixture of 1 g (3.8 retool) of 9-phenanthrenecarboxaldehyde and 0.726 g (3.9 mmol) of dry triethylamine was refluxed in 5 mL of ethanol for 30 min. The reaction mixture was cooled and the solvent removed under reduced pressure. The crude solid thus obtained was dissolved in dichlorometh- ane, precipitated with ether, and recrystallized from methanol. The structure of PABT was fully consistent with the measured NMR spectrum (CDC13): 61.4 triplet, 3H, methyl; 63.3 quartet, 2H, methylene; ~4.5 quartet, 2H, allylic protons; 57.0-9.2 multiplet, 13H, aromatic rings.
Cyclodextrins were obtained from American Maize Products (Hammond, IN). Hexadecyltrimethyl ammo- nium bromide (CTAB), sodium dodecyl sulfate (SDS), and polyoxyethylene-(23)-lauryl ether (Brij 35) were ob- tained from Sigma. All reagents were used as received.
Method. A stock solution of PABT was prepared in acetonitrile at a concentration of 5.5 × 10 -4 M and stored at 0°C. In the preparation of an aqueous PABT solution, a measured aliquot of the stock was transferred into a volumetric flask. The acetonitrile was evaporated with the use of dry nitrogen, and the PABT residue was re- dissolved in deionized water. The final PABT concen- tration for each sample was 1.0 × 10 -5 M. The final solutions also contain approximately 0.1% v/v acetoni- trile, which was necessary to aid in dissolution.
Determination of Sell-Association of the Dye. A 5.0 x 10 -5 M solution of aqueous PBT was prepared as described above. A series of dilutions ranging from 5.0 x 10 -6 to 5.0 × 10 -5 M were made for absorbance mea- surements. The experiments were conducted with cells of different pathlengths and varying dye concentrations.
Influence of Methanol. A measured amount of a 1.8 x 10 -4 M stock solution of methanolic PABT was trans- ferred into a series of 10-mL volumetric flasks. Varying amounts of methanol and water were added to yield a constant PABT concentration of 1.0 x 10 -5 M for each sample. The variable methanol concentrations ranged from 1 to 100%.
Influence of Cyclodextrins. In the preparation of PABT in aqueous CD solutions, a 5-mL aliquot was transferred into 10-mL flasks, and a measured amount of aqueous CD solution was added to achieve the desired concen- trations. The flasks were filled to the mark with deionized water, yielding a final PABT concentration of 1.0 x 10 -5 M. Cyclodextrin concentrations ranged from 1.0 x 10 -3 to 1.0 x 10 -2 M. The PABT/cyclodextrin solutions were allowed to equilibrate overnight at room temperature prior to analysis.
Influence of Surfactants. In the preparation of PABT in aqueous surfactant solution, a 5-mL aliquot of the aqueous PABT was transferred into a 10-mL flask. A measured amount of surfactant solution was added to achieve the desired concentrations. The flasks were filled to the mark with deionized water to give approximately 1.0 × 10 -5 M PABT in all cases. Surfactant concentra- tions ranged from 2.0 × 10 -3 to 2.0 x 10 -1 M for SDS, 1.0 x 10 -4 to 5.0 × 10 -3 M for CTAB, and 2.0 × 10 -~ to 1.1 x 10 _4 M for Brij 35. All aqueous PABT solutions were freshly prepared and protected from light whenever possible.
RESULTS AND DISCUSSION
Determination of Self-Association. It is well estab- lished that many dyes aggregate in aqueous solutions. To better understand the influence of cyclodextrins and surfactants on PABT, we first evaluated the aggregation of PABT in aqueous solution. Figure 1 shows the absor- bance spectra of PABT in aqueous solution. The absor- bance spectra taken with the use of different cells of varying pathlengths indicate the possible formation of PABT aggregates at higher concentrations. The forma- tion of aggregates was investigated by assuming that PABT dimerizes in solution. Assuming the formation of a dimer, the following expression could be written:
2C., ~. Cd where Cm and Cd are the concentration of monomer and
APPLIED SPECTROSCOPY 1725

8
o t~ <
0.25
0.2-]
0.15-
0.1
0 .05 -
0 - ~ 460
FIG. 1.
IO~M; 1.0cm
20 ~M; 0.5 cm
50 ~M; 0.2 cm
100 uM; 0.1 cm
580 700 Wavelength nrn
Absorbance spec t ra of P A B T dissolved in water.
dimer, respectively. The dimerizat ion constant (Kdim) is obta ined from the following equation:
Kd,,,, = C,~/C,,, 2. (1)
Assuming tha t the law of mass action is applicable, Eq. 2 requires tha t
Co = C~ + 2C~ (2)
where Co is the total concentra t ion of the dye. Therefore , the fract ion of P B T in the dimer form is expressed by the following equation:
CJCo = (e - em)/2(e~ - E=) (3)
where em and ed are the molar absorptivit ies for the pure monomer and the pure dimer, respectively. The mea- sured analytical molar absorpt ivi ty is given by e. By com- bining Eqs. 1, 2, and 3 and rearranging, we obtain Eq. 4, f rom which we derive an est imate of Kdim.
[(e - e=)/Co] '/2 = -[2gd,.,/Ae]'/'(e - era) + [2Kd,=Ae] '/' (4)
where Ae = e, - em. A plot of [(c - E~)/Co] '/~ vs. (e - e~) should yield a
s traight line if the molecule exists predominate ly as a dimer. Figure 2 shows the results of this study, and a linear relat ionship reveals that , at these concentrat ions, P A B T exists as a dimer. The value for e~ was es t imated by extrapolat ions of e to zero P A B T concentrat ion. This
1.4E4
G r T
~u
I L~
1.2E4
1.0E4
8000.0
6000.0
4000.0
2000.0 1.0E4
I
1.2E4
PABT
1.4E4 1.6E4 1.8E4
(C--Cm)
FIG. 2. P lo t of Eq. 4.
2E6.
n
o v
o ~ o
=o h .
FIG. 3. P A B T .
1E6.
5E5.
PABT - - I OOX Met.hanol - - 1 X Methanol 8 nm
0 - , • , - 0
400 450 500 550 600 650 700
Wavelength (nm)
Effect of m e t h a n o l on the f luorescence emiss ion spec t ra of
value was consis tent with a value obta ined from a P A B T solution containing 0.1 M SDS (see discussion on sur- factants). The dimerizat ion constant (Kdim) for P A B T in aqueous solution is es t imated to be 1.8 x 10⁴ M -1. This value is considered to be a very conservative est imate since typical cyanine dyes adsorb strongly to glassware in aqueous solution. 4 I f adsorpt ion occurs, Co is lower, bu t Eq. 4 remains valid, result ing in a linear plot. How- ever, the calculated K , is lower than K , wi thout absorp- tion.
Influence of Methanol on Fluorescence Measure- ments. The solvatochromic p roper ty of P A B T was dem- ons t ra ted by the fluorescence shift observed with de- creasing solvent polarity. Figure 3 shows the influence of increasing methanol concentra t ions on the fluores- cence of the band at 575 nm. The enhanced fluorescence intensi ty is associated with the increase in the relative concentra t ion of the monomeric form of the dye. An 8-nm shift towards longer wavelength is also seen at higher concentra t ions of methanol where the dye is predomi- nate ly in the monomeric form.
Influence of Cyclodextrin on Fluorescence and Ab- sorbance Measurements. Figure 4 shows the changes in the fluorescence spectra of P A B T upon increasing/~-CD concentrat ion. The major bands at 575 nm and 640 nm are a t t r ibu ted to the heterocyclic chromophore , and the
2E5
A 10 mM f l -CD
/, ,\ t © 0.5
-~ IE5 c
5E4- o ,'7
0 I ] , I , I ' I '
4oo , 5 o 5oo 550 6o0 650 7o0
wovelength (nm i FIG. 4. Effect of increas ing concent ra t ions of # -CD on the f luorescence emiss ion of P A B T .
1726 Volume 46, Number 11, 1992
80- O PABT/,8-CD
@ PABT/ ' y -C D
60- L~ °
I 40-
20-
0-
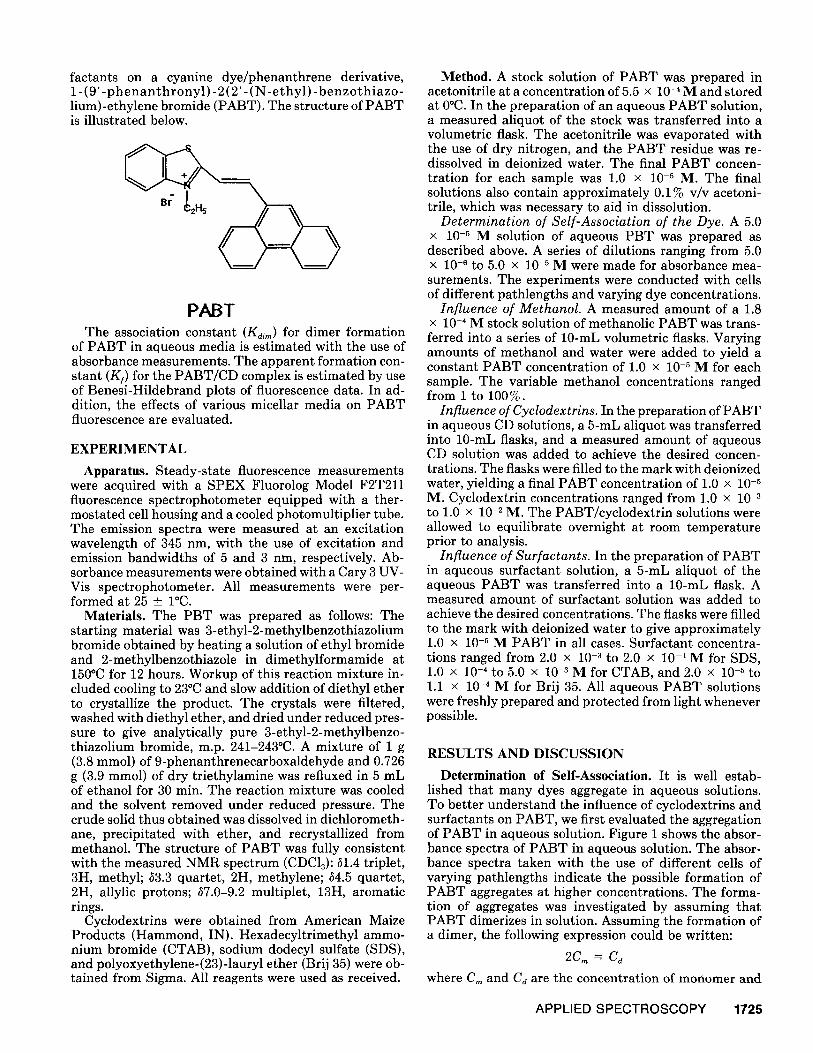
FIG. 5.
c
(D
c © o o3
o D
(1) >
©
C~
I I 1 1 1 500 1000 1500 2000 2500 5000
[1/CD] X IO-'M-'
Benesi-Hildebrand plots of PABT vs. fl- and ~/-CD.
broad band at 420 nm is attributed to the phenanthrene group.
According to absorbance data, the monomeric form of the dye predominates at a PABT concentration of 1.0 × 10 .5 M. There is no significant increase in the monomer absorbance with increasing fl- or ~-CD. This observation suggests that any deaggregation induced by fl- or 7-CD is insignificant at this particular PABT concentration. Therefore, the fluorescence enhancement observed with increasing CD is not primarily a function of deaggrega- tion.
The apparent association constant, Kf, can be esti- mated from a modified version of the Benesi-Hildebrand equation: iv
1 / F - Fo = 1/KfGQ[PABT]o[CD]o + 1/GQ[PABT]o. (7)
In this equation, F and Q are the fluorescence signal and quantum yield of PABT. The constant, G, represents a characteristic of the fluorophore and instrumental pa- rameters, and Fo is the fluorescence intensity of PABT in water. The fluorescence signal of the chromophore at 575 nm was used. The K I value for a 1:1 PABT/CD com- plex was estimated from a linear plot of Eq. 7 (Fig. 5). In Table I, the relative formation constants for PABT/ ~- and ~-CD complexes are given. These values suggest a much greater affinity of PABT for fl-CD. Similar results were shown for phenanthrene, where it showed more preference for fl-CD than 3 ' - C D . is It should be noted, however, that the spectral changes observed upon ad- dition of cyclodextrins are not solely due to intracavity
TABLE I. Formation constants for I:I complexation.
Formation constant Complex (M -I)
PABT/fl-CD 657 PABT/~-CD 169 Phenanthrene/f l-CD 1500 a
170 b Phenanthrene/-~-CD 770" PBT/-~-CD 415 c
" See Ref. 18. h j . Alonso, A. Heredia, and J. C. Marquez, J. Molec. Struc. 143, 399
(1986). c See Ref. 19.
4E4
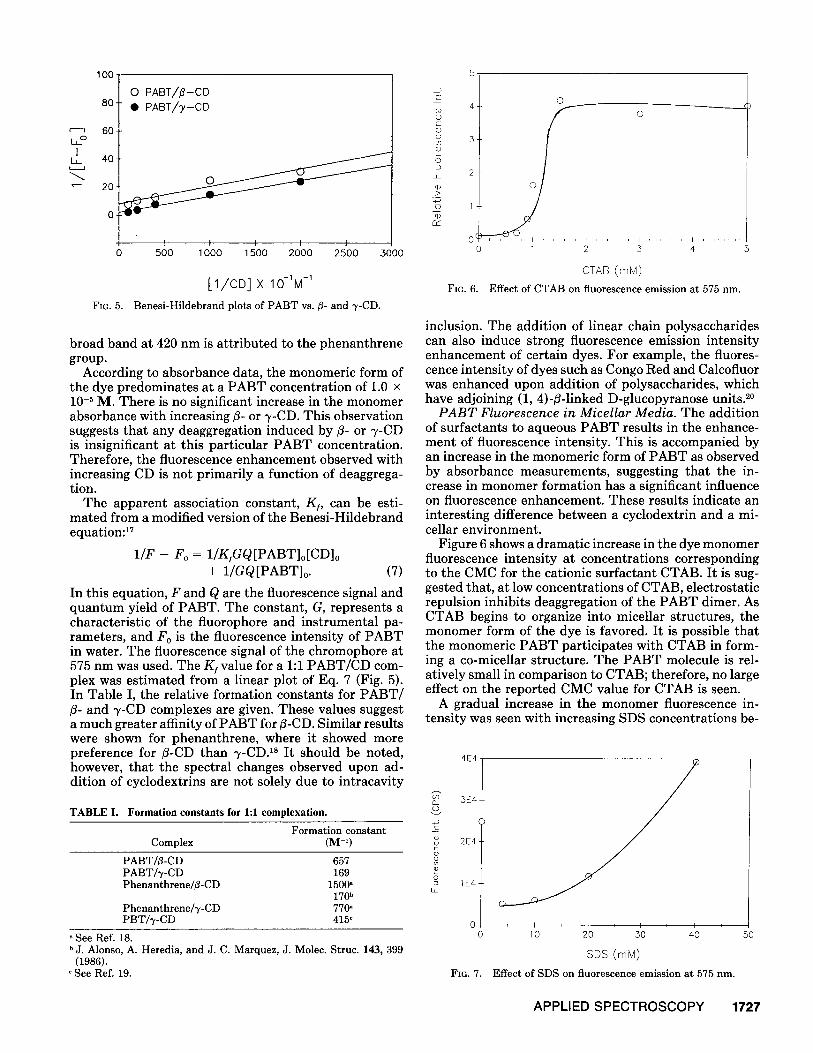
FIG. 6.
o 4 ¸
2-
o 1 2 3 4
CTAB (raM)
Effect of CTAB on fluorescence emission at 575 nm.
inclusion. The addition of linear chain polysaccharides can also induce strong fluorescence emission intensity enhancement of certain dyes. For example, the fluores- cence intensity of dyes such as Congo Red and Calcofluor was enhanced upon addition of polysaccharides, which have adjoining (1, 4)-fl-linked D-glucopyranose units. 2°
P A B T Fluorescence in Micellar Media. The addition of surfactants to aqueous PABT results in the enhance- ment of fluorescence intensity. This is accompanied by an increase in the monomeric form of PABT as observed by absorbance measurements, suggesting that the in- crease in monomer formation has a significant influence on fluorescence enhancement. These results indicate an interesting difference between a cyclodextrin and a mi- cellar environment.
Figure 6 shows a dramatic increase in the dye monomer fluorescence intensity at concentrations corresponding to the CMC for the cationic surfactant CTAB. It is sug- gested that, at low concentrations of CTAB, electrostatic repulsion inhibits deaggregation of the PABT dimer. As CTAB begins to organize into micellar structures, the monomer form of the dye is favored. It is possible that the monomeric PABT participates with CTAB in form- ing a co-micellar structure. The PABT molecule is rel- atively small in comparison to CTAB; therefore, no large effect on the reported CMC value for CTAB is seen.
A gradual increase in the monomer fluorescence in- tensity was seen with increasing SDS concentrations be-
FIG. 7.
5E4.
2E4 E
O 2 1E4-
E
i I i I I i I i
10 20 30 40
SDS (mM)
Effect of SDS on fluorescence emission at 575 nm.
100- 5
50
APPLIED SPECTROSCOPY 1727

5E6
2E6-
2E6
1E6-
6E5
5E4( 0
FIa. 8.
I
0 v
:>,
co
c
c
,I u)
0
I i I ,
20 40 60 80 100 120 140 160 180 200
Br i j 5 5 ( uM)
Effect of Brij 35 on fluorescence emission at 575 nm.
tween the CMC (8.1 × 10 -3 M ) 21 and the maximum at 1.0 × 10 .2 M (Fig. 7). This result is in agreement with reports that, at premicellar concentrations, SDS can in- duce the aggregation of cationic dyes by neutralizing the columbic repulsion encountered between the charged dye molecules. 14
In contrast to the anionic surfactant SDS, the nonionic surfactant, Brij 35, is shown to deaggregate the PABT dimer at concentrations well below the reported CMC (Fig. 8). Induced aggregation, observed at premicellar SDS concentrations, is not evident with Brij 35.
C ONCLUSIONS
Aggregation in aqueous solution is one of many char- acteristics exhibited by PABT that is typical of cyanine dyes. The aggregating properties of these PAH styryl dyes in water are influenced by the polarity of the elec- tron donor group. Therefore, the aggregating character- istics of these types of dyes can be manipulated by at- taching PAH groups. For example, the association constant for an aqueous solution of PABT was shown to be 2.7 times less than the association constant deter- mined from an analogous cyanine dye/pyrene derivative, 1- (1-pyrenyl)-2- (3-ethylbenzothiazolium)-ethylene bro- mide (PBT)? 9 This difference is probably due to the less hydrophobic nature of the aryl moiety in PABT. Table II compares the Kdim of the dye derivatives to the solu- bility constants for the associated PAH group. The rel- ative Kdim values for the dye derivatives can be described in terms of the hydrophobicity of the associated PAH group. The larger Kdim values for the pyrene derivative are consistent with the greater hydrophobic character of pyrene moiety relative to phenanthrene. Table I shows that Kf values for the PBT/7-CD complex are much greater than those for the PABT/7-CD complex, sug- gesting a greater affinity of PBT for the hydrophobic interior of 7-CD. Molecular interactions between PBT and 7-CD may be enhanced due to the larger dimensions
TABLE II. Comparison of dimerization constants of PABT and PBT with the solubility of the associated PAH group.
Dimerization Solubility of the associated Dye constant (M -1) PAH group in water a
PABT 1.8 × 10⁴ Phenanthrene 1290 tLg/L PBT 5.1 x 10⁴ b Pyrene 135 ttg/L
" D . MacKay and D. R. Lathame, Anal. Chem. 45, 1050 (1973). b See Ref. 19.
of the PBT molecule. It is noted that the formation con- stants of the dye/CD complexes are not solely influenced by hydrophobic interactions. Hydrogen bonding and van der Waals forces are also involved in complex stability. Takuma and co-workers zs have indicated that van der Waals forces are primarily responsible for the intermo- lecular forces involved during complexation.
Future evaluations of a larger range of styryl dyes with assorted PAH constituents should provide a variety of useful properties for many applications.
ACKNOWLEDGMENTS
This work was supported in part by grants from the National Science Foundation (CHE-890456) and (CHE-9001412). Acknowledgement is also made to the Donors of the Petroleum Research Fund, administered by the American Chemical Society, for partial support of this research. We are also grateful to G. A. Reed of American Maize Products for providing the CDs used in this study.
1. F. M. Hamer, Cyanine Dyes and Related Compounds (Wiley, New York, 1964).
2. H. Zollinger, Color Chemistry (VCH Publishers, New York, 1987). 3. D. L. Taylor, Applications of Fluorescence in the Biomedical Sci-
ences (A. R. Liss, New York, 1986). 4. W. West and S. Pearce, J. Phys. Chem. 69, 1894 (1965). 5. K. Venkataraman, The Chemistry of Synthetic Dyes (Academic
Press, New York, 1952). 6. E. Rabinowitch and L. F. Epstein, J. Am. Chem. Soc. 63, 69 (1941). 7. L. Costantino, G. Gennaro, O. Ortona, and V. Vitagliano, J. Chem.
Eng. Data 29, 62 (1984). 8. T. Handa, I. Chikako, I. Yamamoto, and M. Nakagaki, Bull. Chem.
Soc. Jpn. 56, 2548 (1983). 9. J. R. Bunting, T. V. Phan, E. Kamali, and R. M. Dowben, Biophys.
J. 56, 979 (1989). 10. J. Szejtli, Cyclodextrins and Their Inclusion Complexes (Akade-
miai Kiado, Budapest, 1982). 11. L. J. Cline Love and R. Weinberger, Spectrochim. Acta 38B, 1421
(1983). 12. P. Dan, I. Willner, N. S. Dixit, and R. A. Mackay, J. Chem. Perkin
Trans. II, 455 (1984). 13. I. R. Politzer, K. T. Crago, T. Hampton, J. Joseph, J. H. Boyer,
and M. Shah, Chem. Phys. Lett. 159, 258 (1989). 14. M. G. Neumann and M. H. Gehlen, J. Colloid Interface Sci. 135,
209 (1990). 15. A. Yamagishi, J. Colloid Interface Sci. 86, 468 (1982). 16. M. E. Diaz Garcia and A. Sanz-Medel, Talanta 33, 255 (19??). 17. A Mufioz de la Pefia, T. T. Ndou, J. B. Zung, and I. M. Warner,
J. Phys. Chem. 95, 3330 (1991). 18. I. Sanemasa, T. Takuma, and T. Deguchi, Bull. Chem. Soc. Jpn.
62, 3098 (1989). 19. M. D. Green, G. Patonay, T. Ndou, and I. M. Warner, J. Inclusion
Phenom. Molec. Recog. 13, 181 (1992). 20. P. J. Wood, Carbohydrate Research 85, 271 (1980). 21. J. H. Fendler and E. J. Fendler, Catalysis in Micellar and Molec-
ular Systems (Academic Press, New York, 1975).
1728 Volume 46, Number 11, 1992