spectroelectrochemical investigation of passive
TRANSCRIPT
SPECTROELECTROCHEMICAL INVESTIGATION OF PASSIVE LAYERS FORMED ON
ELECTRODE SURFACES
BY
NICOLE ROCHELLE HONESTY
DISSERTATION
Submitted in partial fulfillment of the requirements
for the degree of Doctor of Philosophy in Chemistry
in the Graduate College of the
University of Illinois at Urbana-Champaign, 2012
Urbana, Illinois
Doctoral Committee:
Professor Andrew A. Gewirth, Chair, Director of Research
Professor Paul J. A. Kenis
Professor Catherine J. Murphy
Professor Kenneth S. Suslick

ii
ABSTRACT
Corrosion, broadly defined as environmental damage to materials (usually metallic), is an
important concern for maintaining infrastructure and for many manufacturing and transport
processes. Corrosion is typically prevented or controlled by formation of a passivating layer that
prevents diffusion of oxidative elements that might attack the base material, either by a passive
oxide formed by sacrificial agents in the material or by use of organic inhibitors.
Various electrochemical techniques are used to compare the relative efficacy of these
passivation layers, including linear sweep voltammetry, which gives the breakdown potentials
and corrosion currents, and AC impedance, from which film resistance and inhibition efficacy
can be determined. Although voltammetry gives an idea of whether a film successfully
passivates a metal surface, it gives little insight into the mechanism of inhibition and chemical
interactions that take place between the film and metal surface. Shell-isolated nanoparticle
enhanced Raman spectroscopy (SHINERS) allows interrogation of the electrode-electrolyte
interface where corrosion occurs.
Benzotriazole (BTA) is the prototypical inhibitor used in both plating baths and for the
chemical mechanical planarization in the microprocessor manufacturing. It forms a film that
allows uniform removal of the electrodeposited copper to result in smooth surfaces. It has face
dependent protection efficiency which has been studied by various surface sensitive techniques
including scanning tunneling microscopy (STM), surface enhanced Raman spectroscopy
(SERS), polarization modulation infrared reflection absorption spectroscopy (PM-IRRAS), and
sum frequency generation (SFG). It is a good test for the viability of shell-isolated nanoparticle
enhanced Raman (SHINERS) particles in investigating surface film formation on single crystal
iii
Cu. SHINERS did not reproduce the face dependent behavior found in STM and SFG
experiments but did confirm difference between polycrystalline and single crystalline surfaces
noted but not previously explained in literature.
Rhodanine (RD) is common subunit in many pharmaceutical agents. It has been
demonstrated to chelate metal ions, most notably Ag(I), and Cu (I) and Cu(II).It is has been
studied as a corrosion inhibitor for Cu. In this dissertation, SERS was used to characterize the
time dependent and potential dependent interactions of RD with Cu electrode surfaces to better
elucidate the mechanism for inhibition. RD has greater corrosion inhibition than BTA at the
same concentration, and this protection increases with time. The time dependent SERS spectra
showed a marked decrease in intensity after 1 h which is attributed to formation of thick films
opaque to the laser line. Atomic force microscopy (AFM) showed that films were 100 nm thick
after 1-2 h incubation time.
Levelers are used in electrodeposition of Cu to promote bottom up fill of features created
on Si chips to connect devices. They work by passivating the surface thus promoting deposition
within features rather outside. In the best case, leveler concentration is used to tune the plating
potential. Previous work showed that pH 1 benzyldimethylhexadecyl ammonium chloride
(BDAC) best served this function of tuning potential when compared to two other candidates,
dodecyltrimethyl ammonium bromide (DTAB), and thonzonium bromide (ThonB). At pH 3,
however, ThonB is best at tuning the plating potential with concentration. Using SHINERS we
show that potential dependent behavior is observed for ThonB at low concentration whereas
there is little to no corresponding behavior of DTAB or BDAC. BDAC strongly at both low and
high concentrations whereas DTAB does not interact strongly with Cu surface at any of the three
the concentrations used.
iv
Ni superalloys are typically used in aggressive environments (high temperatures and
pressures, corrosive liquids such as those present for jet turbines, chemical processing plants, and
in ductwork and heat exchangers for nuclear plants). They form a scale in high temperature
oxidixing environment composed mostly of Cr and the other oxophilic elements in the alloy that
protects the bulk alloy from oxidative damage. Investigating how long term heat treatment
affects the electrochemical behavior and speciation has implications towards their use in nuclear
reactor components. Heat treatment positively affected the corrosion resistance which
corresponded with different product speciation, specifically with regards to the appearance of
reduced Cr species.

v
To my parents

vi
ACKNOWLEDGEMENTS
The completion of this dissertation would not have been possible without the guidance of
my advisor Professor Andrew A. Gewirth. He gave me inspiration for my projects, offered
advice when I was stuck, and allowed me to circuitously end up with my thesis research.
I thank my former labmates Karen Stewart, Scott Shaw, Andrew Campbell, Jeremy
Hatch, Matt Thorum, and Matt Thorseth (the final countdown) for showing me the ropes around
lab and being open to discussing all sorts of things during lunch. I know now for instance, that it
usually helps to press the ‘on’ button when I want the potentiostat to work.
I thank Joe Buthker for politely enduring my daily nattering about this, that and the other
thing. Without your calming influence I doubt I would have survived for long at my desk. I also
enjoyed sharing my grad school journey with Brandon Long and Dennis Butcher.
Of course I appreciate Claire Tornow for becoming my friend after that initial year of
distrust. Her cheery nature and can do attitude were critical to my maintaining a semblance of
sanity. Thanks for listening to the rant and ravings of a near lunatic. I loved being introduced to
the world of fiber arts; stitching and bitching was a definite good experience. I also felt
somewhat helpful when answering the occasional question about instrumental setup. You
definitely made me feel welcome at your desk, despite my many hours of bugging you. I
appreciate it.
Thank you Adele, Laura and Jen for upping the female-to-male ratio. It’s great to have
estrogen in lab. I hope you continue the trend. I also appreciated Professor Gulfeza Kardas who
infused joy and productivity into what otherwise would be a relatively uneventful summer.

vii
I also thank my Suslick lab compatriots Rachel, Brad, John, Sandra, Maryam, and Jin
Rui. I’ve enjoyed our many hours of witty or banal banter.
MRL staff made learning about new instrumental skills easy and enjoyable. Their
insights were invaluable for my projects.
My boyfriend Matthew Small listened to all my trials and tribulations with my research
and injected my life with a bit of rationality. He is one of my role models, and I will always be
envious of his ability to focus on research and come up with his own pet projects, all the while
doing endurance events with Jessica Klinkenberg.
My parents support provided me with the grounding I required to stay the course for grad
school and my brothers allowed me to view grad school from a different perspective.
viii
TABLE OF CONTENTS
CHAPTER 1: GENERAL INTRODUCTION……..…….……………………………….………1
CHAPTER 2: EXPERIMENTAL…………..…….………………………………….…....…..…17
CHAPTER 3: SHELL-ISOLATED NANOPARTICLE ENHANCED RAMAN
SPECTROSCOPY OF BENZOTRIAZOLE FILM FORMATION ON CU(100), CU(111) AND
CU(POLY)..…….………………………………………………………………………….....….23
CHAPTER 4: SURFACE ENHANCED RAMAN INVESTIGATION OF RHODANINE FILM
FORMATION ON COPPER ELECTRODES …..……………………………………..…..…...36
CHAPTER 5: INTERACTION OF LEVELERS WITH COPPER SURFACE IN PH 3
SULFATE SOLUTION………………………......…………...…………………….……..….…58
CHAPTER 6: EFFECT OF HEAT TREATMENT ON ELECTROCHEMICAL BEHAVIOR
AND OXIDATION PRODUCTS OF ALLOYS 617 AND 230………...………………….…...73
APPENDIX A: ACCELERATOR ON COPPER………………………………………………..94
APPENDIX B: CARBON DIOXIDE ELECTROREDUCTION ON GOLD….………..…..…100
1
CHAPTER 1: GENERAL INTRODUCTION
Techniques used to investigate corrosion
Corrosion inhibition is important for maintenance of infrastructure (primarily piping for
liquid transport and structural materials) and in the microelectronics industry. It is typically
achieved through formation of passivating films on the metallic surface that prevents oxidation
of a bulk metal, either by formation of an oxide from sacrificial agents in an alloy, or by
deposition. In the US $276 billion is spent each year controlling corrosion damage.1 Corrosion
damage generally falls under two categories: uniform or localized corrosion. In uniform
corrosion, the material does not form a passive layer in its environment and is freely oxidizing.
Localized corrosion happens when the passive layer is non-uniform and the less protected areas
are attacked.2 This initial attack can be self propagating and result in pit and crevice formation on
the surface of the material which can further propagate until the material fails.2 Stress corrosion
cracking is a synergistic affect where stresses to the material, combined with environmental
factors, initialize local corrosion forming pits or crevices.2
One way to investigate corrosion inhibition is with electrochemical measurements. These
typically involve a three-electrode setup with a working, counter and reference electrode. Linear
sweep voltammetry, wherein a linear ramp of potential is applied to the working electrode
relative to the reference electrode and the current response between the working and counter
electrode is measured, allows for determination of the electrochemical window of passivation
with anodic (oxidative) and cathodic (hydrogen evolution for aqueous solution) breakdown of
the passivation layer occurring at the end potentials.3 Dampened current densities and more
positive anodic oxidation potentials are the desired characteristics for a passive layer.4
2
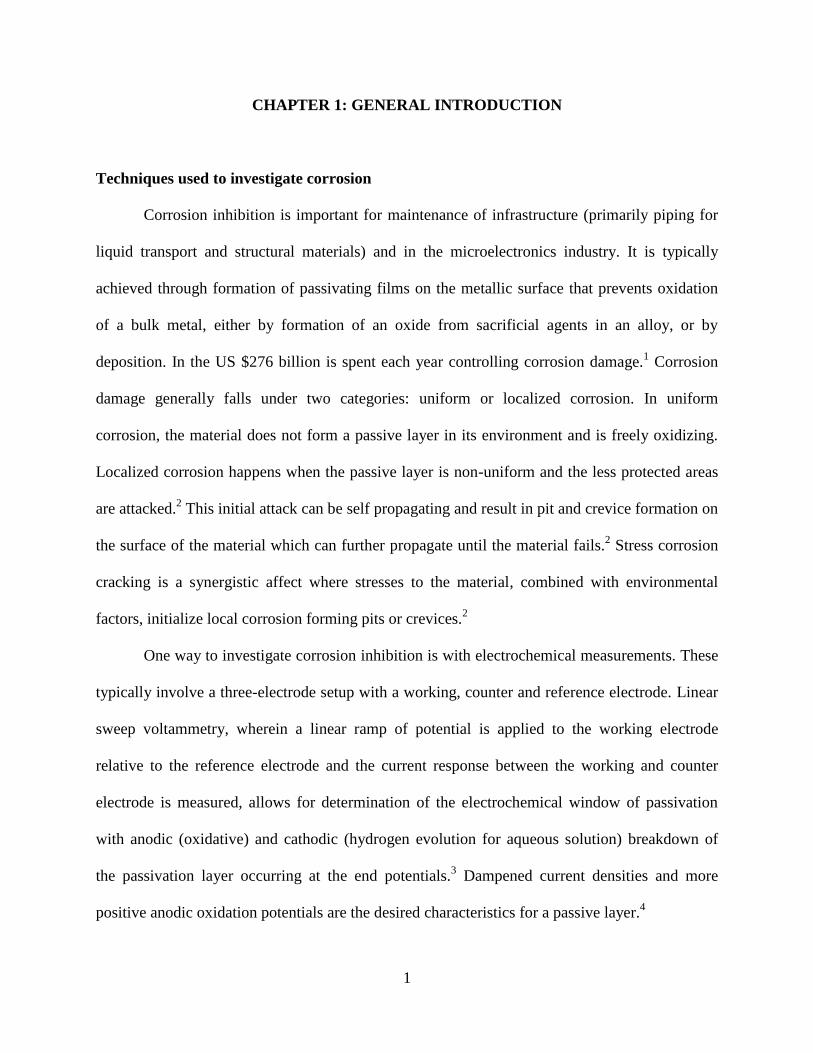
AC Impedance, a sinusoidal potential wave is applied to the working electrode and the
current response measured, allows one to model the passive layer as an electrical circuit with
resistors representing the electrode polarization resistance and solution resistance and a capacitor
from the film and electric double layer.5 These values allow for determination of the resistivity
and capacitance of the film, which give an idea of surface coverage as well as film thickness.
Inhibition efficiency, shown in equation 1.1, is determined from the resistance of a passivated
electrode relative to that of an unprotected electrode. It along with, film resistance, anodic
corrosion current and potential are the typical figures of merit for passivation films.
η %
'
'
p
pp
R
RRx100 (1.1)
Where η % is the inhibition efficiency, Rp’ is the polarization resistance of a passivated electrode
and Rp is the polarization resistance of an unprotected electrode.
Figure 1.1. Equivalent circuit diagram for electrical double layer.
Although electrochemical experiments give one an idea of the protective ability of the
passivating film, it does not allow for determination of the chemical composition of the film nor
the mechanism of film formation. Surface Enhanced Raman Spectroscopy allows one to obtain
vibrational information of analytes at or near the electrode surface in aqueous solutions.
Interrogatation of film behavior, before and after cathodic or anodic breakdown potentials, is
then possible.
3
Raman spectroscopy involves exciting a sample with monochromatic light and collecting
the inelastically scattered light (typically Stokes shift).6-10
The selection rule for Raman
scattering is a change in polarizability (equation 1.2). Since the typical scattering coefficient for
molecules is very small (~10-30
-10-25
cm2/molecule), normal Raman is only useful for very
concentrated samples, not the low concentrations (ppm) typically used for corrosion inhibition.11
Also, the molecules of interest are associated at or near the electrode surface, meaning that
probing the solution will have limited significance. Therefore, enhancement of signal at or near
the electrode surface is necessary to probe the electrode electrolyte interface and thus interrogate
passivating film formation.
E
i (1.2)
Where α is polarizability of a bond, μi is the induced dipole moment, and E is the electric field.
When a coinage metal (Ag, Au, Cu) has features smaller than the wavelength of scattered
light, the localized surface plasmon can be excited which produces an enhancement of the signal
corresponding to molecular vibrations occurring at or near the feature surface (eqn 1.3 and 1.4).10
There is also a two-fold enhancement from direct chemical bonding of the molecule of interest to
the substrate.12
Since the enhancement from both contributions are confined near the surface of
the metal, probing of the electronic double layer is guaranteed.
2222
0
2)Re(2cos31 gggEEout (1.3)
Where Raman intensity is , θ is the angle between the incident field vector and that of a
molecule at the surface of a particle.
4
outin
outing
2
(1.4)
Where εin is the dielectric constant of the metal particle and εout is the dielectric constant of the
outside environment. Maximum enhancement occurs when the denominator of g approaches 0.
There are many surfaces of interest related to corrosion that are not coinage metals and
examining films on unaltered materials would give valuable information to corrosion
mechanisms at single crystal faces. Strategies commonly used to obtain enhancement from non-
enhancing substrates include: deposit surface of interest onto nanostructured SERS substrate
(difficult and there is contribution from SERS substrate due to limitation of thin deposition as
signal drops off exponentially with distance), deposition of coinage metal particles onto surface
of interest (which can give confounding signals), and tip–enhanced Raman (TERS) in which a
nanoparticle is used as the Raman probe and can simultaneously give topographical
information.6 Of these strategies, TERS is most desirable because of the dual modes; however, a
few challenges prevent wide use of the technique. One is that the signal is very small. Many
models have been used to predict the field of enhancement; however, and promise with the three-
dimensional finite difference time-domain (3D-FDTD) method in particular. 13-14
Another is that
producing tips that give reproducible signal enhancement is difficult. Once a reliable tip is
produced it is susceptible to fouling as is already a problem for STM or AFM measurements.
Taguchi et al have had moderate success coating Si tips with Al2O3 to examine crystal violet and
adenine.15
Tian developed a technique called Shell-Isolated Nanoparticle Enhanced Raman
Spectroscopy (SHINERS) which expands upon the TERS concept.7 Au
7 or Ag
14 nanoparticles
5
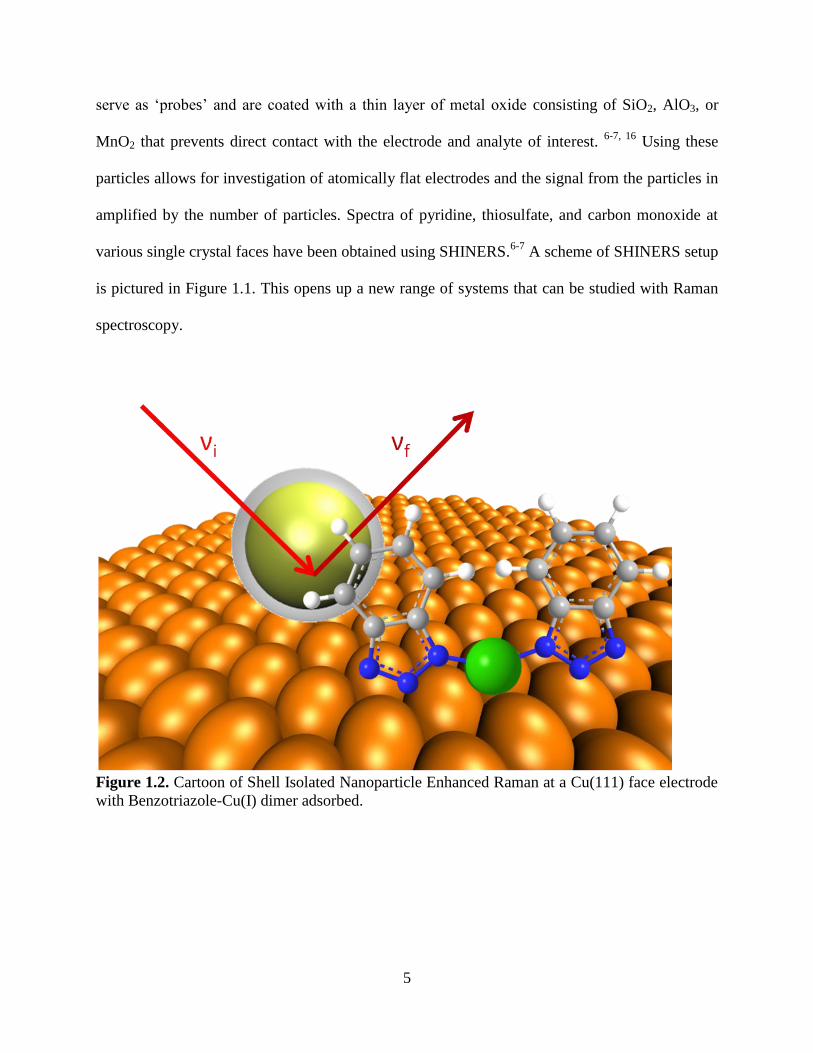
serve as ‘probes’ and are coated with a thin layer of metal oxide consisting of SiO2, AlO3, or
MnO2 that prevents direct contact with the electrode and analyte of interest. 6-7, 16
Using these
particles allows for investigation of atomically flat electrodes and the signal from the particles in
amplified by the number of particles. Spectra of pyridine, thiosulfate, and carbon monoxide at
various single crystal faces have been obtained using SHINERS.6-7
A scheme of SHINERS setup
is pictured in Figure 1.1. This opens up a new range of systems that can be studied with Raman
spectroscopy.
Figure 1.2. Cartoon of Shell Isolated Nanoparticle Enhanced Raman at a Cu(111) face electrode
with Benzotriazole-Cu(I) dimer adsorbed.
6
Benzotriazole
1,2,3-Benzotriazole (BTA) is a common corrosion inhibitor for Cu and Cu alloys.17
It is
used in the microelectronics industry for chemical-mechanical planarization slurries as well as in
Cu plating baths.18
Cotton first researched BTA as a viable corrosion inhibitor in the 1960’s and
expected the BTA worked as a physical barrier when complexed with Cu and Poling confirmed
the proposed structure of the film with IR (BTA-Cu(I)).19-20
BTA has a protection efficiency of
about 90% in concentrated sulfuric acid solutions; protection efficiency increases with increasing
pH.17
The general understanding gathered from FTIR,20-23
SERS,22, 24-40
X-ray photoelectron
spectroscopy (XPS),41-48
, and quartz crystal microbalance (QCM),49-52
for the mechanism of film
formation of BTA is that BTA forms a stable adlayer spontaneously when exposed to Cu
surfaces. When Cu ions are released from the surface, BTA may also form an organometillic
layer that prevents diffusion of oxidants to the Cu surface.
Calculations have shown that deprotonated BTA forms a more stable adlayer than the
neutral BTAH which correlates well with its increased inhibition efficacy at higher pH (BTA has
a pKa of 8.2), also deprotonated BTA- competes with Cl
- for surface sites.
48, 53-54 Calculations
also show that the organometallic complex of BTA with Cu forms even more stable adlayers on
the Cu than the deprotonated monomer along with forming a densely packed layer that protects
the Cu surface from chemical attack.52-55
Mayanna and Setty demonstrated that BTA also has face dependent efficiency56
in the
order 100>110>111. This trend corresponds to the relative disorder of BTA adlayers formed on
Cu(111) versus Cu(100) shown in STM57-60
and verified with sum frequency generation (SFG)
by Schultz et al.61
Although the PMIRRAS spectra show no difference between the crystal faces,
the spectra showed that the BTA films formed by anodic polarization of the Cu electrode were

7
irreversible even at potentials where hydrogen evolution occurs which physically disrupts the
film.21
This contradicted SERS studies by Chan and Weaver who observed electrochemically
reversible features in spectra.30
Rhodanine (RD)
Rhodanine (RD, 4-thiazolidinone-2-thione) is a sulfur-containing N,O-heterocycle which,
when derivatized, serves many manufacturing and pharmaceutical purposes.62-64
It chelates metal
ions65
and has been used to detect heavy metals in solution.66
RD has two thiol groups and an
amino group which are both known to interact strongly with metal surfaces. This along with its
ability to chelate metal ions makes it a great candidate as a corrosion inhibitor.
Figure 1.3. Rhodanine structure.
RD has been demonstrated to have good corrosion protection for mild steel67-68
and Cu69-
70 and was patented for use as a leveler in 1952.
71Although there have been many structural
studies for RD72-77
(due to its pharmaceutical benefits) few studies have been performed
examining the RD metal interaction 78-79
and none have investigated the influence of potential on
the vibrational modes of RD.
Levelers in the standard Cu plating acid bath

8
Electrodeposition is currently used to create Cu interconnects which connect devices on
Si chips.80-81
The standard plating bath consists of an aqueous solution of sulfuric acid which
imparts sufficient conductivity to the solution and removes oxide from the electrode surface,
CuSO4 as the Cu ion source, chloride which reduces the anode polarization and acts in
conjunction with the suppressor and accelerator systems, and organic additives.80, 82-83
There are
three types of organic additives used in plating bath solutions for optimal Cu deposition to create
interconnects that fill features on the wafer: 1) suppressors (or carriers) which are polyethylene
glycols; 2) accelerators (or brighteners) containing thiol or disulfide groups and sulfonic acid
groups; and 3) levelers generally surfactants with amine functionality.84
Accelerators are thought
to enhance deposition at the bottom of features in the presence of levelers and allow for high
aspect ratio feature filling also known as superconformal filling.85-92
Carriers and levelers
promote even plating across the field of the chip by increasing the electrodeposition
overvoltage.81
Levelers prevent overfill bumps by associating with the surface and competing
with the accelerators promoting an even deposit across the plane of the chip.80, 82-83, 93-94
This
three component system allows for the efficient void-free filling of features, and generally results
in a relatively flat coating that requires minimal processing after electrodeposition of
interconnects.
It is important to know how these different additives interact with the electrode surface in
order to engineer additives with superior plating performance. SERS and SHINERS offer a
convenient, non-intrusive way to conduct in-situ monitoring of surface specific interactions and
gives an idea of how these additives orient with respect to the electrode surface and facilitate - or
impede - Cu plating. SERS has been used to investigate interaction of additives with Cu surfaces
both with and without the presence of Cu ions.94-105
Previously, it was determined that potential
9
induced orientation of quaternary ammonium salts (referred to as “quat salts”) at low
concentration corresponded to the ability to tune the Cu plating potential with concentration of
the leveler.94
Janus Green B is a typical leveler used in the damascene process and is known to
undergo potential driven orientation.97, 106-107
Passive oxide formation on Ni based alloys
Generation IV nuclear reactors such as the Very High Temperature Reactors (VHTR)
present a materials challenge because they will utilize higher temperatures and pressures for
increased efficiency in electricity production.108-109
Reactors that run at higher temperatures will
also have the capacity for thermochemical water splitting to produce hydrogen which is
(currently) easier and cheaper to store than electricity.109-110
Electrochemical and thermochemical
water splitting can utilize the excess heat of high temperature reactors to generate H2.
Because thermochemical systems only require heat to proceed, they are the more
favorable candidates for H2 generation with nuclear generators.109
The sulfur-iodine cycle, in
which SO2 and I2 are used to spit water, is a favorable candidate because of the simplicity of
separating the H2 and O2 evolving components and recyclability of inputs.109
Stress corrosion
cracking (SCC) is a major concern for failure because of the high temperatures and pressures
required for the reactors to run.111-114
Haynes 617 (Ni-Cr-Co-Mo) and Haynes 230 (Ni-Cr-W-Mo) are solid-solution
strengthened Ni-based alloys developed as high temperature and corrosion resistant materials.115-
117 They currently under consideration for use in components of generation IV reactors such as
tubing and heat exchangers.116, 118-120
Corrosion resistance is imparted on the alloy through
10
formation of a passive oxide composed primarily of Cr2O3. The effect of high temperature on the
alloys’ electrochemical behavior has important implications for use in components for VHTRs.
References
1. Koch, G. H.; United, S.; Laboratories, C. C. T.; International, N.; Turner-Fairbank
Highway Research, C., Corrosion cost and preventive strategies in the united states. Turner-
Fairbank Highway Research Center ; Available through the National Technical Information
Service: McLean, Va. : Springfield, Va., 2002; p 64.
2. Baboian, R.; Treseder, R. S., Nace corrosion engineer's reference book. NACE
International: 2002.
3. Bard, A. J.; Faulkner, L. R., Electrochemical methods: Fundamentals and applications.
Wiley: 2001.
4. Raja, P. B.; Sethuraman, M. G., Natural products as corrosion inhibitor for metals in
corrosive media — a review. Mater. Lett. 2008, 62 (1), 113.
5. Chang, B.-Y.; Park, S.-M., Electrochemical impedance spectroscopy. Annu. Rev. Anal.
Chem. 2010, 3 (1), 207.
6. Anema, J. R.; Li, J.-F.; Yang, Z.-L.; Ren, B.; Tian, Z.-Q., Shell-isolated nanoparticle-
enhanced raman spectroscopy: Expanding the versatility of surface-enhanced raman scattering.
Ann. Rev. Anal. Chem. 2011, 4 (1), 129.
7. Li, J. F.; Huang, Y. F.; Ding, Y.; Yang, Z. L.; Li, S. B.; Zhou, X. S.; Fan, F. R.; Zhang,
W.; Zhou, Z. Y.; WuDe, Y.; Ren, B.; Wang, Z. L.; Tian, Z. Q., Shell-isolated nanoparticle-
enhanced raman spectroscopy. Nature 2010, 464 (7287), 392.
8. Le Ru, E. C.; Etchegoin, P. G., Chapter 1 - a quick overview of surface-enhanced raman
spectroscopy. In Principles of surface-enhanced raman spectroscopy, Elsevier: Amsterdam,
2009; pp 1.
9. Le Ru, E. C.; Etchegoin, P. G., Chapter 4 - sers enhancement factors and related topics.
In Principles of surface-enhanced raman spectroscopy, Elsevier: Amsterdam, 2009; pp 185.
10. Stiles, P. L.; Dieringer, J. A.; Shah, N. C.; Van Duyne, R. R., Surface-enhanced raman
spectroscopy. Ann. Rev. Anal. Chem. 2008, 1, 601.
11. Asher, S. A., Uv resonance raman studies of molecular structure and dynamics:
Applications in physical and biophysical chemistry. Ann. Rev. Anal. Chem. 1988, 39 (1), 537.
12. Moskovits, M., Surface-enhanced spectroscopy. Rev. Mod. Phys. 1985, 57 (3), 783.
13. Lucas, M.; Riedo, E., Invited review article: Combining scanning probe microscopy with
optical spectroscopy for applications in biology and materials science. Rev. Sci. Instrum. 2012,
83 (6), 061101.
14. Uzayisenga, V.; Lin, X.-D.; Li, L.-M.; Anema, J. R.; Yang, Z.-L.; Huang, Y.-F.; Lin, H.-
X.; Li, S.-B.; Li, J.-F.; Tian, Z.-Q., Synthesis, characterization, and 3d-fdtd simulation of
ag@sio2 nanoparticles for shell-isolated nanoparticle-enhanced raman spectroscopy. Langmuir
2012.
15. Taguchi, A.; Hayazawa, N.; Furusawa, K.; Ishitobi, H.; Kawata, S., Deep-uv tip-
enhanced raman scattering. J. Raman Spectrosc. 2009, 40 (9), 1324.
16. Lin, X.-D.; Uzayisenga, V.; Li, J.-F.; Fang, P.-P.; Wu, D.-Y.; Ren, B.; Tian, Z.-Q.,
Synthesis of ultrathin and compact au@mno2 nanoparticles for shell-isolated nanoparticle-
enhanced raman spectroscopy (shiners). J. Raman Spectrosc. 2012, 43 (1), 40.

11
17. Finsgar, M.; Milosev, I., Inhibition of copper corrosion by 1,2,3-benzotriazole: A review.
Corros. Sci. 2010, 52 (9), 2737.
18. Tantavichet, N.; Pritzker, M., Copper electrodeposition in sulphate solutions in the
presence of benzotriazole. J. Appl. Electrochem. 2006, 36 (1), 49.
19. Cotton, J. B., Scholes, I.R., Benzotriazole and related compounds as corrosion inhibitors
for cu. Br. Corros. J. 1967, 2 (1), 1.
20. Poling, G. W., Reflection infrared studies of films formed by benzotriazole on copper.
Corros. Sci. 1970, 10 (5), 359.
21. Biggin, M. E.; Gewirth, A. A., Infrared studies of benzotriazole on copper electrode
surfaces - role of chloride in promoting reversibility. J. Electrochem. Soc. 2001, 148 (5), C339.
22. Bigotto, A.; Pandey, A. N.; Zerbo, C., Polarized infrared and raman spectra and ab-initio
calculations of benzotriazole. Spectrosc. Lett. 1996, 29 (3), 511
23. Schultz, Z. D.; Biggin, M. E.; White, J. O.; Gewirth, A. A., Infrared-visible sum
frequency generation investigation of cu corrosion inhibition with benzotriazole. Anal. Chem.
2004, 76 (3), 604.
24. Allam, N. K.; Nazeer, A. A.; Ashour, E. A., A review of the effects of benzotriazole on
the corrosion of copper and copper alloys in clean and polluted environments. J. Appl.
Electrochem. 2009, 39 (7), 961.
25. Antonijevic, M. M.; Milic, S. M.; Dimitrijevic, M. D.; Petrovic, M. B.; Radovanovic, M.
B.; Stamenkovic, A. T., The influence of ph and chlorides on electrochemical behavior of copper
in the presence of benzotriazole. Int. J. Electrochem. Sci. 2009, 4 (7), 962.
26. Aramaki, K. K., Takehiro; Sumiyoshi, Takashi; Nishihara, Hiroshi, Surface enhanced
raman scattering and impedance studies on the inhibition of copper corrosion in sulfate solutions
by 5-substituted benzotriazoles. Corros. Sci. 1991, 32 (5-6), 593.
27. Babic, R.; Metikos-Hukovic, M., Spectroelectrochemical studies of protective surface
films against copper corrosion. Thin Solid Films 2000, 359 (1), 88.
28. Cao, P. G.; Yao, J. L.; Zheng, J. W.; Gu, R. A.; Tian, Z. Q., Comparative study of
inhibition effects of benzotriazole for metals in neutral solutions as observed with surface-
enhanced raman spectroscopy. Langmuir 2002, 18 (1), 100.
29. Carron, K. T.; Xue, G.; Lewis, M. L., A surface enhanced raman spectroscopy study of
the corrosion-inhibiting properties of benzimidazole and benzotriazole on copper. Langmuir
1991, 7 (1), 2.
30. Chan, H. Y. H.; Weaver, M. J., A vibrational structural analysis of benzotriazole
adsorption and phase film formation on copper using surface-enhanced raman spectroscopy.
Langmuir 1999, 15 (9), 3348.
31. Costa, L. A. F.; Breyer, H. S.; Rubim, J. C., Surface-enhanced raman scattering (sers) on
copper electrodes in 1-n-butyl-3-methylimidazoliun tetrafluorbarate (bmi.Bf4): The adsorption
of benzotriazole (btah). Vib. Spectrosc. 2010, 54 (2), 103.
32. Lacconi, G. I.; Sandmann, G.; Plieth, W., Sers study of the complex formation and
adsorption of benzotriazole on the copper electrodeposition. Proc. - Electrochem. Soc. 1998, 97-
27 (Fundamental Aspects of Electrochemical Deposition and Dissolution Including Modeling),
41.
33. Metikos-Hukovic, M.; Babic, R.; Marinovic, A., Spectrochemical characterization of
benzotriazole on copper. J. Electrochem. Soc. 1998, 145 (12), 4045.
12
34. Musiani, M. M.; Mengoli, G.; Fleischmann, M.; Lowry, R. B., An electrochemical and
sers investigation of the influence of ph on the effectiveness of some corrosion inhibitors of
copper. J. Electroanal. Chem. Interfac. Chem. 1987, 217 (1), 187.
35. Rubim, J.; Gutz, I. G. R.; Sala, O.; Orville-Thomas, W. J., Surface enhanced raman
spectra of benzotriazole adsorbed on a copper electrode. J. Mol. Struct. 1983, 100, 571.
36. Stewart, K. L.; Keleher, J. J.; Gewirth, A. A., Relationship between molecular structure
and removal rates during chemical mechanical planarization: Comparison of benzotriazole and
1,2,4-triazole. J. Electrochem. Soc. 2008, 155 (10), D625.
37. Stewart, K. L.; Zhang, J.; Li, S. T.; Carter, P. W.; Gewirth, A. A., Anion effects on cu-
benzotriazole film formation - implications for cmp. J. Electrochem. Soc. 2007, 154 (1), D57.
38. Youda, R.; Nishihara, H.; Aramaki, K., A sers [surface-enhanced raman scattering] study
on inhibition mechanisms of benzotriazole and its derivatives for copper corrosion in sulfate
solutions. Corros. Sci. 1988, 28 (1), 87.
39. Youda, R.; Nishihara, H.; Aramaki, K., Sers and impedance study of the equilibrium
between complex formation and adsorption of benzotriazole and 4-hydroxybenzotriazole on a
copper electrode in sulfate solutions. Electrochim. Acta 1990, 35 (6), 1011.
40. Yuan, Y. X.; Han, S. Y.; Wang, M.; Yao, J. L.; Gu, R. A., Raman spectroscopic studies
on surface coordination mechanism of benzotriazole and triphenylphosphine with metals. Vib.
Spectrosc. 2009, 51 (2), 162.
41. Cohen, S. L.; Brusic, V. A.; Kaufman, F. B.; Frankel, G. S.; Motakef, S.; Rush, B., X-ray
photoelectron spectroscopy and ellipsometry studies of the electrochemically controlled
adsorption of benzotriazole on copper surfaces. J. Vac. Sci. Technol., A 1990, 8 (3, Pt. 2), 2417.
42. Xue, G.; Ding, J., Chemisorption of a compact polymeric coating on copper surfaces
from a benzotriazole solution. Appl. Surf. Sci. 1990, 40 (4), 327.
43. Xue, G. D., Jianfu; Lu, Ping; Dong, Jian, Sers, xps, and electroanalytical studies of the
chemisorption of benzotriazole on a freshly etched surface and an oxidized surface of copper. J.
Phys. Chem. 1991, 95 (19), 7380.
44. Jin-Hua, C., Zhi-Cheng, L., Shu, C., Li-Hua, N., Shou-Zhuo, Y., An xps and baw sensor
study of the structure and real-time growth behavior of a complex surface film on copper in
sodium chloride solutions (ph = 9), containing a low concentration of benzotriazole.
Electrochim. Acta 1997, 43 (3-4), 265.
45. Chen, J. H.; Lin, Z. C.; Chen, S.; Nie, L. H.; Yao, S. Z., An xps and baw sensor study of
the structure and real-time growth behaviour of a complex surface film on copper in sodium
chloride solutions (ph=9), containing a low concentration of benzotriazole. Electrochim. Acta
1998, 43 (3-4), 265.
46. Al Kharafi, F. M.; Abdullah, A. M.; Ateya, B. G., A quartz crystal microbalance study of
the kinetics of interaction of benzotriazole with copper. J. Appl. Electrochem. 2007, 37 (10),
1177.
47. Kosec, T.; Merl, D. K.; Milosev, I., Impedance and xps study of benzotriazole films
formed on copper, copper-zinc alloys and zinc in chloride solution. Corros. Sci. 2008, 50 (7),
1987.
48. Finsgar, M.; Kovac, J.; Milosev, I., Surface analysis of 1-hydroxybenzotriazole and
benzotriazole adsorbed on cu by x-ray photoelectron spectroscopy. J. Electrochem. Soc. 2010,
157 (2), C52.

13
49. Frignani, A.; Fonsati, M.; Monticelli, C.; Brunoro, G., Influence of the alkyl chain on the
protective effects of 1;2,3-benzotriazole towards copper corrosion. Part ii: Formation and
characterization of the protective films. Corros. Sci. 1999, 41 (6), 1217.
50. Qafsaoui, W.; Blanc, C.; Pebere, N.; Takenouti, H.; Srhiri, A.; Mankowski, G.,
Quantitative characterization of protective films grown on copper in the presence of different
triazole derivative inhibitors. Electrochim. Acta 2002, 47 (27), 4339.
51. Lu, W. Q.; Zhang, J.; Kaufman, F.; Hillier, A. C., A combined triboelectrochemical qcm
for studies of the cmp of copper. J. Electrochem. Soc. 2005, 152 (1), B17.
52. Finsgar, M.; Lesar, A.; Kokalj, A.; Milosev, I., A comparative electrochemical and
quantum chemical calculation study of btah and btaoh as copper corrosion inhibitors in near
neutral chloride solution. Electrochim. Acta 2008, 53 (28), 8287.
53. Kokalj, A.; Peljhan, S., Density functional theory study of ata, btah, and btaoh as copper
corrosion inhibitors: Adsorption onto cu(111) from gas phase. Langmuir 2010, 26 (18), 14582.
54. Kokalj, A.; Peljhan, S.; Finšgar, M.; Milošev, I., What determines the inhibition
effectiveness of ata, btah, and btaoh corrosion inhibitors on copper? J. Am. Chem. Soc. 2010.
55. Finsgar, M.; Peljhan, S.; Kokalj, A.; Kovac, J.; Milosev, I., Determination of the cu2o
thickness on btah-inhibited copper by reconstruction of auger electron spectra. J. Electrochem.
Soc. 2010, 157 (10), C295.
56. Mayanna, S. M.; Setty, T. H. V., Effect of benzotriazole on the dissolution of copper
single crystal planes in dilute sulphuric acid. Corros. Sci. 1975, 15 (6-12), 627.
57. Polewska, W.; Vogt, M. R.; Magnussen, O. M.; Behm, R. J., In situ stm study of cu(111)
surface structure and corrosion in pure and benzotriazole-containing sulfuric acid solution. J.
Phys. Chem. B 1999, 103 (47), 10440.
58. Vogt, M. R.; Lachenwitzer, A.; Magnussen, O. M.; Behm, R. J., In-situ stm study of the
initial stages of corrosion of cu(100) electrodes in sulfuric and hydrochloric acid solution. Surf.
Sci. 1998, 399 (1), 49.
59. Vogt, M. R.; Nichols, R. J.; Magnussen, O. M.; Behm, R. J., Benzotriazole adsorption
and inhibition of cu(100) corrosion in hcl: A combined in-situ stm and in-situ ftir spectroscopy
study. J. Phys. Chem. B 1998, 102 (30), 5859.
60. Vogt, M. R.; Polewska, W.; Magnussen, O. M.; Behm, R. J., In situ stm study of (100) cu
electrodes in sulfuric acid solution in the presence of benzotriazole: Adsorption, cu corrosion,
and cu deposition. J. Electrochem. Soc. 1997, 144 (5), L113.
61. Schultz, Z. D.; Feng, Z. V.; Biggin, M. E.; Gewirth, A. A., Vibrational spectroscopic and
mass spectrometric studies of the interaction of bis(3-sulfopropyl)-disulfide with cu surfaces. J.
Electrochem. Soc. 2006, 153 (2), C97.
62. Ludlow, J. W.; Guikema, J. A.; Consigli, R. A., Use of 5-(4-
dimethylaminobenzylidene)rhodanine in quantitating silver grains eluted from autoradiograms of
biological material. Anal. Biochem. 1986, 154 (1), 104.
63. Tomasic, T.; Masic, L. P., Rhodanine as a privileged scaffold in drug discovery. Curr.
Med. Chem. 2009, 16 (13), 1596.
64. Singh, S. P.; Parmar, S. S.; Raman, K.; Stenberg, V. I., Chemistry and biological activity
of thiazolidinones. Chem. Rev. 1981, 81 (2), 175.
65. Moers, F. G.; Steggerda, J. J., Copper complexes of rhodanine and its 3-alkyl derivatives.
J. Inorg. Nucl. Chem. 1968, 30 (12), 3217.

14
66. Fuerstenau, D. W.; Herrera-Urbina, R.; McGlashan, D. W., Studies on the applicability of
chelating agents as universal collectors for copper minerals. Int. J. Miner. Process. 2000, 58 (1-
4), 15.
67. Solmaz, R.; Kardas, G.; Yazici, B.; Erbil, M., Inhibition effect of rhodanine for corrosion
of mild steel in hydrochloric acid solution. Prot. Met. 2005, 41, 581.
68. Solmaz, R.; Kardas, G.; Yazici, B.; Erbil, M., The rhodanine inhibition effect on the
corrosion of a mild steel in acid along the exposure time. Prot. Met. 2007, 43, 476.
69. Abdallah, M., Rhodanine azosulpha drugs as corrosion inhibitors for corrosion of 304
stainless steel in hydrochloric acid solution. Corros. Sci. 2002, 44 (4), 717.
70. Solmaz, R.; Altunbaş Şahin, E.; Döner, A.; Kardaş, G., The investigation of synergistic
inhibition effect of rhodanine and iodide ion on the corrosion of copper in sulphuric acid
solution. Corros. Sci. 2011, 53 (10), 3231.
71. Passal, F. Bright copper plating. US2609339, 1952.
72. Lebedev, R. S.; Yakimenko, V. I., Calculation and investigation of infrared absorption
spectrum of rhodanine. Russ. Phys. J. 1968, 11 (10), 99.
73. Andreocci, M. V.; Cauletti, C.; Sestili, L., Electronic structure of some penta-atomic
heterocyclic molecules studied by gas-phase hei and heii photoelectron spectroscopy.
Spectrochim. Acta A-M 1984, 40 (11–12), 1087.
74. Moers, F. G.; Smits, J. M. M.; Beurskens, P. T., Crystal structure of bis-
(rhodanine)copper(i) iodide. J. Chem. Crystallogr. 1986, 16 (1), 101.
75. Enchev, V.; Chorbadjiev, S.; Jordanov, B., Comparative study of the structure of
rhodanine, isorhodanine, thiazolidine-2,4-dione, and thiorhodanine. Chem. Heterocycl. Compd.
2002, 38 (9), 1110.
76. Jabeen, S.; Palmer, R.; Potter, B.; Helliwell, M.; Dines, T.; Chowdhry, B., Low
temperature crystal structures of two rhodanine derivatives, 3-amino rhodanine and 3-methyl
rhodanine: Geometry of the rhodanine ring. J. Chem. Crystallogr. 2009, 39 (2), 151.
77. Baryshnikov, G.; Minaev, B.; Minaeva, V.; Podgornaya, A., Theoretical study of the
dimerization of rhodanine in various tautomeric forms. Chem. Heterocyc. Compd. 2012, 47 (10),
1268.
78. Jabeen, S.; Dines, T. J.; Withnall, R.; Leharne, S. A.; Chowdhry, B. Z., Surface-enhanced
raman scattering studies of rhodanines: Evidence for substrate surface-induced dimerization.
Phys. Chem. Chem. Phys. 2009, 11 (34), 7476.
79. Marzec, K. M.; Gawel, B.; Lasocha, W.; Proniewicz, L. M.; Malek, K., Interaction
between rhodanine and silver species on a nanocolloidal surface and in the solid state. J. Raman
Spectrosc. 2010, 41 (5), 543.
80. Andricacos, P. C.; Uzoh, C.; Dukovic, J. O.; Horkans, J.; Deligianni, H., IBM J. Res.
Dev. 1998, 42, 567.
81. Reid, J., Copper electrodeposition: Principles and recent progress. Jpn. J. Appl. Phys.
2001, 40, 2650.
82. Ritzdorf, T., Challenges and opportunities for electrochemical processing in
microelectronics. ECS Trans. 2007, 6 (8), 1.
83. Vereecken, P. M.; Binstead, R. A.; Deligianni, H.; Andricacos, P. C., The chemistry of
additives in damascene copper plating. IBM J. Res. Dev. 2005, 49 (1), 3.
84. Vereecken, P. M.; Binstead, R. A.; Deligianni, H.; Andricacos, P. C., The chemistry of
additives in damascene copper plating. IBM J. Res. Dev. 2005, 49 (1), 3.

15
85. Moffat, T. P.; Josell, D., Superconformal electrodeposition for 3-dimensional
interconnects. Israel J. Chem. 2010, 50 (3), 312.
86. Moffat, T. P.; Yang, L. Y. O., Accelerator surface phase associated with superconformal
cu electrodeposition. J. Electrochem. Soc. 2010, 157 (4), D228.
87. Bozzini, B.; D'Urzo, L.; Mele, C.; Romanello, V., Electrodeposition of cu from acidic
sulphate solutions in presence of bis-(3-sulphopropyl)-disulphide (sps). T. I. Met. Finish. 2006,
84 (2), 83.
88. Kim, S. K.; Josell, D.; Moffat, T. P., Electrodeposition of cu in the pei-peg-cl-sps
additive system - reduction of overfill bump formation during superfilling. J. Electrochem. Soc.
2006, 153 (9), C616.
89. Walker, M. L.; Richter, L. J.; Moffat, T. P., Potential dependence of competitive
adsorption of peg, cl-, and sps/mps on cu - an in situ ellipsometric study. J. Electrochem. Soc.
2007, 154 (5), D277.
90. Gallaway, J. W.; Willey, M. J.; West, A. C., Acceleration kinetics of peg, ppg, and a
triblock copolymer by sps during copper electroplating. J. Electrochem. Soc 2009, 156 (4),
D146.
91. Gu, M.; Li, Q.; Fu, B. H.; Xian, X. H., Role of sps in chloride ions and peg additive
system for copper electrocrystallisation. Trans. Met. Finish 2010, 88 (3), 144.
92. Hai, N. T. M.; Odermatt, J.; Grimaudo, V.; Krämer, K. W.; Fluegel, A.; Arnold, M.;
Mayer, D.; Broekmann, P., Potential oscillations in galvanostatic cu electrodeposition:
Antagonistic and synergistic effects among sps, chloride, and suppressor additives. J. Phys.
Chem. C 2012, 116 (12), 6913.
93. Kim, S. K.; Josell, D.; Moffat, T. P., Cationic surfactants for the control of overfill bumps
in cu superfilling. J. Electrochem. Soc. 2006, 153 (12), C826.
94. Hatch, J. J.; Willey, M. J.; Gewirth, A. A., Influence of aromatic functionality on
quaternary ammonium levelers for cu plating. J. Electrochem. Soc. 2011, 158 (6), D323.
95. Niaura, G.; Malinauskas, A., Surface-enhanced raman spectroscopy of clo4- and so42-
anions adsorbed at a cu electrode. J. Chem. Soc. Far. Trans. 1998, 94 (15), 2205.
96. Feng, Z. V.; Li, X.; Gewirth, A. A., Inhibition due to the interaction of polyethylene
glycol, chloride, and copper in plating baths: A surface-enhanced raman study. J. Phys. Chem. B
2003, 107 (35), 9415.
97. Bozzini, B.; Mele, C.; D’Urzo, L.; Romanello, V., An electrochemical and sers study of
cu electrodeposition from acidic sulphate solutions in the presence of 3-diethylamino-7-(4-
dimethylaminophenylazo)-5-phenylphenazinium chloride (janus green b). J. Appl. Electrochem.
2006, 36 (9), 973.
98. Bozzini, B.; D’Urzo, L.; Re, M.; De Riccardis, F., Electrodeposition of cu from acidic
sulphate solutions containing cetyltrimethylammonium bromide (ctab). J. Appl. Electroche.
2008, 38 (11), 1561.
99. Kudelski, A.; Pecul, M.; Bukowska, J., Interaction of 2-mercaptoethanesulfonate
monolayers on silver with sodium cations. J. Raman Spectrosc. 2002, 33 (10), 796.
100. Kudelski, A.; Michota, A.; Bukowska, J., Monolayers of sulfur-containing molecules at
metal surfaces as studied using sers: 3, 3′-thiodipropionic acid and 3-mercaptopropionic acid
adsorbed on silver and copper. J. Raman Spectrosc. 2005, 36 (6-7), 709.
101. Wrzosek, B.; Bukowska, J.; Kudelski, A., Raman study on the structure of adlayers
formed on silver from mixtures of 2-aminoethanethiol and 3-mercaptopropionic acid. J. Raman
Spectrosc. 2005, 36 (11), 1040.
16
102. D'Urzo, L.; Bozzini, B., A sers study of the galvanostatic sequence used for the
electrochemical deposition of copper from baths employed in the fabrication of interconnects. J.
Mater. Sci.-Mater. El. 2009, 20 (3), 217.
103. Kudelski, A., Structures of monolayers formed from different hs—(ch2)2—x thiols on
gold, silver and copper: Comparitive studies by surface-enhanced raman scattering. J. Raman
Spectrosc. 2003, 34 (11), 853.
104. Kudelski, A.; Grochala, W.; Janik-Czachor, M.; Bukowska, J.; Szummer, A.; Dolata, M.,
Surface-enhanced raman scattering (sers) at copper(i) oxide. J. Raman Spectrosc. 1998, 29 (5),
431.
105. Castro, J. L.; López-Ramírez, M. R.; Arenas, J. F.; Otero, J. C., Surface-enhanced raman
scattering of 3-mercaptopropionic acid adsorbed on a colloidal silver surface. J. Raman
Spectrosc. 2004, 35 (11), 997.
106. Kelly, J. J.; Tian, C.; West, A. C., Leveling and microstructural effects of additives for
copper electrodeposition. J. Electrochem. Soc. 1999, 146 (7), 2540.
107. Kellya, J. J.; West, A. C., Leveling of 200 nm features by organic additives. Electrochem.
Solid-State Lett. 1999, 2 (11), 561.
108. Butler, D., Energy: Nuclear power's new dawn. Nature 2004, 429 (6989), 238.
109. Vitart, X.; Le Duigou, A.; Carles, P., Hydrogen production using the sulfur–iodine cycle
coupled to a vhtr: An overview. Energ. Convers. Manage. 2006, 47 (17), 2740.
110. Marc A, R., Advances in hydrogen production by thermochemical water decomposition:
A review. Energy 2010, 35 (2), 1068.
111. Hsu, S. S.; Tsai, S. C.; Kai, J. J.; Tsai, C. H., Scc behavior and anodic dissolution of
inconel 600 in low concentration thiosulfate. J. Nucl. Mater. 1991, 184, 97.
112. Le, C. J. M.; Maximovitch, S.; Dalard, F., Electrochemical characterization of nickel-
based alloys in sulphate solutions at 320°. J. Nucl. Mater. 2004, 334, 13.
113. Lewis, N.; Attanasio, S. A.; Morton, D. S.; Young, G. A. In Stress corrosion crack
growth rate testing and analytical electron microscopy of alloy 600 as a function of pourbaix
space and microstructure, Minerals, Metals & Materials Society: 2001; pp 421.
114. Mintz, T. S.; Devine, T. M., Influence of surface films on the susceptibility of inconel
600 to stress corrosion cracking. Key Eng. Mater. 2004, 261-263 (Pt. 2, Advances in Fracture
and Failure Prevention), 875.
115. Duval, A.; Miserque, F.; Tabarant, M.; Nogier, J. P.; Gédéon, A., Influence of the oxygen
partial pressure on the oxidation of inconel 617 alloy at high temperature. Oxid. Met. 2010, 74
(5), 215.
116. Mo, K.; Lovicu, G.; Tung, H.-M.; Chen, X.; Stubbins, J. F., High temperature aging and
corrosion study on alloy 617 and alloy 230. J. Eng. Gas Turb. Power 2011, 133 (5), 052908.
117. Ren, W.; Swindeman, R., A review on current status of alloys 617 and 230 for gen iv
nuclear reactor internals and heat exchangers. J. Pressure Vessel Technol. 2009, 131 (4), 044002.
118. Ahmed, N.; Bakare, M. S.; McCartney, D. G.; Voisey, K. T., The effects of
microstructural features on the performance gap in corrosion resistance between bulk and hvof
sprayed inconel 625. Surf. Coat. Technol. 2010, 204, 2294.
119. Kewther, A.; Hashmi, M.; Yilbas, B., Corrosion properties of inconel 617 alloy after heat
treatment at elevated temperature. J. Mater. Eng. Perform. 2001, 10 (1), 108.
120. Habib, K., Electrochemical behavior of a high strength nickel-based alloy in h2so4.
Desalination 1993, 93 (1–3), 537.
17
CHAPTER 2: EXPERIMENTAL
Reagents
Chemicals were reagent grade and used as received. All solutions were prepared using
ultrapure water (Milli-Q UV plus, Millipore Inc., 18.2 MΩ cm) and H2SO4 (Ultrex II, J. T.
Baker). Corrosion inhibitors were rhodanine (RD) (99%, Sigma Aldrich) and Benzotriazole
(BTA) (98%, Sigma Aldrich). Leveler solutions were made with dodecyltrimethyl ammonium
bromide (DTAB), thonzonium bromide (ThonB)
and benzyldimethylhexadecyl ammonium
chloride (BDAC), and Na2SO4 (99.999%) and CuSO4 (99.999%) from Sigma Aldrich.
Raman experiments
Raman experiments were performed using an in-situ cell described previously.1 Potential
control was maintained with a CV-27 potentiostat (BAS). The He–Ne laser (λ=632.8 nm) was
projected onto the sample at ~45° incidence. Scattered radiation was collected with F/4
focusing
lens and focused at the entrance slit of a monochromator. A 1200 grooves/mm grating dispersed
radiation onto a cooled charge-coupled device (CCD, Andor). Typical acquisition time was 30 s.
Electrodes for Surface Enhanced Raman Spectroscopy (SERS) measurements were
polycrystalline Cu disks (1 cm diameter, Monocrystals Inc.) prepared by polishing to 0.3 um grit
Al2O3 and then electrochemically roughening in 0.1 M KCl with a Au wire counter electrode and
Ag/AgCl reference electrode. After roughening, electrodes were held at -0.56 V and then rinsed
with copious amounts of ultrapure water. 2. Raman cell setup was described previously.
1
Potential was controlled with a CHI 760D potentiostat (CH Instruments). The He–Ne laser (λ =
632.8 nm) was projected onto the sample at 45 incidence. Scattered radiation was collected with
an f /4 focusing lens and focused at the entrance slit of a monochromator. A 1200 grooves/mm

18
grating dispersed the radiation onto a cooled charge coupled device (CCD, Andor). The typical
acquisition time was 30 s.
Shell-isolated nanoparticle enhanced Raman preparation
Silica-coated gold sols were synthesized as described in the literature,3-5
a brief
explanation follows. A gold sol with 18 nm diameter particles was synthesized by using sodium
citrate reduction. The particles were coated with (3-Aminopropyl)trimethoxysilane (APS) and a
1-2 nm film of silica on the gold particles was created by immersing the APS-coated particles in
an aqueous solution containing 0.54 wt% sodium silicate that left stirring for 2-3 days. Excess
reagents and side products were removed by dialysis. TEM confirms the gold particles have an
average diameter of 18 nm with 1-2 nm thick silica shell. [insert tem]
SHINERS measurements were performed at room temperature using an in-situ cell
described previously6 with a Au wire counter electrode and Ag/AgCl reference electrode.
The excitation line was a HeNe laser (632.8) impinging the surface at a 45° angle. Scattered light
was collected with an air cooled CCD. Typical acquisition time was 30 s.
Preparation of single and polycrystalline Cu disks for SHINERS experiments
The working electrodes were 1 cm diameter Cu(111) and Cu(100) single crystals
(Monocrystals Co.). Surface orientation of the crystals was verified by four-circle XRD.
Crystals were mechanically polished to a 0.25 µm grit size (Metadi Supreme diamond
suspension, Buehler) and electropolished in 50% w/v phosphoric acid at 2 V versus a Pt counter
electrode for 30 s. After electropolishing, the crystals were rinsed with Millipore water and dried
under Ar. A film of SiO2-coated gold particles was made by drop casting 50 μL of the suspended

19
particles onto the crystal and drying under Ar. Polycrystalline Cu disks were also used as
working electrodes. They were prepared as above except the elecropolishing solution was 85%
w/v phosphoric acid. For comparison, the polished disks were also electrochemically roughened
as described in Chan and Weaver.2 Alternatively, polished disks were used for shiners
experiments without the electropolishing step for leveler study.
Preparation of Inconel 617 and Haynes 230 disks
Plates of alloy 617 and alloy 230 (made by were hot working and solution treatment at
1177 oC) were supplied by Haynes International.
7 Composition of the as-received alloys are
described in Mo et al.7 Discs (2-3 mm thick) were cut from plates. Some plates were aged in
laboratory air at temperatures of 900 o
C and 1000 oC for 3000 h. The disks were used as the
working electrodes and were polished to mirror finish with 0.3 um Al2O3 and were sonicated in
ultrapure water then rinsed with copious amounts of ultrapure water before use in experiments.
Electrochemical experiment setup
Electrochemical experiments were performed using a CHI 760D potentiostat (CH
Instruments) with a two component cell, Pt gauze counter electrode, and “no leak” Ag/AgCl
reference electrode (Cypress). Working electrodes were held in place with Kel-F collets screwed
into a rotating disk shaft connect to a modulated speed rotator (Pine Research Instrumentation).
Electrochemistry was performed using a CHI760C or CHI 760D potentiostat (CH Instruments).
Electrochemistry was performed in a two-compartment glass cell with Au wire counter electrode
separated from working electrode compartment by glass frit and a Ag/AgCl “no-leak” (Cypress)
reference electrode connected to working electrode compartment by Luggin capillary.
20
Electrochemical measurements were performed in a three electrode cell using a CHI760C
or CHI 760D potentiostat (CH Instruments). A ~1 cm Cu (poly) disk (Monocrystals Inc.) was
used as the working electrode for cyclic voltammetry, impedance versus potential measurements,
and plating experiments. A carbon rod was used as the counter electrode and a Ag/AgCl
electrode connected via a salt bridge was used as the reference. Solutions were purged with Ar
before use for 1 h, and an Ar atmosphere was maintained in
the cell during all electrochemical
measurements. The electrodes were maintained in the hanging meniscus configuration. Plating
experiments were performed with the crystal attached via a collet to a rotator (Pine
Instruments
MSRX Speed Control) and performed at a rotation rate of 120 rpm.
X-ray photoelectron spectroscopy (XPS)
XPS experiments were performed with an Axis ULTRA spectrometer (Kratos
Analytical). A monochromatic Al X-ray source was used with a 150 W source power, a 1000
meV step energy, and a 100 ms dwell time for two sweeps. Data were calibrated to a C 1s peak.
Atomic force microscopy (AFM)
AFM images were obtained in acoustic mode using a PicoSPM 300 (Molecular Imaging)
device controlled by a Nanoscope E controller (Digital Instruments). Si probes with a resonant
frequency of 300 kHz and force constant of 40 N/m were used for both imaging and scraping
(Tap300Al-G, Budget Sensors). Images were collected at a scan rate of 2.98 Hz and were further
analyzed with WSxM 3.0 (Nanotec Electronica) and OriginPro 8.5 (OriginLab). For AFM film
thickness measurements, the inhibitor film was formed by immersing the Cu(111) crystals in a
solution of 10 mM rhodanine and 0.5 M H2SO4. At the desired incubation time, a Cu crystal was
21
removed from the solution and immediately placed in the AFM cell for imaging. A solution of
0.5 M H2SO4 was used for imaging to prevent the surface film from reforming. The surface was
first imaged in situ in acoustic mode to find a smooth area. Moving into a smaller area, the
surface was then scraped in contact mode for several minutes to remove the Cu-inhibitor film.8
An image of the scraped area was obtained again in acoustic mode and the depth of the film
measured directly by using available bearing analysis software.
Calculations
Optimal geometries for three oxidation states of rhodanine with water solvation were
constructed by using the Spartan 08 program (Wavefunction, Inc) using a restricted Hartree-Fock
SCF calculation with Pulay DIIS and Geometric Direct Minimization method and a 3-21G* basis
set. After energy minimization, the Spartan program was utilized to find the normal modes and
frequencies for the anion, cation and neutral rhodanine molecules.
References
1. Biggin, M. E. Ph.D., University of Illinois at Urbana-Champaign, Champaign, IL, 2001.
2. Chan, H. Y. H.; Weaver, M. J., A vibrational structural analysis of benzotriazole
adsorption and phase film formation on copper using surface-enhanced raman spectroscopy.
Langmuir 1999, 15 (9), 3348.
3. Li, J.-F.; Li, S.-B.; Anema, J. R.; Yang, Z.-L.; Huang, Y.-F.; Ding, Y.; Wu, Y.-F.; Zhou,
X.-S.; Wu, D.-Y.; Ren, B.; Wang, Z.-L.; Tian, Z.-Q., Synthesis and characterization of gold
nanoparticles coated with ultrathin and chemically inert dielectric shells for shiners applications.
Appl. Spectrosc. 2011, 65, 620.
4. Li, J. F.; Huang, Y. F.; Ding, Y.; Yang, Z. L.; Li, S. B.; Zhou, X. S.; Fan, F. R.; Zhang,
W.; Zhou, Z. Y.; WuDe, Y.; Ren, B.; Wang, Z. L.; Tian, Z. Q., Shell-isolated nanoparticle-
enhanced raman spectroscopy. Nature 2010, 464 (7287), 392.
5. Honesty, N. R.; Gewirth, A. A., Shell-isolated nanoparticle enhanced raman spectroscopy
(shiners) investigation of benzotriazole film formation on cu(100), cu(111), and cu(poly). J.
Raman. Spectrosc. 2012, 43 (1), 46.
22
6. Biggin, M. E. In situ vibrational spectroscopic and electrochemical study of
electrodeposition additives on copper surfaces. Ph.D., University of Illinois at Urbana-
Champaign, Champaign, IL, 2001.
7. Mo, K.; Lovicu, G.; Tung, H.-M.; Chen, X.; Stubbins, J. F., High temperature aging and
corrosion study on alloy 617 and alloy 230. J. Eng. Gas Turb. Power 2011, 133 (5), 052908.
8. Goss, C. A.; Brumfield, J. C.; Irene, E. A.; Murray, R. W., In situ atomic force
microscopic imaging of electrochemical formation of a thin dielectric film. Poly(phenylene
oxide). Langmuir 1992, 8 (5), 1459.
23
CHAPTER 3: SHELL-ISOLATED NANOPARTICLE ENHANCED RAMAN
SPECTROSCOPY OF BENZOTRIAZOLE FILM FORMATION ON CU(100), CU(111)
AND CU(POLY)1
Introduction
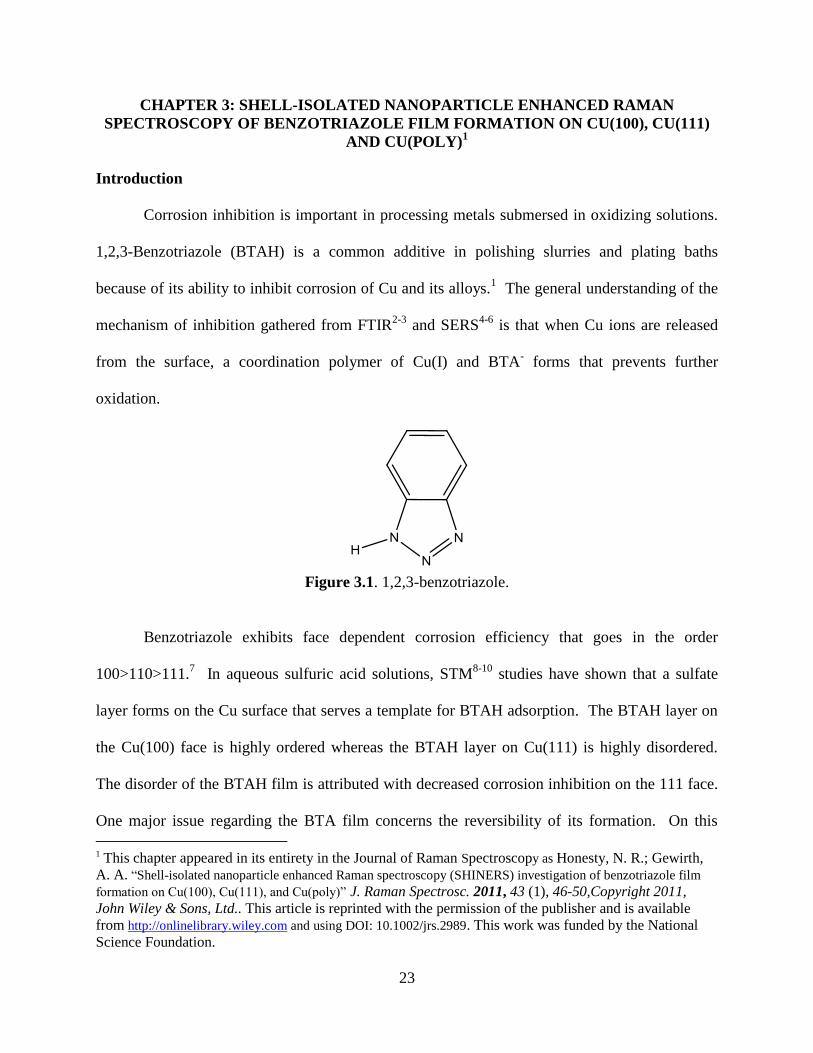
Corrosion inhibition is important in processing metals submersed in oxidizing solutions.
1,2,3-Benzotriazole (BTAH) is a common additive in polishing slurries and plating baths
because of its ability to inhibit corrosion of Cu and its alloys.1 The general understanding of the
mechanism of inhibition gathered from FTIR2-3
and SERS4-6
is that when Cu ions are released
from the surface, a coordination polymer of Cu(I) and BTA- forms that prevents further
oxidation.
Figure 3.1. 1,2,3-benzotriazole.
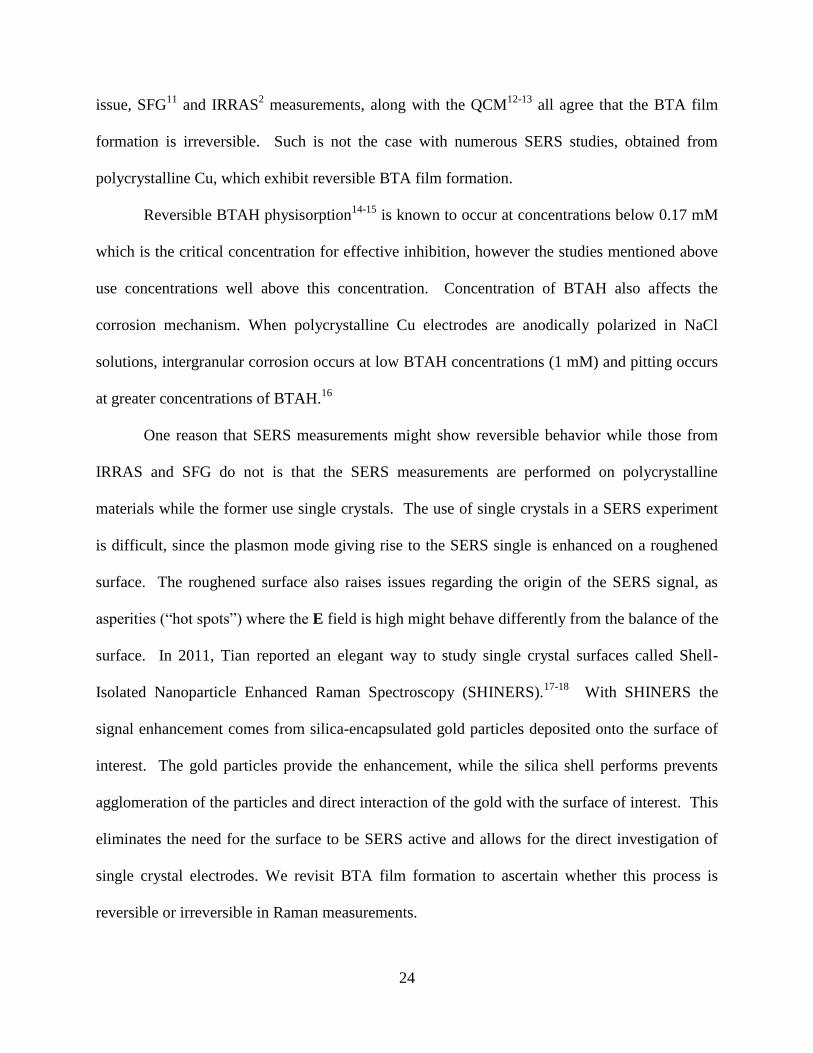
Benzotriazole exhibits face dependent corrosion efficiency that goes in the order
100>110>111.7 In aqueous sulfuric acid solutions, STM
8-10 studies have shown that a sulfate
layer forms on the Cu surface that serves a template for BTAH adsorption. The BTAH layer on
the Cu(100) face is highly ordered whereas the BTAH layer on Cu(111) is highly disordered.
The disorder of the BTAH film is attributed with decreased corrosion inhibition on the 111 face.
One major issue regarding the BTA film concerns the reversibility of its formation. On this
1 This chapter appeared in its entirety in the Journal of Raman Spectroscopy as Honesty, N. R.; Gewirth,
A. A. “Shell-isolated nanoparticle enhanced Raman spectroscopy (SHINERS) investigation of benzotriazole film
formation on Cu(100), Cu(111), and Cu(poly)” J. Raman Spectrosc. 2011, 43 (1), 46-50,Copyright 2011,
John Wiley & Sons, Ltd.. This article is reprinted with the permission of the publisher and is available
from http://onlinelibrary.wiley.com and using DOI: 10.1002/jrs.2989. This work was funded by the National
Science Foundation.
24
issue, SFG11
and IRRAS2 measurements, along with the QCM
12-13 all agree that the BTA film
formation is irreversible. Such is not the case with numerous SERS studies, obtained from
polycrystalline Cu, which exhibit reversible BTA film formation.
Reversible BTAH physisorption14-15
is known to occur at concentrations below 0.17 mM
which is the critical concentration for effective inhibition, however the studies mentioned above
use concentrations well above this concentration. Concentration of BTAH also affects the
corrosion mechanism. When polycrystalline Cu electrodes are anodically polarized in NaCl
solutions, intergranular corrosion occurs at low BTAH concentrations (1 mM) and pitting occurs
at greater concentrations of BTAH.16
One reason that SERS measurements might show reversible behavior while those from
IRRAS and SFG do not is that the SERS measurements are performed on polycrystalline
materials while the former use single crystals. The use of single crystals in a SERS experiment
is difficult, since the plasmon mode giving rise to the SERS single is enhanced on a roughened
surface. The roughened surface also raises issues regarding the origin of the SERS signal, as
asperities (“hot spots”) where the E field is high might behave differently from the balance of the
surface. In 2011, Tian reported an elegant way to study single crystal surfaces called Shell-
Isolated Nanoparticle Enhanced Raman Spectroscopy (SHINERS).17-18
With SHINERS the
signal enhancement comes from silica-encapsulated gold particles deposited onto the surface of
interest. The gold particles provide the enhancement, while the silica shell performs prevents
agglomeration of the particles and direct interaction of the gold with the surface of interest. This
eliminates the need for the surface to be SERS active and allows for the direct investigation of
single crystal electrodes. We revisit BTA film formation to ascertain whether this process is
reversible or irreversible in Raman measurements.

25
Results and Discussion
In voltammetry, although there are minimal differences for the onset hydrogen evolution
on different faces,2, 19
crystallographic orientation has no significant effect on kinetics of Cu
dissolution in BTAH containing H2SO4 solutions.8 Figure 3.1 shows the cyclic voltammograms
of particle coated single crystal copper surfaces. The particle coating does not appear to affect
the onset of hydrogen evolution or Cu dissolution relative to literature.8, 10, 19
-20
0
20
40
-20
0
20
40
-20
0
20
40
-0.8 -0.6 -0.4 -0.2 0.0 0.2 0.4-20
0
20
40
Cu(100)
Cu(111)
Cu
rre
nt
de
nsity (A
cm
-2)
Cu(poly)
roughened Cu(poly)
Potential (V vs Ag/AgCl)Figure 3.2. Cyclic voltammograms of particle-coated Cu(100) , Cu(111), Cu(poly), and
roughened Cu(poly) in 75 mM BTAH, 0.1 M H2SO4 at a 50 mV s-1
scan rate.
Raman spectra from solid BTAH, an aqueous solution consisting of, 0.75 mM BTAH + 0.1 M
H2SO4, SERS of Cu(poly) and SHINERS from Cu(111), Cu(100) and Cu(poly) are displayed in
26
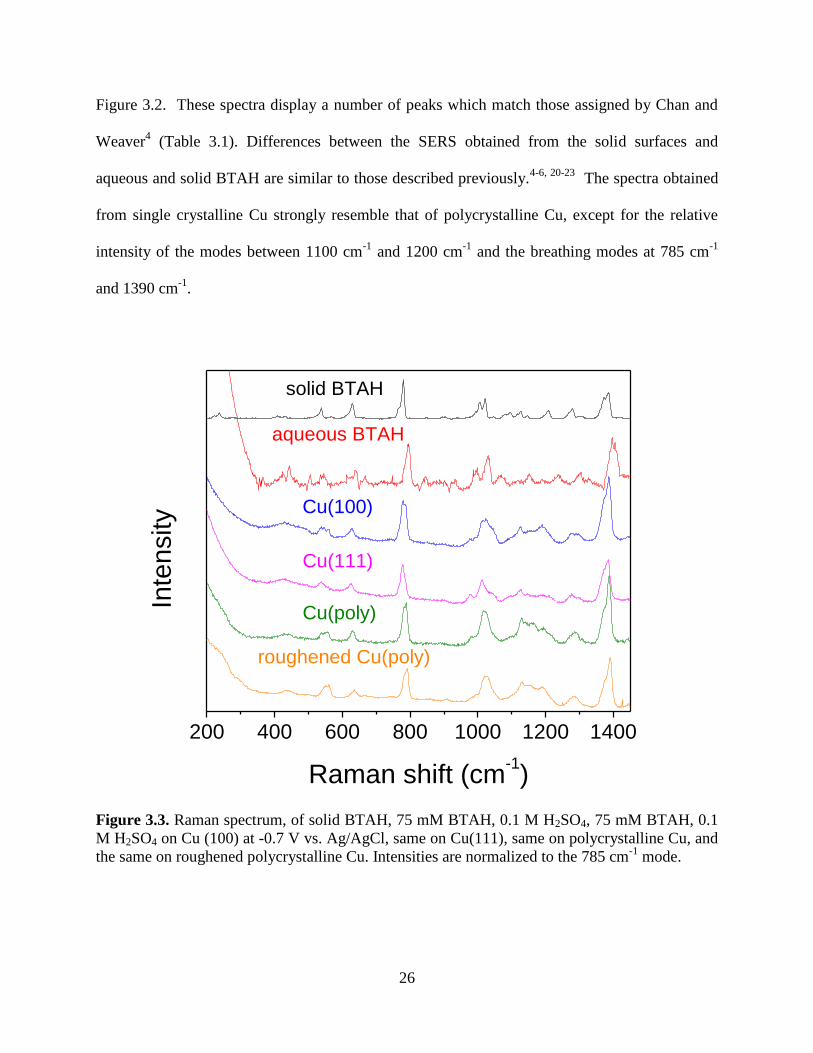
Figure 3.2. These spectra display a number of peaks which match those assigned by Chan and
Weaver4 (Table 3.1). Differences between the SERS obtained from the solid surfaces and
aqueous and solid BTAH are similar to those described previously.4-6, 20-23
The spectra obtained
from single crystalline Cu strongly resemble that of polycrystalline Cu, except for the relative
intensity of the modes between 1100 cm-1
and 1200 cm-1
and the breathing modes at 785 cm-1
and 1390 cm-1
.
200 400 600 800 1000 1200 1400
roughened Cu(poly)
Inte
nsity
Raman shift (cm-1)
Cu(poly)
Cu(111)
Cu(100)
aqueous BTAH
solid BTAH
Figure 3.3. Raman spectrum, of solid BTAH, 75 mM BTAH, 0.1 M H2SO4, 75 mM BTAH, 0.1
M H2SO4 on Cu (100) at -0.7 V vs. Ag/AgCl, same on Cu(111), same on polycrystalline Cu, and
the same on roughened polycrystalline Cu. Intensities are normalized to the 785 cm-1
mode.

27
Table 3.1. Peaks (cm-1
) and their assignments for spectra shown in Figure 1.
vibrational frequencies/cm-1
solid
BTAH
solution
BTAH Cu(100) Cu(111) Cu(poly)
roughened
Cu(poly)
Chan and
Weaver4
Band
Assignments4, 6
235
skeletal torsion
429
442 428 435 436 440 skeletal torsion
537
545 537 549 553 555 triazole ring
bend
628
627 626 630 635 653 triazole ring
torsion
779 796 781 779 785 788 790 benzene ring
breathing
993 978 976 982 974
SO4 symmetric
stretch
1006
1013 1014 1019
1010 benzene skeletal
and (CH) bend
1022 1030 1024
1025 1024 1020 benzene skeletal
and (CH) bend
1072
1045 1046
(NH) bend
1127
1129 1125 1128 1127
(CH) bend
1147
1148 1134 1145 1140 (NH) bend6
1171
1158
1164 1159 1160
triazole
assymmetric
stretch and
(NH) bend
1206
1189 1192 1193 1196 1190 combination
1280
1285 1297 1286 1284 1286
skeletal stretch
(NH) bend and
(CH) bend
1374
1373 1375 1377 1380 1370 F. R. with 1385
1387 1396 1388 1388 1388 1391 1385 combination
breathing
1443
1444
1440 skeletal stretch
28
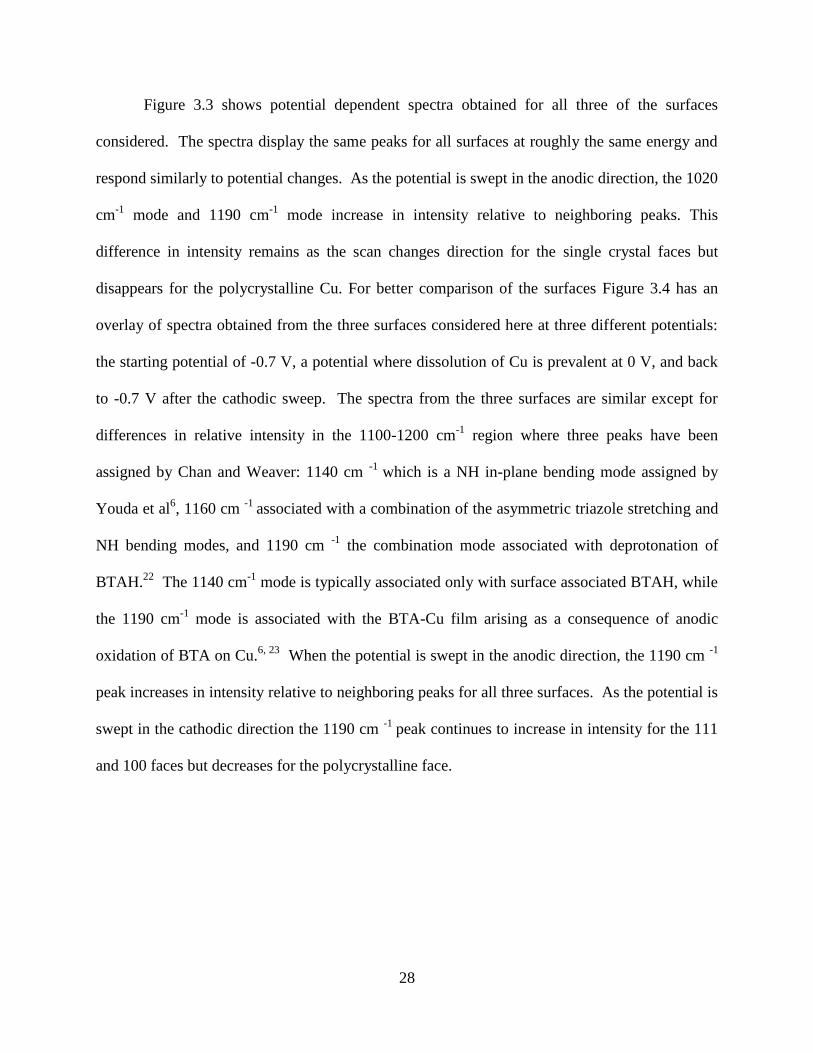
Figure 3.3 shows potential dependent spectra obtained for all three of the surfaces
considered. The spectra display the same peaks for all surfaces at roughly the same energy and
respond similarly to potential changes. As the potential is swept in the anodic direction, the 1020
cm-1
mode and 1190 cm-1
mode increase in intensity relative to neighboring peaks. This
difference in intensity remains as the scan changes direction for the single crystal faces but
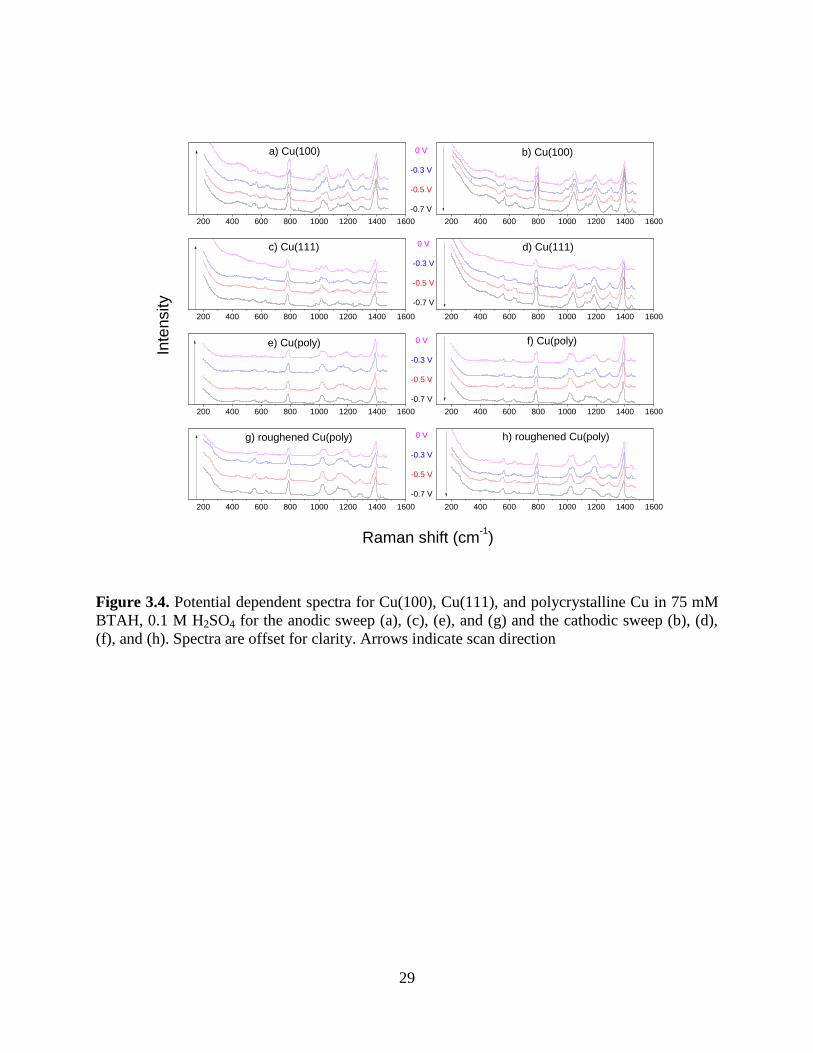
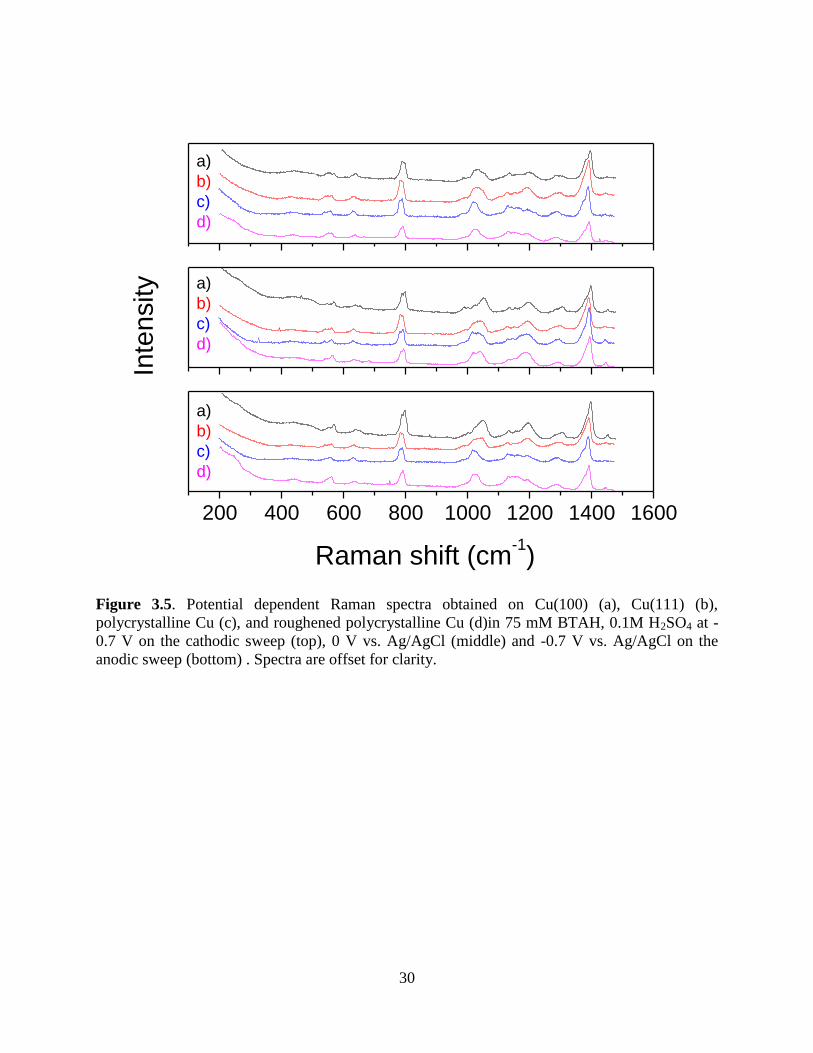
disappears for the polycrystalline Cu. For better comparison of the surfaces Figure 3.4 has an
overlay of spectra obtained from the three surfaces considered here at three different potentials:
the starting potential of -0.7 V, a potential where dissolution of Cu is prevalent at 0 V, and back
to -0.7 V after the cathodic sweep. The spectra from the three surfaces are similar except for
differences in relative intensity in the 1100-1200 cm-1
region where three peaks have been
assigned by Chan and Weaver: 1140 cm -1
which is a NH in-plane bending mode assigned by
Youda et al6, 1160 cm
-1 associated with a combination of the asymmetric triazole stretching and
NH bending modes, and 1190 cm -1
the combination mode associated with deprotonation of
BTAH.22
The 1140 cm-1
mode is typically associated only with surface associated BTAH, while
the 1190 cm-1
mode is associated with the BTA-Cu film arising as a consequence of anodic
oxidation of BTA on Cu.6, 23
When the potential is swept in the anodic direction, the 1190 cm -1
peak increases in intensity relative to neighboring peaks for all three surfaces. As the potential is
swept in the cathodic direction the 1190 cm -1
peak continues to increase in intensity for the 111
and 100 faces but decreases for the polycrystalline face.
29
200 400 600 800 1000 1200 1400 1600 200 400 600 800 1000 1200 1400 1600
200 400 600 800 1000 1200 1400 1600 200 400 600 800 1000 1200 1400 1600
200 400 600 800 1000 1200 1400 1600 200 400 600 800 1000 1200 1400 1600
200 400 600 800 1000 1200 1400 1600 200 400 600 800 1000 1200 1400 1600
0 V
-0.3 V
-0.5 V
-0.7 V
0 V
-0.3 V
-0.5 V
-0.7 V
0 V
-0.3 V
-0.5 V
-0.7 V
0 V
-0.3 V
-0.5 V
-0.7 V
Inte
nsity
g) roughened Cu(poly)
h) roughened Cu(poly)
Raman shift (cm-1)
a) Cu(100)
c) Cu(111)
b) Cu(100)
d) Cu(111)
f) Cu(poly) e) Cu(poly)
Figure 3.4. Potential dependent spectra for Cu(100), Cu(111), and polycrystalline Cu in 75 mM
BTAH, 0.1 M H2SO4 for the anodic sweep (a), (c), (e), and (g) and the cathodic sweep (b), (d),
(f), and (h). Spectra are offset for clarity. Arrows indicate scan direction
30
200 400 600 800 1000 1200 1400 1600
a)
b)
c)
d)
a)
b)
c)
d)
Inte
nsity
a)
b)
c)
d)
Raman shift (cm-1)
Figure 3.5. Potential dependent Raman spectra obtained on Cu(100) (a), Cu(111) (b),
polycrystalline Cu (c), and roughened polycrystalline Cu (d)in 75 mM BTAH, 0.1M H2SO4 at -
0.7 V on the cathodic sweep (top), 0 V vs. Ag/AgCl (middle) and -0.7 V vs. Ag/AgCl on the
anodic sweep (bottom) . Spectra are offset for clarity.
31
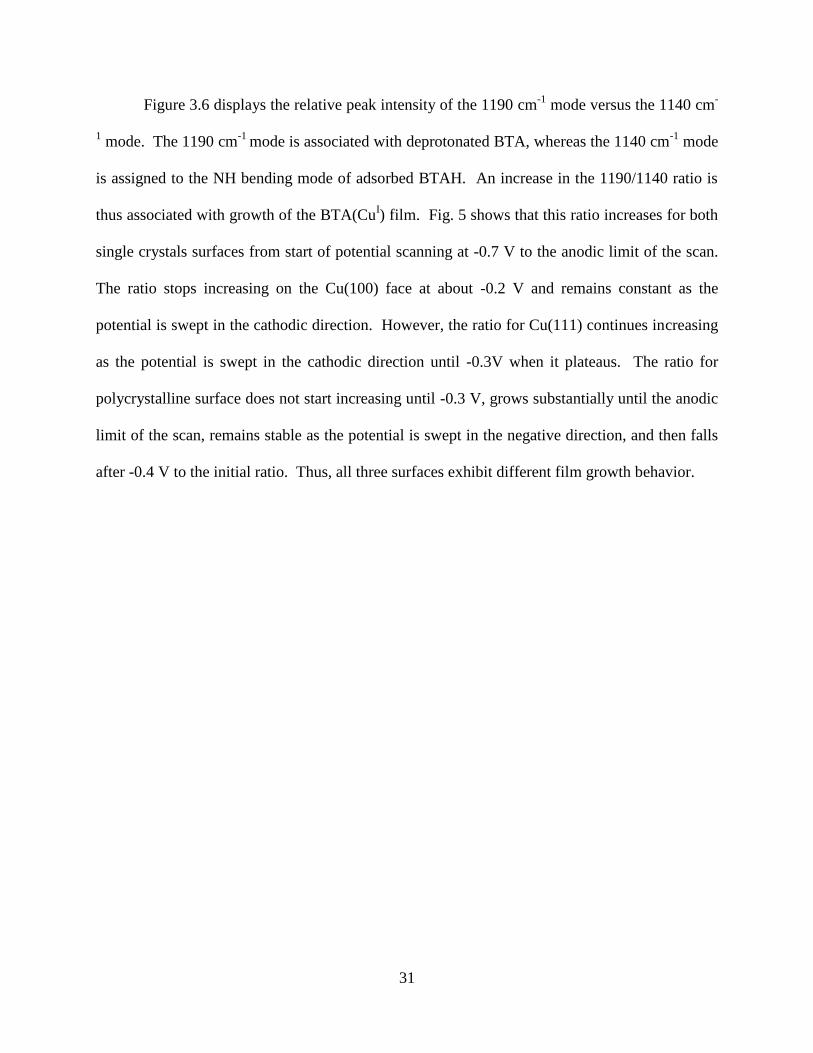
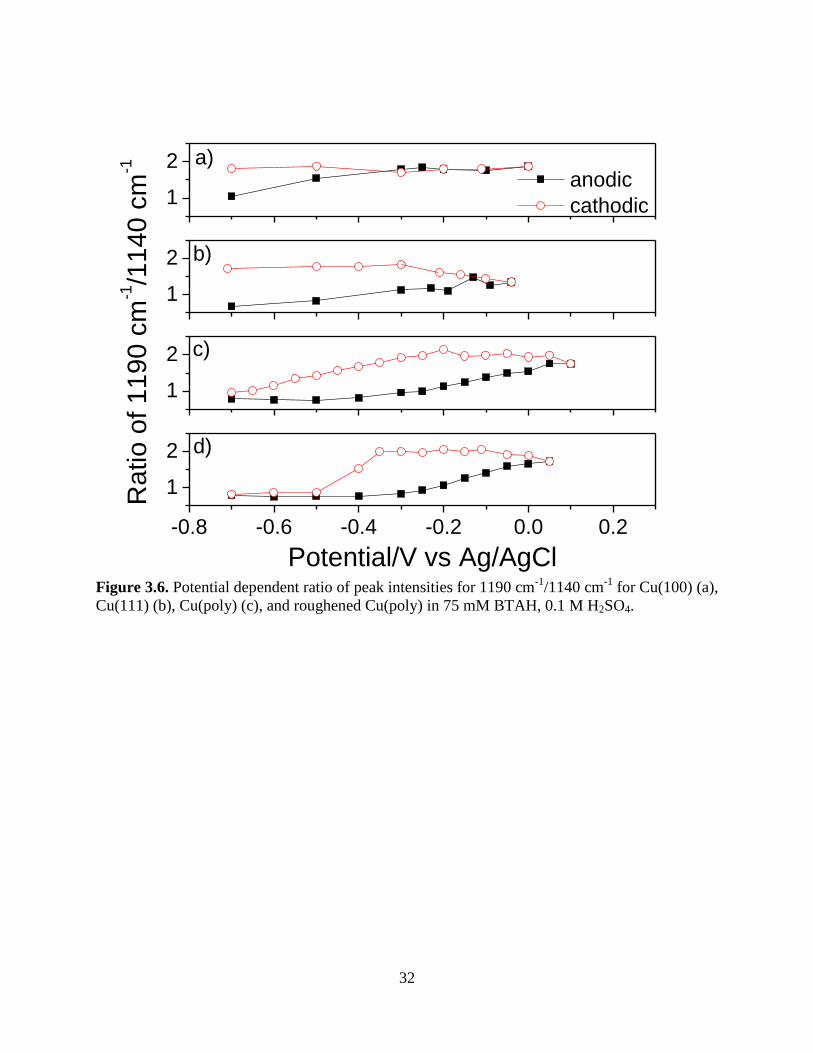
Figure 3.6 displays the relative peak intensity of the 1190 cm-1
mode versus the 1140 cm-
1 mode. The 1190 cm
-1 mode is associated with deprotonated BTA, whereas the 1140 cm
-1 mode
is assigned to the NH bending mode of adsorbed BTAH. An increase in the 1190/1140 ratio is
thus associated with growth of the BTA(CuI) film. Fig. 5 shows that this ratio increases for both
single crystals surfaces from start of potential scanning at -0.7 V to the anodic limit of the scan.
The ratio stops increasing on the Cu(100) face at about -0.2 V and remains constant as the
potential is swept in the cathodic direction. However, the ratio for Cu(111) continues increasing
as the potential is swept in the cathodic direction until -0.3V when it plateaus. The ratio for
polycrystalline surface does not start increasing until -0.3 V, grows substantially until the anodic
limit of the scan, remains stable as the potential is swept in the negative direction, and then falls
after -0.4 V to the initial ratio. Thus, all three surfaces exhibit different film growth behavior.
32
1
2
1
2
1
2
-0.8 -0.6 -0.4 -0.2 0.0 0.2
1
2
anodic
cathodic
a)
b)
Ra
tio
of 1
19
0 c
m-1/1
14
0 c
m-1
c)
d)
Potential/V vs Ag/AgCl
Figure 3.6. Potential dependent ratio of peak intensities for 1190 cm-1
/1140 cm-1
for Cu(100) (a),
Cu(111) (b), Cu(poly) (c), and roughened Cu(poly) in 75 mM BTAH, 0.1 M H2SO4.

33
The behavior displayed in the SHINERS of the BTA film formed on single crystal Cu
here matches that found in other in-situ studies using Cu single crystals. STM,8, 10
IRRAS,2 and
SFG11
all show that the BTA film persists on the cathodic sweep, while film formation on the
polycrystalline surface in sulfuric acid – as measured in SERS – is reversible.4, 6
Thus reversible
BTA film formation observed in SERS on Cu seems to be intrinsic to the polycrystalline material
used previously4, 6
.
Why should the SERS signal show reversibility of the film on polycrystalline Cu? First,
Cl- -- introduced during roughening of the Cu surface -- could change properties of the BTA
film. Many studies have shown that adding Cl-, which competes for surface sites and
coordinates to the BTA-Cu film, will promote reversibility. 2, 5, 11, 24
However, other SERS
studies on polycrystalline Cu explicitly avoid roughening in Cl- - containing solution, yet the
reversibility persists.6 Second, the large number of grain boundaries present on the
polycrystalline material might affect the BTA film. Calculations of monomeric BTA and BTA-
Cu oligomer chains show that the BTA-Cu chains adsorb more strongly to the Cu surface than
monomeric BTA, thus allowing dissolution of the film from defect sites at grain boundaries.25-27
Tian suggests that negative potentials both reduce the size of the oligomers and attract sufficient
H+ to reprotonate coordinated BTA
-5, 24. A similar mechanism is suggested to occur with BTA
films with ionic liquids as the solvent.28
Disruption at grain boundaries could allow
reprotonation to occur on BTA-Cu films formed on polycrystalline Cu.
Conclusions

34
We showed that film formation depend on the face of the Cu crystal exposed. More
generally, the SHINERS technique allows information about growth on single crystal surfaces to
be obtained.
References
1. Finsgar, M.; Milosev, I., Inhibition of copper corrosion by 1,2,3-benzotriazole: A review.
Corros. Sci. 2010, 52 (9), 2737.
2. Biggin, M. E.; Gewirth, A. A., Infrared studies of benzotriazole on copper electrode
surfaces - role of chloride in promoting reversibility. J. Electrochem. Soc. 2001, 148 (5), C339.
3. Poling, G. W., Reflection infrared studies of films formed by benzotriazole on copper.
Corros. Sci. 1970, 10 (5), 359.
4. Chan, H. Y. H.; Weaver, M. J., A vibrational structural analysis of benzotriazole
adsorption and phase film formation on copper using surface-enhanced raman spectroscopy.
Langmuir 1999, 15 (9), 3348.
5. Rubim, J.; Gutz, I. G. R.; Sala, O.; Orville-Thomas, W. J., Surface enhanced raman
spectra of benzotriazole adsorbed on a copper electrode. J. Mol. Struct. 1983, 100, 571.
6. Youda, R.; Nishihara, H.; Aramaki, K., A sers [surface-enhanced raman scattering] study
on inhibition mechanisms of benzotriazole and its derivatives for copper corrosion in sulfate
solutions. Corros. Sci. 1988, 28 (1), 87.
7. Mayanna, S. M.; Setty, T. H. V., Effect of benzotriazole on the dissolution of copper
single crystal planes in dilute sulphuric acid. Corros. Sci. 1975, 15 (6-12), 627.
8. Polewska, W.; Vogt, M. R.; Magnussen, O. M.; Behm, R. J., In situ stm study of cu(111)
surface structure and corrosion in pure and benzotriazole-containing sulfuric acid solution. J.
Phys. Chem. B 1999, 103 (47), 10440.
9. Vogt, M. R.; Lachenwitzer, A.; Magnussen, O. M.; Behm, R. J., In-situ stm study of the
initial stages of corrosion of cu(100) electrodes in sulfuric and hydrochloric acid solution. Surf.
Sci. 1998, 399 (1), 49.
10. Vogt, M. R.; Polewska, W.; Magnussen, O. M.; Behm, R. J., In situ stm study of (100) cu
electrodes in sulfuric acid solution in the presence of benzotriazole: Adsorption, cu corrosion,
and cu deposition. J. Electrochem. Soc. 1997, 144 (5), L113.
11. Schultz, Z. D.; Biggin, M. E.; White, J. O.; Gewirth, A. A., Infrared-visible sum
frequency generation investigation of cu corrosion inhibition with benzotriazole. Anal. Chem.
2004, 76 (3), 604.
12. Al Kharafi, F. M.; Abdullah, A. M.; Ateya, B. G., A quartz crystal microbalance study of
the kinetics of interaction of benzotriazole with copper. J. Appl. Electrochem. 2007, 37 (10),
1177.
13. Bayoumi, F. M.; Abdullah, A. M.; Attia, B., Kinetics of corrosion inhibition of
benzotriazole to copper in 3.5% nacl. Mater. Corros. 2008, 59 (8), 691.
14. Allam, N. K.; Hegazy, H. S.; Ashour, E. A., Adsorption-desorption kinetics of
benzotriazole on cathodically polarized copper. J. Electrochem. Soc. 2010, 157 (5), C174.
15. Jin-Hua, C., Zhi-Cheng, L., Shu, C., Li-Hua, N., Shou-Zhuo, Y., An xps and baw sensor
study of the structure and real-time growth behavior of a complex surface film on copper in

35
sodium chloride solutions (ph = 9), containing a low concentration of benzotriazole.
Electrochim. Acta 1997, 43 (3-4), 265.
16. Abdullah, A. M.; Al-Kharafi, F. M.; Ateya, B. G., Intergranular corrosion of copper in
the presence of benzotriazole. Scr. Mater. 2006, 54 (9), 1673.
17. Li, J. F.; Huang, Y. F.; Ding, Y.; Yang, Z. L.; Li, S. B.; Zhou, X. S.; Fan, F. R.; Zhang,
W.; Zhou, Z. Y.; WuDe, Y.; Ren, B.; Wang, Z. L.; Tian, Z. Q., Shell-isolated nanoparticle-
enhanced raman spectroscopy. Nature 2010, 464 (7287), 392.
18. Graham, D., The next generation of advanced spectroscopy: Surface enhanced raman
scattering from metal nanoparticles. Angew. Chem., Int. Ed. 2010, 9325.
19. Wu, Y. C. Z., P.; Pickering, H. W.; Allara, D. L., Effect of potassium iodide on
improving copper corrosion inhibition efficiency of benzotriazole in sulfuric acid electrolytes. J.
Electrochem. Soc. 1993, 140 (10), 2791.
20. Shoesmith, D. W., Lee, W., The dissolution of cupric hydroxide films from copper
surfaces. Electrochim. Acta 1977, 22, 1411.
21. Stewart, K. L.; Zhang, J.; Li, S. T.; Carter, P. W.; Gewirth, A. A., Anion effects on cu-
benzotriazole film formation - implications for cmp. J. Electrochem. Soc. 2007, 154 (1), D57.
22. Weaver, G. C.; Norrod, K., Surface-enhanced raman spectroscopy: A novel physical
chemistry experiment for the undergraduate laboratory. Journal of Chemical Education 1998, 75
(5), 621.
23. Youda, R.; Nishihara, H.; Aramaki, K., Sers and impedance study of the equilibrium
between complex formation and adsorption of benzotriazole and 4-hydroxybenzotriazole on a
copper electrode in sulfate solutions. Electrochim. Acta 1990, 35 (6), 1011.
24. Cao, P. G.; Yao, J. L.; Zheng, J. W.; Gu, R. A.; Tian, Z. Q., Comparative study of
inhibition effects of benzotriazole for metals in neutral solutions as observed with surface-
enhanced raman spectroscopy. Langmuir 2002, 18 (1), 100.
25. Kokalj, A.; Peljhan, S.; Finšgar, M.; Milošev, I., What determines the inhibition
effectiveness of ata, btah, and btaoh corrosion inhibitors on copper? J. Am. Chem. Soc. 2010.
26. Kokalj, A.; Peljhan, S., Density functional theory study of ata, btah, and btaoh as copper
corrosion inhibitors: Adsorption onto cu(111) from gas phase. Langmuir 2010, 26 (18), 14582.
27. Jiang, Y.; Adams, J. B., First principle calculations of benzotriazole adsorption onto clean
cu(111). Surf. Sci. 2003, 529 (3), 428.
28. Costa, L. A. F.; Breyer, H. S.; Rubim, J. C., Surface-enhanced raman scattering (sers) on
copper electrodes in 1-n-butyl-3-methylimidazoliun tetrafluorbarate (bmi.Bf4): The adsorption
of benzotriazole (btah). Vib. Spectrosc. 2010, 54 (2), 103.
36
CHAPTER 4: SURFACE ENHANCED RAMAN INVESTIGATION OF RHODANINE
FILM FORMATION ON COPPER ELECTRODES2
Introduction
Rhodanine (RD) is a member of the thiozolidine group which has many industrial and
pharmacological applications including dyes1, antimicrobials
2-3, and as a drug scaffold.
4 Many
RD derivatives readily forms complexes with Ag and Cu ions in solution and also forms a film
on Ag colloid surfaces.5-7
Abdallah and others have shown it to have protective capabilities for
Cu.8-9
The protection of the films is attributed to the thiol group which adsorbs strongly to metal
surfaces.9
Many structural studies of RD have been performed including single crystal x-ray
diffraction,10-11
FTIR,12-15
Raman spectroscopy5-6, 13
, and DFT calculations.5-6, 13, 16
It has 11
tautomers, 5 of which are pictured in Figure 4.1. A few SERS studies investigating the
adsorption RD on Ag colloids have been undertaken. It was found that RD can make a RD-Ag(I)
organometallic complex6 or a dimerize
5 on the Ag surface.
2Work was performed with help from Professor Gülfeza Kardaş and her group at Cukurova University
which performed the fitting and interpretation of electrochemical data in Figures 4.2-4.6 as well as the
idea for the project.

37
Figure 4.1. Tautomers of rhodanine (RD).
Although many structural studies have been undertaken with RD and RD complexes,
there are few which examine the interaction between RD and metallic surfaces. As of yet, no
spectroelectrochemical experiments for RD have been published. In this chapter, we interrogate
the electrochemical behavior of RD with roughened Cu and use Surface Enhanced Raman
Spectroscopy (SERS) to study RD film formation on the electrode surface SERS allows for
vibrational information from electrode-electrolyte interface to be gathered.
Electrochemical impedance spectroscopy (EIS) measurements
Fig. 4.2 shows Nyquist plots for copper in 0.5 M H2SO4 solution with and without 10
mM RD and 10 mM BTAH at 0 time. It is clear that the impedance response of copper has
significantly changed after immersing in RD and BTAH solutions for 0 min.
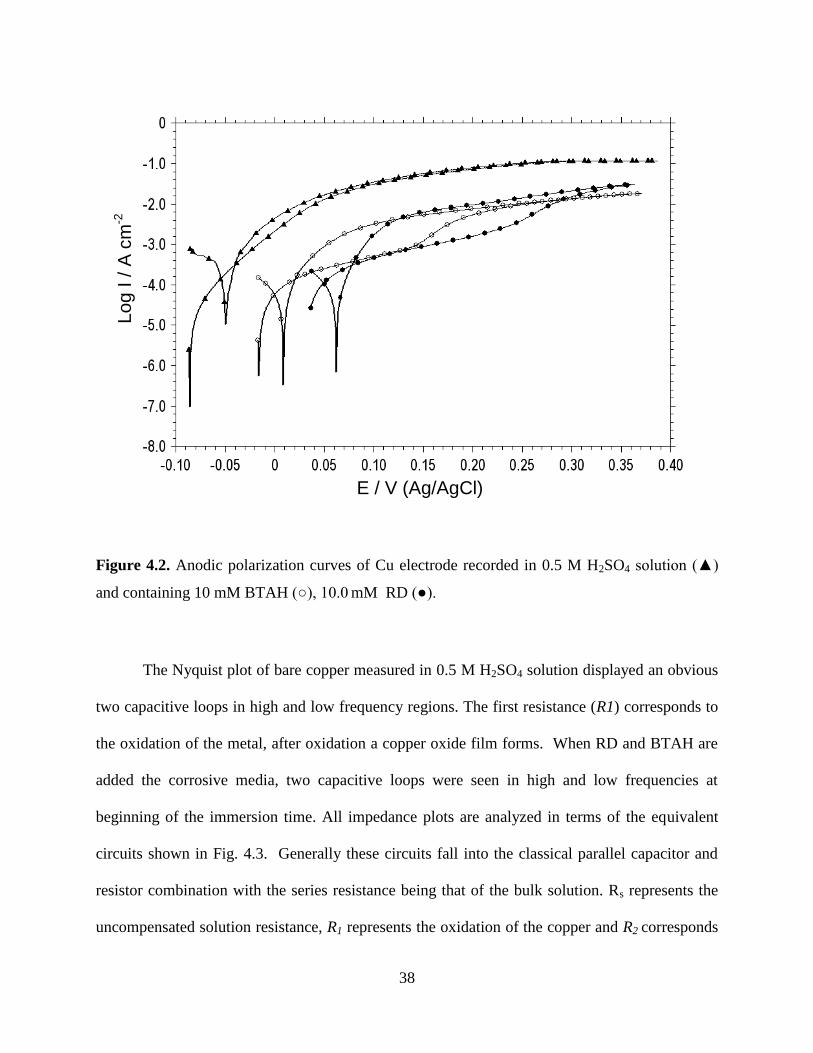
38
Figure 4.2. Anodic polarization curves of Cu electrode recorded in 0.5 M H2SO4 solution ()
and containing 10 mM BTAH (), 10.0 mM RD ().
The Nyquist plot of bare copper measured in 0.5 M H2SO4 solution displayed an obvious
two capacitive loops in high and low frequency regions. The first resistance (R1) corresponds to
the oxidation of the metal, after oxidation a copper oxide film forms. When RD and BTAH are
added the corrosive media, two capacitive loops were seen in high and low frequencies at
beginning of the immersion time. All impedance plots are analyzed in terms of the equivalent
circuits shown in Fig. 4.3. Generally these circuits fall into the classical parallel capacitor and
resistor combination with the series resistance being that of the bulk solution. Rs represents the
uncompensated solution resistance, R1 represents the oxidation of the copper and R2 corresponds
E / V (Ag/AgCl)
Lo
g I / A
cm
-2

39
to the copper oxides film resistance for copper in 0.5 M H2SO4 solution. In Fig. 5, R1: oxide (Rox)
and/or film resistance (Rf), R2: pore resistance (Rpor= Rct + Rd + Ra), Rp = R1 + R2. Rp:
polarization resistance, Rct: charge transfer resistance, Rd: diffuse layer resistance, Ra: resistance
of accumulated species, CPE1: oxide/film capacitance, CPE2: double layer capacitance. n
shows the phase shift which can be explained as the degree of surface inhomogeneity or surface
roughness.17
The value of n is between 0 and 1 (0≤n≤1). This is related to deviation from the
ideal capacitive behavior. CPE represents a constant phase element to replace a double layer
capacitance (Cdl) in order to give a more accurate fit to the experimental results. 18-19
The
impedance parameters obtained by fitting the EIS data to the equivalent circuit are listed in Table
1. In this case, the inhibition efficiency (η) can be calculated from the polarization resistance
using the following formula;
η %
'
'
p
pp
R
RRx100 (4.1)
Where and are uninhibited and inhibited polarization resistances, respectively.
Figure 4.3. The equivalent circuit model for corrosion process of the Cu absence and presence
inhibitors. Rp = R1 + R2. Rs: uncompensated solution resistance, Rp: polarization resistance, R1:
film resistance (Rf), R2: pore resistance (Rpor= Rct + Rd + Ra), Rct: charge transfer resistance, Rd:
pR '
pR
CPE1
RP=R1+R2
CPE2
R1
R2
Rs
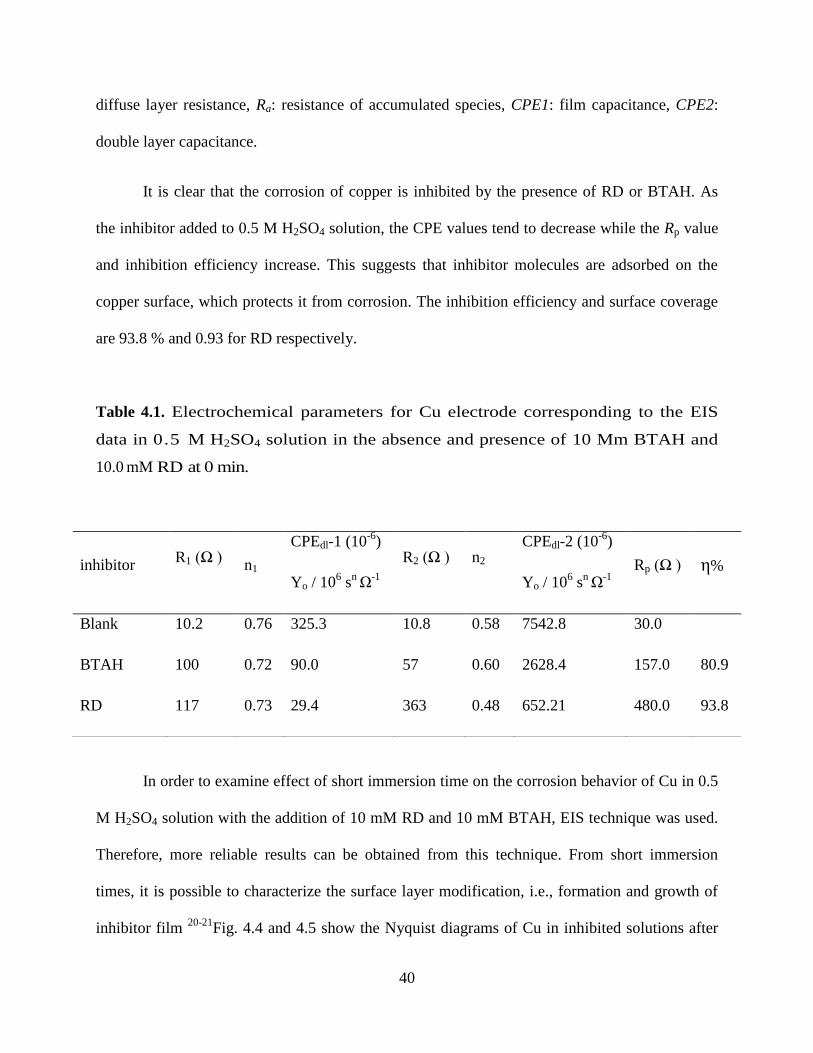
40
diffuse layer resistance, Ra: resistance of accumulated species, CPE1: film capacitance, CPE2:
double layer capacitance.
It is clear that the corrosion of copper is inhibited by the presence of RD or BTAH. As
the inhibitor added to 0.5 M H2SO4 solution, the CPE values tend to decrease while the Rp value
and inhibition efficiency increase. This suggests that inhibitor molecules are adsorbed on the
copper surface, which protects it from corrosion. The inhibition efficiency and surface coverage
are 93.8 % and 0.93 for RD respectively.
Table 4.1. Electrochemical parameters for Cu electrode corresponding to the EIS
data in 0.5 M H2SO4 solution in the absence and presence of 10 Mm BTAH and
10.0 mM RD at 0 min.
In order to examine effect of short immersion time on the corrosion behavior of Cu in 0.5
M H2SO4 solution with the addition of 10 mM RD and 10 mM BTAH, EIS technique was used.
Therefore, more reliable results can be obtained from this technique. From short immersion
times, it is possible to characterize the surface layer modification, i.e., formation and growth of
inhibitor film 20-21
Fig. 4.4 and 4.5 show the Nyquist diagrams of Cu in inhibited solutions after
inhibitor R1 (Ω )
n1
CPEdl-1 (10-6
)
Yo / 106 s
n Ω
-1
R2 (Ω ) n2 CPEdl-2 (10
-6)
Yo / 106 s
n Ω
-1
Rp (Ω ) η%
Blank 10.2 0.76 325.3 10.8 0.58 7542.8 30.0
BTAH 100 0.72 90.0 57 0.60 2628.4 157.0 80.9
RD 117 0.73 29.4 363 0.48 652.21 480.0 93.8

41
exposure times ranging from 0 to 2 h. The insets correspond to a magnification of high
frequencies region. Impedance diagrams obtained in 0.5 M H2SO4 were fit to the electrical
equivalent circuit presented in Fig. 4.5. The related electrochemical data are collected in Table
4.2. It is apparent from Fig. 4.4, at the high frequency regions, a weak depressed semicircle and
at the low frequency regions, a large depressed semicircle is observed in the Nyquist plots of RD
or BTAH. The first loop was related to the pore resistance (Rpor), and the second one was
attributed to the film resistance (Rf).22
The film resistance becomes the dominant contribution
resistances as the formation of the protective RD and BTAH film progresses. After 100 min of
immersion in a solution of RD, the high frequency loop disappears and only one capacitive loop
is observed in the Nyquist plot. This behavior may suggest the formation of a protective inhibitor
film on the copper surface. In presence of RD or BTAH in corrosive media, after 60 min, the
polarization resistances for inhibitors were increased to 940 Ω and 1625 Ω from 480 Ω and 157
Ω for RD and BTAH, respectively. The Rp values increased significantly, which indicated the
continuous growth of the surface film with time and the approach in the perfect coverage of the
surface film on the metal at the end of the 120 min. The growth of this layer enhanced the
corrosion resistance of the metal. The values of film capacitance (CPE1) and double layer
capacitance (CPE2) decreased with increasing with immersion times for inhibitors. The decrease
in CPE1 is probably due to a decrease in local dielectric constant and/or an increase in the
thickness of a protective layer at electrode surface, enhancing therefore the corrosion resistance
of the studied copper. The thickness of the protective layer (d) is related to Cdl according to the
following equation 23
dCdl
0 (4.2)

42
where ε is the dielectric constant of the protective layer and εo is the permittivity of free space.
Figure 4.4. Nyquist plots of Cu electrode obtained in 0.5 M H2SO4 solution (+) and containing
10.0 mM RD (), 10.0
mM BTAH (∆) (solid lines show fitted results, the inset corresponds to a
magnification of high frequencies region).
0 100 200 300 400 500
-500
-400
-300
-200
-100
0
Z'
Z'' cu2 rh Ar-0h seç.txt
Cu 10mM btah 0(2)m remove.txtCu H2so4 0 min ar seç.txtcu2 rh ar-0h fit.zcu 10mm btah 0(2)m fit remove.zcu h2so4 0 min ar fit.z
0 10 20 30 40 50
-50
-40
-30
-20
-10
0
Z'Z''
cu2 rh Ar-0h seç.txtCu 10mM btah 0(2)m remove.txtCu H2so4 0 min ar seç.txtcu2 rh ar-0h fit.zcu 10mm btah 0(2)m fit remove.zcu h2so4 0 min ar fit.z
Z' / Ω
Z''
/ Ω
Z' / Ω
Z''
/ Ω

43
Figure 4.5. Nyquist plots of Cu electrodes in 0.5 M H2SO4 solution in the presence of 10.0 mM
RD after 0, 60, 80, 100 and 120 min exposure time (solid lines show fitted results, the inset
corresponds to a magnification of high frequencies region).
0 3000 6000 9000 12000
-12000
-9000
-6000
-3000
0
Z'
Z''
impedance rhodanine 120 min.txtimpedance rhodanine 100 min remove.txtimpedance rhodanine 80 min remove.txtimpedance rhodanine 60 min remove.txtimpedance rhodanine 0 min remove.txtimpedance rhodanine 120min fit remove.zimpedance rhodanine 100min fit remove.zimpedance rhodanine 80min fit remove.zimpedance rhodanine 60min fit remove.zimpedance rhodanine 0min fit remove.z
0 250 500 750 1000
-1000
-750
-500
-250
0
Z'Z''
impedance rhodanine 120 min.txtimpedance rhodanine 100 min remove.txtimpedance rhodanine 80 min remove.txtimpedance rhodanine 60 min remove.txtimpedance rhodanine 0 min remove.txtimpedance rhodanine 120min fit remove.zimpedance rhodanine 100min fit remove.zimpedance rhodanine 80min fit remove.zimpedance rhodanine 60min fit remove.zimpedance rhodanine 0min fit remove.z
Z' / Ω
Z''
/ Ω
Z' / Ω
Z''
/ Ω

44
Figure 4.6. Nyquist plots of Cu electrodes in 0.5 M H2SO4 solution in the presence of 10.0 mM
BTAH after 0, 60, 80, 100 and 120 min exposure time (solid lines show fitted results, the inset
corresponds to a magnification of high frequencies region).
0 650 1300 1950 2600 3250 3900
-4000
-3350
-2700
-2050
-1400
-750
-100
Z'
Z''
Cu 10mM btah 120m.txtCu 10mM btah 100m.txtCu 10mM btah 80m.txtCu 10mM btah 60m.txtCu 10mM btah 0m.txtcu 10mm btah 120m fit.zcu 10mm btah 100m fit.zcu 10mm btah 80m fit.zcu 10mm btah 60m fit.zcu 10mm btah 0m fit.z
0 100 200 300 400
-400
-300
-200
-100
0
Z'
Z''
Cu 10mM btah 120m.txtCu 10mM btah 100m.txtCu 10mM btah 80m.txtCu 10mM btah 60m.txtCu 10mM btah 0m.txtcu 10mm btah 120m fit.zcu 10mm btah 100m fit.zcu 10mm btah 80m fit.zcu 10mm btah 60m fit.zcu 10mm btah 0m fit.z
Z' / Ω
Z''
/ Ω
Z' / Ω
Z''
/ Ω

45
Table 4.2. Electrochemical parameters for Cu electrode corresponding to the EIS
data in 0.5 M H2SO4 solution in the presence of 10 Mm BTAH and 10.0 mM RD
after different immersion time at 25 °C.
inhibitor Time (min) R1 (Ω ) n1
CPEdl-1 (10-6
)
Yo / 106 s
n Ω
-1
R2 (Ω ) n2 CPEdl-2 (10
-6)
Yo / 106 s
n Ω
-1
Rp (Ω )
BTAH 0 100 0.72 90.0 57 0.60 2628.4 157
60 450 0.60 88.0 1175 0.69 855.54 1625
80 475 0.68 49.64 2500 0.61 798.21 2975
100 520 0.69 41.29 4554 0.52 739.21 5074
120 633 0.69 40.27 5700 0.56 622.56 6333
RD 0 117 0.73 29.35 363 0.48 652.21 480
60 207 0.98 3.14 711 0.45 598.9 942
80 234 0.98 3.10 1295 0.53 329.37 1529
100 272 0.98 2.98 5340 0.64 120.31 5612
120 11664 0.82 47.55 11664

46
It is apparent from the results that RD and BTAH inhibit the corrosion of copper in 0.5 M
H2SO4 solution at 10 mM concentration used in this study. The Rp values were seen to increase
continuously with increasing the immersion time for both inhibitors as well (Table 4.2). Better
performance is seen in the case of RD, particularly 100 and 120 min immersion times.
Surface Enhanced Raman Spectroscopy (SERS) investigation of film composition
Table 4.3 shows Raman peaks from DFT calculation in comparison to calculations done
by Jabeen et al 13
. Spartan calculations the cation, neutral, and anion forms of RD solvated by
water were performed to investigate the effect of oxidation state of the inhibitor has on the
Raman spectrum.
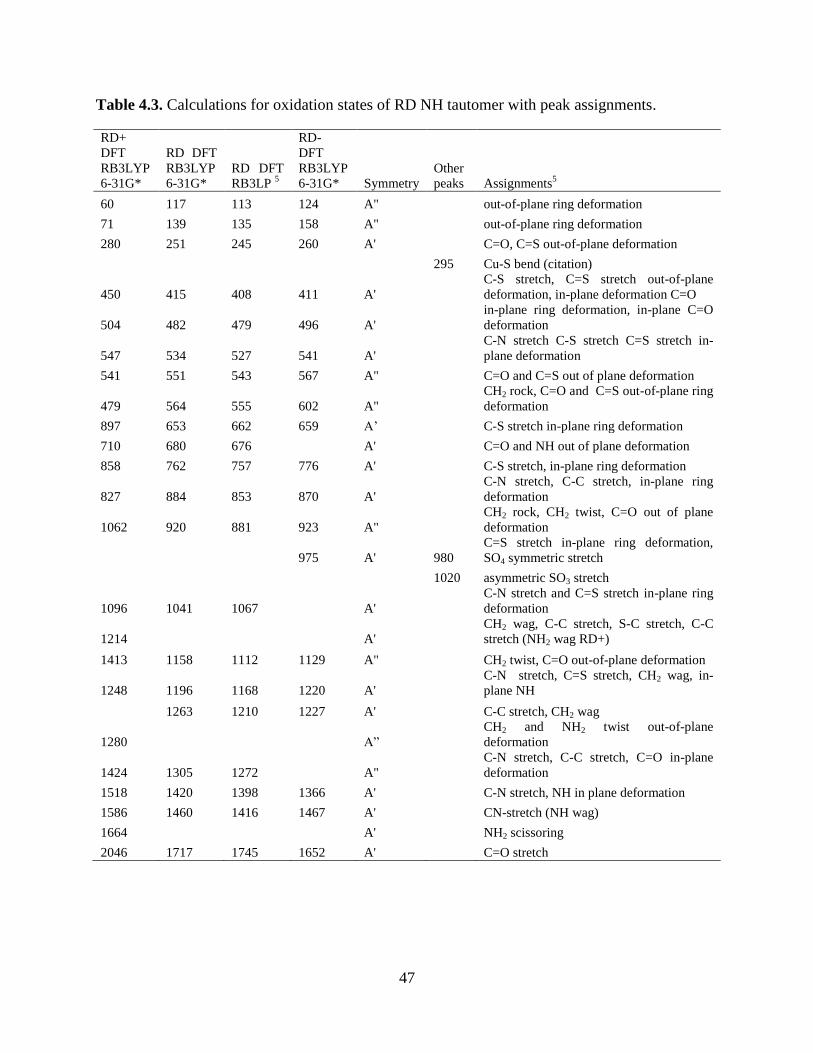
47
Table 4.3. Calculations for oxidation states of RD NH tautomer with peak assignments.
RD+
DFT
RB3LYP
6-31G*
RD DFT
RB3LYP
6-31G*
RD DFT
RB3LP 5
RD-
DFT
RB3LYP
6-31G* Symmetry
Other
peaks Assignments5
60 117 113 124 A" out-of-plane ring deformation
71 139 135 158 A" out-of-plane ring deformation
280 251 245 260 A' C=O, C=S out-of-plane deformation
295 Cu-S bend (citation)
450 415 408 411 A'
C-S stretch, C=S stretch out-of-plane
deformation, in-plane deformation C=O
504 482 479 496 A'
in-plane ring deformation, in-plane C=O
deformation
547 534 527 541 A'
C-N stretch C-S stretch C=S stretch in-
plane deformation
541 551 543 567 A" C=O and C=S out of plane deformation
479 564 555 602 A"
CH2 rock, C=O and C=S out-of-plane ring
deformation
897 653 662 659 A’ C-S stretch in-plane ring deformation
710 680 676 A' C=O and NH out of plane deformation
858 762 757 776 A' C-S stretch, in-plane ring deformation
827 884 853 870 A'
C-N stretch, C-C stretch, in-plane ring
deformation
1062 920 881 923 A"
CH2 rock, CH2 twist, C=O out of plane
deformation
975 A' 980
C=S stretch in-plane ring deformation,
SO4 symmetric stretch
1020 asymmetric SO3 stretch
1096 1041 1067 A'
C-N stretch and C=S stretch in-plane ring
deformation
1214 A'
CH2 wag, C-C stretch, S-C stretch, C-C
stretch (NH2 wag RD+)
1413 1158 1112 1129 A" CH2 twist, C=O out-of-plane deformation
1248 1196 1168 1220 A'
C-N stretch, C=S stretch, CH2 wag, in-
plane NH
1263 1210 1227 A' C-C stretch, CH2 wag
1280 A”
CH2 and NH2 twist out-of-plane
deformation
1424 1305 1272 A"
C-N stretch, C-C stretch, C=O in-plane
deformation
1518 1420 1398 1366 A' C-N stretch, NH in plane deformation
1586 1460 1416 1467 A' CN-stretch (NH wag)
1664 A' NH2 scissoring
2046 1717 1745 1652 A' C=O stretch

48
Table 4.4. Simulated spectra of RD tautomer A and experimental data.
RD+
DFT
RB3LYP
6-31G*
RD DFT
RB3LYP
6-31G*
RD- DFT
RB3LYP
6-31G* solid Rd
RD Ag sol
(Jabeen)
RD
Cu
ocp
in-
situ
Rd Cu
ocp after
1 hr in-
situ
RD Cu at
0.4 V in-
situ
RD Cu
ex-situ
60 117 124
168
71 139 158
181
280 251 260 257 197
285 295
304
450 415 411 424 407 423 416 426 442
504 482 496 488 517
526
547 534 541 541 541 548 553 543 553
541 551 567
551
588
479 564 602
591
897 653 659
637
639 650
680
685
704
710
735 745
728 755
858 762 776 783 787
827 884 870 878 874 888 884
896
1062 920 923 893
919
975
977 978 976 994
1096 1041
1010 1017 1003 1021
1214
1064 1050 1047 1046
1413
1106
1248
1130 1036
1119 1108
1158 1129 1174 1179 1186 1188 1196
1280 1196 1220 1195 1197 1216
1424
1227
1225
1263
1276
1518 1305
1362
1309
1586 1420 1366 1379 1378 1382 1378
1346
1460 1467 1456 1388
1461
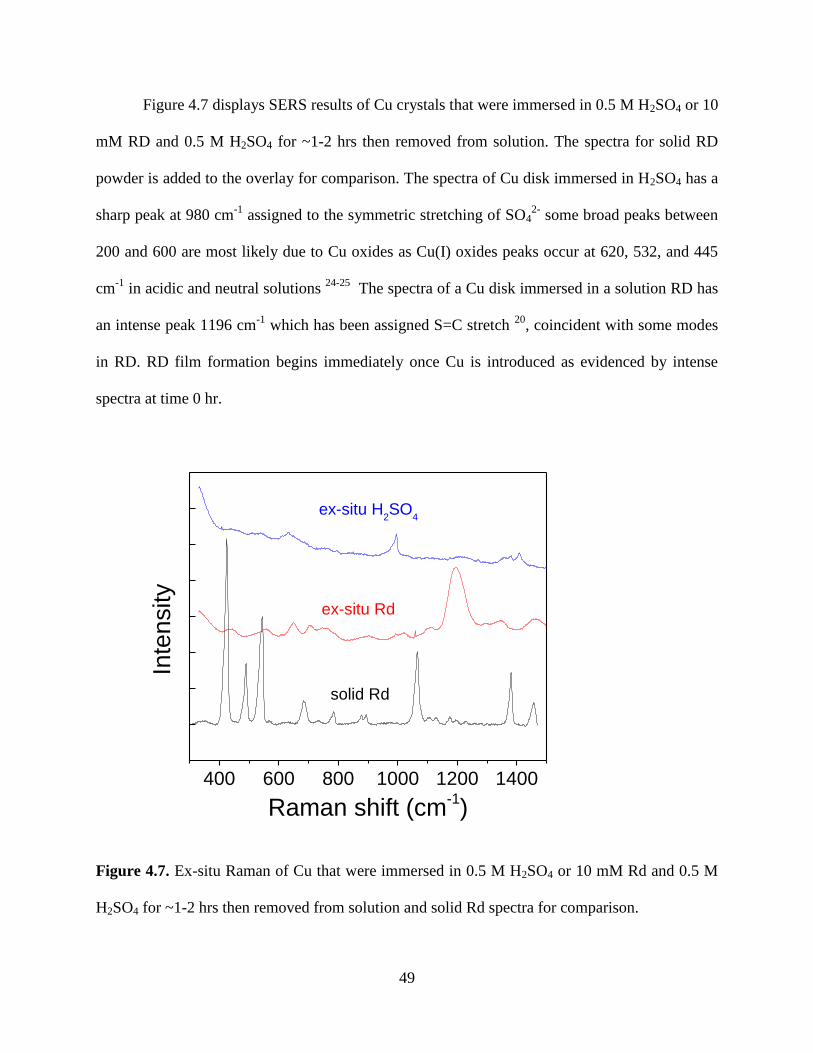
49
Figure 4.7 displays SERS results of Cu crystals that were immersed in 0.5 M H2SO4 or 10
mM RD and 0.5 M H2SO4 for ~1-2 hrs then removed from solution. The spectra for solid RD
powder is added to the overlay for comparison. The spectra of Cu disk immersed in H2SO4 has a
sharp peak at 980 cm-1
assigned to the symmetric stretching of SO42-
some broad peaks between
200 and 600 are most likely due to Cu oxides as Cu(I) oxides peaks occur at 620, 532, and 445
cm-1
in acidic and neutral solutions 24-25
The spectra of a Cu disk immersed in a solution RD has
an intense peak 1196 cm-1
which has been assigned S=C stretch 20
, coincident with some modes
in RD. RD film formation begins immediately once Cu is introduced as evidenced by intense
spectra at time 0 hr.
400 600 800 1000 1200 1400
In
ten
sity
solid Rd
ex-situ Rd
Raman shift (cm-1)
ex-situ H2SO
4
Figure 4.7. Ex-situ Raman of Cu that were immersed in 0.5 M H2SO4 or 10 mM Rd and 0.5 M
H2SO4 for ~1-2 hrs then removed from solution and solid Rd spectra for comparison.

50
Figure 4.8 shows the SERS of Cu electrode in 10 mM Rd 0.5 M H2SO4 after 0, 1, and 2
hr. Peaks shown in Table 4.4 coincide with RD peaks found by Ag SERS measurements done by
Jabeen et al and Marzec et al. 5-6
Peaks at 295 and 1216 cm-1
indicate formation of Cu-S bonds
(Liao et al 247 Cu(II) stretch, 369 Cu(I)-S stretch, 1202 C-S stretch) 20
. The intensity of all peaks
drops dramatically after an hour and even further at 2 hours. Two possible reasons for this drop
in intensity are that a thick film develops that is opaque to laser line and thus scatttering is
unenhanced or surface restructuring removes the asperities that cause enhancement.
200 400 600 800 1000 1200 1400
Inte
nsity
Raman shift (cm-1)
0 hr (I/4)
1 hr
2 hr (I*2)
400 800 1200
Figure 4.8. SERS of Cu electrode in 10 mM Rd 0.5 M H2SO4 after 0, 1, and 2 hr. Intensity is
adjusted for comparison in the graph, inset shows unadjusted spectra.

51
Figure 4.9 shows SERS of a Cu electrode in 10 mM RD 0.5 M H2SO4 as it is anodically
polarized. Additional peaks form as surface potential goes above 0.1 V vs Ag/AgCl. In particular
an intense sharp peak at 919 cm-1
and peaks at 1122 cm-1
at 1309 cm-1
which the first two are
associated with an out-of-plane deformation of C=O, and in-plane deformation of C=O. This is
most likely due to RD molecules interacting with Cu ions. RD can chelate Cu2+
ions to form a
Cu(I)RD species. Formation of the complex is associated with a downshift in the NH and C=O
stretches (from 3080 to 2980 cm-1
and 1775 to 1765 cm-1
respectively) and the appearance of
new C=S stretches at 724 and 710 cm-1
.7 In addition, Kong and Jang found new peaks appeared
at 1560 and 1650 associated with C=N and C=C stretching respectively when RD forms a
polymer with Ag(I).3 The polarization curve displayed in Figure 4.2 shows that the RD film
breaks down around 0.25 V, a marked increase in current density occurs at this potential.

52
400 800 1200 1600 400 800 1200 1600
Inte
nsity
Raman shift (cm-1)
0.4
0.3
0.2
0.1
Potential
(V vs Ag/AgCl)Potential
(V vs Ag/AgCl)
0.4
0.3
0.2
0.1
Figure 4.9. SERS of Cu electrode in 10 mM RD 0.5 M H2SO4 that is anodically polarized with
spectral window of 300-1500 cm-.

53
1200 1600 2000 1200 1600 2000
Potential
(V vs
Ag/AgCl)
0.3
0.2
0.1
Inte
nsity
Raman shift (cm-1)
0.3
0.2
0.1
Potential
(V vs
Ag/AgCl)
Figure 4.10. SERS of Cu electrode in 10 mM RD 0.5 M H2SO4 that is anodically polarized with
spectral window of 1100 to 2300 cm-1
(bottom).
Table 4.4 shows the calculated spectra for three potential oxidation states of RD along
with peaks from RD adsorbed onto Ag for comparison. Certain peaks are lowered in energy with
relation to the neural RD molecule so it is reasonable to suggest that some RD exists in a
deprotated state and thus forms a coordination polymer on the Cu surface anagolous to that
formed on Ag colloidal suspensions. Possible film composition is of organic dimmers or
polymers5, an organometallic oligamer as forms on Ag colloids
6, or a combination of both. A
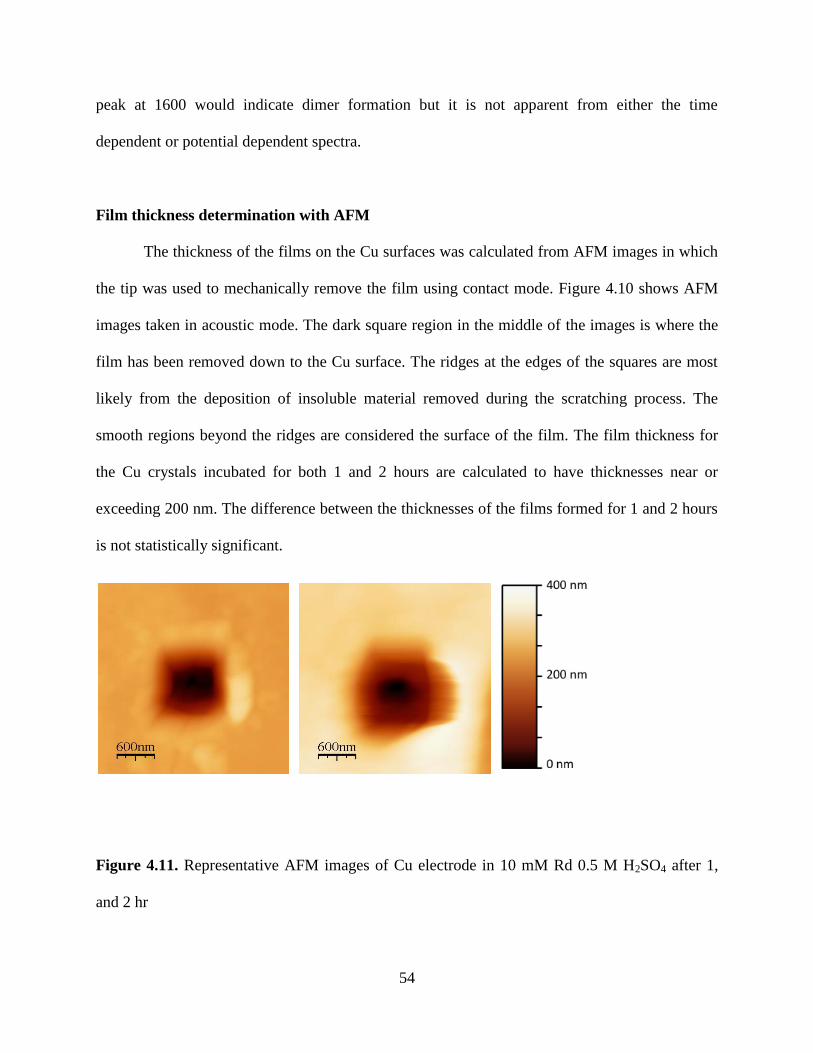
54
peak at 1600 would indicate dimer formation but it is not apparent from either the time
dependent or potential dependent spectra.
Film thickness determination with AFM
The thickness of the films on the Cu surfaces was calculated from AFM images in which
the tip was used to mechanically remove the film using contact mode. Figure 4.10 shows AFM
images taken in acoustic mode. The dark square region in the middle of the images is where the
film has been removed down to the Cu surface. The ridges at the edges of the squares are most
likely from the deposition of insoluble material removed during the scratching process. The
smooth regions beyond the ridges are considered the surface of the film. The film thickness for
the Cu crystals incubated for both 1 and 2 hours are calculated to have thicknesses near or
exceeding 200 nm. The difference between the thicknesses of the films formed for 1 and 2 hours
is not statistically significant.
Figure 4.11. Representative AFM images of Cu electrode in 10 mM Rd 0.5 M H2SO4 after 1,
and 2 hr

55
Conclusions
RD is a good corrosion inhibitor relative to BTA with film resistance and protection
efficiency that improve with time. This enhancement with time corresponds to a decay in SERS
intensity and is attributed to the thick films found to be ~100 nm by AFM.

56
References
1. Ludlow, J. W.; Guikema, J. A.; Consigli, R. A., Use of 5-(4-
dimethylaminobenzylidene)rhodanine in quantitating silver grains eluted from autoradiograms of
biological material. Anal. Biochem. 1986, 154 (1), 104.
2. Habib, N. S.; Rida, S. M.; Badawey, E. A. M.; Fahmy, H. T. Y.; Ghozlan, H. A.,
Synthesis and antimicrobial activity of rhodanine derivatives. Eur. J. Med. Chem. 1997, 32 (9),
759.
3. Kong, H.; Jang, J., Synthesis and antimicrobial properties of novel silver/polyrhodanine
nanofibers. Biomacromolecules 2008, 9 (10), 2677.
4. Tomasic, T.; Masic, L. P., Rhodanine as a privileged scaffold in drug discovery. Curr.
Med. Chem. 2009, 16 (13), 1596.
5. Jabeen, S.; Dines, T. J.; Withnall, R.; Leharne, S. A.; Chowdhry, B. Z., Surface-enhanced
raman scattering studies of rhodanines: Evidence for substrate surface-induced dimerization.
Phys. Chem. Chem. Phys. 2009, 11 (34), 7476.
6. Marzec, K. M.; Gawel, B.; Lasocha, W.; Proniewicz, L. M.; Malek, K., Interaction
between rhodanine and silver species on a nanocolloidal surface and in the solid state. J. Raman
Spectrosc. 2010, 41 (5), 543.
7. Sestili, L.; Cauletti, C.; Furlani, C., Transition metal complexes with pentatomic
heterocyclic ligands containing nitrogen, oxygen and sulphur. I. Copper complexes. Inorg. Chim.
Acta 1985, 102 (1), 55.
8. Abdallah, M., Rhodanine azosulpha drugs as corrosion inhibitors for corrosion of 304
stainless steel in hydrochloric acid solution. Corros. Sci. 2002, 44 (4), 717.
9. Solmaz, R.; Altunbaş Şahin, E.; Döner, A.; Kardaş, G., The investigation of synergistic
inhibition effect of rhodanine and iodide ion on the corrosion of copper in sulphuric acid
solution. Corros. Sci. 2011, 53 (10), 3231.
10. Jabeen, S.; Palmer, R.; Potter, B.; Helliwell, M.; Dines, T.; Chowdhry, B., Low
temperature crystal structures of two rhodanine derivatives, 3-amino rhodanine and 3-methyl
rhodanine: Geometry of the rhodanine ring. J. Chem. Crystallogr. 2009, 39 (2), 151.
11. Moers, F. G.; Smits, J. M. M.; Beurskens, P. T., Crystal structure of bis-
(rhodanine)copper(i) iodide. J. Chem. Crystallogr. 1986, 16 (1), 101.
12. Andreocci, M. V.; Cauletti, C.; Sestili, L., Electronic structure of some penta-atomic
heterocyclic molecules studied by gas-phase hei and heii photoelectron spectroscopy.
Spectrochim. Acta A-M 1984, 40 (11–12), 1087.
13. Jabeen, S.; Dines, T. J.; Leharne, S. A.; Withnall, R.; Chowdhry, B. Z., A vibrational
spectroscopic investigation of rhodanine and its derivatives in the solid state. J. Raman.
Spectrosc. 2010, 41 (10), 1306.
14. Lebedev, R. S.; Yakimenko, V. I., Calculation and investigation of infrared absorption
spectrum of rhodanine. Russ. Phys. J. 1968, 11 (10), 99.
15. Moers, F. G.; Steggerda, J. J., Copper complexes of rhodanine and its 3-alkyl derivatives.
J. Inorg. Nucl. Chem. 1968, 30 (12), 3217.
16. Baryshnikov, G.; Minaev, B.; Minaeva, V.; Podgornaya, A., Theoretical study of the
dimerization of rhodanine in various tautomeric forms. Chem. Heterocyc. Compd. 2012, 47 (10),
1268.

57
17. Benedeti, A. V.; Sumodjo, P. T. A.; Nobe, K.; Cabot, P. L.; Proud, W. G.,
Electrochemical studies of copper, copper-aluminium and copper-aluminium-silver alloys:
Impedance results in 0.5m nacl. Electrochim. Acta 1995, 40 (16), 2657.
18. Li, G.; Ma, H.; Jiao, Y.; Chen, S., An impedance investigation of corrosion protection of
copper by self-assembled monolayers of alkanethiols in aqueous solution. Serb. Chem. Soc.
2004, 69 (10), 15.
19. Khaled, K. F.; Hackerman, N., Ortho-substituted anilines to inhibit copper corrosion in
aerated 0.5 m hydrochloric acid. Electrochim. Acta 2004, 49 (3), 485.
20. Liao, Q. Q.; Yue, Z. W.; Yang, D.; Wang, Z. H.; Li, Z. H.; Ge, H. H.; Li, Y. J., Inhibition
of copper corrosion in sodium chloride solution by the self-assembled monolayer of sodium
diethyldithiocarbamate. Corros. Sci. 2011, 53 (5), 1999.
21. Solmaz, R.; Kardas, G.; Yazici, B.; Erbil, M., The rhodanine inhibition effect on the
corrosion of a mild steel in acid along the exposure time. Prot. Met. 2007, 43, 476.
22. McCluney, S. A.; Popova, S. N.; Popov, B. N.; White, R. E.; Griffin, R. B., Comparing
electrochemical impedance spectroscopy methods for estimating the degree of delamination of
organic coatings on steel. J. Electrochem. Soc. 1992, 139 (6), 1556.
23. Diggle, J. W.; Downie, T. C.; Goulding, C. W., Anodic oxide films on aluminum. Chem.
Rev. 1969, 69 (3), 365.
24. Chan, H. Y. H.; Takoudis, C. G.; Weaver, M. J., Oxide film formation and oxygen
adsorption on copper in aqueous media as probed by surface-enhanced raman spectroscopy. J.
Phys. Chem. B 1999, 103 (2), 357.
25. Stewart, K. L.; Zhang, J.; Li, S. T.; Carter, P. W.; Gewirth, A. A., Anion effects on cu-
benzotriazole film formation - implications for cmp. J. Electrochem. Soc. 2007, 154 (1), D57.
58
CHAPTER 5: INTERACTION OF LEVELERS WITH COPPER SURFACE IN PH 3
SULFATE SOLUTION3
Introduction
Electrodeposition of Cu is used to make interconnects for microelectronics because of its
lower line resistance, better electromigration characteristics, and ease of feature filling compared
to Al and Al-alloy metallization.1-3
The typical Cu plating bath is composed of H2SO4, CuSO4
and organic agents termed supressors, accelerators, and levelers which work in concert for
uniform plating and feature filling across the chip.1
Levelers are used to control overfill bumps that occur during electrodeposition and also
serve to reduce the rate Cu growth on the field (outside of features). 1, 4-6
The prototypical leveler
is a quaternary ammonium salt. Functionalization of head group and altering the chain length
counter ion can affect the plating behavior. 7 Bozzini et al. showed that Janus Green B, a leveler
used for Cu plating, undergoes potential driven orientation changes.8-9
Previously, Hatch et al.
showed that this reorientation is linked with ability to tune the plating potential with
concentration.10
A ‘low acid’ bath with high Cu concentration has many benefits with regards to
electrodeposition. It decreases the conductivity of the solution which improves uniformity of
deposit. It also decreases roughness while enhancing the Cu transport rate to the surface which
should enhance via filling.11
In this chapter, we will investigate the effect of varying the
concentration with dodecyltrimethyl ammonium bromide (DTAB), thonzonium bromide
(ThonB)
and benzyldimethylhexadecyl ammonium chloride (BDAC) has on Cu plating
potentials in pH 3 sulfate solutions. Potential dependent Shell Isolated Spectroscopy will be used
3 Experiments were performed with support provided by Novellus Systems Inc.

59
to investigate the orientation of the levelers at various potentials which may give insight into the
Cu plating behavior.
Results and Discussion
Figure 5.2 shows slow scan rate voltammetry obtained from a rotating Cu electrode in a
solution containing 10 g/L K2SO4 (0.1 M) and 40 g/L CuSO4 (0.15 M) adjusted to pH 3 with
H2SO4 with the addition of 0, 10, 25, and 50 ppm of leveler.
Figure 5.1 Chemical structures of DTAB, BDAC, and ThonB.

60
Figure 5.2. Cyclic voltammogram (10 mV/s scan rate) of rotating (200 rpm) Cu(poly) working
electrode in a solution containing 0.16 M CuSO4 and 0.1 M K2SO4 adjusted to pH 3 with H2SO4
with various concentrations of a) CTAB, b) BDAC and c) ThonB.
-0.4 -0.2 0.0 0.2-10
-8
-6
-4
-2
0B)
Cu
rren
t (m
A/c
m2)
Potential (V vs. Ag/AgCl)
10ppm
25ppm
50ppm
blank
-0.4 -0.2 0.0 0.2
-8
-6
-4
-2
0C)
Cu
rren
t (m
A/c
m2)
Potential (V vs. Ag/AgCl)
10ppm
25ppm
50ppm
blank
-0.3 -0.2 -0.1 0.0 0.1 0.2
-4
-2
0
2
Cu
rren
t (m
A/c
m2)
Potential (V vs. Ag/AgCl)
10ppm
25ppm
50ppm
blank
A)
(b)
(a)
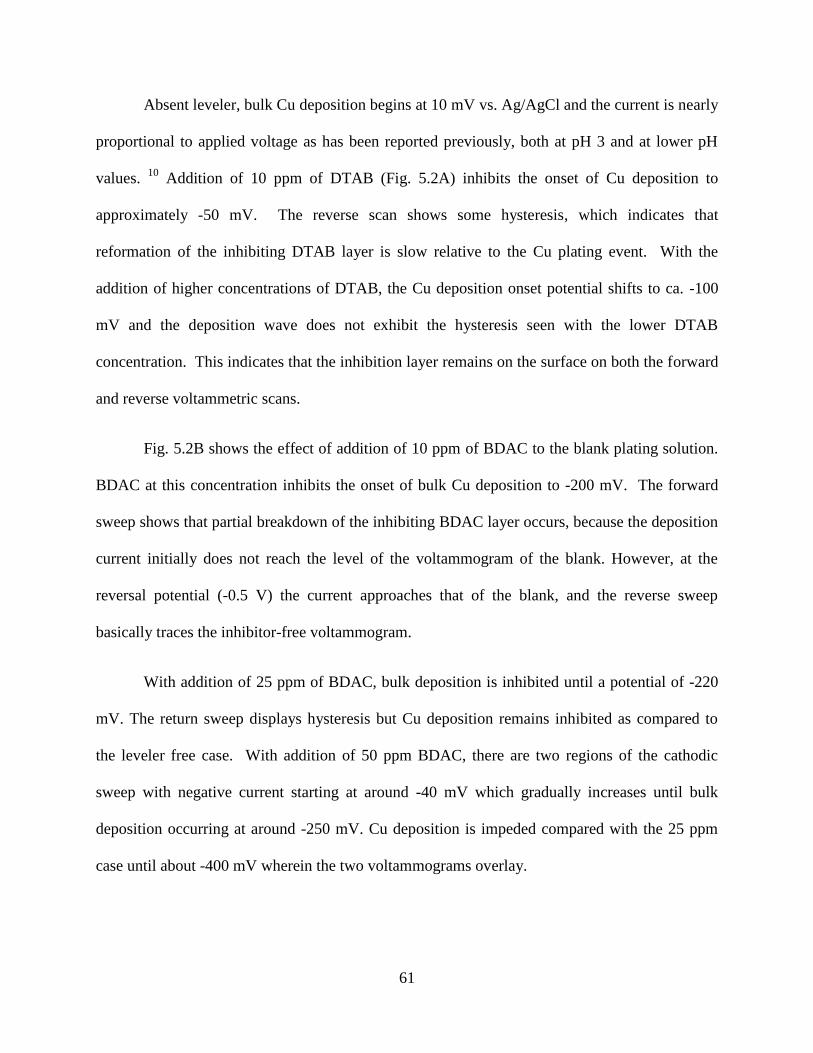
61
Absent leveler, bulk Cu deposition begins at 10 mV vs. Ag/AgCl and the current is nearly
proportional to applied voltage as has been reported previously, both at pH 3 and at lower pH
values. 10
Addition of 10 ppm of DTAB (Fig. 5.2A) inhibits the onset of Cu deposition to
approximately -50 mV. The reverse scan shows some hysteresis, which indicates that
reformation of the inhibiting DTAB layer is slow relative to the Cu plating event. With the
addition of higher concentrations of DTAB, the Cu deposition onset potential shifts to ca. -100
mV and the deposition wave does not exhibit the hysteresis seen with the lower DTAB
concentration. This indicates that the inhibition layer remains on the surface on both the forward
and reverse voltammetric scans.
Fig. 5.2B shows the effect of addition of 10 ppm of BDAC to the blank plating solution.
BDAC at this concentration inhibits the onset of bulk Cu deposition to -200 mV. The forward
sweep shows that partial breakdown of the inhibiting BDAC layer occurs, because the deposition
current initially does not reach the level of the voltammogram of the blank. However, at the
reversal potential (-0.5 V) the current approaches that of the blank, and the reverse sweep
basically traces the inhibitor-free voltammogram.
With addition of 25 ppm of BDAC, bulk deposition is inhibited until a potential of -220
mV. The return sweep displays hysteresis but Cu deposition remains inhibited as compared to
the leveler free case. With addition of 50 ppm BDAC, there are two regions of the cathodic
sweep with negative current starting at around -40 mV which gradually increases until bulk
deposition occurring at around -250 mV. Cu deposition is impeded compared with the 25 ppm
case until about -400 mV wherein the two voltammograms overlay.
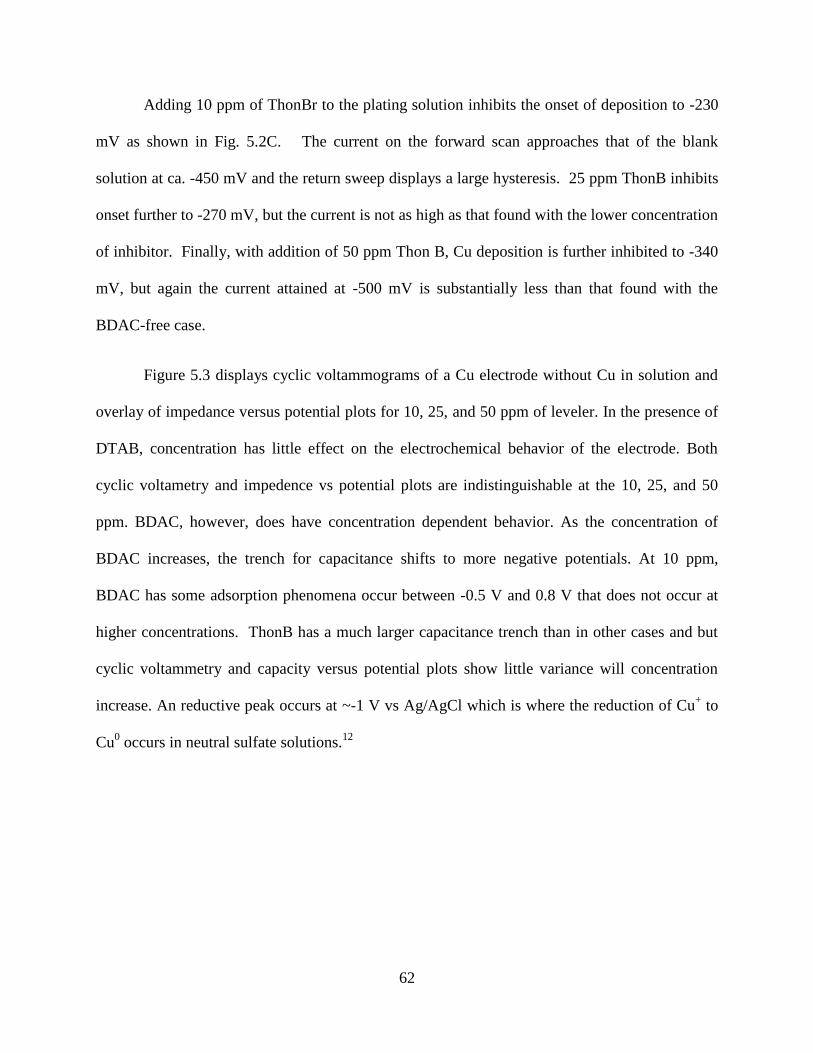
62
Adding 10 ppm of ThonBr to the plating solution inhibits the onset of deposition to -230
mV as shown in Fig. 5.2C. The current on the forward scan approaches that of the blank
solution at ca. -450 mV and the return sweep displays a large hysteresis. 25 ppm ThonB inhibits
onset further to -270 mV, but the current is not as high as that found with the lower concentration
of inhibitor. Finally, with addition of 50 ppm Thon B, Cu deposition is further inhibited to -340
mV, but again the current attained at -500 mV is substantially less than that found with the
BDAC-free case.
Figure 5.3 displays cyclic voltammograms of a Cu electrode without Cu in solution and
overlay of impedance versus potential plots for 10, 25, and 50 ppm of leveler. In the presence of
DTAB, concentration has little effect on the electrochemical behavior of the electrode. Both
cyclic voltametry and impedence vs potential plots are indistinguishable at the 10, 25, and 50
ppm. BDAC, however, does have concentration dependent behavior. As the concentration of
BDAC increases, the trench for capacitance shifts to more negative potentials. At 10 ppm,
BDAC has some adsorption phenomena occur between -0.5 V and 0.8 V that does not occur at
higher concentrations. ThonB has a much larger capacitance trench than in other cases and but
cyclic voltammetry and capacity versus potential plots show little variance will concentration
increase. An reductive peak occurs at ~-1 V vs Ag/AgCl which is where the reduction of Cu+ to
Cu0 occurs in neutral sulfate solutions.
12

63
-400
-200
0
200
40010 ppm
0
50
100
-400
-200
0
200
400
Curr
en
t D
en
sity (
A c
m-2)
25 ppm
0
50
100
Cap
acita
nce (
F c
m-2)
-1.5 -1.0 -0.5 0.0
-800
-400
0
400
800
Potential (V vs Ag/AgCl)
50 ppm
DTAB
0
50
100
-500
010 ppm
0
50
100
-500
0
500
Curr
en
t D
en
sity (
A c
m-2)
BDAC
25 ppm
0
50
100
Cap
acita
nce (
F c
m-2)
-1.4 -1.2 -1.0 -0.8 -0.6 -0.4 -0.2 0.0
-200
0
Potential (V vs Ag/AgCl)
50 ppm
0
50
100
150
200
-200
-100
0
10010 ppm
0
50
100
-200
-100
0
Curr
en
t D
en
sity (
A c
m-1)
25 ppm
0
50
100
Cap
acita
nce (
F c
m-2)
-1.5 -1.0 -0.5 0.0
-200
0
200
400
Potential (V vs Ag/AgCl)
ThonB
50 ppm
0
50
100
150
200
Figure 5.3. Cyclic voltammograms (2 mV/s scan rate) and impedance versus potential
measurements (excitation frequency ω = 25 Hz and an amplitude of 10 mV) with a Cu electrode
and levelers at 10 ppm, 25 ppm, and 50 ppm in 0.1 M K2SO4 pH adjusted to 3 with H2SO4.
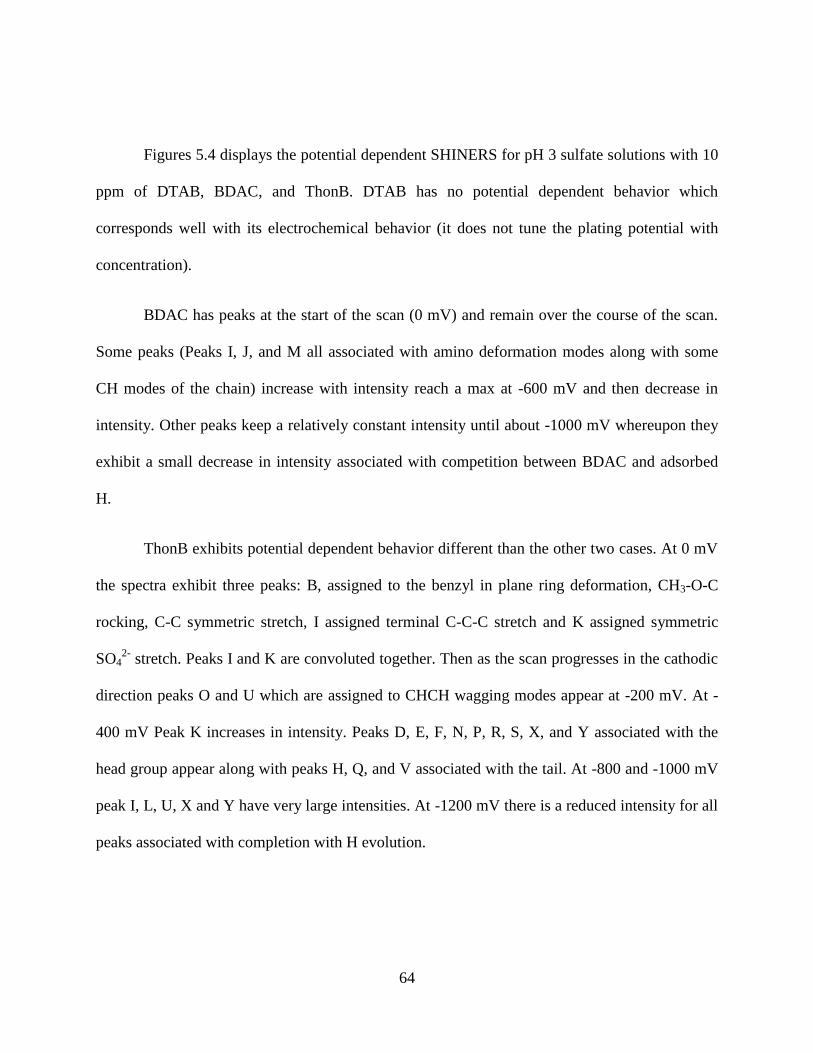
64
Figures 5.4 displays the potential dependent SHINERS for pH 3 sulfate solutions with 10
ppm of DTAB, BDAC, and ThonB. DTAB has no potential dependent behavior which
corresponds well with its electrochemical behavior (it does not tune the plating potential with
concentration).
BDAC has peaks at the start of the scan (0 mV) and remain over the course of the scan.
Some peaks (Peaks I, J, and M all associated with amino deformation modes along with some
CH modes of the chain) increase with intensity reach a max at -600 mV and then decrease in
intensity. Other peaks keep a relatively constant intensity until about -1000 mV whereupon they
exhibit a small decrease in intensity associated with competition between BDAC and adsorbed
H.
ThonB exhibits potential dependent behavior different than the other two cases. At 0 mV
the spectra exhibit three peaks: B, assigned to the benzyl in plane ring deformation, CH3-O-C
rocking, C-C symmetric stretch, I assigned terminal C-C-C stretch and K assigned symmetric
SO42-
stretch. Peaks I and K are convoluted together. Then as the scan progresses in the cathodic
direction peaks O and U which are assigned to CHCH wagging modes appear at -200 mV. At -
400 mV Peak K increases in intensity. Peaks D, E, F, N, P, R, S, X, and Y associated with the
head group appear along with peaks H, Q, and V associated with the tail. At -800 and -1000 mV
peak I, L, U, X and Y have very large intensities. At -1200 mV there is a reduced intensity for all
peaks associated with completion with H evolution.

65
Figure 5.4. SHINERS spectra of 10 ppm leveler in pH 3 K2SO4. Potential versus Ag/AgCl.
400 600 800 1000 1200 1400 1600
Potential/
V vs
Ag/AgCl
O,P
QN
M
LI,J,K
0
-0.2
-0.4
-0.6
-0.8
-1.0
-1.2
25 cps
DTAB
A,B
F
G
H
400 600 800 1000 1200 1400 1600
R,S
U, V
P,Q
KO
IH
B
MD,E, F
C
G
0
-0.2
-0.4
-0.6
-0.8
-1.0
-1.2
Raman shift/cm-1
25 cps
ThonB
LX,Y
Potential/
V vs
Ag/AgCl
400 600 800 1000 1200 1400 1600
P,Q,R
N
ML
CJ
I
O
GF
EB
K0
-0.2
-0.4
-0.6
-0.8
--1.0
-1.2
25 cps
BDACPotential/
V vs
Ag/AgCl

66
Figure 5.5 displays the potential dependent SHINERS for 50 ppm of DTAB, BDAC, and
Thon B in pH 3 sulfate solution. Tables 5.1-5.3 are the peak assignments for the potential
dependent spectra shown in Figures 5.4 and 5.6.
Unlike in the 10 ppm case, DTAB displays some potential dependent behavior for peaks
E end of tail C-C stretch and F methylene chain rotation. There is also potential dependent
behavior for peaks M and N associated with the head group. For the 50 ppm BDAC peaks C, I, K
P and R at all potentials gradual increase in intensity until -600 mV then decrease in intensity at
more negative potentials. For spectra of 50 ppm, ThonB peaks are very intense until -1000 mV
when a reduction in intensity occurs due to competition with H adsorption. In particular, G and N
associated with the head group and J, O, and V associated with C-C and C-H modes of the tail
group.
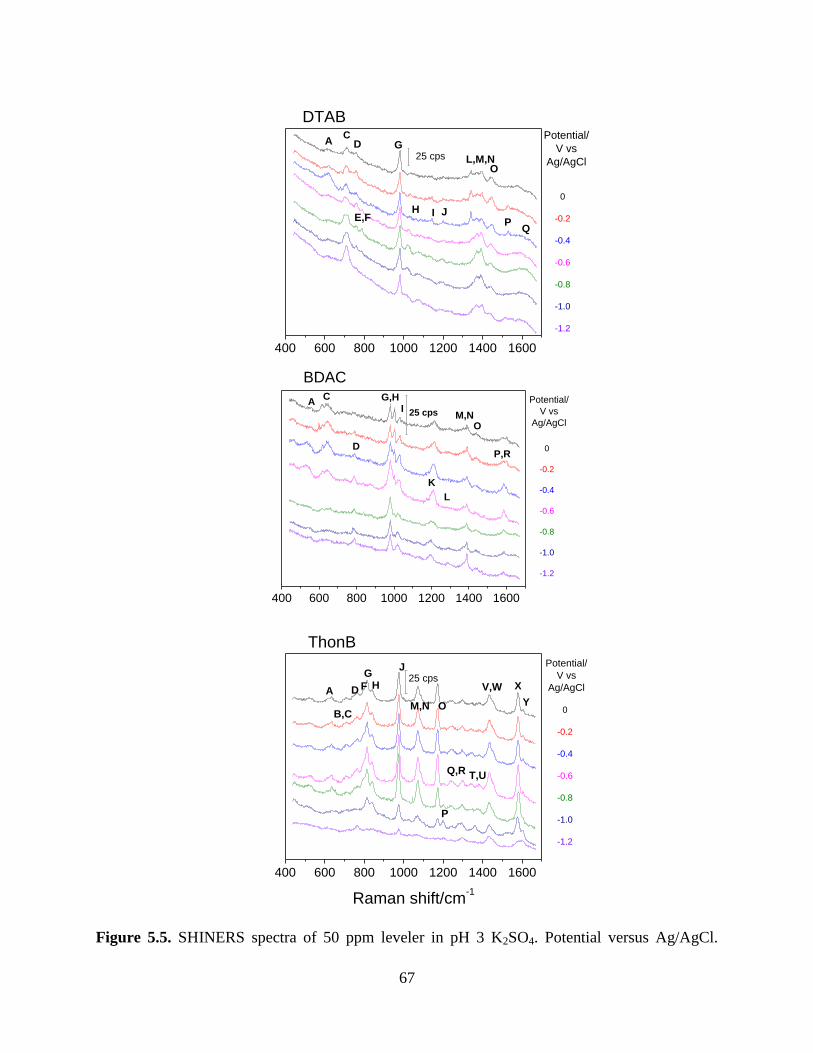
67
Figure 5.5. SHINERS spectra of 50 ppm leveler in pH 3 K2SO4. Potential versus Ag/AgCl.
400 600 800 1000 1200 1400 1600
H JE,F
A
QP
OL,M,N
I
GD
0
-0.2
-0.4
-0.6
-0.8
-1.0
-1.2
DTAB
25 cps
C Potential/
V vs
Ag/AgCl
400 600 800 1000 1200 1400 1600
A
P,R
OM,N
L
K
IG,H
D 0
-0.2
-0.4
-0.6
-0.8
-1.0
-1.2
BDAC
25 cps
C Potential/
V vs
Ag/AgCl
400 600 800 1000 1200 1400 1600
Y
V,W
T,UQ,R
P
OM,N
J
HG
FDAX
B,C 0
-0.2
-0.4
-0.6
-0.8
-1.0
-1.2
Raman shift/cm-1
ThonB
25 cps
Potential/
V vs
Ag/AgCl
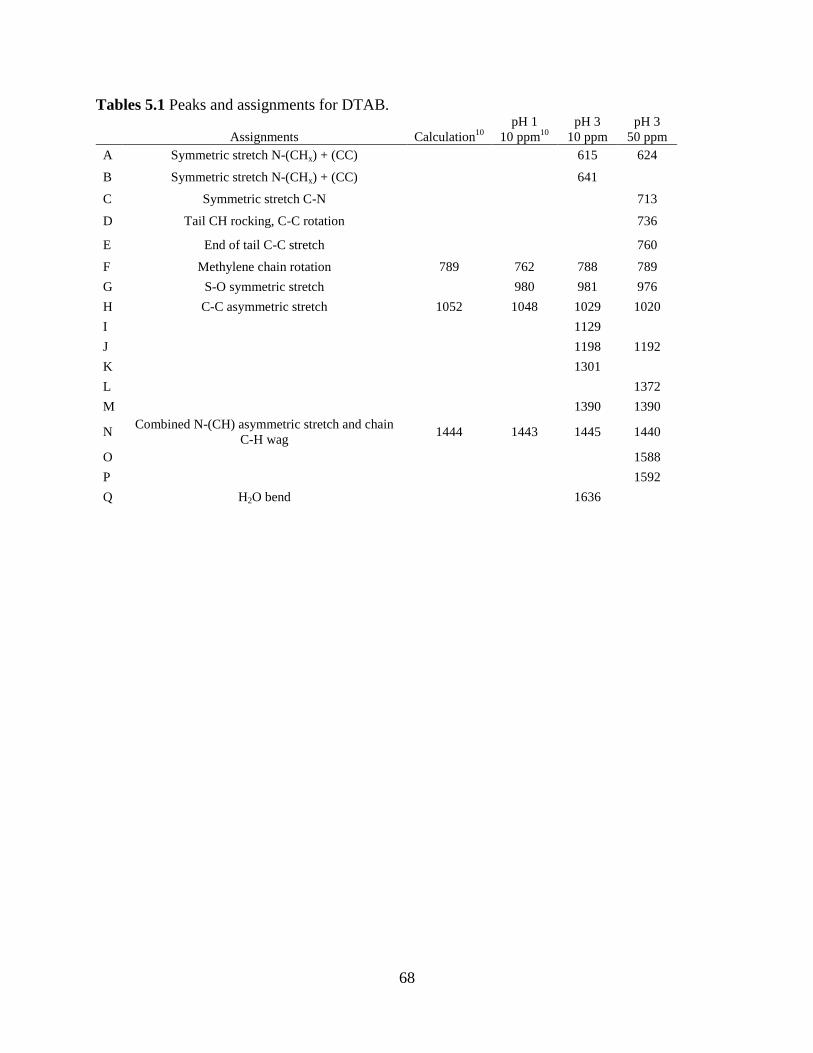
68
Tables 5.1 Peaks and assignments for DTAB.
Assignments Calculation10
pH 1
10 ppm10
pH 3
10 ppm
pH 3
50 ppm
A Symmetric stretch N-(CHx) + (CC)
615 624
B Symmetric stretch N-(CHx) + (CC)
641
C Symmetric stretch C-N
713
D Tail CH rocking, C-C rotation
736
E End of tail C-C stretch
760
F Methylene chain rotation 789 762 788 789
G S-O symmetric stretch
980 981 976
H C-C asymmetric stretch 1052 1048 1029 1020
I
1129
J
1198 1192
K
1301
L
1372
M
1390 1390
N Combined N-(CH) asymmetric stretch and chain
C-H wag 1444 1443 1445 1440
O
1588
P
1592
Q H2O bend
1636
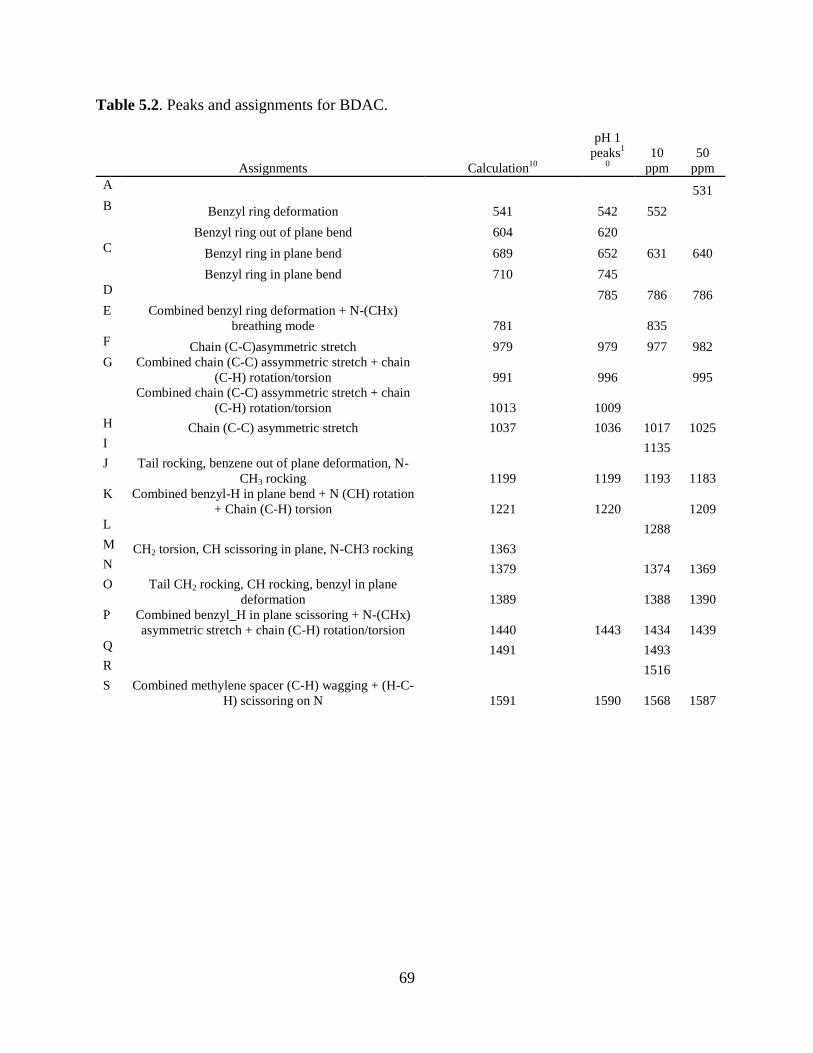
69
Table 5.2. Peaks and assignments for BDAC.
Assignments Calculation10
pH 1
peaks1
0
10
ppm
50
ppm
A
531
B Benzyl ring deformation 541 542 552
Benzyl ring out of plane bend 604 620
C Benzyl ring in plane bend 689 652 631 640
Benzyl ring in plane bend 710 745
D
785 786 786
E Combined benzyl ring deformation + N-(CHx)
breathing mode 781
835
F Chain (C-C)asymmetric stretch 979 979 977 982
G Combined chain (C-C) assymmetric stretch + chain
(C-H) rotation/torsion 991 996
995
Combined chain (C-C) assymmetric stretch + chain
(C-H) rotation/torsion 1013 1009
H Chain (C-C) asymmetric stretch 1037 1036 1017 1025
I
1135
J Tail rocking, benzene out of plane deformation, N-
CH3 rocking 1199 1199 1193 1183
K Combined benzyl-H in plane bend + N (CH) rotation
+ Chain (C-H) torsion 1221 1220
1209
L
1288
M CH2 torsion, CH scissoring in plane, N-CH3 rocking 1363
N
1379
1374 1369
O Tail CH2 rocking, CH rocking, benzyl in plane
deformation 1389
1388 1390
P Combined benzyl_H in plane scissoring + N-(CHx)
asymmetric stretch + chain (C-H) rotation/torsion 1440 1443 1434 1439
Q
1491
1493
R
1516
S Combined methylene spacer (C-H) wagging + (H-C-
H) scissoring on N 1591 1590 1568 1587

70
Table 5.3. Peaks and assignments for ThonB.
Assignments Calculation10
pH 1 pH 3 pH 3
10 ppm10
10 ppm 50 ppm
A Benzyl ring deformation 518 526
526
B
benzyl in plane ring deformation, CH3-O-C
rocking, C-C symmetric stretch 581
608 612
Namino-(CH2) scissoring/pyrimidyl ring in plane
stretch 614 627
C
Namino-(CH2) scissoring/pyrimidyl ring in plane
stretch 635 633 635 634
D
Symmetric stretch (N-CH2) + (CH2-CH2-N) + N
(C-C) in plane bending (C-C) out of plane bend
711 708
E
734
F
N (C-C) in plane bend + asymmetric stretch (C-
O/C-CH2)
762 764
Nquat-CH symmetric stretch 785 782
G Benzyl ring in plane stretch 798 825 815 813
H Chain (CH) wagging 854 852 853 843
I
962
J Chain terminal C-C-C symmetric stretch 979 978
975
K sulfate symmetric stretch 981 988 978
L
1027
M
1054 1077 1073
N
Combined pyrimidyl ring deformation + benzyl
methylene (C-H) rotation 1060 1065
1081
O Chain (CH) wagging 1180 1183 1177 1171
P Pyrimidyl ring out of plane deformation 1215 1215
1203
Q Tail C-C symmetric stretch 1255
1236 1243
R N-(CH3) rocking 1273 1270 1298 1297
S Cchain-H wagging nearest Nquat 1309 1310 1303
T Nmethoxy (CH3) rocking 1347 1355 1350 1341
U
1392 1382
V Chain (CH) wagging 1440 1442 1441 1434
W
1455
X
1583 1579
Y Namino-(CH2) symmetric stretch 1588 1591 1608 1603
Z Nquat methyl (C-H) scissoring 1620 1620
1621

71
In comparison to pH 1 data, DTAB has less change in behavior with regards to
concentration and much less hysteresis with regards to plating behavior at pH 3.
For the BDAC case, the behavior is similar, increased concentration increases the
overpotential for Cu deposition; however, there is slightly less hysteresis in the pH 3 case.
For the ThonB case the plating voltammetry is completely different than in pH 1 case in
which all plots overlay. The peak in current density is much lower with increased concentration
of leveler: at 10 ppm peak is the same as leveler case where as the 25 and 50 ppm concentrations
have peak current density to about 5 mA/cm2. Since pKa of pyrimidines is fairly acidic at ~1, the
ThonB is probably deprotonated at higher pH.13-14
This deprotonation promotes reorientation of
the ThonBr head group at low concentration.
Conclusions
ThonB has optimal Cu plating characteristics that do not correspond to the leveler only
electrochemistry or differential capacity. ThonB exhibits potential dependent behavior at 10 ppm
concentrations and exhibits a strong interaction with Cu at 50 ppm in SHINERS spectra. Since
potential induced reorganization was attributed to the tuning ability of BDAC at pH 1,10
it is
reasonable to infer that this potential induced reorientation is what allows ThonBr to tune the
electroplating potential of Cu at higher pH.
72
References
1. Andricacos, P. C.; Uzoh, C.; Dukovic, J. O.; Horkans, J.; Deligianni, H., IBM J. Res.
Dev. 1998, 42, 567.
2. Kim, S. K.; Josell, D.; Moffat, T. P., Electrodeposition of cu in the pei-peg-cl-sps
additive system - reduction of overfill bump formation during superfilling. J. Electrochem. Soc.
2006, 153 (9), C616.
3. Ritzdorf, T., Challenges and opportunities for electrochemical processing in
microelectronics. ECS Trans. 2007, 6 (8), 1.
4. Dow, W.-P.; Li, C.-C.; Su, Y.-C.; Shen, S.-P.; Huang, C.-C.; Lee, C.; Hsu, B.; Hsu, S.,
Microvia filling by copper electroplating using diazine black as a leveler. Electrochim. Acta
2009, 54 (24), 5894.
5. Jonathan, R., Damascene copper electroplating. In Handbook of semiconductor
manufacturing technology, second edition, CRC Press: 2007; pp 16.
6. Moffat, T. P.; Wheeler, D.; Kim, S. K.; Josell, D., Curvature enhanced adsorbate
coverage mechanism for bottom-up superfilling and bump control in damascene processing.
Electrochim. Acta 2007, 53 (1), 145.
7. Luehn, O.; Celis, J.-P.; Van Hoof, C.; Baert, K.; Ruythooren, W., Leveling of microvias
by electroplating for wafer level packaging. ECS Trans. 2007, 6 (8), 123.
8. Bozzini, B.; D'Urzo, L.; Mele, C., A novel polymeric leveller for the electrodeposition of
copper from acidic sulphate bath: A spectroelectrochemical investigation. Electrochim. Acta
2007, 52 (14), 4767.
9. Bozzini, B.; D'Urzo, L.; Mele, C.; Romanello, V., Electrodeposition of cu from acidic
sulphate solutions in presence of bis-(3-sulphopropyl)-disulphide (sps). T. I. Met. Finish. 2006,
84 (2), 83.
10. Hatch, J. J.; Willey, M. J.; Gewirth, A. A., Influence of aromatic functionality on
quaternary ammonium levelers for cu plating. J. Electrochem. Soc. 2011, 158 (6), D323.
11. Vicenzo, A.; Cavallotti, P. L., Copper electrodeposition from a ph 3 sulfate electrolyte. J.
Appl. Electrochem. 2002, 32 (7), 743.
12. Fonseca, I. T. E.; Marin, A. C. S.; Sá, A. C., The effect of so2−
on the electrochemical
behaviour of cu in neutral medium. Electrochim. Acta 1992, 37 (13), 2541.
13. Jordan, D. O., Nucleic acids, purines, and pyrimidines. Annu. Rev. Biochem. 1952, 21 (1),
209.
14. Singh, A. K.; Mukherjee, B.; Singh, R. P.; Katyal, M., Analytical reactions of substituted
pyrimidines. Talanta 1982, 29 (2), 95.
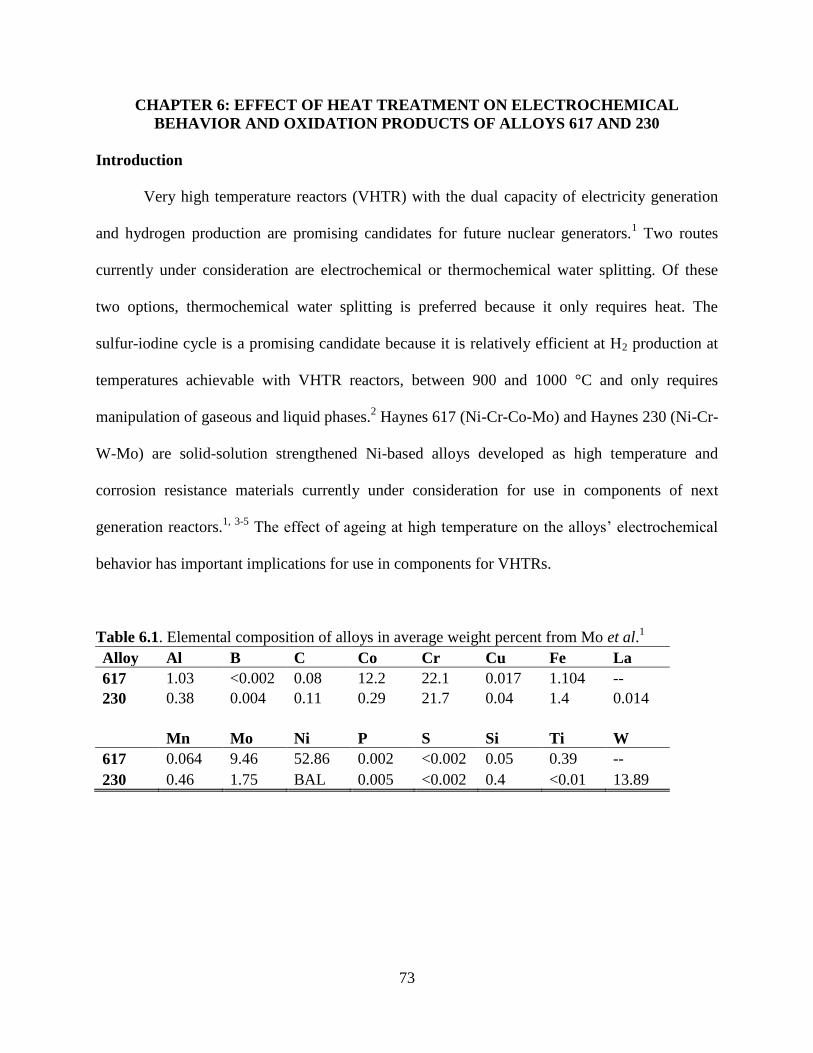
73
CHAPTER 6: EFFECT OF HEAT TREATMENT ON ELECTROCHEMICAL
BEHAVIOR AND OXIDATION PRODUCTS OF ALLOYS 617 AND 230
Introduction
Very high temperature reactors (VHTR) with the dual capacity of electricity generation
and hydrogen production are promising candidates for future nuclear generators.1 Two routes
currently under consideration are electrochemical or thermochemical water splitting. Of these
two options, thermochemical water splitting is preferred because it only requires heat. The
sulfur-iodine cycle is a promising candidate because it is relatively efficient at H2 production at
temperatures achievable with VHTR reactors, between 900 and 1000 °C and only requires
manipulation of gaseous and liquid phases.2 Haynes 617 (Ni-Cr-Co-Mo) and Haynes 230 (Ni-Cr-
W-Mo) are solid-solution strengthened Ni-based alloys developed as high temperature and
corrosion resistance materials currently under consideration for use in components of next
generation reactors.1, 3-5
The effect of ageing at high temperature on the alloys’ electrochemical
behavior has important implications for use in components for VHTRs.
Table 6.1. Elemental composition of alloys in average weight percent from Mo et al.1
Alloy Al B C Co Cr Cu Fe La
617 1.03 <0.002 0.08 12.2 22.1 0.017 1.104 --
230 0.38 0.004 0.11 0.29 21.7 0.04 1.4 0.014
Mn Mo Ni P S Si Ti W
617 0.064 9.46 52.86 0.002 <0.002 0.05 0.39 --
230 0.46 1.75 BAL 0.005 <0.002 0.4 <0.01 13.89

74
Ni, Cr, and Ni-Cr alloys are known to undergo transpassive dissolution, electron-
mediated formation of soluble species from an oxide layer, at sufficiently anodic potentials in
aqueous solutions.6-11
Ring-disk polarization and AC impedence6-9
as well as in situ x-ray
photoelectron spectroscopy12
(XPS) and x-ray absorption near edge spectroscopy13
(XANES) of
binary (Ni-Cr) alloys show that the main product of transpassive dissolution are soluble Cr(VI)
species.
Typical corrosion failure of austenitic Ni alloys in nuclear applications has been
attributed to stress corrosion cracking in which a combination of mechanical stress and corrosive
elements in the environment cause failure of the passive layer to form pits and cracks on the
material’s surface which mechanically weaken the overall structure.12-17
Raman spectroscopy
and surface-enhanced Raman spectroscopy (SERS) have both been used to investigate the effect
of pressurized water reactors on Ni alloys (Alloy 600 and Alloy 690) in which a Cr(III) rich
phase determined to be α-Cr2O3.12-17
Devine’s group has used in situ Surface-Enhanced Raman
Spectroscopy with electrodeposited gold to investigate the passive layer that forms on austenitic
nickel samples exposed to Cl- in various pHs. In HCl solutions they found the passive layer of
alloy C22 (Ni-Cr-Mo-W) to be composed of a combination of MoO3, MoO2, and amorphous
Cr(III) oxide species at low potentials and evidence for Cr2O3 at transpassive potentials.18
Although in-situ techniques have been used to characterize the passive layer in ambient
conditions and with high temperature and pressure solutions, the effect of heat treatment has not
been fully investigated 1, 4-5, 19
Unknown is whether heat aging changes the distribution of surface
species that form during transpassive dissolution in sulfuric acid. Herein we demonstrate the use
of Shell Isolated Surface Enhanced Raman Spectroscopy (SHINERS) to interrogate the

75
speciation of surface species that form in the anodic potentials for Haynes 617 and Haynes 230
that have been aged at high temperature in air and compare to the as-received alloy.
Results and Discussion
Figure 6.1 displays both anodic and cathodic polarization curves obtained in 0.1 M
H2SO4 for the various alloy materials considered here. Transpassive dissolution of the passive
layer on Cr is sulfate anion-assisted7-9
so the electrode was rotated at 1000 rpm in order to
facilitate comparison to the literature.
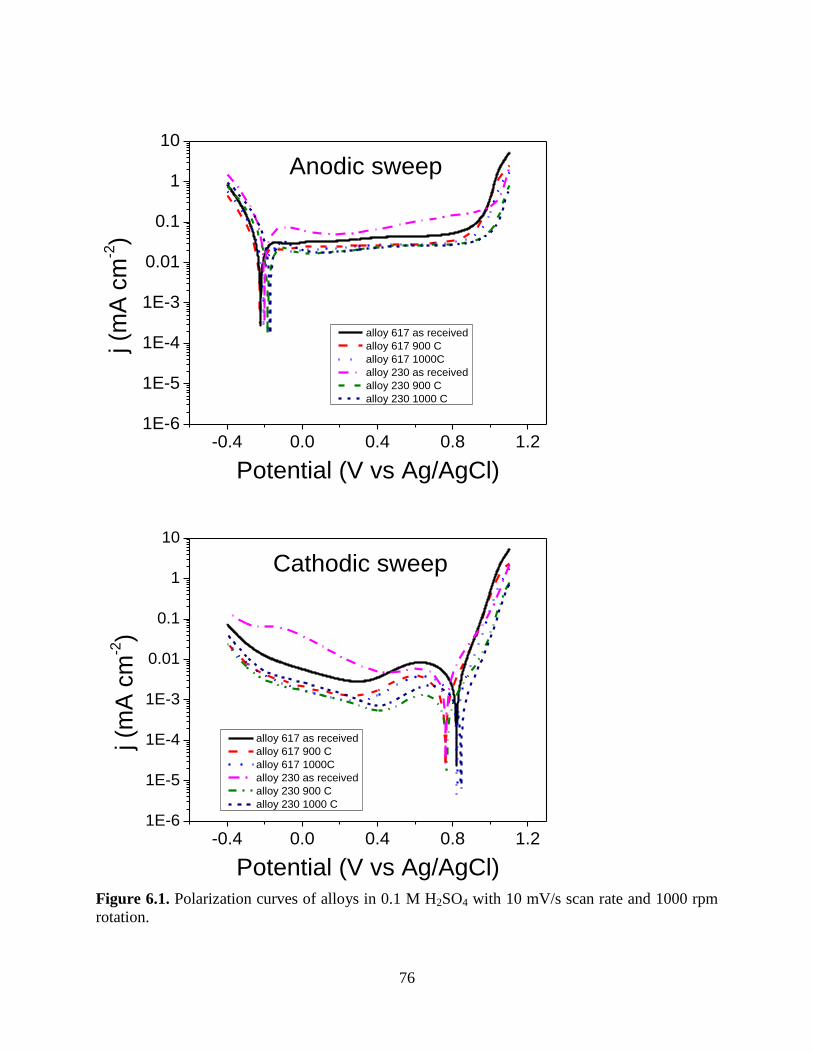
76
-0.4 0.0 0.4 0.8 1.21E-6
1E-5
1E-4
1E-3
0.01
0.1
1
10
j (m
A c
m-2)
Potential (V vs Ag/AgCl)
alloy 617 as received
alloy 617 900 C
alloy 617 1000C
alloy 230 as received
alloy 230 900 C
alloy 230 1000 C
Anodic sweep
-0.4 0.0 0.4 0.8 1.21E-6
1E-5
1E-4
1E-3
0.01
0.1
1
10
Cathodic sweep
j (m
A c
m-2)
Potential (V vs Ag/AgCl)
alloy 617 as received
alloy 617 900 C
alloy 617 1000C
alloy 230 as received
alloy 230 900 C
alloy 230 1000 C
Figure 6.1. Polarization curves of alloys in 0.1 M H2SO4 with 10 mV/s scan rate and 1000 rpm
rotation.

77
The polarization curves for Alloy 617 as-received and after heat treatment are reported in
Fig. 6.1. The anodic scan shows that the passive region begins at -0.24 ± 0.04 V for all samples,
suggesting that both the as-received and heat treated materials will have similar pitting behavior
as they share the same critical pitting potential.4, 20
The current density for the samples at 1.0 V
are 1.4 ± 0.4 mA/cm2 for the as-received case, 0.70 ± 0.1 mA/cm
2 for alloy 617 heat-treated at
900 ˚C, and 0.74 ± 0.3 mA/cm2 for alloy 617 heat-treated at 1000 ˚C. Heat treatment makes the
alloy 617 more corrosion resistant as the current density is reduced. Additionally, the as-received
alloy 617 exhibits an anodic current in the transpassive region ca. 1.6 times higher than that of
heat treated samples, suggesting more easily oxidizable material forms on the surface absent the
heat treatment.
The cathodic potential sweep, also shown in Figure 6.1, displays reduced current density
relative for all three samples to the anodic sweep, likely originating from the formation of a
thicker Cr layer on the anodic sweep.21
The figure also displays an exponential rise in current at
more cathodic potentials for all samples with the as-received Alloy 617 exhibiting a higher
cathodic current than the heat treated samples.
The polarization curves for various treatments of Alloy 230 are also shown in Figure 6.1.
Onset of heat treated samples more positive than for as-received case at 0.19 V ± 0.04 V vs
Ag/AgCl. The current density for the samples at 1.0 V are 0.28 ± 0.05 mA/cm2 for the as-
received alloy 230, 0.08 ± 0.05 mA/cm2 for alloy 230 heat-treated at 900 ˚C, and 0.07 ± 0.05
mA/cm2 for alloy 230 heat-treated at 1000 ˚C. The heat treatment reduces the current density at
1.0 V versus the untreated case. The as-received sample has a higher anodic current density than
that of heat treated samples, again suggesting the presence of more easily oxidizable material on
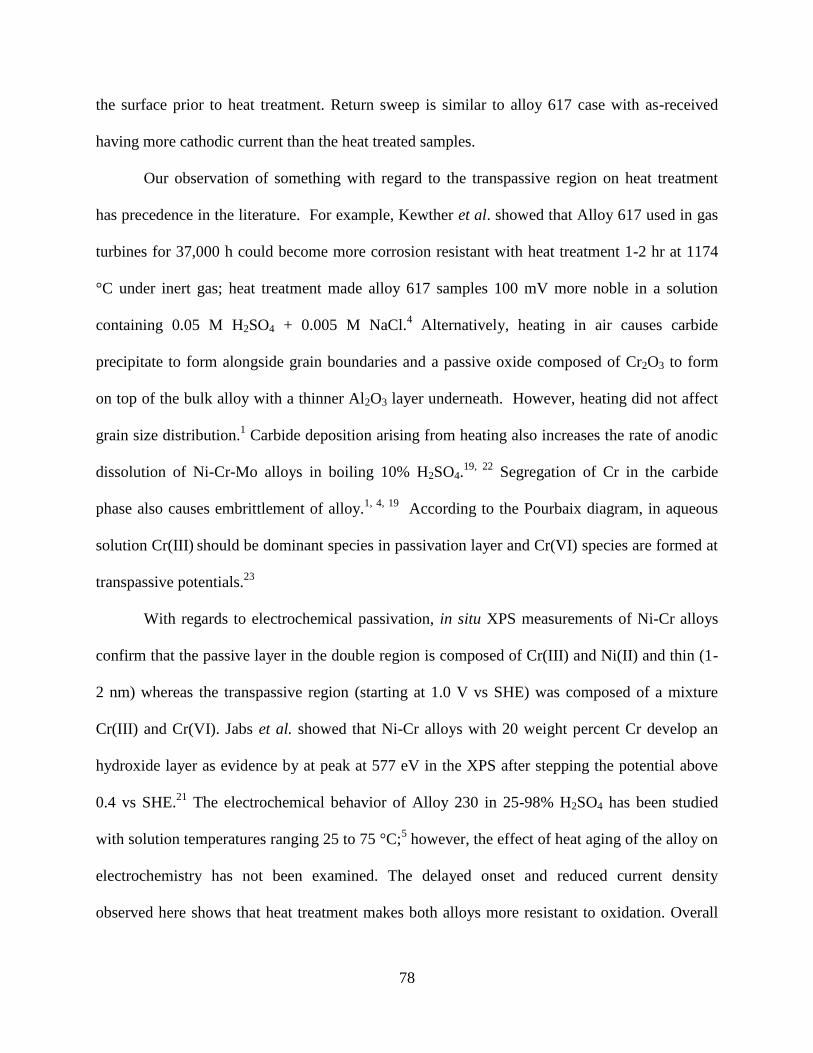
78
the surface prior to heat treatment. Return sweep is similar to alloy 617 case with as-received
having more cathodic current than the heat treated samples.
Our observation of something with regard to the transpassive region on heat treatment
has precedence in the literature. For example, Kewther et al. showed that Alloy 617 used in gas
turbines for 37,000 h could become more corrosion resistant with heat treatment 1-2 hr at 1174
°C under inert gas; heat treatment made alloy 617 samples 100 mV more noble in a solution
containing 0.05 M H2SO4 + 0.005 M NaCl.4 Alternatively, heating in air causes carbide
precipitate to form alongside grain boundaries and a passive oxide composed of Cr2O3 to form
on top of the bulk alloy with a thinner Al2O3 layer underneath. However, heating did not affect
grain size distribution.1 Carbide deposition arising from heating also increases the rate of anodic
dissolution of Ni-Cr-Mo alloys in boiling 10% H2SO4.19, 22
Segregation of Cr in the carbide
phase also causes embrittlement of alloy.1, 4, 19
According to the Pourbaix diagram, in aqueous
solution Cr(III) should be dominant species in passivation layer and Cr(VI) species are formed at
transpassive potentials.23
With regards to electrochemical passivation, in situ XPS measurements of Ni-Cr alloys
confirm that the passive layer in the double region is composed of Cr(III) and Ni(II) and thin (1-
2 nm) whereas the transpassive region (starting at 1.0 V vs SHE) was composed of a mixture
Cr(III) and Cr(VI). Jabs et al. showed that Ni-Cr alloys with 20 weight percent Cr develop an
hydroxide layer as evidence by at peak at 577 eV in the XPS after stepping the potential above
0.4 vs SHE.21
The electrochemical behavior of Alloy 230 in 25-98% H2SO4 has been studied
with solution temperatures ranging 25 to 75 °C;5 however, the effect of heat aging of the alloy on
electrochemistry has not been examined. The delayed onset and reduced current density
observed here shows that heat treatment makes both alloys more resistant to oxidation. Overall

79
our results show that Alloy 230 is more corrosion resistant than Alloy 617, a result also found in
the literature.
In order to interrogate the species present on both the as-received and heat-treated
alloy surfaces, we performed in situ SHINERS on both the alloy 617 and alloy 230 materials in
both the anodic and cathodic directions. Figure 6.2 shows potential dependent SHINERS
obtained from as-received and heat-treated alloy 617 in aqueous 0.1 M H2SO4. Table 6.1
provides a listing of peaks and their assignments.
Table 6.2. Peaks and assignments for spectra.
cm-1
assignment Reference
A 800 adsorbed CrO42-
24-25
B 810-840 CrO42-
24-25
C 850-920 Mixed Cr(III/VI) oxide (MoO42-
and WO42-
) 26-27
D 960-980 Cr2O72- 24-25
E 980 SO42-
symmetric stretch 28
F 1020 HSO4- assymetric stretch
28
For the as-received alloy 617 as the potential is swept from -0.4 V to 0.9 V only peaks
from the electrolyte are observed. Specifically, a peak at 977 cm-1
(peak E) assigned as the
symmetric SO42-
stretch.28
At 0.95 V a group of peaks with large intensities appear at 783 cm-1
(peak A) and 943 cm-1
(peak D) which are assigned adsorbed CrO42-
and Cr2O72-
respectively.24-
25 At 1.0 V, peaks A and D increase in intensity (and shift to higher wavenumbers) with peak A
developing a shoulder at 833 cm-1
(Peak B, assigned as free CrO42-
). On the cathodic sweep
peaks A and D continue increases in intensity until 0.4 V after which the peaks decrease in
intensity. At 0 V a peak centered at 862 cm-1
(peak C) appears and is assigned a mixed oxide
Cr(III/VI).26-27
The region where peak C occurs is also where MoO42-
(876 cm-1
respectively)

80
appear when adsorbed onto a Ag colloid.24
As the potential is swept from 0 to -0.4 V, the
intensity of peak C decreases in intensity. Interestingly there is no feature observed at 898 cm-1
that could be associated with HCrO4-.26-27
For the anodic sweep with the 900 °C treated alloy 617 between -0.4 V to 0.8 V only
electrolyte peaks, peak E and broad peak centered at 1020 cm-1
(peak F) assigned to HSO4- are
observed. 28
At 0.8 V a peak at 867 cm-1
(peak C) appears. At 0.9 V an intense peak at 793 cm-1
(peak A) appears with a shoulder at 970 cm-1
(peak D). All peaks increase in intensity after
reaching the switching potential of 1.0V. On the cathodic sweep, peak A reaches maximum
intensity at about 0.9 V, the while peaks C and D reach maximum intensity at around 0 V vs
Ag/AgCl.
Similar to the other two cases, in spectra obtained from the 1000 °C treated alloy 617
only electrolyte peaks (E and F) are observed from -0.4 to 0.8 V. At 0.8 V a peak at 875 cm-1
(peak C) and at 0.95 V a peak at 800 cm-1
(peak A) appears while peak D has increased in
intensity. At 1.0 V, peak A and peak C have increased in intensity while a peak at 960 cm-1
(peak
D) has appeared. On the cathodic sweep, peak A reaches its maximum intensity at 0.8 V while
peaks C and D reach a maximum between 0.2 V and -0.2 V before decreasing in intensity.
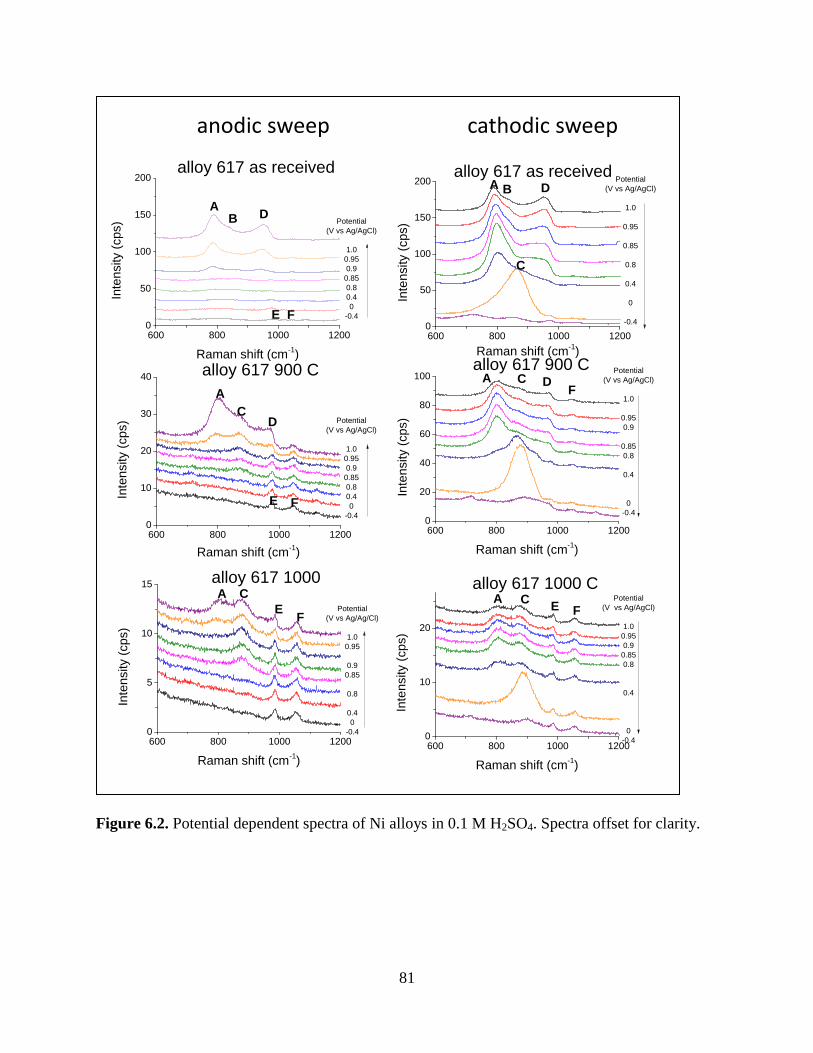
81
Figure 6.2. Potential dependent spectra of Ni alloys in 0.1 M H2SO4. Spectra offset for clarity.
anodic sweep cathodic sweep
600 800 1000 12000
10
20
30
40 alloy 617 900 C
Potential
(V vs Ag/AgCl)
1.0
0.95
0.9
0.85
0.8
0.4
0
-0.4
Inte
nsity (
cps)
Raman shift (cm-1)
E F
A
CD
600 800 1000 12000
5
10
15
Inte
nsity (
cp
s)
Raman shift (cm-1)
alloy 617 1000
Potential
(V vs Ag/Ag/Cl)
1.0
0.95
0.9
0.85
0.8
0.4
0
-0.4
EF
A C
600 800 1000 12000
50
100
150
200alloy 617 as received
Inte
nsity (
cps)
Raman shift (cm-1)
Potential
(V vs Ag/AgCl)
1.0
0.95
0.9
0.85
0.8
0.4
0
-0.4
AD
E F
B
600 800 1000 12000
50
100
150
200
Inte
nsity (
cps)
Raman shift (cm-1)
alloy 617 as receivedPotential
(V vs Ag/AgCl)
1.0
0.95
0.85
0.8
0.4
0
-0.4
A D
C
B
600 800 1000 12000
20
40
60
80
100
Inte
nsity (
cp
s)
Raman shift (cm-1)
alloy 617 900 C Potential
(V vs Ag/AgCl)
1.0
0.95
0.9
0.85
0.8
0.4
0
-0.4
A C DF
600 800 1000 12000
10
20
Inte
nsity (
cp
s)
Raman shift (cm-1)
Potential
(V vs Ag/AgCl)
1.0
0.95
0.9
0.85
0.8
0.4
0
-0.4
alloy 617 1000 C
E FA C

82
Figure 6.3 shows the peak intensity for the Cr species on Alloy 617 samples relative to their
maximum peak intensity to better interpret the change in Cr speciation with potential. The onset
for peak A -- associated with adsorbed CrO42-
-- on the anodic sweep is similar for the three
samples. On cathodic sweep the maximum intensity for peak A is reached 0.2 V earlier for the
heat-treated Alloy 617 samples relative to the as-received sample. On the cathodic sweep, the
maximum intensity for peaks C and D are delayed for 0.2 V for the heat-treated Alloy 617
samples relative to the as-received Alloy 617. Thus heat treatment controls both the nature of the
Cr overlayer and its potential dependent development.
0.0
0.4
0.8
0.0
0.4
0.8
-0.4 0.0 0.4 0.8 1.2
0.0
0.4
0.8
alloy 617 as received
alloy 617 900 C
alloy 617 1000 C
A
C
Re
lative
Pe
ak I
nte
nsity
B
Potential (V vs Ag/AgCl)
Figure 6.3. Relative peak intensity versus potential plot for a) CrO42-
b) mixed oxide, c) Cr2O72-
.
Our observation that peaks assigned to Cr(VI) species appear at anodic potentials
suggests that Cr(VI) is the major product formed in the transpassive region, a result which has
consistent with the literature.6-7, 21
There is no clear evidence for Cr2O3 formation, which is the
major product when either Alloy 230 or Alloy 617 is heated in air;1 however, the mixed
Cr(III)/Cr(VI) species is observed on the cathodic sweep. We note that Cr(III) species have a

83
smaller scattering cross-section relative to Cr(VI) peaks for spectra produced by roughened or
colloidal samples of Ag, Au, and Cu.24-25, 29
SERS spectra of Alloy 22 a Ni-Cr-Mo alloy in HCl
display broad peaks at 430 and 490 cm-1
attributed to an amorphous Cr(III) species.18
There are
some low intensity features at that region for some of the spectra.
The other interesting aspect of the spectra reported above concerns the delayed potential
associated with the formation of peaks associated with Cr2O72-
and mixed oxide and accelerated
potential of the appearance of peak A, associated with CrO42-
in the heat treated samples. We
suggest that the heat treatment produces more fully oxidized Cr material relative to Cr2O72-
, the
consequences of which are seen spectroscopically. Interestingly, the Pourbaix diagram for Cr
shows that HCrO4- rather than chromate should be stable in the potential region interrogated (at
pH 1), so the presence of CrO42-
suggests a less acidic environment overall. Correspondingly,
we note that heat treatment leads to an increase in corrosion resistance.
Figure 6.4 and Figure 6.5 present spectra and intensity vs. potential curves, respectively,
for the three Cr species observed from heat treated and as received Alloy 230 samples.
For the as-received Alloy 230 sample, as the potential is swept from -0.4 V to 0.9 V, only
electrolyte peaks (E and F) are observed. From 0.85 to 0.9 V, a peak centered at 800 cm-1
(peak
A) appears and grows in intensity while shifting to 801 cm-1
. At 1.0 V peak A develops a
shoulder at 847 cm-1
(peak B) and a peak at 978 cm-1
appears (peak D). On the cathodic sweep,
both A and D increase in intensity down to 0.9 V then rapidly decrease in intensity by 0.8 V and
continue a gradual decrease in intensity until the end of the scan at -0.4 V.
Similar to the as received case, only electrolyte peaks (E and F) are observed on the 900
°C-treated Alloy 230 sample, as the potential is swept from -0.4 V to 0.4 V. At 0.8 V, a peak
centered at 882 cm-1
(peak C) appears. At 0.95 V two other peaks at 792 cm-1
(peak A) and 975

84
cm-1
appear (peak D). All three peaks increase in intensity and shift to higher frequencies (800,
888, and 964 cm-1
) until 1.05 V. On the cathodic sweep, peak A increases in intensity until 0.8 V
then decreases as the potential is swept to more negative values. Peaks C and D remain at the
same intensity until 0 V, where peak C shifts to 920 cm-1
and increases in intensity until -0.4 V
the end of the cathodic sweep. This region is where adsorbed MoO42-
and WO42-
(876 cm-1
and
912cm-1
respectively) would also occur.24
For the 1000 °C treated Alloy 230, as the potential is swept from -0.4 to 0.95 only the
electrolyte (E and F) are observed. At 1.0 V a peak centered a 795 cm-1
(peak A) appears and
grows in intensity at 1.05 V. On the cathodic sweep, peak A increases in intensity, reaches a
maximum at 0.8 V and slowly decreases in intensity as the potential is swept to more negative
values until 0 V. After 0 V, a peak at 911 cm-1
(peak C) appears and grows in intensity for the
rest of the cathodic sweep. This region is where adsorbed MoO42-
and WO42-
(876 cm-1
and 912
cm-1
respectively) would also occur.24
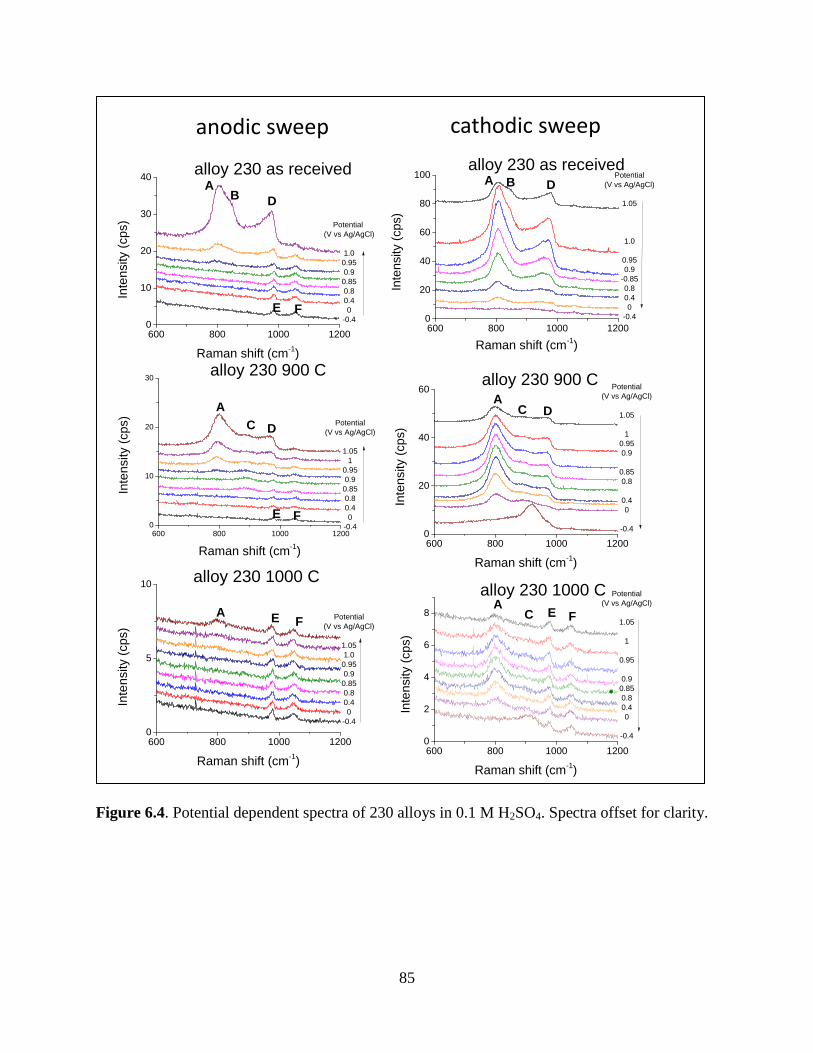
85
Figure 6.4. Potential dependent spectra of 230 alloys in 0.1 M H2SO4. Spectra offset for clarity.
anodic sweep cathodic sweep
600 800 1000 12000
10
20
30
40
Inte
nsity (
cp
s)
Raman shift (cm-1)
alloy 230 as receivedA
D
Potential
(V vs Ag/AgCl)
1.0
0.95
0.9
0.85
0.8
0.4
0
-0.4
E F
B
600 800 1000 12000
10
20
30
Inte
nsity (
cps)
Raman shift (cm-1)
A
C DPotential
(V vs Ag/AgCl)
1.05
1
0.95
0.9
0.85
0.8
0.4
0
-0.4
alloy 230 900 C
E F
600 800 1000 12000
5
10
Inte
nsity (
cps)
Raman shift (cm-1)
A Potential
(V vs Ag/AgCl)
1.05
1.0
0.95
0.9
0.85
0.8
0.4
0
-0.4
alloy 230 1000 C
FE
600 800 1000 12000
20
40
60
80
100
Inte
nsity (
cps)
Raman shift (cm-1)
alloy 230 as receivedPotential
(V vs Ag/AgCl)
1.05
1.0
0.95
0.9
-0.85
0.8
0.4
0
-0.4
A B D
600 800 1000 12000
20
40
60In
tensity (
cps)
Raman shift (cm-1)
Potential
(V vs Ag/AgCl)
1.05
1
0.95
0.9
0.85
0.8
0.4
0
-0.4
alloy 230 900 CA
C D
600 800 1000 12000
2
4
6
8
Inte
nsity (
cps)
Raman shift (cm-1)
alloy 230 1000 C Potential
(V vs Ag/AgCl)
1.05
1
0.95
0.9
0.85
0.8
0.4
0
-0.4
AC E F
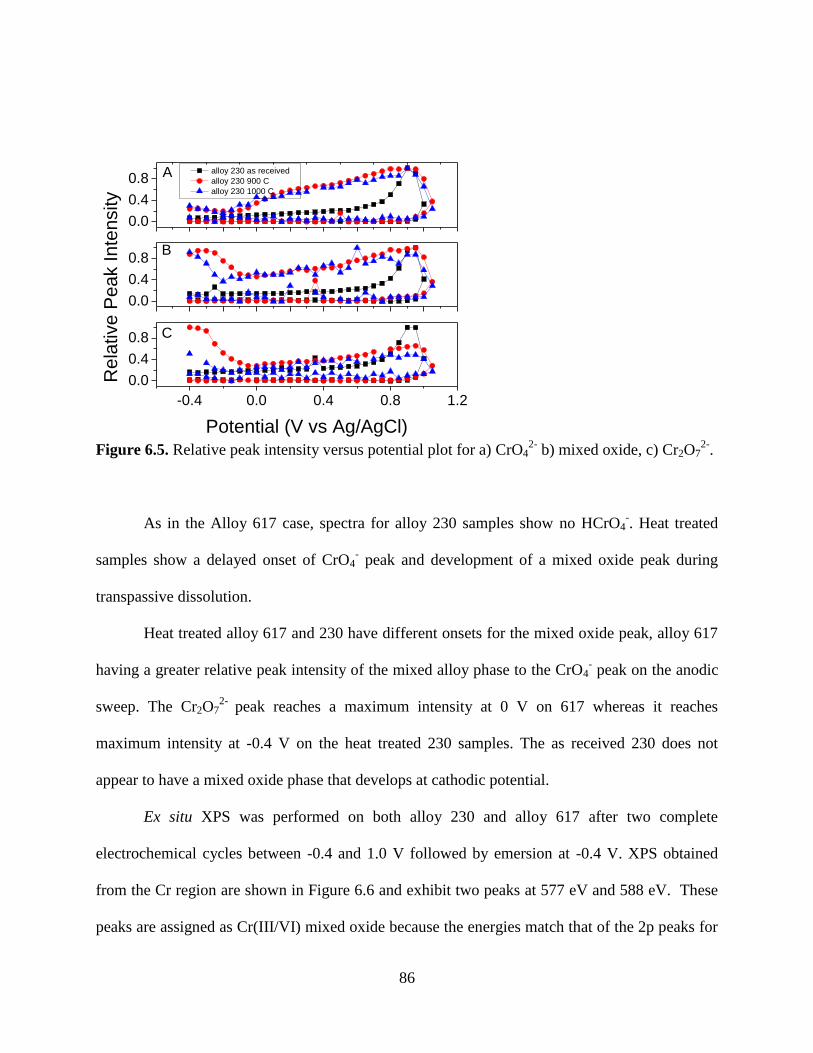
86
0.0
0.4
0.8
0.0
0.4
0.8
-0.4 0.0 0.4 0.8 1.2
0.0
0.4
0.8
alloy 230 as received
alloy 230 900 C
alloy 230 1000 C
A
B
C
Re
lative
Pe
ak I
nte
nsity
Potential (V vs Ag/AgCl)
Figure 6.5. Relative peak intensity versus potential plot for a) CrO42-
b) mixed oxide, c) Cr2O72-
.
As in the Alloy 617 case, spectra for alloy 230 samples show no HCrO4-. Heat treated
samples show a delayed onset of CrO4- peak and development of a mixed oxide peak during
transpassive dissolution.
Heat treated alloy 617 and 230 have different onsets for the mixed oxide peak, alloy 617
having a greater relative peak intensity of the mixed alloy phase to the CrO4- peak on the anodic
sweep. The Cr2O72-
peak reaches a maximum intensity at 0 V on 617 whereas it reaches
maximum intensity at -0.4 V on the heat treated 230 samples. The as received 230 does not
appear to have a mixed oxide phase that develops at cathodic potential.
Ex situ XPS was performed on both alloy 230 and alloy 617 after two complete
electrochemical cycles between -0.4 and 1.0 V followed by emersion at -0.4 V. XPS obtained
from the Cr region are shown in Figure 6.6 and exhibit two peaks at 577 eV and 588 eV. These
peaks are assigned as Cr(III/VI) mixed oxide because the energies match that of the 2p peaks for

87
oxidized Cr. The peaks for Cr(III) are at 577 and 586-8 eV,30
while the peak for Cr (VI) is
578.75 eV.21
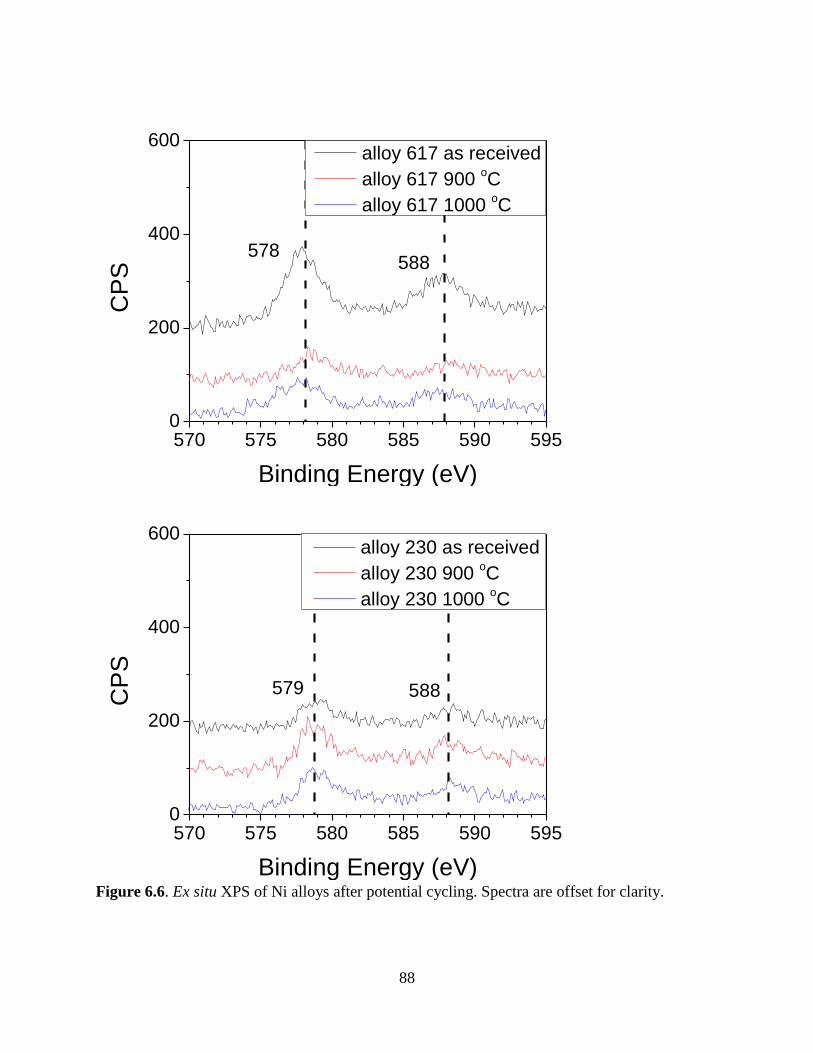
88
570 575 580 585 590 5950
200
400
600
588
CP
S
Binding Energy (eV)
alloy 617 as received
alloy 617 900 oC
alloy 617 1000 oC
578
570 575 580 585 590 5950
200
400
600
588579
CP
S
Binding Energy (eV)
alloy 230 as received
alloy 230 900 oC
alloy 230 1000 oC
Figure 6.6. Ex situ XPS of Ni alloys after potential cycling. Spectra are offset for clarity.

89
Table 6.3 is a summary of the relative amounts of the most abundant elements in the
alloys (Ni, Cr, Mo, Co, and W) before and after oxidation determined from low resolution survey
scans. Samples were oxidized by applying a potential of 1.1 V vs Ag/AgCl to the Ni sample for
60 s. The as received and heat treated alloy 617 samples exhibit the same behavior; the
percentage of Cr increases, Ni and Co decrease, and Mo remains the same after electrochemical
oxidation. For the alloy 230 sample, the percentage of Cr and W increases, while Ni and Mo
decrease. The as received 230 has a higher fraction of W compared to the heat treated samples.
Heat treatment has a minimal affect on the oxidation state and relative amount of Cr found ex
situ for the Ni samples before and after corrosion in 0.1 M H2SO4.
Table 6.3. Relative atomic % of 5 major elements: Ni, Cr, Mo, W, Co before and after oxidizing
at 1.1 V for 60 sec.
alloy 617
as received
alloy 617
900 ˚C
alloy 617
1000 ˚C
Before After Before After Before After
Ni 40 11 38 12 48 13
Cr 26 77 30 76 12 75
Mo 13 13 12 11 16 12
Co 20 0.1 20 1 23 --
alloy 230
as received
alloy 230
900 ˚C
alloy 230
1000 ˚C
Before After Before After Before After
Ni 36 -- 45 14 58 14
Cr 9 29 51 75 35 46
Mo 53 4 5 4 3 --
W 2 67 -- 7 4 40

90
Conclusion
We show there is a correlation between transpassive current density and observation of
surface Cr species in the Raman spectra. Delayed transpassive dissolution is associated with
early onset of Cr(VI) species in spectra. The difference between transpassive current densities
from 217 and 630 suggest the two alloys have different corrosion susceptibility and indeed the
230 is more corrosion resistant. In both alloys, heat treatment resulted in delayed onset of the
transpassive region, likely because the heat treatment makes more Cr available to the surface. An
increase in the relative intensity of the mixed oxide phase occurs with heat treatment.4
Finally, we examine reasons that heat treated Alloy 230 and Alloy 617 exhibit greater
corrosion resistance relative to the as-received material. The XPS measurements show that
oxidation is associated with increased Cr content at the surface and speciation of the Cr to form
protective oxides is well-known to increase the passivity of electrode surfaces. 6-11
It is also
understood that the average grain size grows and distribution of sizes increases after heating in
furnace,31
thus leading to the presence of fewer reactive grain boundaries.
There are other possible contributory factors to increased corrosion resistance with the
heat treated materials. Al2O3 is known to form as a consequence of internal oxidation; 31-32
this
Al2O3 might contribute to increased corrosion resistance. Formation of a surface layer of
MnCr2O4 (spinel) imparts 230 with better corrosion resistance than 617 (as Alloy 230 contains
twice as much Mn) at 900 C; however, both undergo spallation and volatilization of Cr2O3 layer
at 1100 C.32
A study involving surface segregation in Haynes 230 showed that while S, P, and Si
remained at the surface at 875 C, no change in Ni or Cr content was observed.33
Interestingly we found less intense Cr signals in the Raman spectra from the 1000 C
treated samples of both 230 and 617. This decrease relative to the samples heat treated at lower

91
temperatures might be due the formation of volatile CrO3 from Cr2O3 at temperatures above 950
C.31
We note, however, that a decrease in Cr content following electrochemical oxidation was
not observed in the XPS.
References
1. Mo, K.; Lovicu, G.; Tung, H.-M.; Chen, X.; Stubbins, J. F., High temperature aging and
corrosion study on alloy 617 and alloy 230. J. Eng. Gas Turb. Power 2011, 133 (5), 052908.
2. Vitart, X.; Le Duigou, A.; Carles, P., Hydrogen production using the sulfur–iodine cycle
coupled to a vhtr: An overview. Energ. Convers. Manage. 2006, 47 (17), 2740.
3. Ahmed, N.; Bakare, M. S.; McCartney, D. G.; Voisey, K. T., The effects of
microstructural features on the performance gap in corrosion resistance between bulk and hvof
sprayed inconel 625. Surf. Coat. Technol. 2010, 204 (Copyright (C) 2011 American Chemical
Society (ACS). All Rights Reserved.), 2294.
4. Kewther, A.; Hashmi, M.; Yilbas, B., Corrosion properties of inconel 617 alloy after heat
treatment at elevated temperature. J. Mater. Eng. Perform. 2001, 10 (1), 108.
5. Habib, K., Electrochemical behavior of a high strength nickel-based alloy in h2so4.
Desalination 1993, 93 (1–3), 537.
6. Bojinov, M.; Fabricius, G.; Kinnunen, P.; Laitinen, T.; Mäkelä, K.; Saario, T.; Sundholm,
G., The mechanism of transpassive dissolution of ni–cr alloys in sulphate solutions. Electrochim.
Acta 2000, 45 (17), 2791.
7. Bojinov, M.; Fabricius, G.; Kinnunen, P.; Laitinen, T.; Mäkelä, K.; Saario, T.; Sundholm,
G.; Yliniemi, K., Transpassive dissolution of ni–cr alloys in sulphate solutions—comparison
between a model alloy and two industrial alloys. Electrochim. Acta 2002, 47 (11), 1697.
8. Bojinov, M.; Galtayries, A.; Kinnunen, P.; Machet, A.; Marcus, P., Estimation of the
parameters of oxide film growth on nickel-based alloys in high-temperature water electrolytes.
Electrochim. Acta 2007, 52 (Copyright (C) 2011 American Chemical Society (ACS). All Rights
Reserved.), 7475.
9. Bojinov, M.; Tzvetkoff, T., The influence of solution anion on the mechanism of
transpassive dissolution of ferrous- and nickel-based alloys. J. Phys. Chem. B 2003, 107 (21),
5101.
10. Keddam, M.; Takenouti, H.; Yu, N., Transpassive dissolution of ni in acidic sulfate
media: A kinetic model. J. Electrochem. Soc. 1985, 132 (11), 2561.
11. Schmuki, P.; Virtanen, S.; Davenport, A. J.; Vitus, C. M., Transpassive dissolution of cr
and sputter-deposited cr oxides studied by in situ x-ray near-edge spectroscopy. J. Electrochem.
Soc. 1996, 143 (12), 3997.
12. Abdallah, M.; Megahed, H. E.; Elnager, M. M.; Mabrouk, E. M.; Radwan, D., Pitting
corrosion of nickel alloys and its inhibition by some dihydrazide derivatives. Bull. Electrochem.
2003, 19 (Copyright (C) 2011 American Chemical Society (ACS). All Rights Reserved.), 245.
13. Delichere, P.; Hugot-Le Goff, A.; Joiret, S., Study of thin corrosion films by in situ
raman spectroscopy combined with direct observation of nuclear reactions. Surf. Interface Anal.
1988, 12 (7), 419.
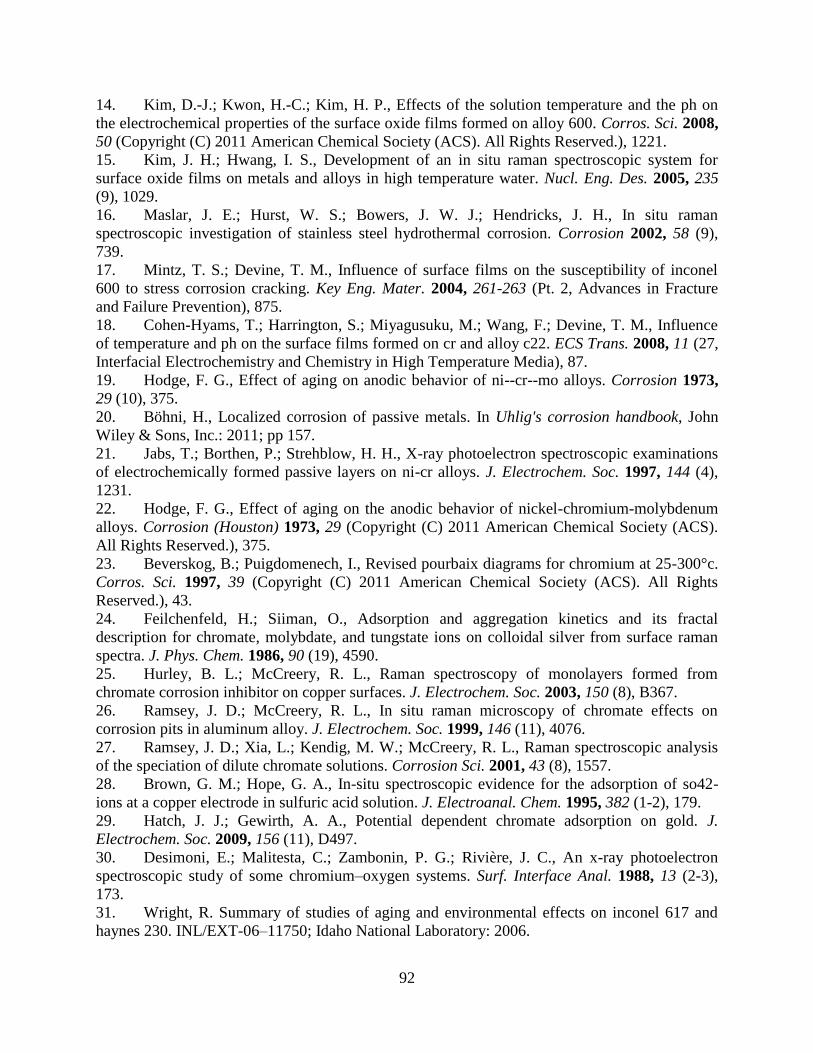
92
14. Kim, D.-J.; Kwon, H.-C.; Kim, H. P., Effects of the solution temperature and the ph on
the electrochemical properties of the surface oxide films formed on alloy 600. Corros. Sci. 2008,
50 (Copyright (C) 2011 American Chemical Society (ACS). All Rights Reserved.), 1221.
15. Kim, J. H.; Hwang, I. S., Development of an in situ raman spectroscopic system for
surface oxide films on metals and alloys in high temperature water. Nucl. Eng. Des. 2005, 235
(9), 1029.
16. Maslar, J. E.; Hurst, W. S.; Bowers, J. W. J.; Hendricks, J. H., In situ raman
spectroscopic investigation of stainless steel hydrothermal corrosion. Corrosion 2002, 58 (9),
739.
17. Mintz, T. S.; Devine, T. M., Influence of surface films on the susceptibility of inconel
600 to stress corrosion cracking. Key Eng. Mater. 2004, 261-263 (Pt. 2, Advances in Fracture
and Failure Prevention), 875.
18. Cohen-Hyams, T.; Harrington, S.; Miyagusuku, M.; Wang, F.; Devine, T. M., Influence
of temperature and ph on the surface films formed on cr and alloy c22. ECS Trans. 2008, 11 (27,
Interfacial Electrochemistry and Chemistry in High Temperature Media), 87.
19. Hodge, F. G., Effect of aging on anodic behavior of ni--cr--mo alloys. Corrosion 1973,
29 (10), 375.
20. Böhni, H., Localized corrosion of passive metals. In Uhlig's corrosion handbook, John
Wiley & Sons, Inc.: 2011; pp 157.
21. Jabs, T.; Borthen, P.; Strehblow, H. H., X-ray photoelectron spectroscopic examinations
of electrochemically formed passive layers on ni-cr alloys. J. Electrochem. Soc. 1997, 144 (4),
1231.
22. Hodge, F. G., Effect of aging on the anodic behavior of nickel-chromium-molybdenum
alloys. Corrosion (Houston) 1973, 29 (Copyright (C) 2011 American Chemical Society (ACS).
All Rights Reserved.), 375.
23. Beverskog, B.; Puigdomenech, I., Revised pourbaix diagrams for chromium at 25-300°c.
Corros. Sci. 1997, 39 (Copyright (C) 2011 American Chemical Society (ACS). All Rights
Reserved.), 43.
24. Feilchenfeld, H.; Siiman, O., Adsorption and aggregation kinetics and its fractal
description for chromate, molybdate, and tungstate ions on colloidal silver from surface raman
spectra. J. Phys. Chem. 1986, 90 (19), 4590.
25. Hurley, B. L.; McCreery, R. L., Raman spectroscopy of monolayers formed from
chromate corrosion inhibitor on copper surfaces. J. Electrochem. Soc. 2003, 150 (8), B367.
26. Ramsey, J. D.; McCreery, R. L., In situ raman microscopy of chromate effects on
corrosion pits in aluminum alloy. J. Electrochem. Soc. 1999, 146 (11), 4076.
27. Ramsey, J. D.; Xia, L.; Kendig, M. W.; McCreery, R. L., Raman spectroscopic analysis
of the speciation of dilute chromate solutions. Corrosion Sci. 2001, 43 (8), 1557.
28. Brown, G. M.; Hope, G. A., In-situ spectroscopic evidence for the adsorption of so42-
ions at a copper electrode in sulfuric acid solution. J. Electroanal. Chem. 1995, 382 (1-2), 179.
29. Hatch, J. J.; Gewirth, A. A., Potential dependent chromate adsorption on gold. J.
Electrochem. Soc. 2009, 156 (11), D497.
30. Desimoni, E.; Malitesta, C.; Zambonin, P. G.; Rivière, J. C., An x-ray photoelectron
spectroscopic study of some chromium–oxygen systems. Surf. Interface Anal. 1988, 13 (2-3),
173.
31. Wright, R. Summary of studies of aging and environmental effects on inconel 617 and
haynes 230. INL/EXT-06–11750; Idaho National Laboratory: 2006.

93
32. Kim, D.; Jang, C.; Ryu, W., Oxidation characteristics and oxide layer evolution of alloy
617 and haynes 230 at 900 °c and 1100 °c. Oxid. Met. 2009, 71 (5), 271.
33. Pop, D.; Wolski, K., Surface segregation in haynes 230 alloy. Appl. Surf. Sci. 2006, 253
(4), 2244.

94
APPENDIX A: ACCELERATOR ON COPPER
Currently copper is used to make interconnects on microprocessors, particularly when
feature-filling is required because of its lower line resistance and better electromigration
performance as compared to Al.1 Bis(3-sulfopropyl)-disulfide (SPS) is an accelerator used to
promote bottom-up fill of features in the standard Cu acid plating bath by increasing the rate of
Cu deposition within features relative to that at the plane above the features.1-6
It consists of a
disulfide bridge and a sulfonate head group. It may bind to the Cu surface through the sulfide
group and can undergo reductive bond cleavage at the Cu surface. The sulfonate head group is
thought to repel suppressors and levelers (both work by increasing the overpotential of Cu
deposition and result in slow growth at the top plane of the chip) thus facilitating Cu deposition.
When used in conjunction with Cl-, SPS and is monomer mercaptopropane sulfonate (MPS) act
to reduce the overpotential for Cu deposition.1
There are many models under consideration to explain the accelerant effect of SPS.7-12
The curvature enhanced adsorbate coverage model (CEAC model) proposed by Moffat links the
kinetics determined from electrochemical experiments on planar electrodes to that of shape-
change simulations of feature filling correctly predicts the appearance of overfill bumps when
only a suppresser and accelerator complexes are present.13-14
Figure A.1 displays the SHINERS of a solution of 5 mM SPS, 2 mM KCl, 10 mM CuSO4
and 0.1 M H2SO4 on a Cu(111) electrode. At 0 V some peaks attributed to SPS are present,
however they are low intensity. As the potential is stepped to -0.4 V, the SPS as well as Cu-Cl
peaks increase in intensity. As the potential is stepped to -0.5 V the SPS peaks continue to grow
in intensity. At -0.6 V the SPS peaks exhibit a decrease in intensity.
95
Figure A.2 displays the SHINERS of a solution of 5 mM SPS, 2 mM KCl, 10 mM CuSO4
and 0.1 M H2SO4 on a Cu(100) electrode. At 0 V the SPS peaks are more distinguishable from
the background than in the Cu(111) case. As the potential is swept in the cathodic direction there
is a gradual increase in the intensity of all peaks, especially that of peaks A, D and K assigned to
Cu-Cl, a combination mode of CH-S stretch and S-O stretch, and a symmetric S-O stretch from
the sulfonate group respectively.

96
200 400 600 800 1000 1200 1400
O
NML
K
JI
H
GF
E
D
C
B
Raman shift/cm-1
0 V
-0.1 V
-0.2 V
-0.3 V
-0.4 V
-0.5 V
-0.6 V
Potential/
V vs
Ag/AgCl
A
Figure A.1. Potential dependent SHINERS of the cathodic sweep in an aqueous solution of 5
mM SPS, 2 mM KCl, 10 mM CuSO4 and 0.1 M H2SO4 on a Cu(111) electrode.
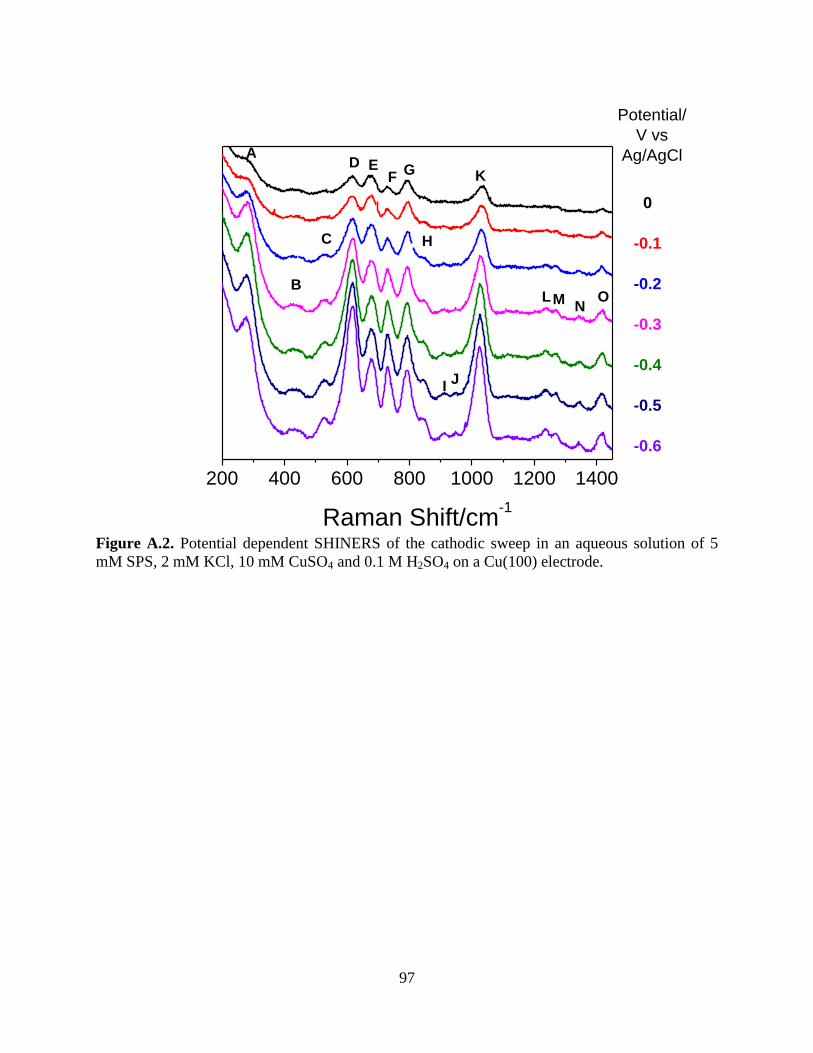
97
200 400 600 800 1000 1200 1400
ON
ML
K
JI
H
GF
ED
C
B
A
Raman Shift/cm-1
Potential/
V vs
Ag/AgCl
0
-0.1
-0.2
-0.3
-0.4
-0.5
-0.6
Figure A.2. Potential dependent SHINERS of the cathodic sweep in an aqueous solution of 5
mM SPS, 2 mM KCl, 10 mM CuSO4 and 0.1 M H2SO4 on a Cu(100) electrode.

98
Table A.1. Peaks and assignments for SPS near Cu.
Peak
Solid
SPS15
Cu(poly)
(0 V)15
Cu(111)
(-0.5 V)
Cu(100)
(-0.3 V) Assignments15
A
299 280 286 Cu-Cl
318
CH2 rock
353
SO3 scissor
B 461
432 436 SO3 scissor
511
S-S str
C 528 539 526 525 C-S(sulfonate) str
544
C-S(sulfonate) str
D 592
608 608 C-S(sulfide) str and S-O sr
D 644 632 619 619 Gauche C-S(sulfide) str
E 705 696 680 679
Trans C-S(sulfide) str and S=O
str
F 747 743 733 732 CH2 rock
G 799 805 792 792 C-S(sulfonate) str
H 860 859 842 843 C-C str
I 898
912 CH2 rock
J 960
953 SO3 str
1014
CH2 bend
K 1075 1030 1021 1025 S-O str
1137 1113
C-C-H bend
1175
C-C-H bend
L 1207 1241 1234 1240 Assym S=O str
1253
CH2 wag
M 1277 1272 1272 1271 CH2 scissor
1326
CH2 scissor
N 1353 1348 1343 1350 CH2 scissor
O 1430 1415 1415 1416 CH2 scissor

99
References
1. Vereecken, P. M.; Binstead, R. A.; Deligianni, H.; Andricacos, P. C., The chemistry of
additives in damascene copper plating. IBM J. Res. Dev. 2005, 49 (1), 3.
2. Healy, J. P.; Pletcher, D.; Goodenough, M., The chemistry of the additives in an acid
copper electroplating bath: Part iii. The mechanism of brightening by 4,5-dithia-octane-1, 8-
disulphonic acid. J. Electroanal. Chem. 1992, 338 (1–2), 179.
3. Stoichev, D.; Vitanova, I.; Buyukliev, R.; Petkova, N.; Popova, I.; Poyarliev, I., Effect of
some dialkyl-, diaryl-, and diarylalkyl-disulfide derivatives on copper electrodeposition. J. Appl.
Electrochem. 1992, 22 (10), 978.
4. Kudelski, A.; Pecul, M.; Bukowska, J., Interaction of 2-mercaptoethanesulfonate
monolayers on silver with sodium cations. J. Raman Spectrosc. 2002, 33 (10), 796.
5. Kudelski, A., Structures of monolayers formed from different hs—(ch2)2—x thiols on
gold, silver and copper: Comparitive studies by surface-enhanced raman scattering. J. Raman
Spectrosc. 2003, 34 (11), 853.
6. Castro, J. L.; López-Ramírez, M. R.; Arenas, J. F.; Otero, J. C., Surface-enhanced raman
scattering of 3-mercaptopropionic acid adsorbed on a colloidal silver surface. J. Raman
Spectrosc. 2004, 35 (11), 997.
7. Taubert, C. E.; Kolb, D. M.; Memmert, U.; Meyer, H., Adsorption of the additives mpa,
mpsa, and sps onto cu(111) from sulfuric acid solutions. J. Electrochem. Soc. 2007, 154 (6),
D293.
8. Lee, C. H.; Lee, S. C.; Kim, J. J., Bottom-up filling in cu electroless deposition using bis-
(3-sulfopropyl)-disulfide (sps). Electrochim. Acta 2005, 50 (16-17), 3563.
9. Bozzini, B.; D'Urzo, L.; Romanello, V.; Mele, C., Electrodeposition of cu from acidic
sulfate solutions in the presence of bis-(3-sulfopropyl)-disulfide (sps) and chloride ions. J.
Electrochem. Soc. 2006, 153 (4), C254.
10. Yanson, Y.; Frenken, J. W. M.; Rost, M. J., A general model of metal underpotential
deposition in the presence of thiol-based additives based on an in situ stm study. Phys. Chem.
Chem. Phys. 2011, 13 (35), 16095.
11. Tan, M.; Guymon, C.; Wheeler, D.; Harb, J. N., The role of sps, mpsa, and chloride in
additive systems for copper electrodeposition. J. Electrochem. Soc. 2007, 154, D78.
12. D'Urzo, L.; Bozzini, B., A sers study of the galvanostatic sequence used for the
electrochemical deposition of copper from baths employed in the fabrication of interconnects. J.
Mater. Sci.-Mater. El. 2009, 20 (3), 217.
13. Moffat, T. P.; Josell, D., Superconformal electrodeposition for 3-dimensional
interconnects. Israel J. Chem. 2010, 50 (3), 312.
14. Moffat, T. P.; Wheeler, D.; Edelstein, M. D.; Josell, D., Superconformal film growth:
Mechanism and quantification. IBM J. Res. Dev. 2005, 49 (1), 19.
15. Schultz, Z. D.; Feng, Z. V.; Biggin, M. E.; Gewirth, A. A., Vibrational spectroscopic and
mass spectrometric studies of the interaction of bis(3-sulfopropyl)-disulfide with cu surfaces. J.
Electrochem. Soc. 2006, 153 (2), C97.

100
APPENDIX B: CARBON DIOXIDE ELECTROREDUCTION ON GOLD
As the end product of all combustion processes, CO2 is an abundant source of carbon. By
electrochemical reduction, it can be transformed into relevant - and lucrative - products such as
carbon monoxide, methanol and ethylene. These can be used as fuels or as feedstock materials
for pharmaceuticals and polymers1-6
. There are currently four problems impeding progress in
electrochemical CO2 reduction: (1) large overpotentials, (2) simultaneous production of
hydrogen along with CO2 reduction, (3) electrode poisoning with the concomitant decrease in
efficiency over time and (4) potentially a wide distribution of products.
The study of electrochemical CO2 reduction began with fundamental voltammatry
experiments using aqueous solutions on metals with high hydrogen overvoltages (e.g. Hg and
Zn) 7. These metals are able to reduce hydrogen at potentials much more negative than the
thermodynamic equilibrium potential and, thus, reduces the amount of hydrogen evolution.
Eyring proposed a mechanism for reduction at Hg electrodes based Tafel plots (Figure B.1)7.
The general understanding is that the reaction proceeds with two consecutive one electron
transfers. The first transfer creates a radical anion that pulls a proton from water and is then
Figure B.1. Proposed mechanism for reduction CO2 to formate.
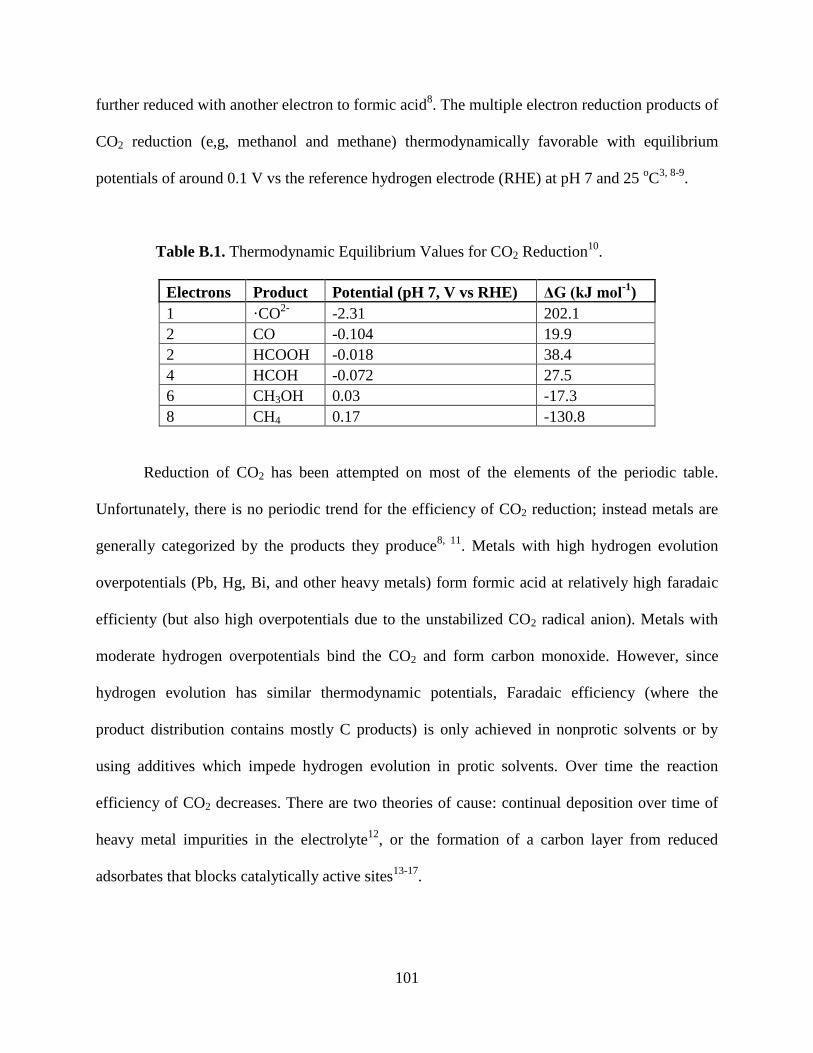
101
further reduced with another electron to formic acid8. The multiple electron reduction products of
CO2 reduction (e,g, methanol and methane) thermodynamically favorable with equilibrium
potentials of around 0.1 V vs the reference hydrogen electrode (RHE) at pH 7 and 25 oC
3, 8-9.
Table B.1. Thermodynamic Equilibrium Values for CO2 Reduction10
.
Electrons Product Potential (pH 7, V vs RHE) ΔG (kJ mol-1
)
1 ·CO2-
-2.31 202.1
2 CO -0.104 19.9
2 HCOOH -0.018 38.4
4 HCOH -0.072 27.5
6 CH3OH 0.03 -17.3
8 CH4 0.17 -130.8
Reduction of CO2 has been attempted on most of the elements of the periodic table.
Unfortunately, there is no periodic trend for the efficiency of CO2 reduction; instead metals are
generally categorized by the products they produce8, 11
. Metals with high hydrogen evolution
overpotentials (Pb, Hg, Bi, and other heavy metals) form formic acid at relatively high faradaic
efficienty (but also high overpotentials due to the unstabilized CO2 radical anion). Metals with
moderate hydrogen overpotentials bind the CO2 and form carbon monoxide. However, since
hydrogen evolution has similar thermodynamic potentials, Faradaic efficiency (where the
product distribution contains mostly C products) is only achieved in nonprotic solvents or by
using additives which impede hydrogen evolution in protic solvents. Over time the reaction
efficiency of CO2 decreases. There are two theories of cause: continual deposition over time of
heavy metal impurities in the electrolyte12
, or the formation of a carbon layer from reduced
adsorbates that blocks catalytically active sites13-17
.
102
Spectroscopic studies have been performed to further elucidate the reduction mechanism
by identifying surface intermediates. Infrared (IRAS) and Raman (SERS) studies confirm the
presence of adsorbed CO on Cu, Ag, Pt, Pd and Ni18-31
. Oda et al. found that, in CO2 saturated
solutions of 0.1 M KCl, peaks attributed to carbon monoxide appear at around -1.4 V vs the
standard hydrogen electrode (SHE) on Cu and -1.0 V on Ag. Since chloride adsorbs strongly to
these surfaces, the CO2 only displaces the M-Cl bonds at potentials negative enough to repel the
Cl- ions. Studies have also been performed on these metals in 0.1 M KHCO3 which is a standard
electrolyte for CO2 reduction. They also had characteristic CO stretches and CO32-
stretches were
found on Cu.
In this chapter, we performed SERS of electroreduction of CO2 in basic carbonate
solutions to further elucidate the mechanism of CO2 reduction on Au. Figure B.2 displays the
potential dependent SERS spectra of 0.1 M K2CO3 sparged with CO2. At open circuit potential
there is a prominent peak at 1590 cm-1
attributed to water bending and a carbonate symmetric
stretching mode. As the potential is stepped in the cathodic direction, a peak at 2080 cm-1
attributed to CO stretch appears at -800 mV vs Ag/AgCl. The water bending mode exhibits a
slight decrease in intensity with more negative polarization of the Au electrode. When the
potential scan is reversed to the anodic direction, the CO peak decreases in intensity and
disappears by 400 mV. To further investigate the potential dependent behavior of the CO peak,
Figure B.3 displays the integrated peak height of the CO mode was plotted versus potential and
overlayed on the Au electrochemistry in CO2 saturated carbonate buffer.
Figure B.4 displays the potential dependent behavior of a D2O solution of K2CO3 sparged
with CO2. At open circuit potential, there are two prominent peaks attributed to the electrolyte,
one at 1200 cm-1
assigned to the D2O bending mode and one at 1360 cm-1
assigned to CO32-
. As

103
the potential is swept in the cathodic direction, a peak at 2080 cm-1
assigned to the CO stretch at
-1000 mV. It remains as the potential is swept to -1200 mV. On the reverse sweep the CO peak
persists until 400 mV after which it disappears. Figure B.5 overlays the CO peak intensity with
the cyclic voltammogram of Au in CO2 saturated 0.1 K2CO3 in D2O. The disappearance of the
CO peak coincides with an anodic desorption event at 0 mV in the voltammogram.

104
Figure B.2. Potential dependent SERS spectra of aqueous solution of 0.1 M K2CO3 bubbled with
CO2. Spectra offset for clarity.
1000 1500 2000 2500
Inte
nsity (
cp
s)
Raman shift (cm-1)
ocp
400
-400
-800
-900
-1000
-1100
1000 1200 1400 1600 1800 2000 2200 2400
Inte
nsity (
cp
s)
Raman shift (cm-1)
-1100
-1000
-900
-800
-400
0
400

105
-1.5 -1.0 -0.5 0.0 0.5 1.0 1.5
-700
-350
0
350
-20
0
20
40
60
Curr
ent D
ensity (
mA
cm
-2)
Potential (V vs Ag/AgCl)
Peak H
eig
ht (c
ounts
per
second)
cathodic
anodic
CO peak height
Figure B.3. Cyclic voltammagram of Au electrode in aqueous solution of K2CO3 sparged with
CO2 overlayed with peak height versus potential of CO peak.

106
1000 1200 1400 1600 1800 2000 2200 2400
Inte
nsity (
cps)
Raman shift (cm-1)
ocp
400
0
-400
-800
-900
-1000
-1000
-1100
-1200
1000 1200 1400 1600 1800 2000 2200 2400
Inte
nsity (
cp
s)
Raman shift (cm-1)
-1200
-1100
-1000
-900
-800
-400
0
400
Figure B.4. Potential controlled Raman spectra of D2O solution of 0.1 M K2CO3 sparged with
CO2. Spectra offset for clarity.
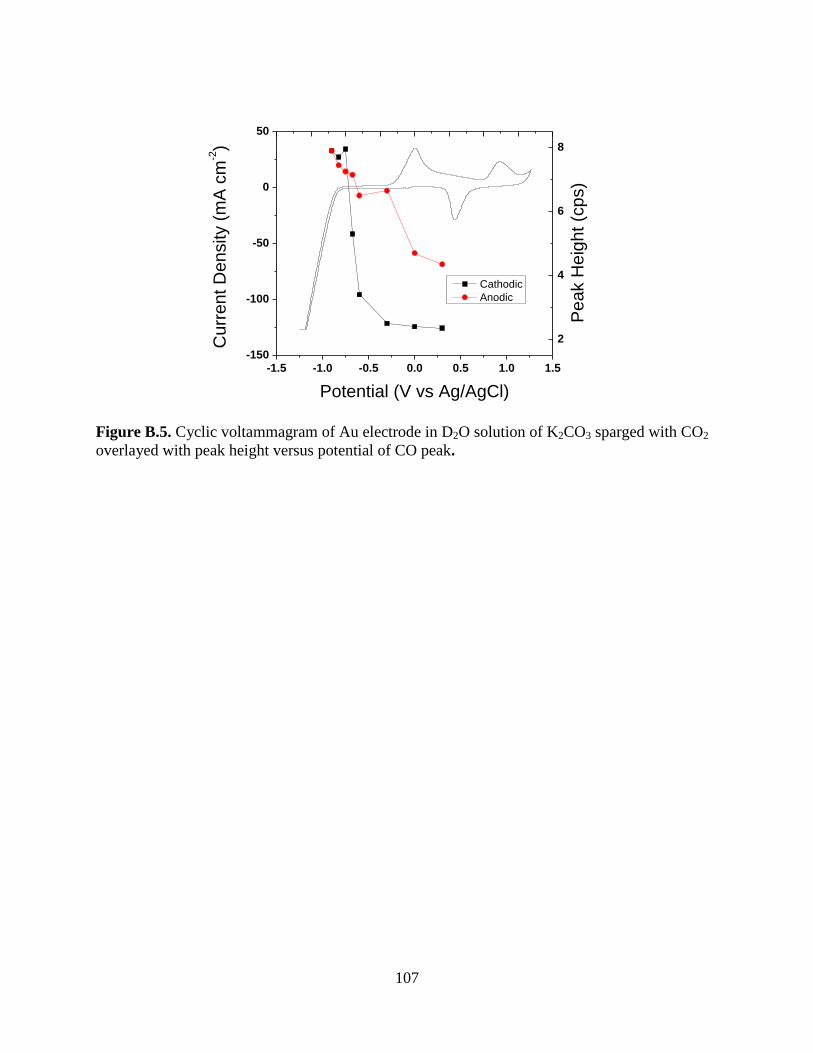
107
-1.5 -1.0 -0.5 0.0 0.5 1.0 1.5-150
-100
-50
0
50
2
4
6
8
Curr
ent D
ensity (
mA
cm
-2)
Potential (V vs Ag/AgCl)
Peak H
eig
ht (c
ps)
Cathodic
Anodic
Figure B.5. Cyclic voltammagram of Au electrode in D2O solution of K2CO3 sparged with CO2
overlayed with peak height versus potential of CO peak.
108
References
1. Aresta, M., Carbon dioxide utilization: Greening both the energy and chemical industry:
An overview. In Utilization of greenhouse gases, 852 ed.; Chang-jun Liu, R. G. M., Michele
Aresta, Ed. Oxford University Press: DC, 2003.
2. Chaplin, R. P. S.; Wragg, A. A., Effects of process conditions and electrode material on
reaction pathways for carbon dioxide electroreduction with particular reference to formate
formation. Journal of Applied Electrochemistry 2003, 33 (12), 1107.
3. DuBois, D. L., Carbon. Electrochemical reactions of carbon dioxide. Encycl.
Electrochem. 2006, 7a, 202.
4. Gattrell, M.; Gupta, N.; Co, A., A review of the aqueous electrochemical reduction of co2
to hydrocarbons at copper. Journal of Electroanalytical Chemistry 2006, 594 (1), 1.
5. Benson, E. E.; Kubiak, C. P.; Sathrum, A. J.; Smieja, J. M., Electrocatalytic and
homogeneous approaches to conversion of co2 to liquid fuels. Chemical Society Reviews 2009,
38 (1), 89.
6. Rakowski Dubois, M.; Dubois, D. L., Development of molecular electrocatalysts for co2
reduction and h2 production/oxidation. Accounts of Chemical Research 2009.
7. Teeter, T. E.; Rysselbergh, P. V., Reduction of carbon dioxide on mercury cathodes. The
Journal of Chemical Physics 1954, 22 (4), 759.
8. Hori, Y., Electrochemical co2 reduction on metal electrodes. Modern Aspects of
Electrochemistry 2008, 42, 89.
9. Bagotzky, V. S.; Osetrova, N. V., Electrochemical reduction of carbon-dioxide. Russ. J.
Electrochem. 1995, 31 (5), 409.
10. Keene, F. R., Thermodynamic, kinetic, and product considerations in carbon dioxide
reactivity. In Electrochemical and electrocatalytic reactions of carbon dioxide, Sullivan, B. P.;
Krist, K.; Guard, H. E., Eds. Elsevier: Amsterdam, 1993; pp 7.
11. Jitaru, M.; Lowy, D. A.; Toma, M.; Toma, B. C.; Oniciu, L., Electrochemical reduction
of carbon dioxide on flat metallic cathodes. Journal of Applied Electrochemistry 1997, 27 (8),
875.
12. Hori, Y.; Konishi, H.; Futamura, T.; Murata, A.; Koga, O.; Sakurai, H.; Oguma, K.,
"Deactivation of copper electrode" in electrochemical reduction of co2. Electrochimica Acta
2005, 50 (27), 5354.
13. Kyriacou, G.; Anagnostopoulos, A., Electrochemical reduction of co2 at cu+au
electrodes. Journal of Electroanalytical Chemistry 1992, 328 (1-2), 233.
14. Dewulf, D. W.; Jin, T.; Bard, A. J., Electrochemical and surface studies of carbon-
dioxide reduction to methane and ethylene at copper electrodes in aqueous-solutions. Journal of
the Electrochemical Society 1989, 136 (6), 1686.
15. Smith, B. D.; Irish, D. E.; Kedzierzawski, P.; Augustynski, J., A surface enhanced raman
scattering study of the intermediate and poisoning species formed during the electrochemical
reduction of co2 on copper. Journal of the Electrochemical Society 1997, 144 (12), 4288.
16. Jermann, B.; Augustynski, J., Long-term activation of the copper cathode in the course of
co2 reduction. Electrochimica Acta 1994, 39 (11-12), 1891.
17. Kedzierzawski, P.; Augustynski, J., Poisoning and activation of the gold cathode during
electroreduction of co2. Journal of the Electrochemical Society 1994, 141 (5), L58.

109
18. Rodes, A.; Pastor, E.; Iwasita, T., Structural effects on co2 reduction at pt single-crystal
electrodes. Part 1. The pt(110) surface. Journal of Electroanalytical Chemistry 1994, 369 (1-2),
183.
19. Nikolic, B. Z.; Huang, H.; Gervasio, D.; Lin, A.; Fierro, C.; Adzic, R. R.; Yeager, E. B.,
Electroreduction of carbon dioxide on platinum single crystal electrodes: Electrochemical and in
situ ftir studies. Journal of Electroanalytical Chemistry and Interfacial Electrochemistry 1990,
295 (1-2), 415.
20. Islam, M. S.; Kunimatsu, K., In-situ infrared spectroscopic studies of adsorbed
intermediates in electroreduction of carbon monoxide and carbon dioxide on copper in aqueous
potassium bicarbonate. Journal of Bangladesh Academy of Sciences 1989, 13 (2), 165.
21. Hori, Y.; Murata, A.; Tsukamoto, T.; Wakebe, H.; Koga, O.; Yamazaki, H., Adsoprtion
of carbon monoxide at a copper electrode accompanied by electron transfer observed by
voltammetry and ir spectroscopy. Electrochimica Acta 1994, 39 (17), 2495.
22. Oda, I.; Ogasawara, H.; Ito, M., Carbon monoxide adsorption on copper and silver
electrodes during carbon dioxide electroreduction studied by infrared reflection absorption
spectroscopy and surface-enhanced raman spectroscopy. Langmuir 1996, 12 (4), 1094.
23. Hori, Y.; Koga, O.; Yamazaki, H.; Matsuo, T., Infrared-spectroscopy of adsorbed co and
intermediate species in electrochemical reduction of co2 to hydrocarbons on a cu electrode.
Electrochimica Acta 1995, 40 (16), 2617.
24. Ichinohe, Y.; Wadayama, T.; Hatta, A., Electrochemical reduction of co2 on silver as
probed by surface-enhanced raman-scattering. Journal of Raman Spectroscopy 1995, 26 (5), 335.
25. Hernandez R, R. M.; Kalaji, M., Use of isotopically labeled compounds for the in situ ir
study of the electroreduction of co2 in aqueous hydrogen carbonate and buffered phosphate
solutions. J. Chem. Soc., Faraday Trans. 1996, 92 (20), 3957.
26. Wasmus, S.; Cattaneo, E.; Vielstich, W., Reduction of carbon dioxide to methane and
ethene--an on-line ms study with rotating electrodes. Electrochimica Acta 1990, 35 (4), 771.
27. Taguchi, S.; Aramata, A.; Enyo, M., Reduced co2 on polycrystalline pd and pt electrodes
in neutral solution - electrochemical and in-situ fourier-transform ir studies. Journal of
Electroanalytical Chemistry 1994, 372 (1-2), 161.
28. Terunuma, Y.; Saitoh, A.; Momose, Y., Relationship between hydrocarbon production in
the electrochemical reduction of co2 and the characteristics of the cu electrode. Journal of
Electroanalytical Chemistry 1997, 434 (1-2), 69.
29. Chandrasekaran, K.; Bockris, L. O. M., In-situ spectroscopic investigation of adsorbed
intermediate radicals in electrochemical reactions: Co2- on platinum. Surface Science 1987, 185
(3), 495.
30. Ichinohe, Y.; Wadayama, T.; Hatta, A., Electrochemical reduction of co2 on silver as
probed by surface-enhanced raman scattering. Journal of Raman Spectroscopy 1995, 26 (5), 335.
31. Batista, E. A.; Temperini, M. L. A., Spectroscopic evidences of the presence of
hydrogenated species on the surface of copper during co2 electroreduction at low cathodic
potentials. Journal of Electroanalytical Chemistry 2009, 629 (1-2), 158.