species differences in the in vitro metabolism of...
TRANSCRIPT
DMD # 10058
1
Species differences in the in vitro metabolism of deltamethrin and esfenvalerate:
Differential oxidative and hydrolytic metabolism by humans and rats.
Stephen J. Godin, Edward J. Scollon, Michael F. Hughes, Philip M. Potter,
Michael J. DeVito, and Matthew K. Ross
United States Environmental Protection Agency, ORD, NHEERL, ETD, PKB.
RTP, NC 27711 (MDV, EJS, MFH)
Curriculum in Toxicology, University of North Carolina at Chapel Hill, Chapel
Hill, NC 27599 (SJG)
Department of Molecular Pharmacology, St. Jude Children’s Research Hospital,
N. Lauderdale, Memphis, TN 38105 (PMP)
Center for Environmental Heath Sciences, College of Veterinary Medicine,
Mississippi State University, Mississippi State, MS 39762 (MKR)
DMD Fast Forward. Published on July 19, 2006 as doi:10.1124/dmd.106.010058
Copyright 2006 by the American Society for Pharmacology and Experimental Therapeutics.
This article has not been copyedited and formatted. The final version may differ from this version.DMD Fast Forward. Published on July 19, 2006 as DOI: 10.1124/dmd.106.010058
at ASPE
T Journals on M
arch 21, 2019dm
d.aspetjournals.orgD
ownloaded from
DMD # 10058
2
Species difference in the in vitro metabolism of deltamethrin Corresponding author; Michael J DeVito US EPA, MD B143-01 Research Triangle Park, NC, 27711 Phone; (919) 541-0061 Fax; (919) 541-4284 Email; [email protected] # of Text Pages – 31 # of Tables – 4 # of Figures – 5 # of References – 36 Abstract # of words – 201 Introduction # of words – 739 Discussion # of words – 1430 Abbreviations CLINT, Intrinsic Hepatic Clearance TEPP, tetraethylpyrophosphate hCE-1, Human carboxylesterase 1 hCE-2, Human carboxylesterase 2 cis-per, cis-permethrin; esfen, esfenvalerate; delta, deltamethrin; biores, bioresmethrin; trans-per, trans-permethrin.
This article has not been copyedited and formatted. The final version may differ from this version.DMD Fast Forward. Published on July 19, 2006 as DOI: 10.1124/dmd.106.010058
at ASPE
T Journals on M
arch 21, 2019dm
d.aspetjournals.orgD
ownloaded from
DMD # 10058
3
Abstract Pyrethroids are neurotoxic pesticides whose pharmacokinetic behavio r plays a role in
their potency. This study examined the elimination of esfenvalerate and deltamethrin
from rat and human liver microsomes. A parent depletion approach in the presence and
absence of NADPH was utilized to assess species differences in biotransformation
pathways, rates of elimination, and intrinsic hepatic clearance. Esfenvalerate was
eliminated primarily via NADPH-dependent oxidative metabolism in both rat and human
liver microsomes. The intrinsic hepatic clearance (CLINT) of esfenvalerate was estimated
to be three- fold greater in rodents than in humans on a per kg body weight basis.
Deltamethrin was also eliminated primarily via NADPH-dependent oxidative metabolism
in rat liver microsomes; however, in human liver microsomes, deltamethrin was
eliminated almost entirely via NADPH-independent hydrolytic metabolism. The CLINT
for deltamethrin was estimated to be two-fold more rapid in humans than in rats on a per
kg body weight basis. Metabolism by purified rat and human carboxylesterases (CEs)
were utilized to further examine the species in hydrolysis of deltamethrin and
esfenvalerate. Results of CE metabolism revealed that human carboxylesterase 1 (hCE-
1) was markedly more active towards deltamethrin than the class 1 rat CEs Hydrolase A
and B and the class 2 human CE (hCE-2); however, Hydrolase A metabolized
esfenvalerate 2-fold faster than hCE-1, while Hydrolase B and hCE-1 hydrolyzed
esfenvalerate at equal rates. These studies demonstrate a significant species difference in
the in vitro pathways of biotransformation of deltamethrin in rat and human liver
microsomes, which is due in part to differences in the intrinsic activities of rat and human
carboxylestersases.
This article has not been copyedited and formatted. The final version may differ from this version.DMD Fast Forward. Published on July 19, 2006 as DOI: 10.1124/dmd.106.010058
at ASPE
T Journals on M
arch 21, 2019dm
d.aspetjournals.orgD
ownloaded from
DMD # 10058
4
Introduction
Pyrethroids are synthetic analogues of the natural pyrethrins, the insecticidal
components of extracts from the pyrethrum flower (Chrysanthemum cinerariaefolium).
The pyrethroids modulate nerve axon sodium channels, resulting in neurotoxic effects
(Narahashi 1982; Smith et al., 1997). The adverse effects produced by pyrethroids are
due to the parent compounds in that no evidence currently exists that pyrethroid
metabolites alter sodium channels and are neurotoxic. For the limited number of
pyrethroids evaluated, the brain concentrations of pesticide appear to correlate with acute
neurotoxicity (Rickard and Brodie, 1985; White et al., 1976). Pharmacokinetic
parameters, particularly clearance of the parent chemical from the blood, will influence
the effective concentration in the brain and therefore can have a significant influence on
their toxic potency.
The metabolic pathway and rate of phase I biotransformation of pyrethroids is
dependent upon their chemical structure and stereochemistry (Shono et al., 1979;
Soderlund and Casida, 1977; Ueda et al., 1975). In laboratory animals, different
metabolic pathways preferentially transform cis- and trans- isomers of pyrethroids; trans-
isomers are typically transformed by the more rapid hydrolytic pathways, while cis-
isomers are preferentially transformed by slower oxidative pathways (Shono et al., 1979;
Soderlund and Casida, 1977). This difference correlates with the greater toxicity of
several cis- isomers of individual pyrethroids (Soderlund et al., 2002). For example,
cismethrin is about 50 times more acutely toxic in mice than its trans- isomer,
bioresmethrin, when based on administered dose. This is due in part to the approximate
This article has not been copyedited and formatted. The final version may differ from this version.DMD Fast Forward. Published on July 19, 2006 as DOI: 10.1124/dmd.106.010058
at ASPE
T Journals on M
arch 21, 2019dm
d.aspetjournals.orgD
ownloaded from
DMD # 10058
5
10-fold greater rate of metabolism of bioresmethrin than cismethrin (Abernathy and
Casida, 1973).
Species differences in the contributions of hydrolytic and oxidative pathways to
the metabolism of pyrethroids exist between mice and rats (Shono et al., 1979; Soderlund
and Casida, 1977). For example, trans-permethrin is metabolized predominately by
hydrolytic metabolism in rats. In contrast, both oxidative and hydrolytic pathways
contribute to trans-permethrin metabolism in mice (Shono et al., 1979; Soderlund and
Casida, 1977). For cis-permethrin, oxidative metabolism is 3- and 8-fold greater than
hydrolysis in rats and mice, respectively (Shono et al., 1979). While there are numerous
studies that have examined laboratory animal metabolism of pyrethroids, there are
relatively few examples of human metabolism of pyrethroids (Choi et al., 2002; Nishi et
al., 2006; Ross et al., 2006). In these studies, the extensive hydrolysis of trans-
permethrin in rat and mouse liver microsomes (Shono et al., 1979; Soderlund and Casida,
1977) and by mouse carboxylesterases (Stok et al., 2004) was also evident in human liver
microsomes (Choi et al., 2002; Ross et al., 2006). For cis-permethrin however, Choi et
al. (2002) reported that there was no detectable oxidative or hydrolytic metabolism in
human liver fractions (Choi et al, 2002). Ross et al. (2006) observed limited hydrolysis
of cis-permethrin in human liver microsomes as compared to rat liver microsomes. Ross
et al., (2006) and Nishi et al. (2006) also reported limited hydrolysis of cis-permethrin by
purified human carboxylesterases. These results with cis-permethrin show that species
differences in pyrethroid metabolism may exist between laboratory animals and humans.
Differences in pathways or rates of metabolism of pyrethroids between species could lead
This article has not been copyedited and formatted. The final version may differ from this version.DMD Fast Forward. Published on July 19, 2006 as DOI: 10.1124/dmd.106.010058
at ASPE
T Journals on M
arch 21, 2019dm
d.aspetjournals.orgD
ownloaded from

DMD # 10058
6
to altered systemic bioavailability, exposure dose relationships, and toxic potency for a
pyrethroid.
The present study examines the potential for species differences in the phase I
biotransformation of two pyrethroids, deltamethrin and esfenvalerate (Fig 1). Rat and
human liver microsomes were used to compare the contribution of oxidative and
hydrolytic pathways of metabolism between species. These two pathways are the
primary known mechanisms of pyrethroid detoxification; no evidence exists that
conjugative or reductive mechanisms of parent pyrethroid are involved. In laboratory
animals there are numerous metabolites (Roberts and Hutson 1999) of deltamethrin and
esfenvalerate likely produced by a number of enzymes including multiple cytochrome
P450’s (Anand et al. 2006) (Dayal et al. 2003) and esterases (Ross et al. 2006; Nishi et al.
2006). Therefore, liver microsomes represent a simple method of comparing the phase I
detoxification step in pyrethroid metabolism between species. Since phase I
biotransformation of a pyrethroid is the detoxification step, it allows the use of the parent
depletion approach to examine hepatic elimination and estimate intrinsic clearance
(Obach 1999). For the purposes of this manuscript, the term elimination is synonymous
with metabolism or biotransformation. Based on results obtained with liver microsomes,
purified enzyme preparations of rat and human carboxylesterases were also utilized in
this research to better understand observed differences in rat and human metabolism of
these two pyrethroids.
This article has not been copyedited and formatted. The final version may differ from this version.DMD Fast Forward. Published on July 19, 2006 as DOI: 10.1124/dmd.106.010058
at ASPE
T Journals on M
arch 21, 2019dm
d.aspetjournals.orgD
ownloaded from

DMD # 10058
7
Materials and Methods Chemicals
Deltamethrin (98.9% purity) ((S)-alpha-cyano-3-phenoxybenzyl (1R)-cis-3-(2,2-
dibromovinyl)-2,2-dimethylcyclopropane carboxylate) was a gift from Bayer Crop
Sciences (Research Triangle Park, NC USA). Esfenvalerate (98.6% purity) (cyano-3-
phenoxybenzyl (αS)-2-(4-chlorophenyl)-3-methylbutyrate) was a gift from Dupont
(Johnston, IA USA). These chemicals were used in the microsomal elimination studies.
Bifenthrin and tetraethylpyrophosphate (TEPP) were obtained from ChemService Inc
(West Chester, PA). Deltamethrin (> 98%) and esfenvalerate (>98%) used for the in
vitro carboxylesterase kinetics studies were obtained from ChemService Inc (West
Chester, PA). LC/MS analysis of pyrethroids from the different sources did not reveal
any differences in their chemical composition. Chromasolv® acetonitrile and methanol
for LC/MS applications were from Riedel-de Haën (Seelze, Germany). Ammonium
formate, sucrose, EDTA, KCl, NaHepes, glycerol, dithiothreitol (DTT), Trizma-base, β-
nicotinamide adenine dinucleotide phosphate reduced form (NADPH), and 3-
phenoxybenza ldehyde were purchased from Sigma-Aldrich (St. Louis, MO USA).
Unless otherwise specified chemicals were of the highest grade commercially available.
Animals
All animal procedures were approved by the USEPA National Health and
Environmental Effects Research Laboratory Institutional Animal Care and Use
Committee. Male Long Evans rats (70 days old) were obtained from Charles River
This article has not been copyedited and formatted. The final version may differ from this version.DMD Fast Forward. Published on July 19, 2006 as DOI: 10.1124/dmd.106.010058
at ASPE
T Journals on M
arch 21, 2019dm
d.aspetjournals.orgD
ownloaded from

DMD # 10058
8
Laboratory (Raleigh, NC USA). Animals were allowed to acclimate for a minimum of
four days in an Association for Assessment and Accreditation of Laboratory Animal Care
approved animal facility prior to their use. Two animals were housed per plastic cage (45
cm x 24 cm x 20 cm) with heat-treated pine shavings bedding. Animals were maintained
at 21-±?2°C, 50 ± 10% humidity and a photoperiod of 12L:12D (0600-1800 hr). Feed
(Purina Rodent Chow 5001, Barnes Supply Co., Durham, NC USA) and tap water were
provided ad libitum.
Rat liver microsomal preparation
Animals were anesthetized with CO2 and sacrificed via cardiac puncture. Livers
were removed for microsomal preparation according to the method described by DeVito
et al (1997). Three separate pools of rat liver microsomes were prepared. Each pool was
prepared from the livers of two rats. From each pool of microsomes 1.0 mL aliquots
were flash frozen in liquid nitrogen and stored at -80°C until use. Microsomal protein
(MSP) content was quantified using the Bio-Rad Bradford protein assay (Bio-Rad,
Hercules, CA USA) standardized with bovine serum albumin.
Human microsomes
Pooled human liver microsomes were purchased from CellzDirect (Phoenix, AZ
USA) (Lot# HMMC-PL020), Cedra (Austin, TX USA) (Lot#821-1), and Xenotech
(Lenexa, KS USA) (Lot#0310241). These microsomes were stored at -80°C until use.
Determination of Km apparent (Kmapp) in rat and human liver microsomes
This article has not been copyedited and formatted. The final version may differ from this version.DMD Fast Forward. Published on July 19, 2006 as DOI: 10.1124/dmd.106.010058
at ASPE
T Journals on M
arch 21, 2019dm
d.aspetjournals.orgD
ownloaded from
DMD # 10058
9
To ensure that the elimination assays (see below) were performed at
concentrations <<Kmapp, estimates of the Kmapp for deltamethrin and esfenvalerate
elimination in rat and human liver microsomes were determined using a single
microsomal sample from each species. The reaction volume was 1.5 mL and consisted of
0.1 M Tris (pH 7.4), 1.0 mg MSP/mL and 1.0 mg NADPH /mL. Following
preincubation for 10 min at 37 °C, the reaction was initiated by the addition of 60 µL of
working stock solutions of deltamethrin or esfenvalerate dissolved in 50% acetonitrile
solution to obtain final assay concentrations of 1, 2, 5, 7, 10, 20, and 50 µM pyrethroid.
Pilot studies demonstrated that this percentage of acetonitrile did not to interfere with
oxidative or hydrolytic metabolism in these assays (data not shown). Assays were carried
out in duplicate in a shaking water bath and 250 µL aliquots of the reaction mixture were
removed from the reaction vial at 0, 2.5, 5.0, 7.5 and 10.0 min. These time points were
previously found to be in a linear range of elimination of deltamethrin and esfenvalerate
(data not shown). Aliquots were immediately placed in 1.25-ml cold 50% ACN
containing 0.1 mg/ml bifenthrin (internal surrogate of recovery) to stop the reaction.
Samples were vortexed for 5 min and centrifuged at approximately 1,500 x g for 10 min.
The supernatant was removed and placed in autosampler vials for LC/MS/MS analyses
(see below). Non enzymatic controls were performed in the Tris buffer in the absence of
microsomal protein to ensure all elimination of chemical was enzymatic. Concentration
of substrate was monitored over the time course and converted to moles of substrate
remaining. Substrate remaining was converted to product formed and plotted vs. time to
produce a reaction velocity. Kmapp values in rat and human liver microsomes were
estimated for deltamethrin with Lineweaver-Burk linear regression analysis from
This article has not been copyedited and formatted. The final version may differ from this version.DMD Fast Forward. Published on July 19, 2006 as DOI: 10.1124/dmd.106.010058
at ASPE
T Journals on M
arch 21, 2019dm
d.aspetjournals.orgD
ownloaded from
DMD # 10058
10
GraphPad Prism (v 4.0, GraphPad Software, San Diego California, USA). The 50 uM
reactions appear to be approaching maximal elimination rates. However, because a clear
maximum was not defined, a Lineweaver-Burk analysis was utilized for deltamethrin
analysis. The Kmapp in rat and human microsomes for esfenvalerate were estimated with
Graph Pad Prism software using Michaelis-Menten nonlinear regression analysis.
Rat and human microsomal elimination assays
Microsomal elimination assays with deltamethrin and esfenvalerate were carried
out using the parent depletion approach described above. Briefly, 1uM pyrethroid was
found from kinetic studies to be below the Kmapp for both deltamethrin and esfenvalerate
elimination from both rat and human liver microsomes. 1uM pyrethroid was incubated
from 0-10min in 1.5mL 0.1M Tris containing 1.0mg MSP/mL, and 1.0 mg NADPH/mL.
NADPH independent assays were carried out from 0-30min to insure sufficient
elimination to calculate elimination rates. Assays were carried out in duplicate in a
shaking water bath at 37°C and 250µl aliquots were removed at each time point for
LC/MS/MS analysis. Assays were repeated in the presence of 200uM TEPP to inhibit
esterase activity (Soderlund and Casida, 1977). A volume of 10µl of 30mM TEPP in
methanol was added to the assay prior to incubating for 10min at 37°C before the
addition of pyrethroid.
Identification, recovery, and quantification of deltamethrin and esfenvalerate.
An Agilent (Palo Alto, CA USA) 1100 series LC/MSD VL ion trap mass
spectrometer and HP Chemstation software were used for identification and
This article has not been copyedited and formatted. The final version may differ from this version.DMD Fast Forward. Published on July 19, 2006 as DOI: 10.1124/dmd.106.010058
at ASPE
T Journals on M
arch 21, 2019dm
d.aspetjournals.orgD
ownloaded from

DMD # 10058
11
quantification of pyrethroid parent chemicals. Isocratic elution of chemicals was
accomplished with an Agilent Zorbax Eclipse XDB – C18 column (4.6 x 100 mm, 3.5
µm pore size) and XDB C-18 guard column with a mobile phase of 90% methanol and
10% 5 mM ammonium formate at a flow rate of 0.5 ml/min. Deltamethrin identification
and quantitation was accomplished by fragmentation of the ammonium adducted ion
[M+NH4]+ (m/z 523) to produce the parent ion [M+H]+ (m/z 506). Esfenvalerate
identification and quantitation was accomplished via the ammonium adducted ion
[M+NH4]+ (m/z 437). Bifenthr in was identified and quantified using the ammonium
adducted ion [M+NH4]+ (m/z 440). Recovery of deltamethrin and esfenvalerate from
microsomal assays was assessed at all concentrations utilized in standard curves (0.1, 0.5,
1, 2, 5, 7, 10, 20, and 50µM) and compared to an equivalent concentration in the absence
of microsomal protein. Recovery was found to be greater than 95% at all concentrations.
Precision of points on standard curves were calculated to be within 5% of standards in
buffer. Quantification was accomplished using the peak area ratios of the analyte and
internal surrogate. Standard curves were developed from standards in the reaction buffer
containing microsomal protein. Standard curves were linear over the range of
concentrations used in the experiments with r2 values of at least 0.99. Accuracy limits of
20% were utilized for inclus ion in standard curves by the Agilent Chemstation software.
Calculation of elimination rates, elimination rate constants, and intrinsic hepatic
clearance rates
Elimination rate, elimination rate constants and estimates of intrinsic hepatic
clearance of deltamethrin and esfenvalerate were determined from the elimination of
This article has not been copyedited and formatted. The final version may differ from this version.DMD Fast Forward. Published on July 19, 2006 as DOI: 10.1124/dmd.106.010058
at ASPE
T Journals on M
arch 21, 2019dm
d.aspetjournals.orgD
ownloaded from

DMD # 10058
12
parent chemical from the microsomal assay at a single concentration (1 µM) over a time
course of 0-10min. The concentration of the parent chemical was measured at each time
point and converted to moles of substrate remaining. Calculation of elimination rates was
accomplished by linear regression of substrate remaining vs. time plots. First order
elimination rate constants (k) were determined from the plot of the ln of the % remaining
vs. time where the slope of the linear regression line = k (min-1). The 1µM concentration
was found to be below the Kmapp for each chemical in both rat and human liver
microsomes (Table 1). At substrate concentrations significantly below Km the clearance
of a chemical is constant (Iwatsubo et al., 1997), and can be calculated using the first
order elimination rate constant, k (Obach, 1999). Intrinsic clearance (CLINT), on a per kg
body weight basis was estimated based on the equation described below (Obach et al.,
1997; Obach, 1999).
CLint = k(min-1) * ml incubation/mg microsomes * mg microsomes/g liver * g liver/kg
body weight.
It was assumed that humans and rats have 40 and 25.7gm of liver per Kg body weight,
respectively (Davies and Morris, 1993). Microsomal content of the livers were assumed
to be 52.5 and 45 mg microsomal protein per gm of liver for humans (Iwatsubo et al.,
1997) and rats (Houston, 1994), respectively.
Human and rat carboxylesterases
This article has not been copyedited and formatted. The final version may differ from this version.DMD Fast Forward. Published on July 19, 2006 as DOI: 10.1124/dmd.106.010058
at ASPE
T Journals on M
arch 21, 2019dm
d.aspetjournals.orgD
ownloaded from

DMD # 10058
13
The recombinant carboxylesterases, human CE-1 (hCE-1) and CE-2 (hCE-2),
were expressed in a Spodoptera frugiperda-derived cell line using baculovirus and
purified to homogeneity as previously described (Morton and Potter, 2000). Rat CEs
termed Hydrolases A and B (Morgan et al., 1994), were purified to homogeneity from
male Sprague-Dawley rat liver by the procedure of Sanghani et al. (2002) with slight
modification. This entailed removal of an 80-kDa impurity present in Hydrolase A by
anion exchange chromatography. The purified rat CEs were digested with trypsin and
analyzed by MALDI-TOF/TOF mass spectrometery. The proteins were shown to be
identical to rat Hydrolase A (also termed ES-10) and Hydrolase B (termed RL1) (Morgan
et al., 1994).
Hydrolysis reactions catalyzed by CEs
Hydrolysis of deltamethrin and esfenvalerate by rat and human CEs were
performed at a single saturating concentration of pyrethroid (50µM) in order to compare
the hydrolysis rates of each enzyme (specific activity). Kinetic experiments with
deltamethrin were also performed to obtain kcat , Km and kcat /Km parameters for each CE;
these parameters were not obtained for esfenvalerate in this study. Hydrolysis of
pyrethroids by rat and human CEs was performed in reaction volumes of 100 µL as
described previously (Ross et al., 2006). In the kinetic experiments, varying amounts of
deltamethrin (5–100 µM, final concentration) were pre- incubated for 5 min in 50 mM
Tris-HCl buffer (pH 7.4) at 37 °C. The hydrolytic reactions were initiated by addition of
the CE enzyme (2.5 µg per 100µL reaction) and the reaction was allowed to proceed for
This article has not been copyedited and formatted. The final version may differ from this version.DMD Fast Forward. Published on July 19, 2006 as DOI: 10.1124/dmd.106.010058
at ASPE
T Journals on M
arch 21, 2019dm
d.aspetjournals.orgD
ownloaded from
DMD # 10058
14
30 min at 37 °C. The reactions were quenched by the addition of an equal volume of ice-
cold acetonitrile. The samples were centrifuged for 5 min at 13,200 x g (4 °C) and an
aliquot was analyzed by HPLC to quantify the hydrolysis products. Non-enzymatic
reactions were also performed (i.e., no CE enzyme was added to the buffer/pyrethroid
mixture) and found to have negligible rates (data not shown). Specific activity reactions
of each CE with deltamethrin and esfenvalerate were performed in the same manner as
above except that a single pyrethroid concentration of 50 µM was used. Substrate
concentration-velocity reactions and specific activity reaction were performed by
repetitive assays (N=3 independent experiments). The pyretrhoids were added to reaction
mixtures from stock solution prepared with acetonitrile and the organic solvent content in
the reactions were kept <1% v/v.
Quantitation of CE-catalyzed hydrolytic products by HPLC analysis
Authentic standards are available for the hydrolysis products of deltamethrin and
esfenvalerate. Furthermore, in contrast to the extensive number of hydroxylated
pyrethroid metabolites produced by cytochrome P450 metabolism, there are only two
hydrolysis products, the acid and alcohol metabolites. Thus, we have detected and
quantified the products of the hydrolysis reactions by HPLC analysis. HPLC-UV
analysis of pyrethroid hydrolytic products was performed on a Surveyor LC system
(Thermo Electron, San Jose, CA) using a reversed-phase HPLC column (2.1 mm x 100
mm, C18, Thermo Electron). The mobile phases used were solvent A (1:1 v/v, water:
acetonitrile containing 0.1% v/v acetic acid) and solvent B (100% acetonitrile containing
0.1% v/v acetic acid). The analytes were eluted with the following linear gradient
This article has not been copyedited and formatted. The final version may differ from this version.DMD Fast Forward. Published on July 19, 2006 as DOI: 10.1124/dmd.106.010058
at ASPE
T Journals on M
arch 21, 2019dm
d.aspetjournals.orgD
ownloaded from

DMD # 10058
15
program: 0 min (100% A, 0% B), 6 min (100% A, 0% B), 20 min (50% A, 50% B), 25
min (50% A, 50% B), and 30 min (100% A, 0% B), at a flow rate of 0.2 ml/min. Products
were detected at 230 nm. Calibration standards of the hydrolysis products were routinely
run along with the samples. For esfenvalerate and deltamethrin, hydrolysis rates were
based on the production of 3-phenoxybenzaldehyde, which is spontaneously formed from
the cyanohydrin (Wheelock et al., 2003).
Kinetic analysis and statistics
Non-linear regression of substrate concentration versus reaction velocity curves
were analyzed using SigmaPlot v. 8.02 software (Systat Software, Inc., Point Richmond,
CA) by fitting experimental data to the Michaelis-Menten equation. The kinetic
parameters reported for the human and rat CE’s are the mean (± SD) of three independent
kinetic assays. The specific activity data are reported as the mean (± SD) of three
replicates.
This article has not been copyedited and formatted. The final version may differ from this version.DMD Fast Forward. Published on July 19, 2006 as DOI: 10.1124/dmd.106.010058
at ASPE
T Journals on M
arch 21, 2019dm
d.aspetjournals.orgD
ownloaded from

DMD # 10058
16
Results Elimination of deltamethrin and esfenvalerate from rat liver microsomes
Both oxidative and hydrolytic pathways mediate the biotransformation of
pyrethroids by hepatic microsomes. Initial studies indicate that the Kmapp for deltamethrin
and esfenvalerate in rat and human liver microsomal incubations ranged between 21 and
75 µM (Table 1). Thus, substrate concentrations of 1µM were used in the elimination
assays in order to estimate first order rate constants (Obach et al., 1999). Elimination of
deltamethrin and esfenvalerate from rat liver microsomes occurred predominantly via
NADPH-dependent metabolic pathways (Fig. 2). The rate of NADPH-independent
elimination of deltamethrin was only 20% of the total elimination rate in the presence of
NADPH (Table 2). The addition of the esterase inhibitor TEPP completely inhibited the
NADPH-independent elimination of deltamethrin (Table 2). TEPP also inhibited
elimination of deltamethrin in the presence of NADPH by 20%, which is consistent with
the role of esterases in deltamethrin elimination. The rate of NADPH-independent
elimination of esfenvalerate was 11% the total elimination (Table 2), however,
esfenvalerate elimination in the presence of NADPH was decreased by nearly 50%
following addition of TEPP. These results are inconsistent with TEPP inhibiting only
esterase metabolism. TEPP is an organophosphate pesticide that is also metabolized by
cytochrome P450’s (Kulkarmi and Hodgson 1984). Thus, competitive inhibition of
cytochrome P450 metabolism of esfenvalerate by TEPP may be occurring in rat liver
microsomes. In addition, this did not occur with deltamethrin, indicating differences in
the cytochrome P450’s metabolizing deltamethrin and esfenvalerate in rat liver
This article has not been copyedited and formatted. The final version may differ from this version.DMD Fast Forward. Published on July 19, 2006 as DOI: 10.1124/dmd.106.010058
at ASPE
T Journals on M
arch 21, 2019dm
d.aspetjournals.orgD
ownloaded from
DMD # 10058
17
microsomes. Esfenvalerate metabolism was completely inhibited by TEPP in the absence
of NADPH (Table 1).
Elimination of deltamethrin and esfenvalerate from human liver microsomes
The elimination of deltamethrin from human liver microsomes occurs almost
entirely by NADPH-independent metabolic pathways (Fig. 3). The rate of elimination of
deltamethrin from human liver microsomes was similar in the presence and absence of
NADPH. The addition of TEPP into the reaction mixture decreased the total elimination
rate by nearly 90% (Table 2). The elimination of esfenvalerate from human liver
microsomes occurred predominantly via NADPH-dependent metabolic pathways (Fig. 3).
The NADPH-independent elimination rate of esfenvalerate was 12% of the elimination
rate in the presence of NADPH (Table 2). In contrast to rat microsomes, TEPP decreased
elimination of esfenvalerate in the presence of NADPH by only 10%, consistent with the
role of esterases in the elimination of esfenvalerate (Table 2). This may indicate that
there are differences in the enzymes metabolizing esfenvalerate or TEPP between
species. There was no detectable elimination of esfenvalerate following the addition of
TEPP to the reaction mixture in the absence of NADPH.
Rat and human intrinsic hepatic clearance estimates for deltamethrin and
esfenvalerate
Intrinsic hepatic clearance (Clint) values of deltamethrin and esfenvalerate for rats
and humans were scaled to a per kg body weight basis for purposes of comparison. The
scaled estimate for deltamethrin Clint in humans was approximately 2-fold more rapid
This article has not been copyedited and formatted. The final version may differ from this version.DMD Fast Forward. Published on July 19, 2006 as DOI: 10.1124/dmd.106.010058
at ASPE
T Journals on M
arch 21, 2019dm
d.aspetjournals.orgD
ownloaded from

DMD # 10058
18
than in rats (Table 1). In contrast, the scaled Clint for esfenvalerate was approximately 3-
fold more rapid in rats than in humans.
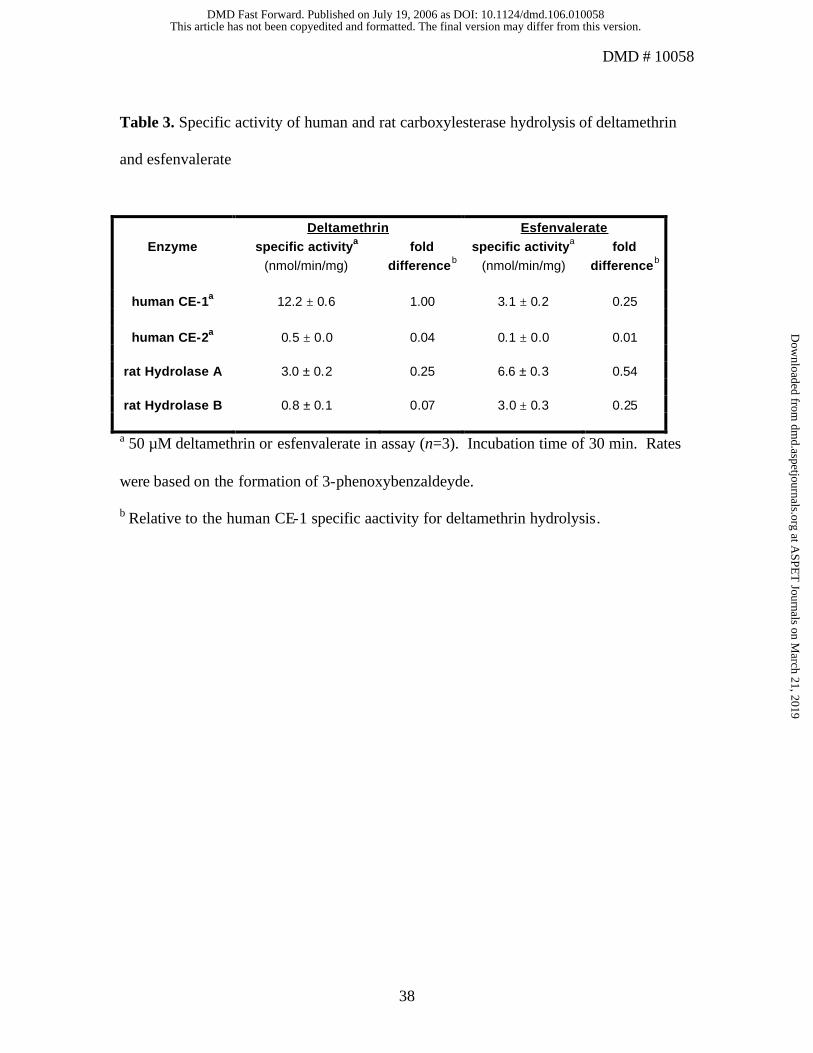
Hydrolysis of deltamethrin and esfenvalerate by purified human and rat
carboxylesterases
The rates of hydrolysis of deltamethrin and esfenvalerate were examined by two
purified human CEs (hCE-1 and hCE-2) and two purified rat CEs (Hydrolases A and B).
The most effective CE for deltamethrin hydrolysis was hCE-1, which was 25-, 4-, and
16-fold more active than hCE-2, Hydrolase A, and Hydrolase B, respectively (Table 3).
Consistent with the differential rates of hydrolysis of deltamethrin and esfenvalerate by
human liver microsomes described above, the rates of deltamethrin hydrolysis by hCE-1
and hCE-2 were markedly faster than those for esfenvalerate (4- and 5-fold, respectively;
Table 3). Rat Hydrolase A was the most effective CE catalyst of esfenvalerate
hydrolysis, with 2-fold more activity than either rat Hydrolase B or hCE-1, and 73-fold
more activity than hCE-2 (Table 3).
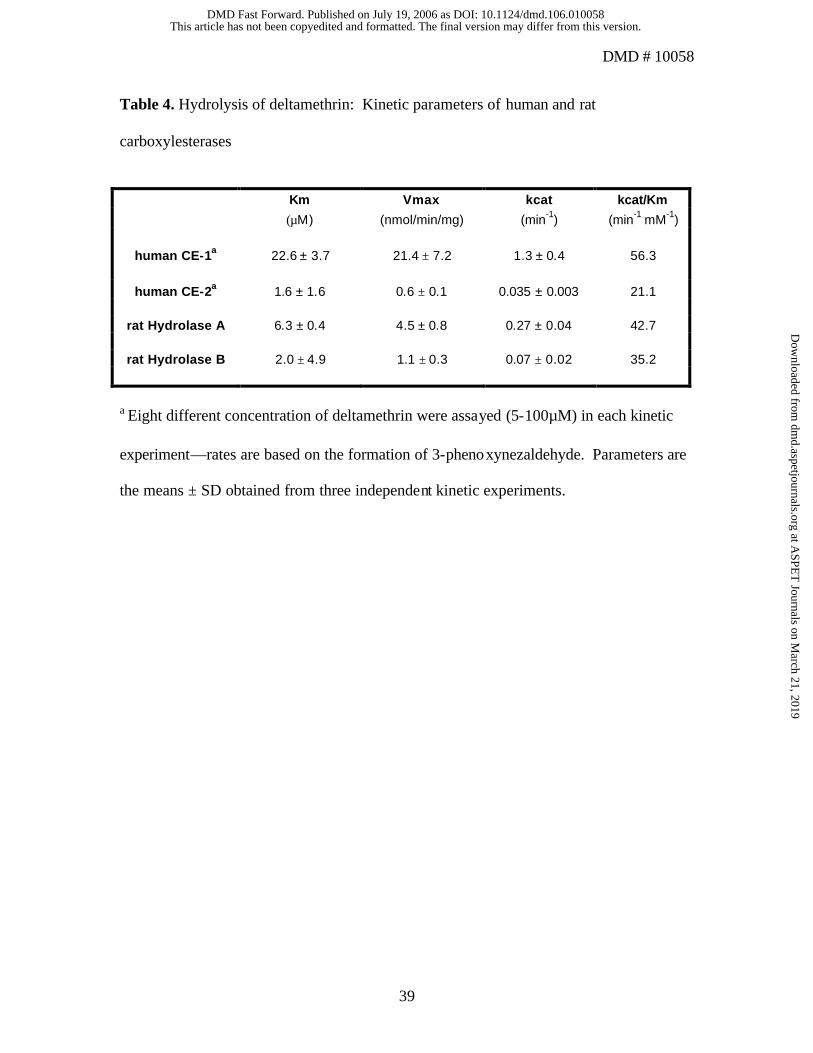
The kinetic parameters for deltamethrin hydrolysis were also estimated for each
human and rat CE (Table 4). Among the four esterases examined, hCE-1 had the highest
Km and kcat , and the highest catalytic efficiency (kcat/Km). Figure 4 demonstrates results
from a representative substrate-velocity experiment comparing hCE-1 and rat Hydrolase
A. The rates of deltamethrin hydrolysis catalyzed by hCE-1 were more rapid at all
concentrations utilized as compared to rat Hydrolase A. It should also be noted that the
kinetic parameters shown in Table 4 were estimated by non- linear regression methods
using all concentrations of substrate (5–100 µM) (Fig. 4) and that similar kinetic
This article has not been copyedited and formatted. The final version may differ from this version.DMD Fast Forward. Published on July 19, 2006 as DOI: 10.1124/dmd.106.010058
at ASPE
T Journals on M
arch 21, 2019dm
d.aspetjournals.orgD
ownloaded from
DMD # 10058
19
parameters were also obtained when the kinetic data was analyzed instead using the
Lineweaver-Burk plot (data not shown). A reliable CE kinetic parameter for comparison
with respect to deltamethrin hydrolysis is the turnover numbers (kcat). The kcat values
obtained are in good agreement with the measured specific activity values that were
determined at a substrate concentration of 50 µM (Table 3). While this is a relatively
high concentration of substrate, it is necessary in order to detect the hydrolysis product 3-
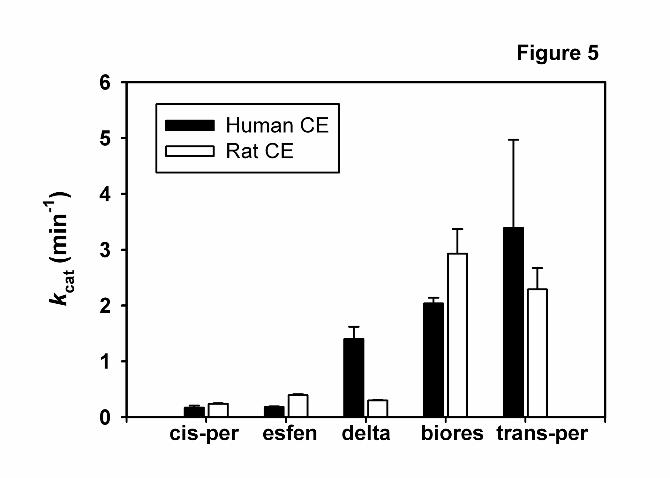
phenoxybenzaldehyde by HPLC analysis. Figure 5 compares the kcat values of rat
Hydrolase A and hCE-1 for deltamethrin and esfenvalerate hydrolysis with those of other
pyrethroids (Ross et al. 2006). This result clearly demonstrates the species difference in
the activities of rat Hydrolase A and hCE-1 that is unique for deltamethrin when
compared to the general similarity in hydrolytic rates observed with the other pyrethroids.
This article has not been copyedited and formatted. The final version may differ from this version.DMD Fast Forward. Published on July 19, 2006 as DOI: 10.1124/dmd.106.010058
at ASPE
T Journals on M
arch 21, 2019dm
d.aspetjournals.orgD
ownloaded from

DMD # 10058
20
Discussion
The biochemical pathways that contribute to the metabolism of pyrethroid
pesticides in laboratory animals are understood relatively well (Soderlund and Casida
1977; Casida and Ruzo, 1980). Fewer studies have examined the metabolism of
pyrethroids by humans (Choi et al 2002; Ross et al 2006; Nishi et al 2006). Recent
studies by Ross et al. (2006) suggest that there may be quantitative and qualitative
differences in the metabolism of pyrethroids by rat and human esterases. The present
study compares the elimination of deltamethrin and esfenvalerate from rat and human
liver microsomes. Consistent with previous work (Soderlund and Casida 1977; Shono et
al. 1979; Anand et al., 2006) the elimination of deltamethrin and esfenvalerate in rat liver
microsomes occurred primarily through an NADPH-dependent oxidative pathway.
Esfenvalerate elimination from human liver microsomes also occurs primarily by the
NADPH-dependent oxidative pathways,. In contrast, NADPH-independent hydrolytic
pathways predominately eliminate deltamethrin in human liver microsomes.
The observed species difference in the metabolism of deltamethrin led to the
examination of the metabolism of deltamethrin and esfenvalerate by purified rat and
human CE enzymes. Human carboxylesterase 1 (hCE-1) had a specific activity that was
4- to 15-fold greater than rat Hydrolases A and B when rates of deltamethrin hydrolysis
were compared (Table 3). The specific activity obtained for Hydrolase A in our current
study is in agreement with the deltamethrin hydrolysis activity obtained using a rabbit
carboxylesterase (Ross et al., 2006), which is 99% identical to Hydrolase A in terms of
amino acid sequence homology. The differential hydrolysis rates by human and rat CEs
suggests that differences in esterase activity are likely responsible, at least in part, for the
This article has not been copyedited and formatted. The final version may differ from this version.DMD Fast Forward. Published on July 19, 2006 as DOI: 10.1124/dmd.106.010058
at ASPE
T Journals on M
arch 21, 2019dm
d.aspetjournals.orgD
ownloaded from

DMD # 10058
21
differences in the metabolism of deltamethrin observed between rat and human liver
microsomes. Indeed, the kcat values for the human and rat CEs (which is a measure of the
rate of enzymatic reaction at saturating concentrations of substrate) did correlate with the
species difference in deltamethrin metabolism using the liver microsomes; however,
differences in kcat /Km values were not remarkably different between hCE-1 and Hydrolase
A (Table 4). Caution needs to be exercised when correlating kinetic parameters of pure
enzymes with the species difference in deltamethrin hydrolysis rates found using hepatic
microsomes. This is because of kcat /Km and kcat values are a metric of an enzyme’s
intrinsic catalytic efficiency and turnover in a pure preparation, not in a crude mixture of
proteins found in tissue fractions where protein-protein interaction may modulate enzyme
activity (Saghatelian et al., 2004). Also, differences in hydrolysis rates in hepatic
microsomes between species may reflect the spectrum of esterase isoforms that are
present in each species and their relative expression levels in liver. For example, if hCE-
1 and Hydrolase A have similar catalytic efficiencies and thus metabolize deltamethrin
equally well at low concentrations of substrate (which does not saturate the enzyme), then
the observed differences in hydrolytic rates using hepatic microsomes may reflect
differences in the relative expression levels of hCE-1 versus Hydrolase A. Alternatively,
it cannot be excluded that an unidentified esterase is present in human liver microsomes
that is much more efficient (much larger kcat /Km) than the rat liver esterases, thus
accounting for the observed differential hydrolysis rates.
In contrast to hCE-1, human carboxylesterase 2 (hCE-2)was shown to have
significantly less activity towards deltamethrin. hCE-1 is expressed abundantly in human
liver, while hCE-2 is expressed at relatively lower levels in this tissue (Satoh et al, 2002).
This article has not been copyedited and formatted. The final version may differ from this version.DMD Fast Forward. Published on July 19, 2006 as DOI: 10.1124/dmd.106.010058
at ASPE
T Journals on M
arch 21, 2019dm
d.aspetjournals.orgD
ownloaded from

DMD # 10058
22
Thus, based on our findings, it is likely that hCE-1 plays a greater role in the metabolism
of deltamethrin in human liver than does hCE-2. Recently Nishi et al. (2006) reported on
the activity of hCE-1 and hCE-2 towards a number of pyrethroids inc luding deltamethrin
and esfenvalerate. The specific activities in Nishi et al. (2006) are similar to those
reported here except in one case. In their studies, hCE-2 had greater activity towards
deltamethrin than hCE-1. While this is inconsistent with the data presented in this study,
this may be explained by differences in the intrinsic activity of the preparations used.
The intrinsic activity of hCE-2 in Nishi et al., (2006) was more than two fold greater than
the hCE-2 used in our studies (reported in Ross et al., 2006) towards the standard
substrate p-nitrophenyl acetate.
Carboxylesterases (EC 3.1.1.1) are members of the esterase family of serine
hydrolase enzymes (Satoh and Hosokawa, 1998). The catalytic mechanism of CEs
requires a triad of amino acid residues (Ser, His, and Glu or Asp) that are essential for
activity. The rat CE isozymes named Hydrolase A and Hydrolase B are the two most
abundant carboxylesterases present in rat liver, accounting for 80% of the total hepatic
carboxylesterase protein under basal conditions (Morgan et al., 1994; Sanghani et al.,
2002). These rat enzymes share ~70% amino acid sequence identity with each other and
have overlapping substrate specificities. Hydrolases A and B have amino acid sequences
that are approximately 70-80% identical with the major human hepatic carboxylesterase
(hCE-1) (Redinbo and Potter, 2005). Thus, these CE isozymes are classified as being
within the class 1 family of CE enzymes. In contrast, hCE-2 is quite distinct from the rat
CEs and hCE-1 in terms of sequence identity and substrate specificity (Satoh and
This article has not been copyedited and formatted. The final version may differ from this version.DMD Fast Forward. Published on July 19, 2006 as DOI: 10.1124/dmd.106.010058
at ASPE
T Journals on M
arch 21, 2019dm
d.aspetjournals.orgD
ownloaded from

DMD # 10058
23
Hosokawa, 1998). hCE-2 shares less than 50% sequence identity with hCE-1 and
Hydrolases A and B and is classified as a class 2 carboxylesterase.
The amino acid sequences that flank the catalytic triad of Ser, His, and Glu
residues in hCE-1 and Hydrolase A are nearly identical to each other, thus they are highly
conserved. The differences in catalytic specificity observed for hCE-1 and Hydrolase A
toward deltamethrin is potentially related to differences in the types of amino acids that
line the substrate-binding gorge and/or active site of the enzymes. Future studies that
create site-specific mutants of hCE-1 and/or Hydrolase A may yield insight into the
underlying specificity differences observed between rat and human CEs. Furthermore,
computational approaches that involve molecular modeling of hCE-1 and Hydrolase A
will be of potential value.
The present study indicates that deltamethrin (a cis- isomer) is metabolized
primarily by an NADPH-independent hydrolytic pathway in human liver microsomes.
This finding is not consistent with structure-metabolism relationships found in laboratory
animals. A number of studies demonstrate that in laboratory animals oxidative pathways
generally metabolize cis-isomers of pyrethroids more rapidly compared to their trans-
isomers, which are generally more rapidly metabolized by hydrolytic pathways
(Soderlund and Casida, 1977; Shono et al., 1979). Recently, Anand et al. (2006)
described the ability of a number of rat hepatic CYP450s to metabolize deltamethrin.
Their results indicate that CYP1A1, CYP1A2, and CYP2C11 may be active in the
metabolism of deltamethrin in rat liver microsomes, with CYP1A2 being the most active.
Based on these results we examined the metabolism of deltamethrin by human CYP1A2,
but did not see significant evidence of metabolism (unpublished data, Godin et al.). This
This article has not been copyedited and formatted. The final version may differ from this version.DMD Fast Forward. Published on July 19, 2006 as DOI: 10.1124/dmd.106.010058
at ASPE
T Journals on M
arch 21, 2019dm
d.aspetjournals.orgD
ownloaded from
DMD # 10058
24
suggests that there may be marked differences in CYP450 activities between rats and
humans toward deltamethrin. It is also possible that the difference in oxidative
metabolism is related to differences in expression of these enzymes between rat and
human liver. For example CYP2C11 is highly expressed in the rat liver (Guengerich et
al., 1982), while one of its human homologues 2C18 has very low expression in the liver
(Rodrigues 1999). A comparison of the full complement of rat and human CYP450
isozymes would be needed to confirm these initial findings and to understand the lack of
P450 mediated metabolism in human liver microsomes. The lack of CYP450 mediated
metabolism of deltamethrin in human liver microsomes may be as important in the
species difference as is the differences in the activities of rat and human
carboxylesterases.
In addition to differences in the pathways of biotransformation of the parent
chemical there were also differences in the rates of elimination and calculated intrinsic
hepatic clearance for deltamethrin and esfenvalerate. Since the parent chemical is the
primary toxicant for pyrethroids, elimination of the parent chemical can be considered the
detoxification step in their metabolism. The CLint of esfenvalerate, which was eliminated
by similar pathways in both species, was estimated to be nearly three-fold greater in rats
than in humans. In contrast, the CLint of deltamethrin was estimated to be twice as rapid
in humans that in rats. In addition, deltamethrin was eliminated by different pathways in
rat and human liver microsomes.
These results indicate that laboratory rodents may not be a good model for
understanding and extrapolating the results of metabolism studies of all pyrethroids in a
human health risk assessment. It is therefore necessary to more completely understand
This article has not been copyedited and formatted. The final version may differ from this version.DMD Fast Forward. Published on July 19, 2006 as DOI: 10.1124/dmd.106.010058
at ASPE
T Journals on M
arch 21, 2019dm
d.aspetjournals.orgD
ownloaded from
DMD # 10058
25
the human metabolism of individual pyrethroids to reduce uncertainties in a risk
assessment.
Acknowledgments. M.K.R. gratefully acknowledges Shellaine Lentz for technical
assistance during the purification of rat carboxylesterase enzymes. The authors would
like to thank Bayer Crop Sciences (Research Triangle Park, NC) and Dupont (Johnston,
IA) for their generous gifts of deltamethrin and esfenvalerate.
This article has not been copyedited and formatted. The final version may differ from this version.DMD Fast Forward. Published on July 19, 2006 as DOI: 10.1124/dmd.106.010058
at ASPE
T Journals on M
arch 21, 2019dm
d.aspetjournals.orgD
ownloaded from

DMD # 10058
26
References Abernathy CO and Casida JE (1973) Pyrethroids insecticides: esterase cleavage in
relation to selective toxicity. Science 179:1235-6.
Anand SS, Bruckner JV, Haines WT, Muralidhara S, Fisher JW and Padilla S (2006)
Characterization of deltamethrin metabolism by rat plasma and liver microsomes. Toxicol
Appl Pharmacol 212: 156-166.
Casida JE and Ruzo LO (1980) Metabolic chemistry of pyrethroid insecticides. Pestic Sci
11:257-269.
Choi J, Rose RL and Hodgson E (2002) In vitro human metabolism of permethrin: the
role of human alcohol and aldehyde dehydrogenases. Pestic Biochem Physio. 74: 117-
128.
Choi JS and Soderlund DM (2005) Structure-activity relationships for the action of 11
pyrethroid insecticides on rat Na(v)1.8 sodium channels expressed in Xenopus oocytes.
Toxicol Appl Pharmacol 211: 233-244.
Davies B and Morris T (1993) Physiological parameters in laboratory animals and
humans. Pharm Res 10:1093-1095.
This article has not been copyedited and formatted. The final version may differ from this version.DMD Fast Forward. Published on July 19, 2006 as DOI: 10.1124/dmd.106.010058
at ASPE
T Journals on M
arch 21, 2019dm
d.aspetjournals.orgD
ownloaded from

DMD # 10058
27
DeVito MJ, Beebe LE, Menache M and Birnbaum LS (1997) Relationship between
CYP1A enzyme activities and protein levels in rats treated with 2,3,7,8-
tetrachlorodibenzo-p-dioxin. J Toxicol Environ Health. 147:379-394.
Dayal M, Parmar D, Dhawan A, Ali M, Dwivedi UN and Seth PK (2003) Effect of
pretreatment of cytochrome P450 (P450) modifiers on neurobehavioral toxicity induced
by deltamethrin. Food Chem Toxicol. 41:431-7.
Guengerich FP, Dannan GA, Wright ST, Martin MV and Kaminsky LS (1982)
Purification and characterization of liver microsomal cytochromes P-450:
Electrophoretic, spectral, catalytic, and immunochemical properties and inducibility of
eight isozymes isolated from rats treated with phenobarbital or β-naphthoflavone.
Biochemistry. 21:6019-6030.
Houston JB (1994) Utility of in vitro drug metabolism data in predicting in vivo
metabolic clearance. Biochem Pharmacol 47:1469-1479.
Iwatsubo T, Hirota N, Ooie T, Suzuki H, Shimada N, Chiba K, Ishizaki T, Green CE,
Tyson CA and Sugiyama Y (1997) Prediction of in vivo drug metabolism in the human
liver from in vitro metabolism data. Pharmacol Ther 73:147-171.
Kulkarni AP and Hodgson E (1984) The metabolism of insecticides: the role of
monooxygenase enzymes. Annu Rev Pharmacol Toxicol 24:19-42.
This article has not been copyedited and formatted. The final version may differ from this version.DMD Fast Forward. Published on July 19, 2006 as DOI: 10.1124/dmd.106.010058
at ASPE
T Journals on M
arch 21, 2019dm
d.aspetjournals.orgD
ownloaded from
DMD # 10058
28
Morgan EW, Yan B, Greenway D, Petersen DR and Parkinson A (1994) Purification and
characterization of two rat liver microsomal carboxylesterases (Hydrolase A and B). Arch
Biochem Biophys 315:495-512.
Morton CL and Potter PM (2000) Comparison of Escherichia coli, Saccharomyces
cerevisiae, Pichia pastoris, Spodoptera frugiperda, and COS7 cells for recombinant gene
expression. Application to a rabbit liver carboxylesterase. Mol Biotechnol 16:193-202.
Narahashi T (1985) Nerve membrane ionic channels as the primary target of pyrethroids.
Neurotoxicology 6:3-22.
Nishi K, Huang H, Kamita SG, Kim IH, Morisseau C and Hammock BD (2006)
Characterization of pyrethroid hydrolysis by the human liver carboxylesterases hCE-1
and hCE-2. Arch. Biochem Biophys 445:115-123.
Obach RS, Baxter JG, Liston TE, Silber BM, Jones BC, MacIntyre F, Rance DJ and
Wastall P (1997) The prediction of human pharmacokinetic parameters from preclinical
and in vitro metabolism data. J Pharmacol Exper Therap 283:46-58.
Obach RS (1999) Prediction of human clearance of twenty-nine drugs from hepatic
microsomal intrinsic clearance data: An examination of in vitro half- life approach and
nonspecific binding to microsomes. Drug Metab Disp 27:1350-1359.
This article has not been copyedited and formatted. The final version may differ from this version.DMD Fast Forward. Published on July 19, 2006 as DOI: 10.1124/dmd.106.010058
at ASPE
T Journals on M
arch 21, 2019dm
d.aspetjournals.orgD
ownloaded from

DMD # 10058
29
Redinbo MR and Potter PM (2005) Mammalian carboxylesterases: from drug targets to
protein therapeutics. Drug Discov Today 10:313-325.
Rickard J and Brodie ME (1985) Correlation of blood and brain levels of the neurotoxic
pyrethroid deltamethrin with the onset of symptoms in rats. Pesict Biochem Physiol
23:143-156.
Roberts TR and Hutson DH (eds) (1999) Metabolic Pathways of Agrochemicals Part 2:
Insecticides and Fungicides – Pyrethroids. The Royal Society of Chemistry. Cambridge
UK
Rodrigues AD (1999) Integrated cytochrome P450 reaction phenotyping: Attempting to
bridge the gap between cDNA-expressed cytochromes P450 and dative human liver
microsomes. Biochem Pharmacol 57:465-480.
Ross MK, Borazjani A, Edwards CC and Potter PM (2006) Hydrolytic metabolism of
pyrethroids by human and other mammalian carboxylesterases. Biochem Pharmacol
71:657-669.
Saghatelian A, Trauger SA, Want EJ, Hawkins EG, Siuzdak G, Cravatt BF (2004)
Assignment of endogenous substrates to enzymes by global metabolite profiling.
Biochemistry 43:14332-14339.
This article has not been copyedited and formatted. The final version may differ from this version.DMD Fast Forward. Published on July 19, 2006 as DOI: 10.1124/dmd.106.010058
at ASPE
T Journals on M
arch 21, 2019dm
d.aspetjournals.orgD
ownloaded from

DMD # 10058
30
Sanghani SP, Davis WI, Dumaual NG, Mahrenholz A and Bosron WF (2002)
Identification of microsomal rat liver carboxylesterases and their activity with retinyl
palmitate. Eur J Biochem 269:4387-4398.
Satoh T and Hosokawa M (1998) The mammalian carboxylesterases: from molecules to
functions. Annu Rev Pharmacol Toxicol 38:257-288.
Satoh T, Taylor P, Bosron WF, Sanghani SP, Hosokawa M, La Du BN (2002) Current
progress on esterases: from molecular structure to function. Drug Metab Dispos 30:488-
493.
Smith TJ, Lee SH, Ingles PJ, Knipple DC and Soderlund DM (1997) The L1014F point
mutation in the house fly Vssc1 sodium channel confers knockdown resistance to
pyrethroids. Insect Biochem Mol Biol 27:807-12.
Schettgen T, Heudorf U, Drexler H and Angerer J (2002) Pyrethroid exposure of the
general population- is this due to diet? Toxicol Lett 134:141-145.
Shono T, Ohsawa K, Casida JE (1979) Metbaolism of trans- and cis-permethrin, trans-
and cis-cypermethrin, and decamethrin by microsomal enzymes. J Agric Food Chem
27:316-325.
This article has not been copyedited and formatted. The final version may differ from this version.DMD Fast Forward. Published on July 19, 2006 as DOI: 10.1124/dmd.106.010058
at ASPE
T Journals on M
arch 21, 2019dm
d.aspetjournals.orgD
ownloaded from

DMD # 10058
31
Soderlund DM and Casida JE (1977) Effects of pyrethroid structure on rates of
hydrolysis and oxidation by mouse liver microsomal enzymes. Pestic Biochem Physiol
7:391-401.
Soderlund DM, Clark JM, Sheets LP, Mullin LS, Piccirillo VJ, Sargent D, Stevens JT and
Weiner ML (2002) Mechanisms of pyrethroid neurotoxicity: implications for cumulative
risk assessment. Toxicology 171:3-59.
Stok JE, Huang H, Jones PD, Wheelock CE, Morisseau C and Hammock BD (2004)
Identification, expression and purification of a pyrethroid hydrolyzing carboxylesterase
from mouse liver microsomes. J Biol Chem 279:29863-29869.
Ueda K, Gaughan LC and Casida JE (1975) Metabolism of four resmethrin isomers by
liver microsomes. Pestic Biochem Physiol 5:280-294.
Wheelock CE, Wheelock AM, Zhang R, Stok JE, Morisseau C and Le Valley SE (2003)
Evaluation of alpha-cyanoesters as fluorescent substrates for examining interindividual
variation in general and pyrethroid-selective esterases in human liver microsomes. Anal
Biochem 315:208-222.
This article has not been copyedited and formatted. The final version may differ from this version.DMD Fast Forward. Published on July 19, 2006 as DOI: 10.1124/dmd.106.010058
at ASPE
T Journals on M
arch 21, 2019dm
d.aspetjournals.orgD
ownloaded from

DMD # 10058
32
White INH, Verschoyle RD, Moradian MH and Barnes JM (1976) The relationship
between brain levels of cismethrin and bioresmethrin in female rats and neurotoxic
effects. Pestic Biochem Physiol 6:491-500.
This article has not been copyedited and formatted. The final version may differ from this version.DMD Fast Forward. Published on July 19, 2006 as DOI: 10.1124/dmd.106.010058
at ASPE
T Journals on M
arch 21, 2019dm
d.aspetjournals.orgD
ownloaded from

DMD # 10058
33
Footnotes
This article has been reviewed in accordance with the policy of the National Health and
Environmental Effects Research Laboratory, U.S. Environmental Protection Agency, and
approved for publication. Approval does not signify that the contents necessarily reflect
the views and policies of the Agency, nor does mention of trade names or commercial
products constitute endorsement or recommendation for use.
S.J.G. was supported by NHEERL-DESE, EPA CT826513.
Research support was provided by NIH grants P20 RR017661 (to M.K.R.) and by NIH
CA76202, CA79763, CA108775, CA98468, a Cancer Center Core Grant P30 CA-21765
and the American Lebanese Syrian Associated Charities (to P.M.P.).
Send Correspondence to:
Michael J DeVito
US EPA, MD B143-01 Research Triangle Park, NC, 27711
This article has not been copyedited and formatted. The final version may differ from this version.DMD Fast Forward. Published on July 19, 2006 as DOI: 10.1124/dmd.106.010058
at ASPE
T Journals on M
arch 21, 2019dm
d.aspetjournals.orgD
ownloaded from

DMD # 10058
34
Figure Legends Figure 1. Structures of the pyrethroid pesticides deltamethrin and esfenvalerate.
Figure 2. Elimination of deltamethrin and esfenvalerate from rat liver microsomes.
Elimination examined at 1µM deltamethrin or esfenvalerate in the presence of (n solid
line) or absence of (∆ dashed line) NADPH, with and without TEPP. Line represents
linear regression of data points. Data represented as the mean ± SD (N=3).
Figure 3. Elimination of deltamethrin and esfenvalerate from human liver
microsomes. Elimination examined at 1µM deltamethrin or esfenvalerate in the
presence of (n solid line) or absence of (∆ dashed line) NADPH, with and without TEPP.
Line represents linear regression of data points. Data represented as the mean ± SD
(N=3).
Figure 4. Kinetics of deltamethrin hydrolysis by hCE-1 and Hydrolase A. Velocity
was measured by the amount of 3-phenoxybenzyladehyde (3PBCHO) released during the
reaction. Data (symbols) were fit to the Michaelis-Menten equation and the non- linear
regression results are plotted (lines). Each point represents the mean ± SD (N=3)
Figure 5. Comparison of turnover numbers (kcat) for human CE (hCE-1) and rat CE
(Hydrolase A). Hydrolysis of five different pyrethroids are compared. Data for cis-per,
trans-per, and biores are from Ross et al. (2006). Abbreviations: cis-per, cis-permethrin;
This article has not been copyedited and formatted. The final version may differ from this version.DMD Fast Forward. Published on July 19, 2006 as DOI: 10.1124/dmd.106.010058
at ASPE
T Journals on M
arch 21, 2019dm
d.aspetjournals.orgD
ownloaded from
DMD # 10058
35
esfen, esfenvalerate; delta, deltamethrin; biores, bioresmethrin; trans-per, trans-
permethrin.
This article has not been copyedited and formatted. The final version may differ from this version.DMD Fast Forward. Published on July 19, 2006 as DOI: 10.1124/dmd.106.010058
at ASPE
T Journals on M
arch 21, 2019dm
d.aspetjournals.orgD
ownloaded from

DMD # 10058
36
Table 1. Kmapp and scaled intrinsic hepatic clearance (CLINT) values for deltamethrin and
esfenvalerate in rats and humans.
Data is mean ± SD (N=3)
Deltamethrin Kmapp (µM) Clearance (mL/min/kg b.w)
Rat Microsomes 39 89.0 ± 23.7
Human Microsomes 75 162.1± 32.7
Esfenvalerate
Rat Microsomes 22 108.2 ± 2.2
Human Microsomes 21 37.3 ± 10.3
This article has not been copyedited and formatted. The final version may differ from this version.DMD Fast Forward. Published on July 19, 2006 as DOI: 10.1124/dmd.106.010058
at ASPE
T Journals on M
arch 21, 2019dm
d.aspetjournals.orgD
ownloaded from

DMD # 10058
37
Table 2. Elimination rates for deltamethrin and esfenvalerate from rat and human liver
microsomes.
Elimination rate (pmoles/min/mg MSP)
Deltamethrin + NADPH - NADPH
Rat Microsomes 30.4 ± 7.3 8.8 ± 0.23
Rat Microsomes + TEPP 24.6 ± 3.7 ND
Human Microsomes 52.8 ± 6.2 58.0 ± 3.0
Human Microsomes + TEPP 5.8 ± 5.4 ND
Esfenvalerate
Rat Microsomes 45.3 ± 2.4 4.8 ± 1.4
Rat Microsomes + TEPP 23.4 ± 9.0 ND
Human Microsomes 20.9 ± 4.4 2.6 ± 1.6
Human Microsomes + TEPP 18.9 ± 2.7 ND
+ NADPH, total clearance (oxidative and hydrolytic) of parent chemical from
microsomal assay.
– NADPH, NADPH-independent hydrolytic clearance of parent chemical from
microsomal incubation.
+ TEPP, tetraethylpyrophosphate (200µM) used to inhibit hydrolytic metabolism. ND, no
detectable elimination.
. Data is mean ± SD. (N=3)
This article has not been copyedited and formatted. The final version may differ from this version.DMD Fast Forward. Published on July 19, 2006 as DOI: 10.1124/dmd.106.010058
at ASPE
T Journals on M
arch 21, 2019dm
d.aspetjournals.orgD
ownloaded from
DMD # 10058
38
Table 3. Specific activity of human and rat carboxylesterase hydrolysis of deltamethrin
and esfenvalerate
a 50 µM deltamethrin or esfenvalerate in assay (n=3). Incubation time of 30 min. Rates
were based on the formation of 3-phenoxybenzaldeyde.
b Relative to the human CE-1 specific aactivity for deltamethrin hydrolysis.
Deltamethrin Esfenvalerate Enzyme specific activitya fold specific activitya fold
(nmol/min/mg) differenceb (nmol/min/mg) differenceb
human CE-1a 12.2 ± 0.6 1.00 3.1 ± 0.2 0.25
human CE-2a 0.5 ± 0.0 0.04 0.1 ± 0.0 0.01
rat Hydrolase A 3.0 ± 0.2 0.25 6.6 ± 0.3 0.54
rat Hydrolase B 0.8 ± 0.1 0.07 3.0 ± 0.3 0.25
This article has not been copyedited and formatted. The final version may differ from this version.DMD Fast Forward. Published on July 19, 2006 as DOI: 10.1124/dmd.106.010058
at ASPE
T Journals on M
arch 21, 2019dm
d.aspetjournals.orgD
ownloaded from
DMD # 10058
39
Table 4. Hydrolysis of deltamethrin: Kinetic parameters of human and rat
carboxylesterases
Km Vmax kcat kcat/Km
(µM) (nmol/min/mg) (min-1) (min-1 mM-1)
human CE-1a 22.6 ± 3.7 21.4 ± 7.2 1.3 ± 0.4 56.3
human CE-2a 1.6 ± 1.6 0.6 ± 0.1 0.035 ± 0.003 21.1
rat Hydrolase A 6.3 ± 0.4 4.5 ± 0.8 0.27 ± 0.04 42.7
rat Hydrolase B 2.0 ± 4.9 1.1 ± 0.3 0.07 ± 0.02 35.2
a Eight different concentration of deltamethrin were assayed (5-100µM) in each kinetic
experiment—rates are based on the formation of 3-phenoxynezaldehyde. Parameters are
the means ± SD obtained from three independent kinetic experiments.
This article has not been copyedited and formatted. The final version may differ from this version.DMD Fast Forward. Published on July 19, 2006 as DOI: 10.1124/dmd.106.010058
at ASPE
T Journals on M
arch 21, 2019dm
d.aspetjournals.orgD
ownloaded from

This article has not been copyedited and formatted. The final version may differ from this version.DMD Fast Forward. Published on July 19, 2006 as DOI: 10.1124/dmd.106.010058
at ASPE
T Journals on M
arch 21, 2019dm
d.aspetjournals.orgD
ownloaded from

This article has not been copyedited and formatted. The final version may differ from this version.DMD Fast Forward. Published on July 19, 2006 as DOI: 10.1124/dmd.106.010058
at ASPE
T Journals on M
arch 21, 2019dm
d.aspetjournals.orgD
ownloaded from

This article has not been copyedited and formatted. The final version may differ from this version.DMD Fast Forward. Published on July 19, 2006 as DOI: 10.1124/dmd.106.010058
at ASPE
T Journals on M
arch 21, 2019dm
d.aspetjournals.orgD
ownloaded from

This article has not been copyedited and formatted. The final version may differ from this version.DMD Fast Forward. Published on July 19, 2006 as DOI: 10.1124/dmd.106.010058
at ASPE
T Journals on M
arch 21, 2019dm
d.aspetjournals.orgD
ownloaded from
This article has not been copyedited and formatted. The final version may differ from this version.DMD Fast Forward. Published on July 19, 2006 as DOI: 10.1124/dmd.106.010058
at ASPE
T Journals on M
arch 21, 2019dm
d.aspetjournals.orgD
ownloaded from