special scenarios for investigating risks to …...special issue scenarios for investigating risks...
TRANSCRIPT

SPECIALISSUE
Scenarios for investigating risksto biodiversitygeb_620 5..18
Joachim H. Spangenberg1,2*, Alberte Bondeau3, Timothy R. Carter4,
Stefan Fronzek4, Jill Jaeger5, Kirsti Jylhä6, Ingolf Kühn1, Ines Omann5,
Alex Paul7, Isabelle Reginster8†, Mark Rounsevell9, Oliver Schweiger1,
Andrea Stocker5, Martin T. Sykes10 and Josef Settele1
1UFZ, Helmholtz Centre for Environmental
Research, Department of Community Ecology,
Theodor-Lieser-Strasse 4, 06120 Halle/Saale,
Germany, 2Sustainable Europe Research
Institute SERI Germany e.V., Vorsterstrasse
97-99, 51103 Cologne, Germany, 3Potsdam
Institute for Climate Change Research,
Telegrafenberg, PO Box 60 12 03, D-144 12
Potsdam, Germany, 4Finnish Environment
Institute (SYKE), Box 140, Mechelininkatu
34a, FI-00251 Helsinki, Finland, 5SERI
Sustainable Europe Research Institute GmbH,
Garnisongasse 7/21, A-1090 Vienna, Austria,6Finnish Meteorological Institute, Climate
Research and Applications, PO Box 503,
FI-00101 Helsinki, Finland, 7Lancaster
Environment Centre, Lancaster University,
Lancaster LA1 4YQ, UK, 8UCL – Department
of Geography, Place Pasteur, 3,
B- 1348 Louvain-la-Neuve, Belgium, 9Centre
for the Study of Environmental Change and
Sustainability, School of Geosciences,
University of Edinburgh, Drummond Street,
Edinburgh EH8 9XP, UK, 10Department of
Earth and Ecosystem Sciences, Lund
University, Sölvegatan 12, 223 62 Lund,
Sweden
ABSTRACT
Aim This paper describes a set of integrative scenarios developed in the ALARM(Assessing LArge-scale environmental Risks for biodiversity with tested Methods)project. The ultimate aim of ALARM was to develop and test methods and proto-cols for the assessment of large-scale environmental risks to biodiversity and toevaluate mitigation options. Scenarios provide a tool for exploring such risks andthe policy options to mitigate them; therefore they play a central role within theALARM project.
Methods Three integrative scenarios (liberalization, business as might be usual,sustainability) were developed and illustrated using the econometric modeldescribed in a subsequent paper. They are contextualized with projections fromclimate models and provide the input for model-based assessments of biodiversitytrends. Additionally, three shock scenarios were developed (Gulf Stream collapse,peak oil, pandemic) to demonstrate the limits of linear extrapolation. As theseextend beyond model capabilities, they are discussed semi-quantitatively based onmodelling insights.
Results Although the policy impacts on biodiversity are different for differentpressures, biomes and species groups, some general trends could be identified. Anextension of current EU policies will act as a brake on current trends by slowingdown the loss of biodiversity in many cases and in most biomes, but it will becapable of neither halting nor of reversing the loss. Liberalization has the effect ofaccelerating biodiversity loss across the board, with few exceptions. A coherentsustainability scenario is clearly the most effective at preserving biodiversity, but thevariant tested here still does not halt losses in all cases.
Main conclusions Current EU policies for protecting biodiversity appear to beinsufficient to reverse ongoing losses. Coherent sustainability strategies are effectiveat conserving biodiversity, but in order to assess losses and then reverse them,measures would need to be introduced that extend beyond the steps tested in theALARM sustainability scenario.
KeywordsBiodiversity, uncertainty, integration, policy implications, scenarios, storylines.
*Correspondence: Joachim H. Spangenberg,Sustainable Europe Research Institute SERIGermany e.V., Vorsterstrasse 97-99, 51103Cologne, Germany.E-mail: [email protected]†Present address: IWEPS – Institut Wallon del’Evaluation, de la Prospective et de laStatistique, Rue Fort de Suarlée, 1, B-5001Namur, Belgium.
THE CONTEXT
ALARM (Assessing LArge-scale environmental Risks for biodi-
versity with tested Methods) was an Integrated Project (IP)
within the Sixth Framework Programme of the European Com-
mission (EC). The ultimate aim of the ALARM project was to
develop and test methods and protocols for the assessment of
large-scale environmental risks (Settele et al., 2005; see also
http://www.alarmproject.net). To do so, ALARM integrated the
research results of more than 250 scientists from 68 institutions
Global Ecology and Biogeography, (Global Ecol. Biogeogr.) (2012) 21, 5–18
© 2012 Blackwell Publishing Ltd DOI: 10.1111/j.1466-8238.2010.00620.xhttp://wileyonlinelibrary.com/journal/geb 5

in 35 countries. These results have formed the basis of policy
recommendations in an attempt to support evidence-based
decision making on biodiversity-relevant issues.
In the ALARM project, scenarios have been used as an inte-
grative and prospective tool. Three base and three shock sce-
narios were developed. They accumulate knowledge from
different disciplines in an attempt to make it more comprehen-
sible and thus more useful to the policy process than raw scien-
tific measurement data or direct model outputs could be.
The challenge
One peculiarity of the ALARM project is that it goes beyond
existing assessments of biodiversity risks by developing an inte-
grated view of diverse pressures and their interactions. This is an
urgent necessity and requires such a large-scale project (Settele
et al., 2007) because the final impact is caused by a combination
of multiple stresses from different pressures. Given the multi-
tude of pressures, the many driving forces behind them, and the
diversity of impact mechanisms, it is a formidable challenge for
any expert group or individual to encompass all aspects of
biodiversity risk. Moreover, no single discipline and no single
model (conceptual or numerical) can readily accommodate all
of the relevant information. Rather, a broad, multi-disciplinary
approach is suggested for assessing impacts on biodiversity,
which will complement and integrate the achievements of
smaller, targeted research efforts.
From the outset it was clear that multi-disciplinary collabo-
ration was a necessary, though not sufficient, condition for
meeting the project’s objectives. What was needed was an inte-
grated scientific approach, incorporating a mutual understand-
ing of philosophies and methods and a genuine inter-
disciplinary mode of working. In this context, it transpired that
scenario development can serve as a kind of ‘melting pot’, in
which results from many individual research projects are syn-
thesized into coherent pictures of possible future worlds.
Scenarios
How can scenarios be useful? Scenarios are not predictions but
are a means to illustrate possible future developments under
conditions of uncertainty, including different interpretations of
the current situation (EEA, 2009). They deal with multi-variable
state changes that are often too large in scale to be analysed
empirically in a laboratory or greenhouse setting (Alcamo, 2001;
Seppelt et al., 2009) or too inter-dependent to facilitate a mean-
ingful analysis of changes in individual variables whilst fixing all
others, i.e. the ceteris paribus assumption readily applied in eco-
nomic theory (Scrieciu, 2007).
Uncertainty in this context cannot simply be described by a
probability distribution or as a stochastic variation; rather it
characterizes outcomes of human actions which are, by their
nature, impossible to predict (van der Sluijs, 2002). Thus certain
assumptions have to be made on how things might develop, and
key criteria for a good scenario are that the assumptions are
made explicit and cover all the relevant variables. This means
that conclusions are derived from plausible reasoning and sup-
ported by model simulations for specific aspects of the scenario
wherever possible, allowing comparative analysis of the sce-
narios, their dynamics and results regarding similar or differing
trends across scenarios, bifurcation points, etc. The first part is
the scenario narrative or story line, the second one the model-
ling (Alcamo, 2001).
Salience, credibility and legitimacy are three features that are
of particular importance in the construction of effective and
relevant scenarios (e.g. Dow & Carbone, 2007). For instance, a
recent review of scenarios by the European Environment Agency
(EEA) notes that ‘even well-crafted scenarios can fail to have
their intended policy impact if they present irrelevant informa-
tion, lack support from relevant actors, are poorly embedded
into relevant organisations or ignore key institutional context
conditions’ (EEA, 2009).
In order to be convincing, narratives must be internally con-
sistent, take the existing institutional setting as their starting
point and derive information relevant for the respective target
group(s). Scenarios can be used for different purposes, e.g. in the
decision-making processes or to convey a complicated scientific
message to a lay audience (e.g. Nicholson-Cole, 2005; Jylhä et al.,
2010). In our case, this means that they must be relevant to
decisions with impacts on biodiversity and conservation taken
by those making EU policy decisions.
Whether the scenarios meet these criteria is best evaluated by
peer reviews within extended peer communities, involving not
only scientists from different disciplines but also representatives
of decision makers who are one of the key user groups of the
scenarios. Extended peer communities are one characteristic of
what has been called transdisciplinary research, and participa-
tion of key stakeholders as an integral component of research is
part of what has been described as ‘post-normal science’, a
method to be applied when facts are uncertain, values in
dispute, stakes high and decisions urgent (Funtowicz & Ravetz,
1993, 1994). Only if a scenario (or a group of them) resonates
with that audience can it be expected that it will be used in
decision-making processes, and thus have an impact beyond the
scientific community.
Scenario narratives can accommodate qualitative and quan-
titative data, and integrate otherwise incommensurable pieces of
information (i.e. which cannot be aggregated into one index
figure by mathematical means). Hence, they can provide a com-
prehensive view of possible – plausible but not necessarily prob-
able – future developments, and can also address complexity. In
this way, they serve as a means to explore the possible future
outcomes of decisions taken (or not taken) now. Thus the sto-
rylines are the backbones of the scenarios. They are the qualita-
tive part, defining philosophies, policies and instruments, which
is complemented by a quantitative part, the scenario simulations
(or modelling).
Modelling is not the core activity, but it provides an extremely
helpful contribution to scenario building. Both qualitative and
quantitative models can serve a useful role. Mental models are
indispensable for constructing a plausible narrative, requiring
that the assumptions behind arguments used to justify a sto-
J. H. Spangenberg et al.
Global Ecology and Biogeography, 21, 5–18, © 2012 Blackwell Publishing Ltd6

ryline be laid open and thus made accessible to critical review.
Numerical models are commonly required to represent physi-
cally or empirically based relationships between the critical
driving factors of change and key outcomes. These can be used
to simulate outcomes on the basis of pre-specified quantitative
projections of future trends in key driving variables (chosen, for
example, to be consistent with a given narrative storyline).
Examples of key drivers include economic, demographic and
institutional changes, for which official projections may exist
over varied projection periods and geographical scales. By their
nature, models are simplifications of reality, much less complex
than the natural and social systems they emulate (Spangenberg,
2005), and there may be large uncertainties associated with their
outputs. Thus the raw quantitative output from models is less
important for interpreting a scenario result than the general
tendencies revealed. These can then be integrated into the sto-
ryline and be related to data from other simulation runs, offer-
ing potentially fruitful insights even in cases where simulation
results from a variety of (mental and technical) models appear
to diverge.
SCENARIOS IN ALARM
Biodiversity is subject to a variety of different, and interacting,
pressures. In its 2005 Environmental Outlook, the EEA identi-
fied the following major determinants of environmental change
in Europe: the socio-economic context, demography, macro-
economy, technological developments, consumption patterns,
energy and transport; agriculture, waste and material flows
(EEA, 2005). In the pan-European environment report (EEA,
2007), they add geopolitics and international cooperation,
globalization and trade, migration, and natural resources. The
Millennium Ecosystem Assessment uses a slightly different ter-
minology, identifying as direct drivers habitat change (land-use
change and physical modification of rivers or withdrawal of
water from rivers), overexploitation, invasive alien species, pol-
lution and climate change. Indirect drivers behind many of the
direct ones are then population change, change in economic
activity, socio-political factors, cultural factors and technologi-
cal change. Thus to assess future risks for biodiversity, different
policy options related to all of these determinants have to be
analysed. ALARM scenarios cover all of these issues as they are
broad pictures of possible futures, focusing on biodiversity risks
caused by a wide range of factors.
Biodiversity scenarios in general aim to analyse the driving
forces and pressures causing the loss of biodiversity, quantified
where possible using model simulations based on research data
and case studies. Similarly, ALARM scenarios followed this pro-
cedure to estimate the effects of several ‘pressure families’ such as
land use (see Box 1 on land use, below) or climate change
(Hickler et al., 2012) on species groups and ecosystems in dif-
ferent biomes (Marion et al., 2010). By comparing the results,
conclusions can then be drawn, highlighting which policy deci-
sions would be more or less desirable from the point of view of
biodiversity conservation. Consequently, each scenario has been
designed to be archetypal for one such policy direction. Ques-
tions addressed include, for example, the impact of climate
change on conservation (the EU Natura 2000 sites; Hickler et al.,
2012), the impacts of EU agricultural policies for trends in plant
invasions (see Chytrý et al., 2012) or the combined effects of
climate change and land-use change on biotic interactions (see
Schweiger et al., 2008, 2012).
Previous scenarios have followed a DPSIR approach (distin-
guishing Drivers, Pressures State, Impact and Responses; EEA,
2000), which was refined and popularized by the EEA due to its
ability to integrate and systematize research results from a wide
range of disciplines and its effectiveness as a means of commu-
nication to decision makers (Stanners, in press). The approach
provides a structured description of the factors having an imme-
diate impact on the state of the environment (the pressures), the
driving forces behind them and the policy responses triggered.
Drivers are the domain of social science analysis, responses are
analysed in political science, impacts and state are the objects of
natural science research, and the analysis of pressures is an inter-
face of different disciplines, in ALARM as elsewhere. This more
general concept was subsequently adapted to biodiversity
(Maxim et al., 2009, Fig. 1). In order to better understand the
interaction of drivers and their cumulative impacts such as the
interaction between persistent chemicals, climate and land-use
change (see Paul et al., 2012),we defined pressures as the interface
of socio-economic and bio-geochemical components of social–
ecological systems (Spangenberg, 2007a). The description of the
anthroposphere as the domain of drivers was structured using a
hierarchy of institutions from organizations/agents and mecha-
nisms to orientations, derived from political science and adapted
to sustainability policies. In this dynamic hierarchical system, all
factors on all levels can influence each other (Spangenberg et al.,
2002). For instance, an orientation towards economic growth can
trigger policies including reduced environmental standards (pol-
lution), more transport (climate change, fragmentation) and
more consumption (land use, overexploitation of resources). The
orientation towards global markets and competitiveness that is
behind current EU agricultural policies has led to intensification,
including the intensive use of chemicals in monoculture-
dominated landscapes. These factors have contributed signifi-
cantly to biodiversity loss in the new EU member states
and threaten to continue doing so (Kuldna et al., 2009).
Driving Forces
Pressure
State
Impact
Response Prevention
Mitigation
Restoration
Adaptation
Figure 1 The DPSIR (distinguishing Drivers, Pressures, State,Impact and Responses) model. Solid lines: selected causalrelations. Dotted lines: different types of responses.
Investigating risks to biodiversity
Global Ecology and Biogeography, 21, 5–18, © 2012 Blackwell Publishing Ltd 7
Box 1: explanation of land-use change in thescenarios
For the ALARM project, quantitative, spatially explicit and
alternative scenarios of land use in Europe were developed for
27 countries (EU25 + Switzerland and Norway) at a 10′ grid
cell resolution. Seven land-use types were modelled with an
annual time step from a baseline year 2000 to 2080: urban land
use, cropland, grassland, permanent crops, biofuels, forests
and land in succession (abandoned agricultural land). The
tool used for land-use modelling was MOLUSC, an auto-
mated European land-use change model. It uses interpreta-
tions of future trends in current European policy that have an
impact on land use, notably the European Spatial Develop-
ment Perspective (ESDP) and its role in planning policy, the
effects of the Common Agricultural Policy (CAP) on agricul-
tural production and rural development and nature protec-
tion policies through the NATURA 2000 site network. More
details can be found in Reginster et al. (in press).
Changes in future land use were referenced to a baseline of
the current land use as defined by the PELCOM database.
PELCOM is a 1 km pan-European land-cover map derived
from remotely sensed data. The classification methodology
in PELCOM was based on a regional and integrated
approach of the NOAA-AVHRR satellite data and ancill-
ary information. PELCOM covers the whole of Europe and
is freely available (http://www.geo-informatie.nl/projects/
pelcom/ public/index.htm).
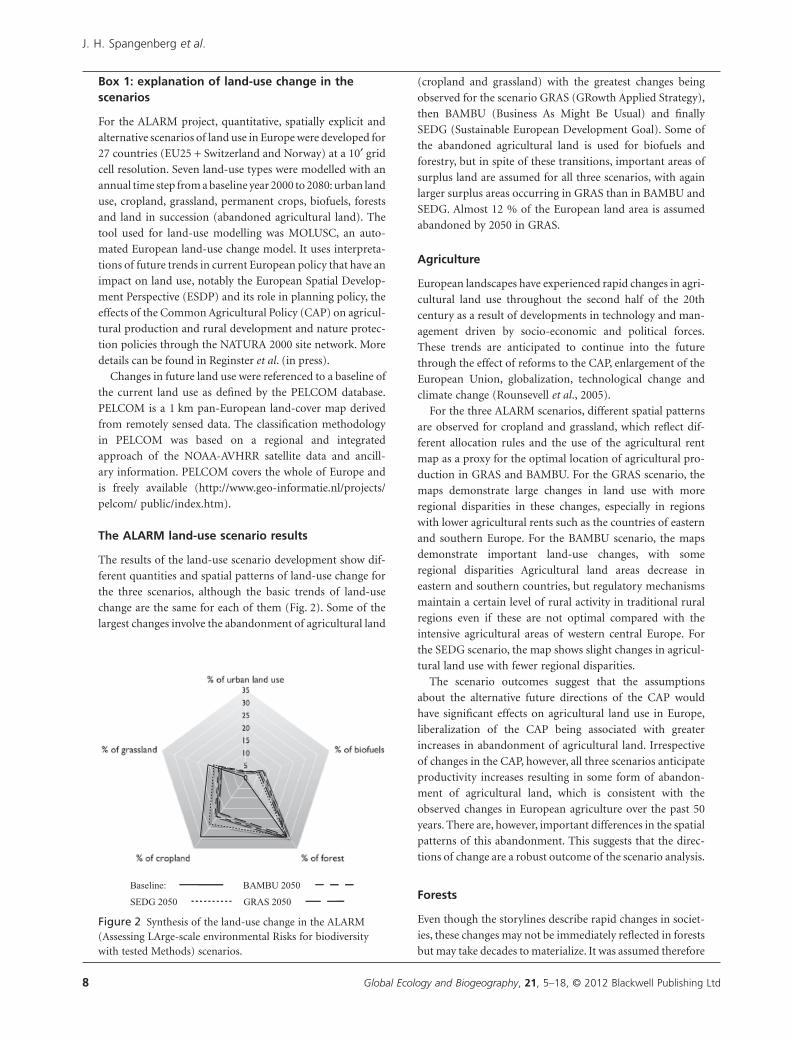
The ALARM land-use scenario results
The results of the land-use scenario development show dif-
ferent quantities and spatial patterns of land-use change for
the three scenarios, although the basic trends of land-use
change are the same for each of them (Fig. 2). Some of the
largest changes involve the abandonment of agricultural land
Baseline: BAMBU 2050
SEDG 2050 GRAS 2050
Figure 2 Synthesis of the land-use change in the ALARM(Assessing LArge-scale environmental Risks for biodiversitywith tested Methods) scenarios.
(cropland and grassland) with the greatest changes being
observed for the scenario GRAS (GRowth Applied Strategy),
then BAMBU (Business As Might Be Usual) and finally
SEDG (Sustainable European Development Goal). Some of
the abandoned agricultural land is used for biofuels and
forestry, but in spite of these transitions, important areas of
surplus land are assumed for all three scenarios, with again
larger surplus areas occurring in GRAS than in BAMBU and
SEDG. Almost 12 % of the European land area is assumed
abandoned by 2050 in GRAS.
Agriculture
European landscapes have experienced rapid changes in agri-
cultural land use throughout the second half of the 20th
century as a result of developments in technology and man-
agement driven by socio-economic and political forces.
These trends are anticipated to continue into the future
through the effect of reforms to the CAP, enlargement of the
European Union, globalization, technological change and
climate change (Rounsevell et al., 2005).
For the three ALARM scenarios, different spatial patterns
are observed for cropland and grassland, which reflect dif-
ferent allocation rules and the use of the agricultural rent
map as a proxy for the optimal location of agricultural pro-
duction in GRAS and BAMBU. For the GRAS scenario, the
maps demonstrate large changes in land use with more
regional disparities in these changes, especially in regions
with lower agricultural rents such as the countries of eastern
and southern Europe. For the BAMBU scenario, the maps
demonstrate important land-use changes, with some
regional disparities Agricultural land areas decrease in
eastern and southern countries, but regulatory mechanisms
maintain a certain level of rural activity in traditional rural
regions even if these are not optimal compared with the
intensive agricultural areas of western central Europe. For
the SEDG scenario, the map shows slight changes in agricul-
tural land use with fewer regional disparities.
The scenario outcomes suggest that the assumptions
about the alternative future directions of the CAP would
have significant effects on agricultural land use in Europe,
liberalization of the CAP being associated with greater
increases in abandonment of agricultural land. Irrespective
of changes in the CAP, however, all three scenarios anticipate
productivity increases resulting in some form of abandon-
ment of agricultural land, which is consistent with the
observed changes in European agriculture over the past 50
years. There are, however, important differences in the spatial
patterns of this abandonment. This suggests that the direc-
tions of change are a robust outcome of the scenario analysis.
Forests
Even though the storylines describe rapid changes in societ-
ies, these changes may not be immediately reflected in forests
but may take decades to materialize. It was assumed therefore
J. H. Spangenberg et al.
Global Ecology and Biogeography, 21, 5–18, © 2012 Blackwell Publishing Ltd8

Box 1 Continued
that the underlying driving forces that are relevant to
changes in forest land today would also apply in the future
(Rounsevell et al., 2005). Generally, for the BAMBU and
SEDG scenarios, managed forest areas increase. There could
be some decreases in GRAS, partly due to competition with
other land uses (urban land use or biofuels).
Urban areas
Urban land use increases in all scenarios, but these changes
are small in areal terms relative to the other land-use classes.
For the GRAS scenario, the map shows urban sprawl, peri-
urban patterns and diffuse developments in rural areas. For
the BAMBU and SEDG scenarios, the map shows more
compact patterns. The local effect of urbanization is,
however, especially important for ecosystems and in this
respect very different patterns of urbanization are observed
for the different scenarios. The dispersion of new urban
settlements, such as in the GRAS scenario, will affect agricul-
tural areas, forests and semi-natural areas, except in pro-
tected areas. For the BAMBU scenario, compact city
development and limited peri-urbanization will reduce
impacts on rural areas. Current protected areas are preserved
and the NATURA 2000 site network is enforced. In the SEDG
scenario, compact city development and limited peri-
urbanization also minimize impacts on agricultural areas,
forests and semi-natural areas.
Adapted from Reginster et al. (2010)
Based on such complex projections of policy impact, a list of
geophysical and socio-economic changes was compiled describ-
ing these changes in a rough but structured way. Then an expert
panel made up from the about 250 ALARM scientists assessed
the impacts with regard to their relative strength and direction.
Given the panel size, we consider this to be a reasonably reliable
assessment, and it proved to be the most promising method of
generating meaningful assessments and cross-comparisons of
biodiversity impacts of the different scenarios (see also Marion
et al., 2010).
Such scenarios can serve as the basis for developing and
testing policy strategies to halt and reverse the loss of biodi-
versity in Europe (i.e. to implement the EU’s core biodiversity
policy objective; European Commission, 2010a). In the
ALARM project, three policy scenarios were developed, repre-
senting three archetypal policy approaches (liberal, pragmatic
and sustainable) and their corresponding implications for
climate change, land use, chemical use, pollinator loss and
their cumulative impact on biodiversity. The basic orientations
were a joint choice of the ALARM scenario group (mainly
consisting of the present authors); they were enriched
by different disciplinary contributions, integrated and further
developed in iterative discussions involving the scenario group,
the socio-economic team, the Consultative Forum and the
General Assembly of ALARM. To illustrate the scenarios by
modelling, climate projections described in the IPCC Special
Report on Emissions Scenarios (SRES; Nakicenovic et al.,
2000) that most closely corresponded to the scenario storylines
were selected (see Fronzek et al., 2012). Key economic assump-
tions were transformed into parameters for the socio-
economic model GINFORS (see Stocker et al., 2012); the new
scenario generator MOLLUSC was developed for land use.
Nitrogen flows and climate change were taken into account in
the land-use model, which was also harmonized with
GINFORS regarding the parameters playing a role in both
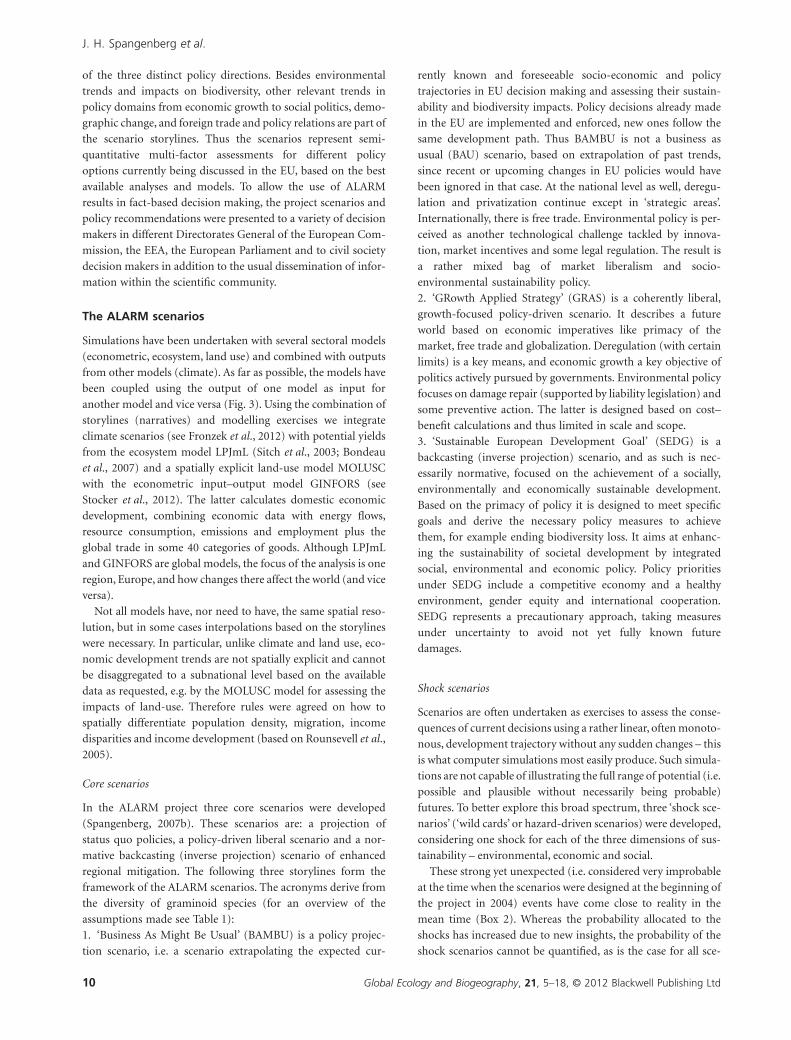
models (see Fig. 3).
The ALARM scenarios provide decision makers and stake-
holders with a picture of possible futures under the assumptions
Socio-economicmodel (GINFORS)
Qualitative storyline
Alarm ecosystem& biodiversity
models
Land use model
Climate changescenarios
Nitrogen deposition and CO2 scenarios
LPJmL
Maps
Maps
Maps
Maps
Figure 3 Information flows and elements(narratives and models) constituting the ALARM(Assessing LArge-scale environmental Risks forbiodiversity with tested Methods) scenarios. Allarrows symbolize information flows includingmaps; differences in shape and colour are toindicate the different sizes, scales and formats ofthe data/maps provided. GINFORS is the GlobalInterindustry Forecasting System; LPJmL is theLund–Potsdam–Jena model for managed lands(Bondeau et al., 2007). Source: Spangenberg et al.(2010), by kind permission of Pensoft Publishers.
Investigating risks to biodiversity
Global Ecology and Biogeography, 21, 5–18, © 2012 Blackwell Publishing Ltd 9
of the three distinct policy directions. Besides environmental
trends and impacts on biodiversity, other relevant trends in
policy domains from economic growth to social politics, demo-
graphic change, and foreign trade and policy relations are part of
the scenario storylines. Thus the scenarios represent semi-
quantitative multi-factor assessments for different policy
options currently being discussed in the EU, based on the best
available analyses and models. To allow the use of ALARM
results in fact-based decision making, the project scenarios and
policy recommendations were presented to a variety of decision
makers in different Directorates General of the European Com-
mission, the EEA, the European Parliament and to civil society
decision makers in addition to the usual dissemination of infor-
mation within the scientific community.
The ALARM scenarios
Simulations have been undertaken with several sectoral models
(econometric, ecosystem, land use) and combined with outputs
from other models (climate). As far as possible, the models have
been coupled using the output of one model as input for
another model and vice versa (Fig. 3). Using the combination of
storylines (narratives) and modelling exercises we integrate
climate scenarios (see Fronzek et al., 2012) with potential yields
from the ecosystem model LPJmL (Sitch et al., 2003; Bondeau
et al., 2007) and a spatially explicit land-use model MOLUSC
with the econometric input–output model GINFORS (see
Stocker et al., 2012). The latter calculates domestic economic
development, combining economic data with energy flows,
resource consumption, emissions and employment plus the
global trade in some 40 categories of goods. Although LPJmL
and GINFORS are global models, the focus of the analysis is one
region, Europe, and how changes there affect the world (and vice
versa).
Not all models have, nor need to have, the same spatial reso-
lution, but in some cases interpolations based on the storylines
were necessary. In particular, unlike climate and land use, eco-
nomic development trends are not spatially explicit and cannot
be disaggregated to a subnational level based on the available
data as requested, e.g. by the MOLUSC model for assessing the
impacts of land-use. Therefore rules were agreed on how to
spatially differentiate population density, migration, income
disparities and income development (based on Rounsevell et al.,
2005).
Core scenarios
In the ALARM project three core scenarios were developed
(Spangenberg, 2007b). These scenarios are: a projection of
status quo policies, a policy-driven liberal scenario and a nor-
mative backcasting (inverse projection) scenario of enhanced
regional mitigation. The following three storylines form the
framework of the ALARM scenarios. The acronyms derive from
the diversity of graminoid species (for an overview of the
assumptions made see Table 1):
1. ‘Business As Might Be Usual’ (BAMBU) is a policy projec-
tion scenario, i.e. a scenario extrapolating the expected cur-
rently known and foreseeable socio-economic and policy
trajectories in EU decision making and assessing their sustain-
ability and biodiversity impacts. Policy decisions already made
in the EU are implemented and enforced, new ones follow the
same development path. Thus BAMBU is not a business as
usual (BAU) scenario, based on extrapolation of past trends,
since recent or upcoming changes in EU policies would have
been ignored in that case. At the national level as well, deregu-
lation and privatization continue except in ‘strategic areas’.
Internationally, there is free trade. Environmental policy is per-
ceived as another technological challenge tackled by innova-
tion, market incentives and some legal regulation. The result is
a rather mixed bag of market liberalism and socio-
environmental sustainability policy.
2. ‘GRowth Applied Strategy’ (GRAS) is a coherently liberal,
growth-focused policy-driven scenario. It describes a future
world based on economic imperatives like primacy of the
market, free trade and globalization. Deregulation (with certain
limits) is a key means, and economic growth a key objective of
politics actively pursued by governments. Environmental policy
focuses on damage repair (supported by liability legislation) and
some preventive action. The latter is designed based on cost–
benefit calculations and thus limited in scale and scope.
3. ‘Sustainable European Development Goal’ (SEDG) is a
backcasting (inverse projection) scenario, and as such is nec-
essarily normative, focused on the achievement of a socially,
environmentally and economically sustainable development.
Based on the primacy of policy it is designed to meet specific
goals and derive the necessary policy measures to achieve
them, for example ending biodiversity loss. It aims at enhanc-
ing the sustainability of societal development by integrated
social, environmental and economic policy. Policy priorities
under SEDG include a competitive economy and a healthy
environment, gender equity and international cooperation.
SEDG represents a precautionary approach, taking measures
under uncertainty to avoid not yet fully known future
damages.
Shock scenarios
Scenarios are often undertaken as exercises to assess the conse-
quences of current decisions using a rather linear, often monoto-
nous, development trajectory without any sudden changes – this
is what computer simulations most easily produce. Such simula-
tions are not capable of illustrating the full range of potential (i.e.
possible and plausible without necessarily being probable)
futures. To better explore this broad spectrum, three ‘shock sce-
narios’ (‘wild cards’ or hazard-driven scenarios) were developed,
considering one shock for each of the three dimensions of sus-
tainability – environmental, economic and social.
These strong yet unexpected (i.e. considered very improbable
at the time when the scenarios were designed at the beginning of
the project in 2004) events have come close to reality in the
mean time (Box 2). Whereas the probability allocated to the
shocks has increased due to new insights, the probability of the
shock scenarios cannot be quantified, as is the case for all sce-
J. H. Spangenberg et al.
Global Ecology and Biogeography, 21, 5–18, © 2012 Blackwell Publishing Ltd10

narios. Figure 4 shows the relations of base scenarios, unex-
pected transformative events (wild cards) and the resulting
shock scenarios. The three shock scenarios are
1. Cooling Under Thermohaline collapse (GRAS-CUT) – the
environmental shock. This describes collapse of the North
Atlantic ocean water circulation (the most familiar part of it
being the Gulf Stream, which warms the western coasts of
Europe) and the resulting cooling of Europe. It is identical to
the GRAS scenario until 2049, followed by a shutdown of the
North Atlantic thermohaline circulation and consequent
cooling. GRAS has been chosen as the base scenario for this
particular shock as such an event is most plausible under a
scenario representing a maximum impact of climate
change.
2. Shock in the Energy price Level (BAMBU-SEL) describes the
economic shock of a permanent quadrupling of the BAMBU
Table 1 Summary of the ALARM scenarios: diverging policies in areas central for biodiversity pressure generation.
Scenario GRAS BAMBU SEDG
Climate projection Corresponds to the IPCC SRES A1FI
storyline and its assumptions
SRES A2 (the best fitting SRES scenario
available at the time of calculation,
though SRES A1B would have fitted
better to past emission trajectories)
SRES B1 (SRES scenario with the
lowest emissions, but not as low as
450 p.p.m. CO2 stabilization assumed
so the SEDG storyline differs
significantly from B1)
EU Common
Agricultural Policy
Dismantling payments for production
(1st pillar) and for rural development
and environment (2nd pillar)
Shift from 1st to 2nd pillar results in
polarisation: intensification of high
yielding locations, neglect of low
yielding ones
Spatially explicit support structure to
maintain (organic) agriculture
throughout the landscape (only the
2nd pillar transfers remain)
EU funds Phasing out, considered as subsidies Focused on infrastructure development
and growth in poor regions
Focused on local green development
and opportunities, education and
employment
Energy policy Efficiency, some renewable energies
based on cost calculations
Efficiency, aiming at 20% reduction of
greenhouse gas emissions by 2020,
80% by 2080. Increase in nuclear and
renewable energy
Aiming at 75% reduction of CO2
emissions by 2050 through savings,
changing consumption patterns and
renewable energies
Transport policy Increased efficiency due to market
pressure, no policy to shift the modal
split or even reduce transport
Technological improvements and change
in share of different modes of
mobility (walking, cycling, trains,
cars, boats, planes) – modal split
Transport reduction priority, plus
modal split change (through pricing
and infrastructure supply), technical
improvements
EU chemicals
policy: REACH
Focus on innovation and
competitiveness.
REACH not rigorously implemented
REACH implemented REACH plus; filling gaps, e.g. for
nano-materials, endocrine
disruptors, metals.
Trade policy Strong support for World Trade
Organization and free trade
Promoting free trade except in
‘strategic areas’
Global sourcing reduced for cost
reasons; phytosanitarian controls
IPCC, Intergovernmental Panel on Climate Change; SRES, Special Report on Emissions Scenarios; REACH, registration, evaluation, authorization andrestriction of chemical substances; SEDG, sustainable European development goal.
Box 2: ‘shocks’
A shock is any event that comes unexpectedly and has the
capability of changing the developmental trajectory of a
system. Then a new direction of development emerges, start-
ing at the shock point and distinguishing the shock scenario
from its original, base scenario. Thus in the pre-shock period,
a shock scenario is identical to the base scenario but then
diverges from it along a new, hazard-induced trajectory.
The ‘surprise factor’ sounds simple, but is complex: the
reasons for this usually consist of a mix of different factors like
a lack of knowledge, the inherent uncertainty of future devel-
opments in complex systems, or plain human ignorance. In
other words: ignoring emerging threats in decision making
can reduce the resilience and enhance the vulnerability of a
system, potentially turning what could have been a minor
additional pressure into a substantive shock.
Because they assume deviations from a linear develop-
ment trend, shocks are not as easily modelled as other sce-
narios, and commonly comprise simple storylines.
Nonetheless, shock scenarios can support the development
of surveillance systems for the identification of new threats
and for dealing with them adequately from the very begin-
ning of their emergence – they are special experiments
exploring the impacts of artificially introduced hazards,
simulating in a semi-quantitative narrative three singular
events with widespread consequences.
Adapted from Streets & Glantz (2000) and Steinmüller &
Steinmüller (2004)
Investigating risks to biodiversity
Global Ecology and Biogeography, 21, 5–18, © 2012 Blackwell Publishing Ltd 11

energy price, as expected when peak oil, the global maximum of
oil production, has been passed (the USA had a taste of that in
2008 when the oil price rose from $20 to $120 per barrel, but not
so in Europe, where the price only increased from about €35 to
about €75 per barrel due to the increase in the euro exchange
rate).
3. ContAgious Natural Epidemic (BAMBU-CANE) is the social
shock, a pandemic out of control (WHO, 2005). Again, we had
a taste of that, with Chinese bird flu in 2006 and the Mexican
swine flu in 2009. Both BAMBU-SEL and BAMBU-CANE have
been designed as deviations from the ‘intermediate scenario’
BAMBU, as no clear ex-ante information was available regarding
which scenario would make either of the shocks more probable
(unlike for GRAS-CUT). Similarly, no assessment of how the
differences between the scenarios influence the impacts of
shocks is available for the current state of research – otherwise it
would have been tempting to run the same shocks on all three
base scenarios.
LESSONS LEARNT
Climate change
Climate scenarios for ALARM consist of six projections from
coupled atmosphere–ocean general circulation models
(AOGCMs) operating at a global scale and a fairly coarse spatial
resolution (typically 200–300 km) and one projection from a
regional climate model (RCM), which downscaled AOGCM
outputs to a finer (50 km) resolution over Europe. The scenarios
embrace a number of key climate variables that are commonly
used to study the impacts of climate on biodiversity. Averaged
over Europe, the ALARM scenarios describe changes in mean
annual temperature by the end of the 21st century relative to
1961–90 that range between 3.0 °C and 6.1 °C (Fronzek et al.,
2012). Changes in annual precipitation are between –1% and
6% with wetter conditions in northern Europe in winter and
drier conditions in southern Europe in summer.
The ALARM climate scenarios are representative for the
range of changes projected with a larger ensemble of climate
model simulations employed by the IPCC in their Fourth
Assessment Report (AR4; IPCC, 2007), while still being a man-
ageable set of scenarios for studying the impacts of climate
change on biodiversity.
The BAMBU scenario is represented by three simulations
with AOGCMs and one RCM simulation. This offers a fair
representation of model uncertainties for the same emissions
scenario (SRES A2). The RCM projection also addresses uncer-
tainties attributable to processes operating at sub-AOGCM
scale. Since it is known that the spatial pattern of changes in
temperature and (to a lesser extent) precipitation scales quite
closely relate to different emissions scenarios (cf. Christensen
et al., 2007, p. 873), it was considered sufficient to represent the
between-model uncertainties for only one of the emissions sce-
narios while portraying uncertainties in the climate response
to different emissions by using results from the same AOGCM
(also used in the BAMBU scenario) for all three scenarios.
Finally, the GRAS-CUT scenario applied results from a special
experiment to simulate the climatic effects of an abrupt shut-
down of the North Atlantic thermohaline circulation (Vellinga
& Wood, 2008) that was conducted with the same AOGCM
supplying the climate scenario for the GRAS scenario. This sce-
nario, imposed in 2050, produces sharp cooling and drying
GRAS-CUT
Climate Shock
EconomicShock
Social Shock
BAMBU-SEL
BAMBU-CANE
GRAS: Growth Applied Strategy
SEDG: Sustainable European Development
Goal
BAMBU: Business as Might Be Usual
NARRATIVES, STORYLINES
Figure 4 ALARM (Assessing LArge-scaleenvironmental Risks for biodiversity with testedMethods) core and shock scenarios; shocks areconceptualized as deviations from core scenariotrajectories following an unforeseentransformative event as described in the main text.GRAS-CUT, cooling under thermohaline collapse;BAMBU-SEL, shock in energy price level,BAMBU-CANE, contagious natural epidemic.Source: Spangenberg et al. (2010), by kindpermission of Pensoft Publishers.
J. H. Spangenberg et al.
Global Ecology and Biogeography, 21, 5–18, © 2012 Blackwell Publishing Ltd12

over north-west Europe relative both to the preceding
(warming) conditions up to 2049 under the GRAS
scenario and to conditions observed in the period 1961–90.
The most extreme impacts include a drastic shortening in the
thermal growing season of over 3 months in Scotland and
Norway.
Socio-economics
Since the socio-economic scenarios only reflect changes that are
expressed in economic parameters (in the case of GINFORS also
energy and material flow inside the economic system, but not
ecological processes), these trends and their impacts on biodi-
versity, ecosystems and their services cannot be reflected directly
by the econometric model. For instance, changes in temperature
and precipitation must be translated into agricultural losses or
health costs, for example, before they can be taken into account.
Shortages of resources are expressed as price increases, but abso-
lute limits to their availability cannot be modelled (Scrieciu,
2007). Consequently, the user of such models should be aware of
their limitations: societies and economies are complex evolving
systems, with system elements (agents) able to reflect system
trends and adjust their behaviour accordingly. The result is a
system with changing structures and unpredictable behaviour in
the medium to long term. Thus, econometric models which
allow for structural change can only be meaningfully run over a
limited time period of 20 years or less. In ALARM, the economic
scenarios were modelled only until 2020, with some key vari-
ables projected (i.e. without taking further structural change
into account) until 2050.
The economic research results (for more details see Stocker
et al., 2012) confirm the limited direct economic impacts of
climate change in the simulation period of the economic model
for all scenarios.1 Interpreting the model data, the storyline con-
cludes that adaptation might happen rather easily in the busi-
ness sector because the speed of change in the economic system
is so much greater than in the geosphere, enabling entrepreneurs
to relatively easily accommodate these changes in the environ-
ment into the investment planning of the business cycle. Even
the indirect effects such as increasing risk of water deficits have
no significant economic impact on the macro-scale of national
economies the model represents. Thus it is not plausible to hope
that price signals would lead to an automatic market reaction
mitigating climate change, or that the business sector would act
on its own behalf for cost reasons. Instead, dedicated political
decisions are needed to set the right framework for climate
change mitigation.
Furthermore, the simulation runs show that even a radical
mitigation policy in Europe results in nothing more than a delay
of a few years in global warming if other parts of the world do
not follow suit. The conclusion for climate policy is that as the
impacts – for example on biodiversity, but also on livelihoods in
the Global South are serious, and thus action must be taken
urgently and comprehensively – Europe is well advised to act as
a frontrunner. International cooperation must then make sure
that other parts of the world follow suit – maybe like-minded
countries first, depending on policy processes that develop out
of the apparent failure of the Copenhagen climate policy
summit to agree on binding commitments supporting the
politically agreed target of limiting the average global tempera-
ture increase to 2 °C (IISD, 2009).
Land use
The results of the land-use scenario development show different
levels and spatial patterns of land-use change for the three sce-
narios and the shocks, although the basic land-use change trends
are the same for each of them (for more details see Box 1 on
land-use modelling).
Some of the largest changes involve the abandonment of agri-
cultural land (cropland and grassland turning into surplus land,
see Fig. 5), for which greater changes are observed for GRAS
(due to imported substitutes) than for BAMBU and the lowest
for SEDG (a result of assumed policies against large-scale land
abandonment). Some of the abandoned agricultural land is used
for agrofuels and forestry, without, however, going to extremes
regarding the extension of agrofuel areas.
Regardless of these transitions, important areas of surplus
land result from the assumed increases in agricultural produc-
tivity for all three scenarios, with again larger surplus areas
occurring in GRAS (more imports) than BAMBU (leading to a
polarization between highly fertile and less productive areas)
and SEDG (assuming a transition to organic agriculture and no
complete abandonment of any region).
According to the ALARM risk assessment, the impacts on
biodiversity are mixed (see Hickler et al. 2012 and Schweiger et
al., 2012). Taking the climate, economic and land-use drivers
and their interaction into account, the scenarios demonstrate
that under a ‘markets first’ scenario (GRAS), although environ-
mental policy is not abandoned its impacts are limited and
biodiversity continues to vanish in the EU. With BAMBU,
including for instance the implementation of the EU REACH
(regulation on the Registration, Evaluation and Authorization
of CHemicals) system and ongoing reforms of the Common
Agricultural Policy (CAP), the loss of biodiversity is slowed but
not halted, let alone reversed. However, the likelihood of
repeating past mistakes of environmental contamination with
regards to environmental chemicals in general (Maxim &
Spangenberg, 2009) and persistent organic pollutants (POPs)
such as pesticides, flame retardants and insulators/refrigerants
in particular is greatly reduced under REACH, while the
impacts of climate and land-use change on the environmental
fate and behaviour of historic POPs is likely to be negligible
(Paul et al., 2012). In a sustainable development scenario like
SEDG, with the combined effects of effective regulation and
sustainable development goals, it is possible to halt or at least
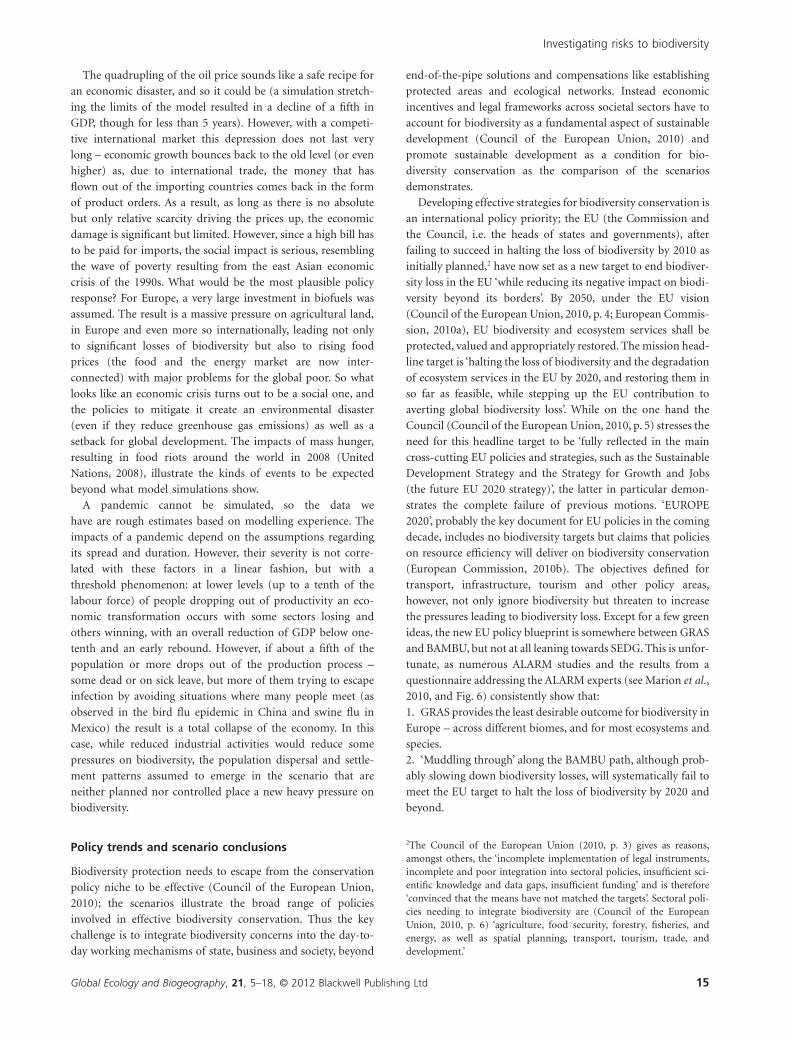
significantly slow the rate of biodiversity loss (Fig. 5 shows a
1Nordhaus (1990) finds the loss of 3 to 8 months of economic growthover a 50–100 year period. Stern (2006), on the other hand, expecteconomic damage worse than from a world war: economic scenariosdepend heavily on the assumptions made.
Investigating risks to biodiversity
Global Ecology and Biogeography, 21, 5–18, © 2012 Blackwell Publishing Ltd 13

comparison of the scenarios); in some cases a regeneration of
biodiversity can even be expected.
One reason for these different results is that in both GRAS
and BAMBU preservation of biodiversity is dealt with as an
additional policy issue, and not rigorously implemented as a
priority in all policy domains.
Shock(ing) lessonsThe shock scenarios brought some surprising results: a collapse
of the Gulf Stream, if occurring after 2050, has no major impact
on Europe’s economy, but is a stress factor for its ecosystems.
Peak oil leads to a serious economic crisis when the oil price level
suddenly and permanently peaks, but after a few years of more
or less severe recession, the economy returns to its former
growth path. Social cohesion is severely affected along with
(assuming an additional focus on agrofuels) global and Euro-
pean biodiversity and the food security of the global poor. For a
pandemic, depending on the assumptions regarding its spread
and duration, the impact varies between minor economic losses
and a total collapse of the economy and society.
Cropland: Baseline 2000
Cropland-BAMBU: absolute changes 2050-2000
Cropland-GRAS: absolute changes 2050-2000
Cropland-SEDG: absolute changes 2050-2000
0 %
0 %
0 %
0 %
50 %
-50 %
-50 %
-50 %
100 %
-100 %
-100 %
-100 %
Figure 5 ALARM (Assessing LArge-scale environmental Risks for biodiversity with tested Methods) results: percentages of surplus landunder different scenarios. Due to different economic dynamics and land-use policies, the increase in area of surplus land due to landabandonment develops differently between the scenarios. Source: Reginster et al. (2010), by kind permission of Pensoft Publishers.
J. H. Spangenberg et al.
Global Ecology and Biogeography, 21, 5–18, © 2012 Blackwell Publishing Ltd14
The quadrupling of the oil price sounds like a safe recipe for
an economic disaster, and so it could be (a simulation stretch-
ing the limits of the model resulted in a decline of a fifth in
GDP, though for less than 5 years). However, with a competi-
tive international market this depression does not last very
long – economic growth bounces back to the old level (or even
higher) as, due to international trade, the money that has
flown out of the importing countries comes back in the form
of product orders. As a result, as long as there is no absolute
but only relative scarcity driving the prices up, the economic
damage is significant but limited. However, since a high bill has
to be paid for imports, the social impact is serious, resembling
the wave of poverty resulting from the east Asian economic
crisis of the 1990s. What would be the most plausible policy
response? For Europe, a very large investment in biofuels was
assumed. The result is a massive pressure on agricultural land,
in Europe and even more so internationally, leading not only
to significant losses of biodiversity but also to rising food
prices (the food and the energy market are now inter-
connected) with major problems for the global poor. So what
looks like an economic crisis turns out to be a social one, and
the policies to mitigate it create an environmental disaster
(even if they reduce greenhouse gas emissions) as well as a
setback for global development. The impacts of mass hunger,
resulting in food riots around the world in 2008 (United
Nations, 2008), illustrate the kinds of events to be expected
beyond what model simulations show.
A pandemic cannot be simulated, so the data we
have are rough estimates based on modelling experience. The
impacts of a pandemic depend on the assumptions regarding
its spread and duration. However, their severity is not corre-
lated with these factors in a linear fashion, but with a
threshold phenomenon: at lower levels (up to a tenth of the
labour force) of people dropping out of productivity an eco-
nomic transformation occurs with some sectors losing and
others winning, with an overall reduction of GDP below one-
tenth and an early rebound. However, if about a fifth of the
population or more drops out of the production process –
some dead or on sick leave, but more of them trying to escape
infection by avoiding situations where many people meet (as
observed in the bird flu epidemic in China and swine flu in
Mexico) the result is a total collapse of the economy. In this
case, while reduced industrial activities would reduce some
pressures on biodiversity, the population dispersal and settle-
ment patterns assumed to emerge in the scenario that are
neither planned nor controlled place a new heavy pressure on
biodiversity.
Policy trends and scenario conclusions
Biodiversity protection needs to escape from the conservation
policy niche to be effective (Council of the European Union,
2010); the scenarios illustrate the broad range of policies
involved in effective biodiversity conservation. Thus the key
challenge is to integrate biodiversity concerns into the day-to-
day working mechanisms of state, business and society, beyond
end-of-the-pipe solutions and compensations like establishing
protected areas and ecological networks. Instead economic
incentives and legal frameworks across societal sectors have to
account for biodiversity as a fundamental aspect of sustainable
development (Council of the European Union, 2010) and
promote sustainable development as a condition for bio-
diversity conservation as the comparison of the scenarios
demonstrates.
Developing effective strategies for biodiversity conservation is
an international policy priority; the EU (the Commission and
the Council, i.e. the heads of states and governments), after
failing to succeed in halting the loss of biodiversity by 2010 as
initially planned,2 have now set as a new target to end biodiver-
sity loss in the EU ‘while reducing its negative impact on biodi-
versity beyond its borders’. By 2050, under the EU vision
(Council of the European Union, 2010, p. 4; European Commis-
sion, 2010a), EU biodiversity and ecosystem services shall be
protected, valued and appropriately restored. The mission head-
line target is ‘halting the loss of biodiversity and the degradation
of ecosystem services in the EU by 2020, and restoring them in
so far as feasible, while stepping up the EU contribution to
averting global biodiversity loss’. While on the one hand the
Council (Council of the European Union, 2010, p. 5) stresses the
need for this headline target to be ‘fully reflected in the main
cross-cutting EU policies and strategies, such as the Sustainable
Development Strategy and the Strategy for Growth and Jobs
(the future EU 2020 strategy)’, the latter in particular demon-
strates the complete failure of previous motions. ‘EUROPE
2020’, probably the key document for EU policies in the coming
decade, includes no biodiversity targets but claims that policies
on resource efficiency will deliver on biodiversity conservation
(European Commission, 2010b). The objectives defined for
transport, infrastructure, tourism and other policy areas,
however, not only ignore biodiversity but threaten to increase
the pressures leading to biodiversity loss. Except for a few green
ideas, the new EU policy blueprint is somewhere between GRAS
and BAMBU, but not at all leaning towards SEDG. This is unfor-
tunate, as numerous ALARM studies and the results from a
questionnaire addressing the ALARM experts (see Marion et al.,
2010, and Fig. 6) consistently show that:
1. GRAS provides the least desirable outcome for biodiversity in
Europe – across different biomes, and for most ecosystems and
species.
2. ‘Muddling through’ along the BAMBU path, although prob-
ably slowing down biodiversity losses, will systematically fail to
meet the EU target to halt the loss of biodiversity by 2020 and
beyond.
2The Council of the European Union (2010, p. 3) gives as reasons,amongst others, the ‘incomplete implementation of legal instruments,incomplete and poor integration into sectoral policies, insufficient sci-entific knowledge and data gaps, insufficient funding’ and is therefore‘convinced that the means have not matched the targets’. Sectoral poli-cies needing to integrate biodiversity are (Council of the EuropeanUnion, 2010, p. 6) ‘agriculture, food security, forestry, fisheries, andenergy, as well as spatial planning, transport, tourism, trade, anddevelopment.’
Investigating risks to biodiversity
Global Ecology and Biogeography, 21, 5–18, © 2012 Blackwell Publishing Ltd 15

3. From a biodiversity point of view, SEDG represents a signifi-
cant step in the right direction, although not sufficient in every
respect (in some biomes some species and ecosystems are still
lost).
For EU policies, this implies that although certain species and
ecosystems may be stabilized under the EU policies modelled in
the BAMBU scenario, the foreseen future policies are some-
where between GRAS and BAMBU and thus will not be able to
deliver on the new 2020 targets. This general trend is unambigu-
ous, despite significant differences between different species
groups and between different ecosystems in different biomes.
As most species and ecosystems benefit from a change in policy
trajectory towards a more rigorous sustainability policy
(SEDG), mainstreaming sustainable development in EU policies
has to be considered a necessary condition for biodiversity con-
servation in the future. Simultaneously, current sustainability
policies must be adjusted to better integrate biodiversity
conservation.
ACKNOWLEDGEMENTS
The authors are indebted to the other members of the ALARM
consortium, and in particular to the modelling and the socio-
economic teams (Volker Hammen, Thomas Hickler, Laura
Maxim, Iliana Monterroso, Martin O’Connor, Beatriz
Rodriguez-Labajos, Marco Vighi) for contributions to the
analysis presented here.
This paper is the result of work in the FP 6 Integrated Project
‘ALARM’ (Assessing LArge-scale environmental Risks for biodi-
versity with tested Methods), grant number GOCE-CT-2003-
506675 (see http://www.alarmproject.net; Settele et al., 2005).
REFERENCES
Alcamo, J. (2001) Scenarios as tools for international environmen-
tal assessments. EEA Expert Corner Report Prospects and
Scenarios No. 5.Office for the Official Publications of the
European Communities, Luxembourg.
Bondeau, A., Smith, P., Zaehle, S., Schaphoff, S., Lucht, W.,
Cramer, W., Gerten, D., Lotze-Campen, H., Müller, C., Reich-
stein, M. & Smith, B. (2007) Modelling the role of agriculture
for the 20th century global terrestrial carbon balance. Global
Change Biology, 13, 679–706.
Christensen, J.H., Hewitson, B., Busuioc, A., Chen, A.,
Gao, X., Held, I., Jones, R., Kolli, R.K., Kwon, W.-T.,
Laprise, R., Magaña Rueda, V., Mearns, L., Menéndez, C.G.,
Räisänen, J., Rinke, A., Sarr, A. & Whetton, P. (2007)
Regional climate projections. Climate change 2007: the physi-
cal science basis. Contribution of Working Group I to the
Fourth Assessment Report of the Intergovernmental Panel on
Climate Change (ed. by S. Solomon, D. Qin, M. Manning, Z.
Chen, M. Marquis, K.B. Averyt, M. Tignor and H.L. Miller),
pp. 847–940. Cambridge University Press, Cambridge,
UK.
12 %
49 %
38 %
1 %0 %
GRAS compared with SEDG
0 %
36 %
62 %
2 %0 %
BAMBU compared with SEDG
4 %
51 %
41 %
4 %0 %
Large increaseSmall increaseNo differenceSmall decreaseLarge decrease
GRAS compared with BAMBU
Figure 6 Risk of biodiversity loss in Europe, comparison of scenarios, aggregated over species groups. Results from a questionnaireaddressing the scientists participating in ALARM (Assessing LArge-scale environmental Risks for biodiversity with tested Methods).Compared with BAMBU (business as might be usual) or SEDG (sustainable European development goal), GRAS (growth applied strategy)causes an increasing risk of biodiversity loss, while SEDG decreases the risk. Unaffected species include those not at risk today. From abiodiversity conservation point of view, a clear hierarchy emerges: SEDG > BAMBU > GRAS, although for a minority of cases (1–4%) theopposite is the case, with a small decrease in risk for the less sustainable scenario. Please note that large decreases do not occur; the categoryis 0% in all cases. Source: Spangenberg et al. (2010), by kind permission of Pensoft Publishers.
J. H. Spangenberg et al.
Global Ecology and Biogeography, 21, 5–18, © 2012 Blackwell Publishing Ltd16

Chytrý, M., Wild, J., Pyšek, P., Jarošík, V., Dendoncker, N., Regin-
ster, I., Pino, J., Maskell, L.C., Vilà, M., Kühn, I., Spangenberg,
J.H. & Settele, J. (2012) Projecting trends in plant invasions in
Europe under different scenarios of future land-use change:
policy orientations will not reduce invasions. Global Ecology
and Biogeography, 21, 75–87 (this issue).
Council of the European Union (2010) Biodiversity: post-2010.
EU and global visions and targets and international ABS regime.
Council (Environment) Conclusions. Council Document
7536/10.Council of the European Union, Brussels.
Dow, K. & Carbone, G. (2007) Climate science and decision
making. Geography Compass, 1/3, 302–324.
EEA (2000) Environmental signals 2000. Environmental
Assessment Report No 6. European Environment Agency,
Office for Official Publications of the European Union,
Luxembourg.
EEA (2005) European environment outlook. EEA Report 4/2005.
European Environment Agency, Copenhagen.
EEA (2007) The pan-European environment: glimpses into an
uncertain future. EEA Report 4/2007. European Environment
Agency, Copenhagen.
EEA (2009) Looking back on looking forward: a review of evalu-
ative scenario literature. EEA Technical Report No 3/2009.
European Environment Agency, Copenhagen.
European Commission (2010a) Options for an EU vision and
target for biodiversity beyond 2010. Communication from the
Commission to the European Parliament, the Council, the
European Economic and Social Committee and the Commit-
tee of the Regions COM(2010)4 fin. European Commission,
Brussels.
European Commission (2010b) EUROPE 2020. A European
Strategy for smart, sustainable and inclusive growth. Commu-
nication from the Commission COM(2010)2020. European
Commission, Brussels.
Fronzek, S., Carter, T.R. & Jylhä, K. (2012) Representing two
centuries of past and future climate for assessing risks to
biodiversity in Europe. Global Ecology and Biogeography, 21,
19–35 (this issue).
Funtowicz, S.O. & Ravetz, J.R. (1993) Science for the post-
normal age. Futures, 25, 739–755.
Funtowicz, S.O. & Ravetz, J.R. (1994) The worth of a songbird:
ecological economics as a post-normal science. Ecological Eco-
nomics, 10, 197–207.
Hickler, T., Vohland, K., Feehan, J., Miller, P.A., Smith, B., Costa,
L., Giesecke, T., Fronzek, S., Carter, T.R., Cramer, W., Kühn, I.
& Sykes, M.T. (2012) Projecting the future distribution of
European potential natural vegetation zones with a general-
ized, tree species-based dynamic vegetation model. Global
Ecology and Biogeography, 21, 50–63 (this issue).
IISD (2009) Fifteenth conference of the Parties to the UN Frame-
work Convention on Climate Change (UNFCCC) and Fifth
Meeting of the Parties to the Kyoto Protocol (COP 15 and COP/
MOP 5). ENB Summary Report. International Institute for
Sustainable Development, Winnipeg, Canada. Available at:
http://www.iisd.ca/climate/cop15/ (accessed 22 December
2009).
IPCC (2007) Climate change 2007: the physical science basis.
Contribution of Working Group I to the Fourth Assessment
Report of the Intergovernmental Panel on Climate Change (ed.
by S. Solomon, D. Qin, M. Manning, Z. Chen, M. Marquis,
K.B. Averyt, M. Tignor and H.L. Miller). Cambridge Univer-
sity Press, Cambridge, UK.
Jylhä, K., Tuomenvirta, H., Ruosteenoja, K., Niemi-Hugaerts, H.,
Keisu, K. & Karhu, J.A. (2010) Observed and projected future
shifts of climatic zones in Europe, and their use to visualize
climate change information. Weather, Climate, and Society, 2,
148–167.
Kuldna, P., Peterson, K., Reginster, I. & Dendoncker, N. (2009)
Agricultural land use and biodiversity changes in the new
European Union member states. Assessing biodiversity risks
with socio-economic methods: the ALARM experience (ed. by B.
Rodriguez-Labajos, J.H. Spangenberg, L. Maxim, J. Martinez-
Alier, R. Binimelis, N. Gallai, P. Kuldna, I. Monterroso, K.
Peterson and M. Uustal), pp. 293–326. Pensoft Publishers,
Sofia and Moscow.
Marion, G., Grabaum, R., Grescho, V., Butlaer, A., Bierman, S.,
Douget, J.-M., Hammen, V., Hickler, T., Hulme, P.E., Maxim,
L., Omann, I., Peterson, K., Potss, S.G., Reginster, I., Settele, J.,
Spangenberg, J.H. & Kühn, I. (2010) Biodiversity risk assess-
ment for Europe – putting it all together. Atlas of biodiversity
risk (ed. by J. Settele, L. Penev, T. Georgiev, R. Grabaum, V.
Grobelnki, V. Hammen, S. Klotz and I. Kühn), pp. 252–253.
Pensoft Publishers, Sofia and Moscow.
Maxim, L. & Spangenberg, J.H. (2009) Driving forces of chemi-
cal risks for European biodiversity. Ecological Economics, 69,
43–54.
Maxim, L., Spangenberg, J.H. & O’Connor, M. (2009) An analy-
sis of risks for biodiversity under the DPSIR framework. Eco-
logical Economics, 69, 12–23.
Nakicenovic, N., Alcamo, J. & Davis, G. et al. (eds) (2000) Emis-
sions scenarios. A special report of Working Group III of the
Intergovernmental Panel on Climate Change. Cambridge Uni-
versity Press, Cambridge.
Nicholson-Cole, S.A. (2005) Representing climate change
futures: a critique on the use of images for visual com-
munication. Computers, Environment and Urban Systems, 29,
255–273.
Nordhaus, W.D. (1990) Greenhouse economics – count before
you leap. The Economist, 316(7662), 19–22.
Paul, A.G., Hammen, V.C., Hickler, T., Karlson, U.G., Jones, K.C.
& Sweetman, A.J. (2012) Potential implications of future
climate and land-cover changes for the fate and distribution of
persistent organic pollutants in Europe. Global Ecology and
Biogeography, 21, 64–74 (this issue).
Reginster, I., Rounsevell, M., Butler, A. & Dedoncker, N. (2010)
Land use change scenarios for Europe. Atlas of biodiversity risk
(ed. by J. Settele, L. Penev, T. Georgiev, R. Grabaum, V.
Grobelnik, V. Hammen, S. Klotz, M. Kotarac and I. Kühn),
pp. 100–105. Pensoft Publishers, Sofia and Moscow.
Reginster, I., Rounsevell, M., Riguelle, F., Carter, T.R., Fronzek,
S., Omann, I., Spangenberg, J.H., Stocker, A., Bondeau, A. &
Hickler, T. (in press) The effect of alternative socio-economic
Investigating risks to biodiversity
Global Ecology and Biogeography, 21, 5–18, © 2012 Blackwell Publishing Ltd 17

and political strategies on European land use from 2006 to
2080. Land Use Policy.
Rounsevell, M., Reginster, I., Aráujo, M.B., Carter, T.R., Dedon-
cker, N., Ewert, F., House, J.I., Kankaanpäa, S., Leemans, R.,
Metzger, M.J., Schmit, C., Smith, P. & Tuck, G. (2005) A coher-
ent set of future land use change scenarios for Europe. Agri-
culture, Ecosystems and Environment, 114, 57–68.
Schweiger, O., Settele, J., Kudrna, O., Klotz, S. & Kühn, I. (2008)
Climate change can cause spatial mismatch of trophically
interacting species. Ecology, 89, 3472–3479.
Schweiger, O., Heikkinen, R.K., Harpke, A., Hickler, T., Klotz, S.,
Kudrna, O., Kühn, I., Pövry, J. & Settele, J. (2012) Increasing
range mismatching of interacting species under global change
is related to their ecological characteristics. Global Ecology and
Biogeography, 21, 88–99 (this issue).
Scrieciu, S.S. (2007) The inherent dangers of using computable
general equilibrium models as a single integrated modelling
framework for sustainability impact assessment. Ecological
Economics, 60, 678–684.
Seppelt, R., Kühn, I., Klotz, S., Kabisch, S., Schloter, M., Auge, H.,
Görg, C., Frank, K. & Jax, K. (2009) Land use options – strat-
egies and adaptation to global change. GAIA – Ecological Per-
spectives for Science and Society, 18, 77–80.
Settele, J., Hammen, V., Hulme, P.E. et al. (2005) ALARM:
assessing large scale environmental risks for biodiversity with
tested methods. GAIA – Ecological Perspectives for Science and
Society, 14, 69–72.
Settele, J., Kühn, I., Klotz, S., Hammen, V. & Spangenberg, J.
(2007) Is the EC afraid of its own visions? Science, 315, 1220.
Sitch, S., Smith, B., Prentice, I.C., Arneth, A., Bondeau, A.,
Cramer, W., Kaplan, J., Levis, S., Lucht, W., Sykes, M.T.,
Thonicke, K. & Venevsky, S. (2003) Evaluation of ecosystem
dynamics, plant geography and terrestrial carbon cycling in
the LPJ dynamic vegetation model. Global Change Biology, 9,
161–185.
van der Sluijs, J. (ed.) (2002) Management of uncertainty in
science for sustainability. Copernicus Institute, Utrecht Uni-
versity, Utrecht.
Spangenberg, J.H. (2005) Economic sustainability of the
economy: concepts and indicators. International Journal of
Sustainable Development, 8, 47–64.
Spangenberg, J.H. (2007a) Biodiversity pressures and the
driving forces behind. Ecological Economics, 61, 146–158.
Spangenberg, J.H. (2007b) Integrated scenarios for assessing
biodiversity risks. Sustainable Development, 15, 343–356.
Spangenberg, J.H., Pfahl, S. & Deller, K. (2002) Towards indica-
tors for institutional sustainability: lessons from an analysis of
Agenda 21. Ecological Indicators, 2, 61–77.
Spangenberg, J.H., Fronzek, S., Hammen, V., Hickler, T., Jäger, J.,
Jylhä, K., Maxim, L., Monterroso, I., O’Connor, M., Omann,
I., Reginster, I., Rodriguez-Labajos, B., Rounsevell, M., Sykes,
M.T., Vighi, M. & Settele, J. (2010) The ALARM scenarios.
Storylines and simulations for analysing risks to biodiversity
in Europe. Atlas of biodiversity risk (ed. by J. Settele, L. Penev,
T. Georgiev, R. Grabaum, V. Grobelnki, V. Hamme, S. Klotz
and I. Kühn), pp. 10–15. Pensoft Publishers, Sofia and
Moscow.
Stanners, D. (in press) Indicators as a tool for policy learning:
experiences moving from data to information. Models and
Indicators for Sustainable Development (ed. by J.H. Spangen-
berg and N. Gosh), Springer, Berlin.
Steinmüller, A. & Steinmüller, K. (2004) Wild cards, 2nd edn.
Murmann, Hamburg.
Stern, N. (ed.) (2006) The Stern Review report: the economics of
climate change. HM Government, London.
Stocker, A., Omann, I. & Jäger, J. (2012) The socio-economic
modelling of the ALARM scenarios with GINFORS: results
and analysis for selected European countries. Global Ecology
and Biogeography, 21, 36–49 (this issue).
Streets, D.G. & Glantz, M.H. (2000) Exploring the concept of
climate surprise. Global Environmental Change, 10, 97–107.
United Nations (2008) High level task force on the food security
crisis – progress report April 2008–October 2008. United
Nations, New York.
Vellinga, M. & Wood, R. (2008) Impacts of thermohaline circu-
lation shutdown in the twenty-first century. Climatic Change,
91, 43–63.
WHO (2005) Epidemic and pandemic alert and response (EPR).
United Nations, New York.
BIOSKETCH
The ALARM scenario group was formed in the course
of the ALARM project (for details see http://
www.arlarmproject.net) to develop coherent scenarios
and integrate the inputs from different disciplines. All
participants have worked with models and scenarios in
the past; the ALARM scenarios are their joint result.
J.H.S. led the storyline formulation and the integra-
tion of the components into coherent narratives, with
input from all other team members, and particular
support from J.S. and J.J. The climate scenario data
were generated and provided by T.R.C., S.F. and K.J.,
A.B., I.R. and M.R. contributed the land-use model and
harmonized it with the econometric model runs, which
were designed by A.S., J.H.S. and I.O. The last crucial
step, linking the overall developments to impacts on
biodiversity, was contributed by M.T.S., A.P., O.S. and
I.K.
Editor: Wolfgang Cramer
J. H. Spangenberg et al.
Global Ecology and Biogeography, 21, 5–18, © 2012 Blackwell Publishing Ltd18