special report connecting the dots with predictive analytics
DESCRIPTION
Connecting The Dots with Predictive AnalysticsTRANSCRIPT

Special Report
Connecting the Dots with Predictive AnalyticsBig Data is full of surprises and the low-hanging fruit is plentiful

Connecting the Dots with Predictive AnalyticsBig Data is full of surprises, and the low-hanging fruit is plentiful
By Sheila Kennedy, contributing editor, Plant Services
Predictive maintenance (PdM) programs present an excellent opportunity to gather data on both machine and human behavior, although raw data has its limits. Companies are beginning to take the next step of converting their condition monitoring data into proactive intelligence.
These early adopters of Big Data and performance analytics are starting to comprehend how comparing and trending condition monitoring, manufacturing, and financial data sets can drastically reduce maintenance spending and improve operational performance.
A surprising number of their finds have been completely unexpected, and correcting these issues is yielding great business benefits. It only makes sense – if a significant problem was known, someone would have already fixed it. It only takes one or two surprise finds before it piques the imagination and opens the mind to what else can be accomplished.
Big Data is also unique in that it introduces awareness of the human element. The cultural perspective is necessary to understand the nature of unplanned maintenance,
Connecting the Dots with Predictive Analytics | 2

Connecting the Dots with Predictive Analytics | 3
unplanned capital expenditures, and regional idiosyncrasies across a corporate fleet.
From the experiences gained by market leaders so far we can learn the true potential of reliability and maintainability data, how it can best be presented, and how wins are getting noticed in the corporate suite and driving these companies toward operational excellence.
PdM data connects the C-suite with the manufacturing floorBig Data enriches information that already exists across the enterprise. “When you combine basic machine information with available financial and maintenance compliance data, the results are really revealing,” says Tyler Pietri, program engineer at Azima DLI. “The ability to assimilate, extricate, and share strategically important information with the corporate team helps them to understand what positive steps and missteps are occurring on the plant floor.”
“Tracking key performance metrics that align with corporate objectives and priorities allows plant managers to communicate in terms valued by the corporate suite,” explains Heather DeJesus, director of technical services at Azima DLI. “As successes are won and credibility is solidified, plant managers may begin to set their own goals and present them up the ladder.”
For nearly 40 years, PdM has been equated with tangible products and the data gleaned from those products. Its value is understood on the plant floor but not easily communicated to upper management. By focusing on performance instead of products, the Big Data revolution has opened the doors to the intangible value of predictive analytics.
“It’s a method to reveal the dramatic impact that PdM programs have on things like costs, reliability, output, and safety. It is not a tasking tool. It’s a management tool by virtue of the many ways you can look at the data sets to tease different information out of it,” remarks Burt Hurlock, CEO at Azima DLI.
Big Data is unique in that it
introduces awareness of the human element.

Big Data enriches information that
already exists across the
enterprise.
Connecting the Dots with Predictive Analytics | 4
Most users are still in the first step of PdM adoption and focused on saving costs, extending equipment life, and reducing downtime on an asset or plant basis. The second step is that breakthrough moment when companies realize they can do this on a very large scale.
“Big Data is the trigger for that ‘aha’ moment,” adds Hurlock, “as it allows companies to benchmark themselves in all kinds of ways they’ve not conceived of before – against themselves, against an industry composite, by asset type – and even get smarter about what brands to purchase. There are an almost unlimited number of ways to look at the data. You go from very generic standard maintenance metrics to more strategic culturally-driven metrics.”
Evidence of ROI derived from Big Data elevates the conversation from tactical to strategic.
Simple Problems Defined
Sample data for illustrative purposes only.
Data Collection
Compliance
UnplannedCapEx
100%
BU1 BU2 BU3 BU4 BU5 BU6 BU7
Connecting the Dots with Predictive Analytics | 5
Big Data is the trigger for that ‘aha’ moment.
Evidence of return on investment (ROI) derived from Big Data elevates the conversation from tactical to strategic in nature, and from the plant floor to a corporate level audience. “Some plants have never had this level of conversation. It reflects positively on their maintenance teams by highlighting their successes, and it validates the need for continued investment in the program to address opportunities for improvement,” says DeJesus.
Strategic data visualizationThe ability to see trends helps companies to plan their maintenance more strategically. “If severe faults spike in the summer or machines start to lock up in the winter, it indicates there are seasonal operating issues at play, which the maintenance manager can account for in future budgets. If similar machine patterns are noted in sister plants or across different companies or industries, it may indicate an OEM-side issue or a maintenance practice problem that needs to be addressed,” says Pietri.
Companies should choose the metrics that are most relevant to their definition of success. They may start with a baseline report generated quarterly or monthly, and eventually incorporate tailored reports and dashboards that appeal more directly to their corporate objectives.
A benchmarking tool that allows user-defined data aggregation can show anything that is strategically important to a company, whether it’s unplanned downtime, compliance, capital expenditures, or other goals. For a single plant or across an enterprise, it can display key performance indicators (KPIs) with quick and meaningful snapshots as well as patterns and trends in maintenance activities that are positively or negatively impacting operational objectives.
Connecting the Dots with Predictive Analytics | 6
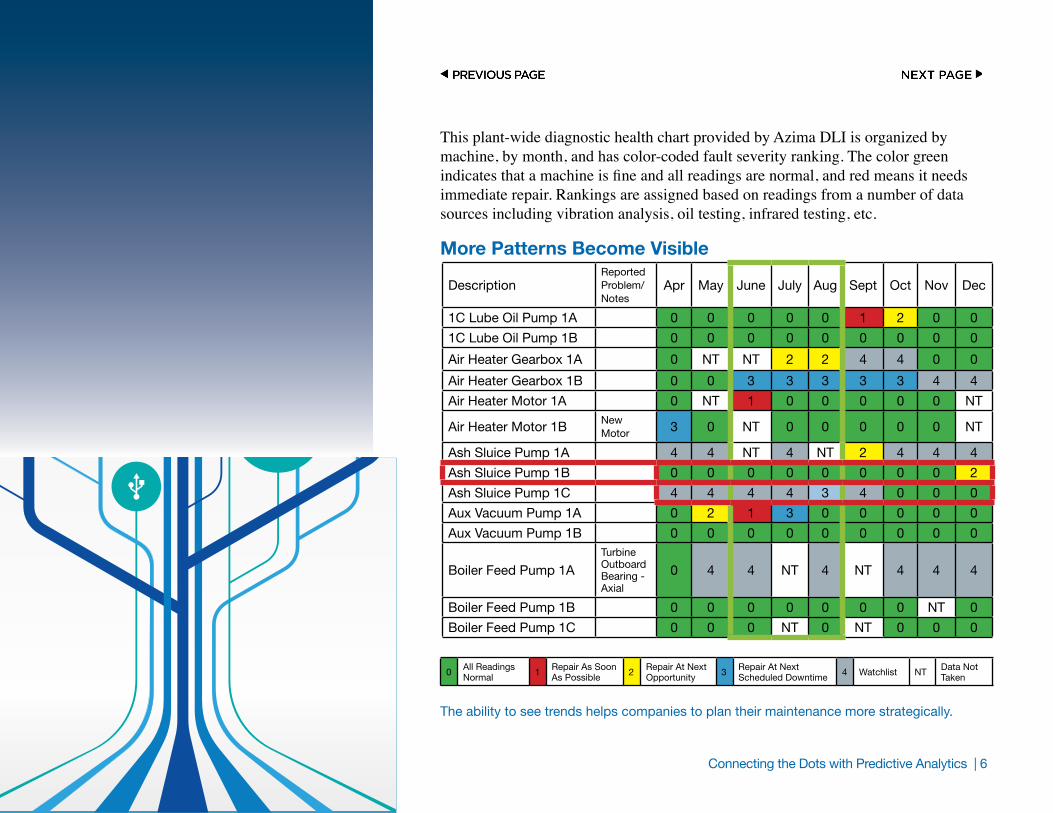
This plant-wide diagnostic health chart provided by Azima DLI is organized by machine, by month, and has color-coded fault severity ranking. The color green indicates that a machine is fine and all readings are normal, and red means it needs immediate repair. Rankings are assigned based on readings from a number of data sources including vibration analysis, oil testing, infrared testing, etc.
More Patterns Become Visible
DescriptionReported Problem/Notes
Apr May June July Aug Sept Oct Nov Dec
1C Lube Oil Pump 1A 0 0 0 0 0 1 2 0 0
1C Lube Oil Pump 1B 0 0 0 0 0 0 0 0 0
Air Heater Gearbox 1A 0 NT NT 2 2 4 4 0 0
Air Heater Gearbox 1B 0 0 3 3 3 3 3 4 4
Air Heater Motor 1A 0 NT 1 0 0 0 0 0 NT
Air Heater Motor 1B New Motor 3 0 NT 0 0 0 0 0 NT
Ash Sluice Pump 1A 4 4 NT 4 NT 2 4 4 4
Ash Sluice Pump 1B 0 0 0 0 0 0 0 0 2
Ash Sluice Pump 1C 4 4 4 4 3 4 0 0 0
Aux Vacuum Pump 1A 0 2 1 3 0 0 0 0 0
Aux Vacuum Pump 1B 0 0 0 0 0 0 0 0 0
Boiler Feed Pump 1ATurbine Outboard Bearing - Axial
0 4 4 NT 4 NT 4 4 4
Boiler Feed Pump 1B 0 0 0 0 0 0 0 NT 0
Boiler Feed Pump 1C 0 0 0 NT 0 NT 0 0 0
0 All Readings Normal 1 Repair As Soon
As Possible 2 Repair At Next Opportunity 3 Repair At Next
Scheduled Downtime 4 Watchlist NT Data Not Taken
The ability to see trends helps companies to plan their maintenance more strategically.
Connecting the Dots with Predictive Analytics | 7
Azima DLI’s benchmarking reports are generated in two formats: a detailed, trended, holistic summary of maintenance performance and asset health over the life of the monitoring contract; and a condensed digest that tries to focus the customer on its single biggest opportunity for improvement. “These opportunities are relatively easy for us to spot,” says Hurlock, “because we are comparing sites to their industry peers, and that exposes outlying aspects of performance.”
An enterprise view shows where sister facilities stand within a parent company, or where the company stands against industry averages. Each entity will be ranked as either green, yellow, orange, or red, with the strongest performers in green and the weakest in red.
“We’re starting to look at the effectiveness of machinery by comparing various makes and models, since we have such a significant database of machines covering so many industries,” says Pietri. “We’re already finding that some manufacturers are significantly better than others. We think this metric will help our customers to reduce unplanned CapEx by choosing equipment that performs well and provides a longer period between actionable faults.”
Unanticipated findings offer a path to operational excellence When there is enough data to project a big picture, it’s amazing what will leap off the page. Many of the issues currently being uncovered are not only avoidable, but traceable. Taking prompt, meaningful action enables maintenance cost reductions and operational improvements.
Surprise #1: A paper manufacturer learned that its PdM program generated more than $4 million in ROI. A plant manager thought the maintenance spend was too high and questioned continuing investment in the PdM program. A Big Data matrix broke down the plant’s priority-one and priority-two events (those requiring shutdown immediately or within 24 hours) which were caught and corrected before failure occurred, and the cost avoidance for each was established. “If a priority-two failure costs $50K there are 20 priority-two catches in one year, then that’s $1 million saved right there,” says DeJesus. “The customer took the information to the finance team and there were no problems renewing the PdM program after that.”

Connecting the Dots with Predictive Analytics | 8
Surprise #2: An expected correlation between PdM data collection compliance and unplanned capital expenditures. “We were tracking compliance across a half dozen business units, two of which were notably irreverent about collecting data,” says Pietri. “A conspicuous increase in unplanned capital expenditures in these same units came to the attention of a company executive, who concluded there was more than coincidence at work.” The company took aggressive measures to improve compliance and unplanned capital expenditures declined.
Tracking KPIs that align with corporate objectives and priorities improves PdM program results.
Objectives
Communication
Financial Benefits
OperationalBenefits
Key Metrics
Connecting the Dots with Predictive Analytics | 9
“No one went looking for the correlation, and proving a causal relationship would be hard, but the correlation appeared to be evidence of a misaligned local management culture that was costing the company money,” says Hurlock. “We should not conclude that poor compliance will necessarily drive up unplanned capital expenditures, but it might be fair to speculate that teams known for strong compliance will probably be more diligent about completing the follow-up work required to avoid failures.”
Surprise #3: A plant manager at a tissue mill was shocked to learn that only 30% of all the machine issues identified through PdM were resolved at any one time. At first they didn’t believe it because they believed the work was being performed consistently, but the data were convincing. “The reasons are still being assessed, but the data helps to identify these types of anomalies. It could be that the equipment is undersized or not designed for the conditions of the plant, causing too much time to be spent on reactive maintenance, or perhaps an employee was misreporting the actual work performed,” says Pietri.
Surprise #4: A company discovered that an ill-advised part replacement was causing repeated failures. They had been wearing through bearings on a particular machine far too quickly, which showed up regularly in the data. A conversation with maintenance personnel revealed that they had changed the bearing type used on the machine to one that was completely inappropriate for the conditions and application. Now, all mechanical changes at that plant are reviewed and signed off by a project engineer.
Surprise #5: A PdM analyst at a gas power facility learned that repeated misalignments of a shaft were caused by improper use of a new alignment laser. The way the analyst was choosing to use reference points for shaft alignments was incorrect, and the alignments were routinely off by 180°. “We asked him to send us the report from the alignment and we saw that the values were transposed, which caused the variance. The process is now fixed and there are no more misalignment errors,” says DeJesus.

Connecting the Dots with Predictive Analytics | 10
Surprise #6: A company in the pulp and paper industry learned that its performance was better than suspected when benchmarked against peers. “The reliability team had been struggling to run on a shoestring budget as their efforts were looked at as unnecessary overhead, and they were doubtful of their impact. We showed them they actually have huge ROI, which is powerful to justify their existence and investment in the program. It also made the team feel good that they were really stretching their dollars while doing things better than some other companies,” says DeJesus.
Surprise #7: A coal-fired power company thought its performance was top-notch compared to its peers, but learned otherwise. The benchmarking results motivated not only self-reflection, which included expanding their PdM program to additional sites, but also a greater understanding of their specific industry. Heavy industries, of which this customer was a part, tend to have multiple redundancies for both major and minor equipment. This allows them leeway in how quickly they address faults, and although this leeway will negatively impact their PdM performance score, it ultimately benefits them financially. Understanding this helps maintenance teams justify their performance and choices.
Surprise #8: An undetected threat could have caused a serious incident. A crucial threat detected using vibration analysis in a cooling tower fan configuration was identified in several of an energy company’s combined-cycle power generation plants. One of the plants used the same equipment but had not participated in the PdM program that identified the risk. When the data was brought to their attention, they checked the vibration and verified the condition existed in their equipment, too. They promptly remedied the threat and adopted the PdM program.

Connecting the Dots with Predictive Analytics | 11
Change is hard but rewardingThe transition to seeking intangible PdM value is not easy but the ROI is compelling to the C-suite. Lack of belief in the program is a core issue that can be overcome by making it a corporate mandate. Big Data predictive analytics show the highest gains in financial performance where compliance to the program is company-wide.
Corporate buy-in also enables a greater PdM investment. One company that successfully used Big Data to improve its vibration compliance is now also using it for IR thermography, machine testing, oil testing, and work order tracking. “It helps to make sure their people are on track, the facility is on track, and any problems are getting addressed in a more expedient manner,” says Pietri.
“Predictive analytics have opened the door for better and more sophisticated two-way conversations,” adds DeJesus. “We get the feedback we need, allowing us to fine tune our processes, analytical skills and software, which in turn helps our customers’ bottom line. It’s mutually beneficial.”

Sponsored by
Azima DLI World Headquarters300 TradeCenter, Suite 4610
Woburn, MA 01801 USA Toll-free U.S. 800-482-2290
International (+1) 781-938-0707 www.AzimaDLI.com
1501 E. Woodfield Rd. Suite 400N, Schaumburg, IL 60173630-467-1300 | www.PlantServices.com