special project report fy07 mefo 4 ec project report: ... • no pattern was evident in tcdd‐teq...
TRANSCRIPT

SPECIAL PROJECT REPORT Maine Field Office – Ecological Services
FY07‐MEFO‐4‐ECMay 2012
Organochlorine compounds in bald eagle and common loon eggs from Androscoggin Lake
and the Androscoggin River Watershed
Fish and Wildlife Service
U.S. Department of the Interior
Mission Statement U.S. Fish and Wildlife Service
Our mission is working with others to conserve, protect, and enhance the nation’s fish and wildlife and their habitats for the continuing benefit of
the American people.
Suggested citation: Mierzykowski S.E. 2012. Organochlorine compounds in bald eagle and common loon eggs from Androscoggin Lake and the Androscoggin River Watershed. USFWS. Spec. Proj. Rep. FY07‐MEFO‐4‐EC. Maine Field Office. Orono, ME. 47 pp.

U.S. Fish and Wildlife Service Maine Field Office
Special Project Report: FY07‐MEFO‐4‐EC
Organochlorine Compounds in Bald Eagle and Common Loon Eggs from Androscoggin Lake and the Androscoggin River Watershed
Region 5 ID No. 53411‐1130‐5F36
DEQ ID No. 200250004 (filename: 5F36_FinalReport.pdf)
Prepared by: Steven E. Mierzykowski U.S. Fish and Wildlife Service
Maine Field Office – Ecological Services 17 Godfrey Drive, Suite 2 Orono, Maine 04473
May 2012 Congressional Districts #1 and #2

2
Executive Summary Reduced productivity has been documented in fish‐eating birds inhabiting Androscoggin Lake in west‐central Maine. The cause of reduced productivity of fish‐eating birds at Androscoggin Lake is not known and could be related to changes in habitat (e.g., loss of nest trees or flooding), predation, harassment or other disturbances during breeding seasons, or to environmental contaminants. Dead Stream connects Androscoggin Lake to the Androscoggin River and during high flows the river will flood into the lake. Three pulp and paper mills existed on the Androscoggin River upstream from Androscoggin Lake. Previous bio‐monitoring studies by the Maine Department of Environmental Protection found elevated concentrations of organic contaminants in fish tissue from Androscoggin Lake and the Androscoggin River. To determine if organochlorine compounds were accumulating and affecting productivity of fish‐eating birds, non‐viable eggs of bald eagles (n = 14) and common loons (n = 8) were collected from Androscoggin Lake and the Androscoggin River watershed between 2001 and 2009. Bald eagle eggs from the Penobscot River watershed (n = 19) and common loon eggs from the Kennebec River watershed (n = 2) were collected for comparative purposes. Eggs were analyzed for dioxins and furans, polychlorinated biphenyl (PCB), DDT metabolites, and other organochlorine compounds. Concentrations were expressed on a fresh wet weight basis. Analytical results for each species were compared between watersheds and to suggested avian egg toxicity threshold levels. Bald Eagle • Dioxin (2,3,7,8‐TCDD) was detected in only two of 14 eagle egg samples from the Androscoggin watershed – an egg from Androscoggin Lake (7.8 ppt, parts per trillion) and an egg from Gulf Island Pond (9.3 ppt) within the Androscoggin River. Dioxin was below sample detection limits in all 19 bald eagle eggs collected from the Penobscot watershed. • There was no significant difference in dioxin toxic equivalents (TCDD‐TEQ, a method of expressing several organic contaminants relative to dioxin) concentrations in bald eagle eggs collected from the Androscoggin (average 209 ppt) and Penobscot (average 273 ppt) watersheds. Average concentrations of TCDD‐TEQ in bald eagle eggs from the Androscoggin watershed and Penobscot watershed were below a No‐Observable‐Adverse‐Effect‐Level (NOAEL) for hatching in bald eagles (303 ppt). Three of 14 bald eagle eggs from the Androscoggin (max. 319 ppt) and six of 19 eggs from the Penobscot watershed (max. 1145 ppt), however, contained TCDD‐TEQ concentrations above the suggested NOAEL. • There was no significant difference in total polychlorinated biphenyl (ΣPCB) concentrations in bald eagle eggs collected from the Androscoggin (average 4.89 ppm, parts per million) and Penobscot watersheds (average 3.01 ppm). None of the bald eagle eggs from the Androscoggin or Penobscot watersheds contained ΣPCB approaching a suggested toxicity threshold level of 20

3
ppm, but two eggs from the Androscoggin drainage had levels that exceeded 10 ppm and could be considered elevated. One of eagle eggs from the Androscoggin drainage with an elevated ΣPCB concentration was collected in Androscoggin Lake in 2003 (13.42 ppm), but an egg collected from the same nest territory in 2007 only had a ΣPCB level of 3.21 ppm. • Statistically significant higher levels of the DDT metabolite, p,p’‐DDE, were found in bald eagle eggs from the Androscoggin watershed (average 1.15 ppm) versus the Penobscot (average 0.71 ppm) watershed. However, DDE levels in bald eagle eggs from the Androscoggin watershed (max. 3.42 ppm) and Penobscot watershed (max. 1.64 ppm) were well below the suggested 5.5 ppm threshold value associated with embryo lethality. Common Loon • Two common loon eggs – one from Aziscohos Lake (5.1 ppt) in the Androscoggin watershed and one from Long Pond (1.9 ppt) in the Kennebec watershed – had detectable levels of dioxin. The compound was below sample detection limits in the other eight loon eggs. • No pattern was evident in TCDD‐TEQ concentrations among ten common loon eggs (range: 11 – 388 ppt) collected from Androscoggin and Kennebec. Two of the ten loon eggs, however, had TCDD‐TEQ levels that exceeded suggested toxicity thresholds for bald eagles and osprey. One egg was collected in Androscoggin Lake and the other from Aziscohos Lake. • No pattern was evident in ΣPCB concentrations among ten common loon eggs collected from the Androscoggin and Kennebec watersheds. Among the ten common loon eggs analyzed, the highest (2.38 ppm) and lowest ΣPCB (0.48 ppm) concentrations were found in two different lakes in the Kennebec watershed. ΣPCB concentrations in common loon eggs from Maine were well below the levels associated with decreased hatching in other species. • Among the ten common loon eggs analyzed for p,p’‐DDE, the highest (1.04 ppm) and lowest (0.07 ppm) concentrations were found in two different lakes in the Kennebec watershed. Similar to ΣPCB, these common loon egg DDE levels were quite low compared to the suggested threshold levels for sensitive species. Overall Assessment Statistically significant higher concentrations of some organochlorine compounds were detected in bald eagle eggs from the Androscoggin versus the Penobscot watersheds. However, average organochlorine levels in bald eagle eggs did not exceed suggested toxicity threshold levels. Eagle eggs from Androscoggin Lake and certain nest territories in both watersheds contained elevated organochlorine levels, but these levels were inconsistent between years and among different compounds. Interpretation of organochlorine analytical results in common loon eggs was hampered by the

4
small sample size (n = 10) and variability of organochlorine concentrations within and among areas. Three of four loon eggs collected from Androscoggin Lake during the study had low TCDD‐TEQ levels (< 50 ppt), but one egg had a concentration of 388 ppt which was above the toxicity thresholds for bald eagles (303 ppt) and osprey (136 ppt). Based on the results of this investigation, reduced productivity in fish‐eating birds from Androscoggin Lake was likely related to organochlorine contamination in some years (i.e., TCDD‐TEQ in one of two common loon territories in 2004). Three eagle eggs collected from the Androscoggin watershed in 2007 also contained TCDD‐TEQ levels that exceeded the suggested toxicity threshold. One loon egg collected from Aziscohos Lake in the Androscoggin watershed in 2004 also contained an elevated TCDD‐TEQ level. Overall, however, for most organochlorine compounds there was no significant difference in contaminant levels in bald eagle eggs in the Androscoggin River and Penobscot River watersheds during the study period. The exceptions were concentrations of alpha chlordane, p,p’‐DDD and p,p’‐DDE, which were significantly higher in bald eagle eggs from the Androscoggin watershed. No apparent pattern could be discerned in organochlorine contaminant levels in common loon eggs between Androscoggin Lake, the Androscoggin watershed, and the Kennebec watershed. Again, too few samples were analyzed from the three areas to allow for statistical comparisons. A long‐term monitoring program of the fish‐eating birds at Androscoggin Lake for organochlorine compounds is not recommended. State monitoring of legacy organochlorine compounds such as dioxin in fish tissue shows a decreasing trend in the Androscoggin River, but dioxin concentrations in fish continue to exceed the state’s fish tissue action level. Continuing to analyze opportunistically‐acquired eagle and loon eggs from Androscoggin Lake and the Androscoggin watershed for organochlorine compounds is recommended. Keywords: bald eagle, organochlorines, Androscoggin Lake, Maine

5
PREFACE This report provides documentation of organochlorine contaminants in eggs of bald eagles (Haliaeetus leucocephalus) and common loons (Gavia immer) from Androscoggin Lake and the Androscoggin River watershed in Maine. Eggs of these species from two other Maine watersheds were analyzed for comparison. The USFWS Region 5 Project Identification Number for this study is 53411‐1130‐5F36 and the USFWS Division of Environmental Quality Project Identification Number is 200250004. Samples were collected between 2001 and 2009. Analytical work was completed under ten USFWS Analytical Control Facility Catalogs and one Sample Delivery Group submitted by the Maine Department of Inland Fisheries and Wildlife (Appendix Table A‐1). Questions, comments, and suggestions related to this report are encouraged. Written inquiries should refer to Report Number FY07‐MEFO‐4‐EC and be directed to:
Steve Mierzykowski U.S. Fish and Wildlife Service 17 Godfrey Drive, Suite 2 Orono, Maine 04473
[email protected] The U.S. Fish and Wildlife Service requests that no part of this report be taken out of context, and if reproduced, the document should appear in its entirety. Copies of this report may be downloaded from the Maine Field Office Environmental Contaminants web site at http://www.fws.gov/northeast/mainecontaminants. This report complies with the peer review and certification provisions of the Information Quality Act (Public Law 106‐554, Section 515). ACKNOWLEDGEMENTS Principal funding for this project was provided by the U.S. Fish and Wildlife Service Division of Environmental Quality in Washington, DC. Raw analytical data for nine bald eagle eggs was generously provided by Maine Department of Inland Fisheries and Wildlife (MEDIFW). Field assistance was provided by the MEDIFW, Androscoggin Lake Improvement Corporation, Loon Preservation Committee, and NextERA Energy Resources. In particular, the efforts of Molly Saunders, Anne Huntington, William Hanson, Kyle Murphy, and Kate Taylor are recognized. Susan Gallo, Maine Audubon Society, provided loon index data for Androscoggin Lake. Tree climbers participating in the project under contract included Eric Saxon and Chris DeSorbo. Peer review of this report was performed by Barry Mower Ph.D., Maine Department of Environmental Protection, and Charles S. Todd, Maine Department of Inland Fisheries and Wildlife. Final editorial review was provided by F. Timothy Prior, USFWS retired.

6
TABLE OF CONTENTS Report Cover USFWS Mission Statement Page Title Page 1 Executive Summary 2 Preface & Acknowledgements 5 Table of Contents 6 List of Figures, Tables, and Appendices 7 List of Acronyms and Abbreviations 8 1. Introduction 9 2. Study Purposes 11 3. Study Area 11 3.1 Androscoggin Lake 3.2 Androscoggin River Watershed 3.3 Penobscot River Watershed 3.4 Kennebec River Watershed 4. Methods 14 4.1 Field methods 4.2 Sample Processing 4.3 Analytical Methods 4.4 Quality Assurance / Quality Control 4.5 Data presentations and statistical analyses 5. Results 18 5.1 Egg metrics, Percent Moisture, and Percent Lipid 5.2 Dioxin (2,3,7,8‐Tetrachlorodibenzo‐p‐dioxin; TCDD) 5.3 Dioxin Toxic Equivalents (TCDD‐TEQs) 5.4 Total Polychlorinated Biphenyl (ΣPCB) 5.5 Dichlorodiphenyldichloroethylene (p,p’‐DDE) 5.6 Other organochlorine compounds 6. Discussion 27 6.1 Bald eagle 6.2 Common loon 6.3 Overall assessment 7. Summary of Results and Management Action Recommendation 32 8. Literature Cited 34

7
Page List of Figure and Tables Figure 1. Bald eagle and common loon egg collection locations 13
Table 1. History of bald eagle occupancy at Androscoggin Lake (Lothrop Island) 10Table 2. Bald eagle and common loon eggs collected in the Androscoggin watershed. 15Table 3. Bald eagle and common loon eggs collected in other watersheds for comparison 16Table 4. Bald eagle egg metrics, percent moisture, and percent lipids 22Table 5. Common loon egg metrics, percent moisture, and percent lipids 23Table 6. TCDD, TCDD‐TEQ, ΣPCB, and DDE in bald eagle eggs 24Table 7. TCDD, TCDD‐TEQ, ΣPCB, and DDE in common loon eggs 26Table 8. Organochlorine compounds in bald eagle eggs, ng/g fresh wet weight 30Table 9. Organochlorine compounds in common loon eggs, ng/g fresh wet weight 31
Appendix Tables Table A‐1. Sample numbers and corresponding USFWS Catalogs or Sample Delivery Groups 37 Table A‐2a thru A‐2e.
TCDD‐TEQs in bald eagle eggs by sample number, pg/g fresh wet weight 38
Table A‐3. TCDD‐TEQs in common loon eggs by sample number, pg/g fresh wet weight 43 Table A‐4a thru A‐4c.
Organochlorine compounds in bald eagle eggs by sample number, ng/g fresh wet weight
44
Table A‐5 Organochlorine compounds in common loon eggs by sample number, ng/g fresh
wet weight 47
8
List of Acronyms and Abbreviations ALIC Androscoggin Lake Improvement Association BAEA bald eagle BHC benzene hexachloride COLO common loon DDE dichlorodiphenyldichloroethylene DDT dichlorodiphenyltrichloroethane FTAL fish tissue action level fww fresh wet weight GERG Geochemical Environmental Research Group HCB hexachlorobenzene MEDEP Maine Department of Environmental Protection MEDIFW Maine Department of Inland Fisheries and Wildlife MESPO Maine State Planning Office MIDAS Maine Information Display Analysis System µg/g micrograms per gram (parts per million) MPDES Maine Pollution Discharge Elimination System ng/g nanograms per gram (parts per billion) NPDES National Pollution Discharge Elimination System PCB polychlorinated biphenyl PCDD polychlorinated dibenzo‐p‐dioxins PCDF polychlorinated dibenzofurans pg/g picograms per gram (parts per trillion) ppb parts per billion (ng/g) ppm parts per million (µg/g) ppt parts per trillion (pg/g) QA/QC Quality Assurance / Quality Control SDG Sample Delivery Group TCDD 2,3,7,8‐tetrachlorodibenzo‐p‐dioxin TEF toxic equivalency factor TCDD‐TEQ dioxin toxic equivalents USFWS U.S. Fish and Wildlife Service ww wet weight

9
1. Introduction Reduced productivity has been documented in fish‐eating birds inhabiting Androscoggin Lake in central Maine. In the past 15 years, a great blue heron (Ardea herodias) colony on Lothrop Island in the southern end of the lake ceased to exist. A bald eagle (Haliaeetus leucocephalus) pair nesting on the same island failed to produce young in 2000 and 2001 and exhibited irregular productivity over several years of monitoring (Table 1). Common loon (Gavia immer) productivity is also sporadic on the lake with few young being observed during annual index counts. The cause of reduced productivity at Androscoggin Lake is not known and could be related to changes in habitat (e.g., loss of nest trees or flooding), predation, harassment or other disturbances during breeding seasons, or to environmental contaminants. At high flows, Androscoggin Lake receives water from the Androscoggin River via the Dead River. Three pulp and paper mills were located above the confluence of the Androscoggin River and Dead River. Two of these mills were included in a U.S. Fish and Wildlife Service biological opinion relating to renewal of National Pollution Discharge Elimination System (NPDES) permits and impact to bald eagles from polychlorinated dibenzo‐p‐dioxins (PCDDs) and polychlorinated dibenzofurans (PCDFs) (USFWS 2000). In the biological opinion, the Service concluded from hazard assessment model predictions and existing fish tissue data that PCDD/F discharges from these mills would likely adversely affect individual bald eagles. The hazard assessment model considered fish tissue information collected by the State of Maine. The Maine Department of Environmental Protection (MEDEP 2000) has been analyzing fish tissue for PCDD/Fs since 1988. In the MEDEP dioxin monitoring program of four major rivers, fish from the Androscoggin River had the highest levels of PCDD/Fs in the state. Levels of PCDD/Fs in fish tissue from Maine’s major rivers were sufficiently elevated to warrant fish consumption advisories. These fish tissue data from other Maine rivers strongly suggested that birds in the Androscoggin River watershed may be at risk from organochlorine contamination. In 2000, four bald eagle eggs from nests along the Penobscot River, which had lower PCDD/F levels in fish than the Androscoggin River, had dioxin toxic equivalent (TCDD‐TEQ) concentrations ranging from 223 to 570 pg/g, fresh wet weight (mean 385 pg/g) (Mierzykowski and Carr 2002). These TCDD‐TEQs for Penobscot River eagles were above suggested toxicity threshold values for the species (Elliott et al. 1996, Elliott and Harris 2002, Henny and Elliott 2007). In the MEDEP surface water ambient toxic monitoring program, fish from the Penobscot River had lower organochlorine contaminant levels than fish from Androscoggin River and Androscoggin Lake. If TCDD‐TEQs in eggs of fish‐eating birds along the Penobscot River were higher than suggested toxicity threshold levels, it was plausible that fish‐eating birds in the Androscoggin River watershed would have similar or even greater TCDD‐TEQs. Based on this information and the reports of reduced eagle and loon productivity in the lake, the Androscoggin Lake Improvement Corporation (ALIC) asked the U.S. Fish and Wildlife Service’s Maine Field Office to conduct a study to determine if organochlorine compounds were affecting fish‐eating birds in Androscoggin Lake and the Androscoggin River watershed.
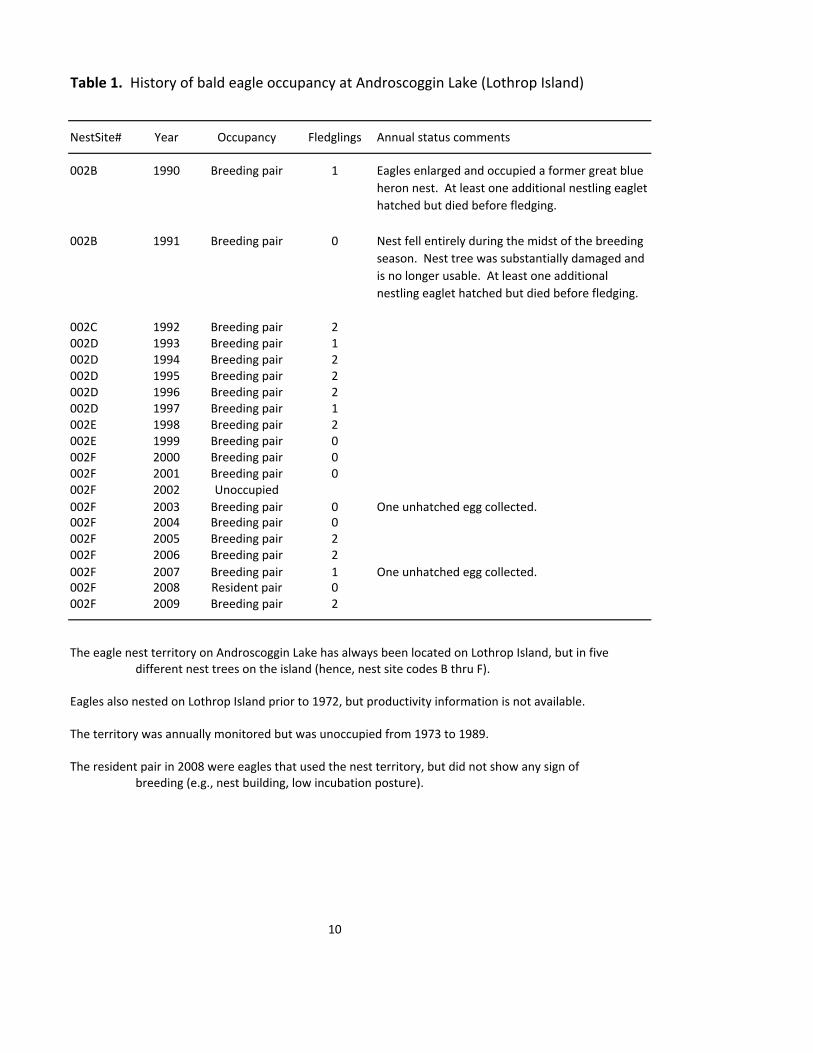
Table 1. History of bald eagle occupancy at Androscoggin Lake (Lothrop Island)
NestSite# Year Occupancy Fledglings Annual status comments
002B 1990 Breeding pair 1 Eagles enlarged and occupied a former great blue
heron nest. At least one additional nestling eaglet
hatched but died before fledging.
002B 1991 Breeding pair 0 Nest fell entirely during the midst of the breeding
season. Nest tree was substantially damaged and
is no longer usable. At least one additional
nestling eaglet hatched but died before fledging.
002C 1992 Breeding pair 2002D 1993 Breeding pair 1002D 1994 Breeding pair 2002D 1995 Breeding pair 2002D 1996 Breeding pair 2002D 1997 Breeding pair 1002E 1998 Breeding pair 2002E 1999 Breeding pair 0002F 2000 Breeding pair 0002F 2001 Breeding pair 0002F 2002 Unoccupied
002F 2003 Breeding pair 0 One unhatched egg collected.002F 2004 Breeding pair 0002F 2005 Breeding pair 2002F 2006 Breeding pair 2
002F 2007 Breeding pair 1 One unhatched egg collected.002F 2008 Resident pair 0002F 2009 Breeding pair 2
The eagle nest territory on Androscoggin Lake has always been located on Lothrop Island, but in fivedifferent nest trees on the island (hence, nest site codes B thru F).
Eagles also nested on Lothrop Island prior to 1972, but productivity information is not available.
The territory was annually monitored but was unoccupied from 1973 to 1989.
The resident pair in 2008 were eagles that used the nest territory, but did not show any sign of breeding (e.g., nest building, low incubation posture).
10

11
2. Study Purposes The purposes of this investigation were to: 1) determine organochlorine contaminant exposure in fish‐eating birds from Androscoggin Lake and the Androscoggin River watershed, 2) compare analytical results from the Androscoggin to abandoned eggs collected during similar research in the Penobscot and Kennebec watersheds and, to 3) evaluate whether contaminant exposure levels in eggs of fish‐eating birds exceed suggested biological effect or toxicity thresholds. 3. Study Area 3.1 Androscoggin Lake. Androscoggin Lake is located in the Towns of Leeds and Wayne in Androscoggin and Kennebec Counties, Maine ‐ Maine Information Display Analysis System (MIDAS) Lake Number 3836. The lake has a surface area of 1,627 hectares (4020 acres) and a drainage area of 215 square kilometers (83 square miles). The lake's maximum depth is approximately 12 meters (38 feet) with an average of 4.6 meters (15 feet) (LOM 2012). Islands on the lake include Androscoggin Island, Hog Island, Norris Island, Blodgett Island, and Lothrop Island. At low water, the smaller islands of Silver Dollar Island and Whaleback Rock are also visible. Year‐round and seasonal residences occur in several coves and points, and on the two largest islands ‐ Androscoggin Island and Norris Island. The lake is managed primarily for a warm‐water fishery. Recreational boating and fishing are common on the lake and there is a high potential for wildlife disturbance. Four common loon eggs and two bald eagle eggs were recovered from Androscoggin Lake for the study. 3.2 Androscoggin River Watershed. The Androscoggin River Basin encompasses 9,065 square kilometers (3,500 sq. mi.) in northeastern New Hampshire and western Maine. The Androscoggin River flows 272 kilometers (169 mi.) from headwaters along the Canadian –New Hampshire border to its mouth at Merrymeeting Bay in Topsham, Maine (MESPO 2007). Pulp and paper mills exist along the river in the towns of Jay and Rumford, Maine, and Berlin, New Hampshire. Common loon eggs were recovered from three lakes in the watershed – Pocasset Lake (MIDAS # 3824), Aziscohos Lake (MIDAS # 3290), and Mooselookmeguntic Lake (MIDAS # 3302, also referred to as Cupsuptic Lake). Eagle eggs were recovered from seven nest territories in the watershed. 3.3 Penobscot River Watershed. The Penobscot River Basin occupies 22,196 square kilometers (8,570 sq. mi.) in central and northeastern Maine. The Penobscot River flows for 169 kilometers (105 mi.) from the confluence of the East and West Branches in Medway, south to its mouth in Penobscot Bay. The river basin is largely undeveloped, approximately 95% is forested. The Penobscot River is influenced by tides as far as Bangor, 48 kilometers (30 mi.) above the confluence with Penobscot Bay (MESPO 2007). Paper mills are located along the river in East Millinocket, Lincoln, and Old Town. Eagle eggs were recovered from 14 nest territories in the watershed.

12
3.4 Kennebec River Watershed. The Kennebec River Basin covers approximately 15,281 square kilometers (5,900 sq. mi.) of southwestern Maine. The upper portion of the basin is hilly and mountainous and the lower third of the basin has the gentle topography representative of a coastal drainage area. The Kennebec River originates at Moosehead Lake and flows south approximately 267 kilometers (166 mi.) to Merrymeeting Bay. The Kennebec River joins the Androscoggin River in Merrymeeting Bay before exiting to the ocean at Fort Popham. The Kennebec River is influenced by tidal processes as far as Augusta, 40 kilometers (25 mi.) above Abagadassett Point (MESPO 2007). One paper mill is located along the river in the town of Skowhegan. Common loon eggs were recovered from two lakes in the watershed – Long Pond (MIDAS # 5272) and Flagstaff Lake (MIDAS # 0038).

Androscoggin Lake2 eagle eggs4 loon eggs
Red Circles = Androscoggin eagle nestsRed Balloons (A) = Androscoggin loon nestsOrange Balloons (P) = Penobscot eagle nestsOrange Balloons (K) = Kennebec loon nests
Figure 1. Bald eagle and common loon egg collection locations
13
14
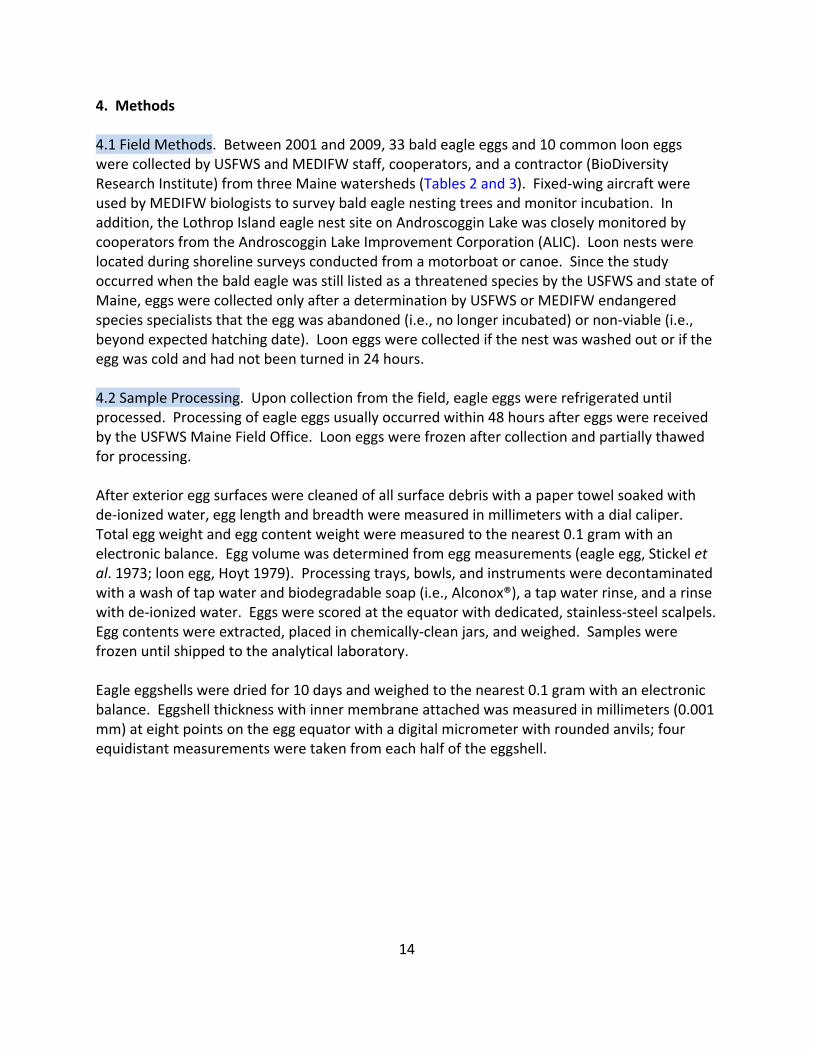
4. Methods 4.1 Field Methods. Between 2001 and 2009, 33 bald eagle eggs and 10 common loon eggs were collected by USFWS and MEDIFW staff, cooperators, and a contractor (BioDiversity Research Institute) from three Maine watersheds (Tables 2 and 3). Fixed‐wing aircraft were used by MEDIFW biologists to survey bald eagle nesting trees and monitor incubation. In addition, the Lothrop Island eagle nest site on Androscoggin Lake was closely monitored by cooperators from the Androscoggin Lake Improvement Corporation (ALIC). Loon nests were located during shoreline surveys conducted from a motorboat or canoe. Since the study occurred when the bald eagle was still listed as a threatened species by the USFWS and state of Maine, eggs were collected only after a determination by USFWS or MEDIFW endangered species specialists that the egg was abandoned (i.e., no longer incubated) or non‐viable (i.e., beyond expected hatching date). Loon eggs were collected if the nest was washed out or if the egg was cold and had not been turned in 24 hours. 4.2 Sample Processing. Upon collection from the field, eagle eggs were refrigerated until processed. Processing of eagle eggs usually occurred within 48 hours after eggs were received by the USFWS Maine Field Office. Loon eggs were frozen after collection and partially thawed for processing. After exterior egg surfaces were cleaned of all surface debris with a paper towel soaked with de‐ionized water, egg length and breadth were measured in millimeters with a dial caliper. Total egg weight and egg content weight were measured to the nearest 0.1 gram with an electronic balance. Egg volume was determined from egg measurements (eagle egg, Stickel et al. 1973; loon egg, Hoyt 1979). Processing trays, bowls, and instruments were decontaminated with a wash of tap water and biodegradable soap (i.e., Alconox®), a tap water rinse, and a rinse with de‐ionized water. Eggs were scored at the equator with dedicated, stainless‐steel scalpels. Egg contents were extracted, placed in chemically‐clean jars, and weighed. Samples were frozen until shipped to the analytical laboratory. Eagle eggshells were dried for 10 days and weighed to the nearest 0.1 gram with an electronic balance. Eggshell thickness with inner membrane attached was measured in millimeters (0.001 mm) at eight points on the egg equator with a digital micrometer with rounded anvils; four equidistant measurements were taken from each half of the eggshell.

Table 2. Bald eagle and common loon eggs collected in Androscoggin Lake and the Androscoggin River watershed.
Sample Nest Location Township Date of Habitat Type
Number Collection Latitude Longitude
Bald Eagle (n = 14)
ME002‐0301 Androscoggin Lake Leeds 6/5/2003 44.306111 70.098333 Lacustrine
ME002‐0701 Androscoggin Lake Leeds 6/19/2007 44.306111 70.098333 Lacustrine
ME252‐0501 Upper Richardson Lake Richardsontown 6/10/2005 44.880465 70.868520 Lacustrine
ME274‐0201 Gulf Island Pond, Androscoggin River Greene 4/18/2002 44.175000 70.204722 Riverine
ME365‐0801 Pond in the River Township C 6/11/2008 44.773850 70.923073 Lacustrine
ME407‐0701 Sabattus Pond Greene 5/9/2007 44.163056 70.098611 Lacustrine
ME407‐0801 Sabattus Pond Greene 5/21/2008 44.163056 70.098611 Lacustrine
ME407‐0802 Sabattus Pond Greene 5/21/2008 44.163056 70.098611 Lacustrine
ME412‐0501 Androscoggin River Jay 6/10/2005 44.481667 70.203889 Riverine
ME412‐0502 Androscoggin River Jay 6/10/2005 44.481667 70.203889 Riverine
ME412‐0701 Androscoggin River Jay 6/12/2007 44.481667 70.203889 Riverine
ME412‐0702 Androscoggin River Jay 6/12/2007 44.481667 70.203889 Riverine
ME586‐0901 Androscoggin River Mexico 6/3/2009 44.533056 70.508056 Riverine
NH‐01‐0601 Pontook Reservoir, Androscoggin River Dummer 6/12/2006 44.643333 71.226389 Lacustrine
Common Loon (n = 8)
AND01E2 Androscoggin Lake Leeds 7/31/2001 44.305556 70.100278 Lacustrine
ANDR02 Androscoggin Lake Leeds 6/14/2002 44.306389 70.101667 Lacustrine
ANDR04‐1 Androscoggin Lake Leeds 5/20/2004 44.317778 70.098056 Lacustrine
ANDR04‐02 Androscoggin Lake Leeds 7/8/2004 44.305833 70.099722 Lacustrine
POCA02 Pocasset Lake Wayne 6/24/2002 44.355833 70.056667 Lacustrine
Azisco1 Aziscohos Lake Lynchtown TWP 6/20/2003 45.051111 71.019444 Lacustrine
AZIS04‐1 Aziscohos Lake Lynchtown TWP 7/12/2004 45.106944 70.996389 Lacustrine
Mooselk1 Mooselookmeguntic Lake Richardsontown 7/10/2003 44.897222 70.810833 Lacustrine
15
Coordinates

Table 3. Bald eagle and common loon eggs collected in other watersheds for comparison.
Sample Nest Location Township Date of Habitat Type
Number Collection Latitude Longitude
Penobscot Watershed ‐ Bald Eagle (n = 19)
ME089‐0201 Debsconeag Deadwater T1 R9 WELS 7/3/2002 45.760143 68.941684 Riverine
ME089‐0202 Debsconeag Deadwater T1 R9 WELS 7/3/2002 45.760143 68.941684 Riverine
ME095‐0401 Penobscot River Passadumkeag 5/19/2004 45.165214 68.631231 Riverine
ME141‐0601 Quakish Lake T3 Indian Purchase 6/6/2006 45.631649 68.762062 Lacustrine
ME141‐0602 Quakish Lake T3 Indian Purchase 6/6/2006 45.631649 68.762062 Lacustrine
ME141‐0701 Quakish Lake T3 Indian Purchase 6/11/2007 45.631649 68.762062 Lacustrine
ME149‐0401 Penobscot River Chester 6/16/2004 45.385416 68.517201 Riverine
ME149‐0701 Penobscot River Chester 5/4/2007 45.385416 68.517201 Riverine
ME154‐0701 Penobscot River Mattamiscontis 5/4/2007 45.365279 68.545490 Riverine
ME172‐0801 Passadumkeag River Lowell 7/15/2008 45.186842 68.456750 Riverine
ME176‐0501 Mattamiscontis Lake T3 R9 NWP 6/13/2005 45.484729 68.679109 Lacustrine
ME184‐0402 Penobscot River Argyle 5/19/2004 45.109987 68.644896 Riverine
ME186‐0601 Gero Island Chesumcook TWP 6/29/2006 46.092265 69.382544 Lacustrine
ME277‐0901 Penobscot River Old Town 5/6/2009 44.905898 68.639898 Riverine
ME289‐0401 Dolby Pond Millinocket 6/14/2004 45.649233 68.637424 Lacustrine
ME289‐0701 Dolby Pond Millinocket 6/11/2007 45.649233 68.637424 Lacustrine
ME392‐0601 Hermon Pond Hermon 6/5/2006 44.784114 68.948047 Lacustrine
ME439‐0401 Pemadumcook Lake T1 R10 WELS 7/7/2004 45.727074 69.009963 Lacustrine
ME498‐0701 Penobscot River Medway 6/22/2007 45.605785 68.534817 Riverine
Kennebec Watershed ‐ Common Loon (n = 2)
LongPd1 Long Pond Belgrade 7/5/2003 44.489444 69.910000 Lacustrine
FLAG04‐1 Flagstaff Lake Dead River TWP 7/10/2004 45.173444 70.246194 Lacustrine
16
Coordinates

17
4.3 Analytical Methods. All eagle and loon eggs were analyzed for polychlorinated dibenzo‐p‐dioxins (PCDDs) and polychlorinated dibenzofurans (PCDF), polychlorinated biphenyl (PCB) congeners, organochlorine pesticides, percent moisture, and percent lipids by the Geochemical and Environmental Research Group (GERG) in College Station, Texas. Catalog1 and sample delivery group (SDG) numbers are listed in Appendix Table A‐1. Polychlorinated dibenzo‐p‐dioxins (PCDDs) and polychlorinated dibenzofurans (PCDF) concentrations were determined using high resolution gas chromatography/high resolution mass spectrometry. The PCDD/F congeners included in the scan were 2,3,7,8‐TCDD, 1,2,3,7,8‐PentaCDD, 1,2,3,4,7,8‐HexaCDD, 1,2,3,6,7,8‐HexaCDD, 1,2,3,7,8,9‐HexaCDD, 1,2,3,6,7,8‐HeptaCDD, OctaCDD, 2,3,7,8‐TCDF, 1,2,3,7,8‐PentaCDF, 2,3,4,7,8‐PentaCDF, 1,2,3,4,7,8‐HexaCDF, 1,2,3,6,7,8‐HexaCDF, 1,2,3,7,8,9‐HexaCDF, 2,3,4,6,7,8‐HexaCDF, 1,2,3,4,6,7,8‐HeptaCDF, 1,2,3,4,7,8,9‐HeptaCDF, and OctaCDF. The TCDD method detection limit was 1 pg/g, wet weight. The method detection limit for other PCDDs and PCDFs was 10 pg/g, wet weight. PCB congeners and other organochlorine compounds were quantified using capillary gas chromatography with electron capture detector or capillary gas chromatography with a mass spectrometer detector. The PCB congener scan measured non‐ortho and mono‐ortho dioxin‐like congeners including PCB #77, PCB #81, PCB #126, PCB #169, PCB #105, PCB #114, PCB #118, PCB #123, PCB #156, PCB #157, PCB #167, and PCB #189. Toxic equivalency factors were applied to the dioxin‐like congeners and summed with PCDD/F congeners to derive the TCDD‐TEQ (Van den Berg et al. 1998). The PCB congener method detection limit was 10 pg/g, wet weight. The organochlorine (OC) scan included analysis of total polychlorinated biphenyl (PCB), benzene hexachloride (alpha BHC, beta BHC, gamma BHC, delta BHC; also known as hexachlorocyclohexane, HCH), chlordane compounds (heptachlor, heptachlor epoxide, alpha chlordane, gamma chlordane, cis‐nonachlor, trans‐nonachlor, oxychlordane), DDT metabolites and isomers (o,p'‐DDD, o,p'‐DDE, o,p'‐DDT, p,p'‐DDD, p,p'‐DDE, p,p'‐DDT), aldrin, endrin, dieldrin, hexachlorobenzene (HCB), endosulfan II, mirex, pentachloro‐anisole and toxaphene. The method detection limit for organochlorine compounds, other than toxaphene and ΣPCB, was 10 ng/g, wet weight. The toxaphene and ΣPCB method detection limit was 50 ng/g, wet weight. 4.4 Quality Assurance/Quality Control (QA/QC). QA/QC procedures as specified by the USFWS Analytical Control Facility contract were adopted (USFWS 2007). These procedures included the use of duplicates, spikes, laboratory blanks, and certified reference material. All analytical catalogs were reviewed and approved by the USFWS Analytical Control Facility.
1 Note: Compared to earlier and later catalogs, highly elevated organochlorine levels were reported in Catalog 5100009. A subsample of common loon eggs from Catalog 5100009 were re‐analyzed in Catalog 5100028 (See Appendix Table A‐1). There was no apparent differences in organochlorine levels between the two analyses.

18
4.5 Data presentations and statistical analyses. Analytical results in the text and tables of this report are presented in pg/g (picograms per gram or parts per trillion) for 2,3,7,8‐TCDD and TCDD‐TEQ, in μg/g (micrograms per gram or parts per million) for ΣPCB and p,p’‐DDE, and in ng/g (nanograms per gram or parts per billion) for other organochlorine compounds. All egg data are expressed on a fresh wet weight basis. Laboratory‐reported wet weight contaminant concentrations were adjusted to fresh wet weight to account for moisture loss after egg laying (Stickel et al. 1973). A non‐parametric test (Mann‐Whitney U Test) was used for bald eagle eggs to determine significant differences in contaminant concentrations or egg metrics between the Androscoggin and Penobscot watersheds. The acceptable level of significance was 0.05. Too few common loon eggs were collected from the Androscoggin and Kennebec watersheds to allow for statistical comparisons. 5. Results Thirty‐three bald eagle eggs and ten common loon eggs were collected for the investigation between 2001 and 2009. Six eggs (two eagle, four loon) were collected from Androscoggin Lake, 16 eggs (twelve eagle, four loon) from the Androscoggin River watershed, two from the Kennebec River watershed (both loon), and 19 (all eagle) from the Penobscot River watershed (Tables 2 and 3). Analytical results and summaries are listed in Tables 6, 7, 8, and 9. Organochlorine analytical results by sample number are listed in Appendix Tables A‐2 thru A‐5. 5.1 Egg Metrics, Percent Moisture, and Percent Lipid. Egg metrics, percent moisture, and percent lipids are listed in Table 4 for eagle eggs and Table 5 for loon eggs. In bald eagle eggs, with the exception of percent lipids, there were no significant differences in egg dimensions, eggshell characteristics, or percent moisture. Percent lipid was significantly higher in bald eagle eggs from the Androscoggin watershed, but these numbers were influenced by six eggs with late term embryos. 5.2 Dioxin (2,3,7,8‐Tetrachlorodibenzo‐p‐dioxin; TCDD). TCDD was detected in two Androscoggin watershed eagle egg samples – an egg from Androscoggin Lake (7.8 pg/g) and an egg from Gulf Island Pond (9.3 pg/g) (Table 6). TCDD was below detection limits in all bald eagle egg samples from the Penobscot watershed (Table 6). Two common loon eggs – one from Aziscohos Lake (5.1 pg/g) in the Androscoggin watershed and one from Long Pond (1.9 pg/g) in the Kennebec watershed – had detectable levels of TCDD (Table 7). 5.3 Dioxin Toxic Equivalents (TCDD‐TEQs). TCDD‐TEQs varied widely among bald eagle and common loon egg samples from all watersheds. There was no significant difference in TCDD‐TEQ concentrations in bald eagle eggs collected from the Androscoggin (mean 209 ± 83 pg/g, range: 98 ‐ 319) and Penobscot (mean 273 ± 281 pg/g, range: 45 – 1145 pg/g) watersheds. In the Androscoggin watershed, the dominant contributors to the TCDD‐TEQ in bald eagle eggs were PCB #126 in 11 eggs and PCB #77 in three eggs (Appendix Table A‐2a and b). In the
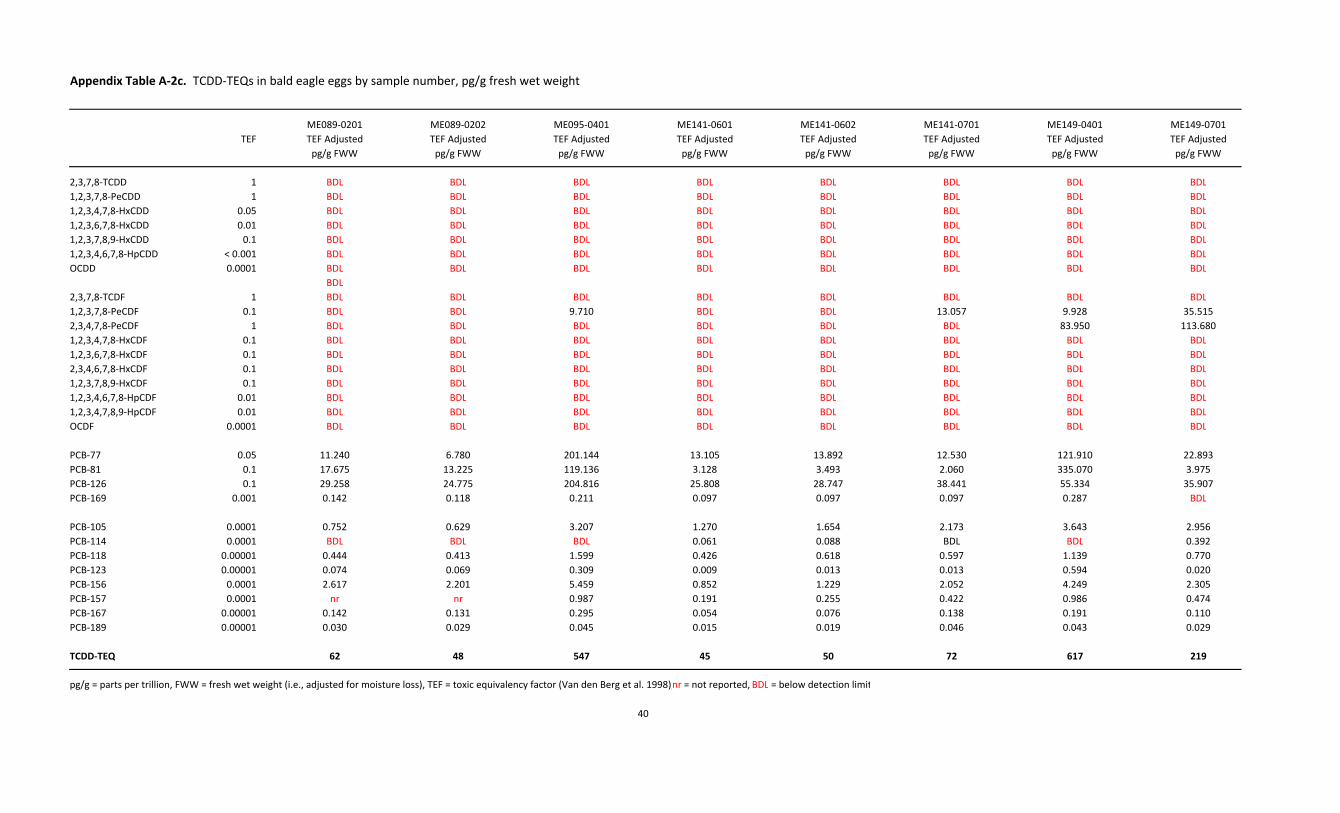
19
Penobscot watershed, the dominant contributors to the TCDD‐TEQ in bald eagle eggs were PCB #126 in 12 eggs, PCB #81 in four eggs, 1,2,3,7,8‐PeCDF in two eggs, and 2,3,4,7,8‐PeCDF in one egg (Appendix Table A‐2c through e). No pattern was evident in TCDD‐TEQ concentrations among ten common loon eggs (range: 11 – 388 pg/g) collected from two watersheds (Table 7). In the Androscoggin watershed, the dominant contributors to the TCDD‐TEQ in common loon eggs were PCB #126 in five eggs, PCB #81 in two eggs, and PCB #77 in one egg (Appendix Table A‐3). In the Kennebec watershed, the dominant contributors to the TCDD‐TEQ in loon eggs was PCB #126 in one egg and PCB #81 in one egg (Appendix Table A‐3). 5.4 Total Polychlorinated Biphenyl (ΣPCB). There was no significant difference in ΣPCB concentrations in bald eagle eggs collected from the Androscoggin (mean 4.89 ± 3.80 µg/g, range: 0.16 – 13.42 µg/g) and Penobscot watersheds (mean 3.01 ± 1.11 µg/g, range: 1.18 – 4.88 µg/g) (Table 6). The highest PCB concentration among bald eagle egg samples was recorded at Androscoggin Lake in 2003 (13.42 µg/g), but an egg collected from the same nest in 2007 contained only 3.21 µg/g. No pattern was evident in ΣPCB concentrations among ten common loon eggs collected from two watersheds (mean 1.26 ± 0.63 µg/g) (Table 7). Among the ten common loon eggs analyzed, the highest (2.38 µg/g) and lowest ΣPCB (0.48 µg/g) concentrations were found in two different lakes from the reference watershed, the Kennebec. 5.5 Dichlorodiphenyldichloroethylene (p,p’‐DDE). Significantly higher p,p’‐DDE levels were found in bald eagle eggs from the Androscoggin watershed (mean 1.15 ± 0.85 µg/g, range: 0.01 – 3.42 µg/g) versus the Penobscot (mean 0.71 ± 0.34 µg/g, range: 0.31 – 1.64 µg/g) watershed (Table 6). Among the ten common loon eggs analyzed for the investigation (mean 0.29 ± 0.27 µg/g), the highest (1.04 µg/g) and lowest p,p’‐DDE (0.07 µg/g) concentrations were found in two different lakes from the reference watershed, the Kennebec (Table 7). 5.6 Other organochlorine compounds. Table 8 (eagle) and Table 9 (loon) summarize concentrations in ng/g (parts per billion) fresh wet weight of other organochlorine compounds in eggs. Benzene hexachloride (BHC), also known as hexachlorocyclohexane, was sporadically detected at low concentrations (i.e., < 5 ng/g) in bald eagle and common loon eggs. Among seven chlordane compounds, alpha chlordane, cis‐nonachlor, trans‐nonachlor, and oxychlordane were detected in all bald eagle egg samples. Alpha chlordane was significantly higher in eagle eggs from the Androscoggin watershed than the Penobscot. There was no

20
significant difference in levels of cis‐nonachlor, trans‐nonachlor or oxychlordane in eagle eggs between the two watersheds. Heptachlor was only detected in three eagle eggs from the Androscoggin and Penobscot watersheds (max. 2.4 ng/g). All 19 eagle eggs from the Penobscot watershed contained heptachlor epoxide (range: 1.2 4.4 ng/g), while 10 of 14 eggs from the Androscoggin contained the compound (range: 0.8 – 5.3 ng/g). Alpha chlordane was detected in all four eggs from Androscoggin Lake (max. 1.3 ng/g) and in two of four eggs from other lakes in the Androscoggin watershed (max. 1.3 ng/g, Aziscohos Lake). Neither loon egg from the Kennebec watershed had detectable levels of alpha chlordane. Gamma chlordane was below detection in all loon eggs. Cis‐nonachlor (max. 13.7 ng/g), trans‐nonachlor (max. 43.7 ng/g), and oxychlordane (max. 20.5 ng/g) were detected in all loon eggs with the highest concentrations occurring in the egg from Long Pond in the Kennebec watershed. Heptachlor was detected in only one loon egg in the Androscoggin watershed (1.1 ng/g, Pocasset Lake). Heptachlor epoxide was detected in all loon eggs with the highest concentration occurring in the Kennebec watershed (max. 6.6 ng/g, Long Pond). Aldrin and endrin were detected sporadically and at low concentrations (i.e., < 8 ng/g) in one‐third of all bald eagle eggs. Aldrin was below detection limits in all common loon eggs. Endrin was detected in four of 10 common loon eggs. The maximum endrin concentration in a loon egg was 6.9 ng/g from Long Pond in the Kennebec watershed. Dieldrin was detected in all bald eagle eggs, but there was no significant difference in concentrations between the Androscoggin (mean 17.4 ± 13.2 ng/g) and Penobscot (mean 13.0 ± 4.4 ng/g) watersheds. Dieldrin was detected in all common loon eggs from Androscoggin Lake (mean 5.2 ± 1.1 ng/g), other sites in the Androscoggin watershed (mean 9.0 ± 7.1 ng/g), and the Kennebec watershed (mean 13.3 ng/g). Endosulfan II was detected in three of 14 eagle eggs (range: 1.8 – 4.1 ng/g) from the Androscoggin watershed and in 10 of 19 eagle eggs (range: 0.5 – 14.8 ng/g) from the Penobscot watershed. Endosulfan II was detected in one loon egg from Androscoggin Lake (1.3 ng/g) and two eggs from other sites in the Androscoggin watershed (0.6 ng/g Aziscohos Lake, 3.5 ng/g Pocasset Lake). Neither loon egg from the Kennebec watershed contained detectable levels of endosulfan II. Hexachlorobenzene (HCB) was detected in all bald eagle eggs, but there was no significant difference in concentrations between the Androscoggin (mean 4.4 ± 2.5 ng/g) and Penobscot (mean 2.8 ± 0.8 ng/g) watersheds. HCB was detected in all but one of the ten common loon eggs. A loon egg from Aziscohos Lake had the highest HCB concentration, 6.6 ng/g. Mirex was detected in all bald eagle eggs, but there was no significant difference in concentrations between the Androscoggin (mean 6.5 ± 5.0 ng/g) and Penobscot (mean 9.2 ± 6.1 ng/g) watersheds. Eight of ten common loon eggs contained mirex. The loon egg collected from Long Pond in the Kennebec watershed exhibited the highest mirex level (8.2 ng/g).

21
Pentachloro‐anisole was detected in six of 14 bald eagle eggs from the Androscoggin watershed (max. 18.0 ng/g) and in 14 of 19 eggs from the Penobscot watershed (max. 1.2 ng/g). Pentachloro‐anisole was detected in four of 10 common loon eggs. The highest pentachloro‐anisole concentration occurred in a loon egg from Androscoggin Lake (1.3 ng/g). Toxaphene was below sample detection limits in 25 bald eagle eggs (Note: Toxaphene was not analyzed in eight eagle eggs) and in all ten common loon eggs.

Table 4. Bald eagle egg metrics, percent moisture and percent lipids
Metric Unit
Total Egg Weight (g) 113.4 ± 13.8 86.0 — 139.8Egg Length (mm) 74.0 ± 3.4 68.7 — 86.2Mean Egg Breadth (mm) 56.6 ± 1.8 53.2 — 60.5Egg Content Weight (g) 97.1 ± 13.0 67.8 — 122.3Calculated Egg Volume (ml) 121.1 ± 10.6 104.1 — 140.6Eggshell Thickness (mm) 0.548 ± 0.042 0.465 — 0.647Eggshell Weight (g) 12.9 ± 1.4 10.4 — 15.6Ratcliffe Index 3.07 ± 0.22 2.69 — 3.52Percent Moisture (%) 82.5 ± 2.7 70.5 — 86.2Percent Lipid (%) 6.5 ± 6.5 1.6 — 26.8
Metric Unit Significant DifferenceBetween Watersheds?
(p < 0.05)Total Egg Weight (g) 116.1 ± 14.4 86.0 — 139.8 111.4 ± 13.4 86.0 — 135.3 NoEgg Length (mm) 74.8 ± 4.4 68.7 — 86.2 73.4 ± 2.5 68.8 — 78.3 NoMean Egg Breadth (mm) 56.9 ± 2.0 53.6 — 60.5 56.4 ± 1.6 53.2 — 58.7 NoEgg Content Weight (g) 100.1 ± 12.6 76.6 — 122.3 95.0 ± 13.2 67.8 — 117.5 NoCalculated Egg Volume (ml) 123.6 ± 12.4 104.1 — 140.6 119.3 ± 9.0 104.2 — 132.2 NoEggshell Thickness (mm) 0.534 ± 0.041 0.465 — 0.622 0.558 ± 0.040 0.494 — 0.647 NoEggshell Weight (g) 12.8 ± 1.7 10.4 — 15.6 13.0 ± 1.0 11.2 — 14.9 NoRatcliffe Index 3.00 ± 0.26 2.69 — 3.49 3.13 ± 0.17 2.79 — 3.52 NoPercent Moisture (%) 82.0 ± 3.7 70.5 — 86.2 82.8 ± 1.6 80.5 — 85.7 NoPercent Lipid (%) 9.9 ± 7.8 1.6 — 26.8 3.9 ± 3.7 1.6 — 18.3 Yes
Significant difference determined with the Mann‐Whitney U Test.
22
n = 14 n = 19Mean ± Standard Deviation Range Mean ± Standard Deviation Range
Penobscot Watershed
All Eggs (Both Watersheds)n = 33
Mean ± Standard Deviation Range
Androscoggin Watershed

Table 5. Common loon egg metrics, percent moisture and percent lipids.
Sample No. Total Egg Length Mean Egg Content Calculated Percent Percent Weight Breadth Weight Egg Volume Moisture Lipid(g) (mm) (mm) (g) (ml) (%) (%)
Androscoggin Lake (n = 4)AND01E2 130.7 95.2 61.1 102.0 181.3 75.5 7.9ANDR02 190.4 96.8 60.9 162.0 183.1 79.8 7.4ANDR04‐1 184.3 93.0 58.7 158.2 163.2 76.8 6.0ANDR04‐2 82.3 96.8 61.9 58.9 188.9 60.3 9.7Mean 146.9 95.5 60.6 120.3 179.1 73.1 7.8Standard Deviation 50.7 1.8 1.4 49.3 11.1 8.7 1.5
Androscoggin Watershed (n = 4)POCA02 183.3 93.4 60.2 144.0 172.6 77.9 6.0Azisco1 143.0 89.9 54.6 119.0 136.7 78.2 8.0Azisc04‐1 145.6 90.1 57.1 122.0 149.6 76.2 5.9Mooselk1 172.0 94.7 60.0 156.0 173.9 75.8 7.5Mean 161.0 92.0 58.0 135.3 158.2 77.0 6.9Standard Deviation 19.8 2.4 2.7 17.8 18.2 1.2 1.1
Kennebec Watershed (n = 2)LongPd1 151.0 91.2 56.5 133.0 148.5 76.5 9.2FLAG04‐1 160.5 88.7 59.6 133.8 160.7 76.3 6.1Mean 155.8 90.0 58.1 133.4 154.6 76.4 7.7
23

Table 6. TCDD, TCDD‐TEQ, ΣPCB, and DDE in bald eagle eggs from the Androscoggin and Penobscot watersheds
Nest No. Location Habitat Year 2,3,7,8‐TCDD TCDD‐TEQ ΣPCB p,p'‐DDEpg/g pg/g µg/g µg/g
Androscoggin WatershedME002‐0301 Androscoggin Lake, Leeds Lacustrine 2003 7.8 215 13.42 3.42ME002‐0701 Androscoggin Lake, Leeds Lacustrine 2007 <9.71 213 3.21 0.70ME252‐0501 Richardson Lake, Richardsontown Twp Lacustrine 2005 <5.71 292 6.67 0.97ME274‐0201 Androscoggin River, Greene Riverine 2002 9.3 184 12.87 2.40ME365‐0801 Pond in the River, Township C Lacustrine 2008 <16.30 98 3.53 0.67ME407‐0701 Sabattus Pond, Greene Lacustrine 2007 <9.43 313 3.79 1.27ME407‐0801 Sabattus Pond, Greene Lacustrine 2008 <9.52 231 2.78 0.99ME407‐0802 Sabattus Pond, Greene Lacustrine 2008 <9.61 221 2.57 1.01ME412‐0501 Androscoggin River, Jay Riverine 2005 <8.18 98 3.23 0.52ME412‐0502 Androscoggin River, Jay Riverine 2005 <7.50 105 3.92 0.59ME412‐0701 Androscoggin River, Jay Riverine 2007 <9.26 318 4.69 1.24ME412‐0702 Androscoggin River, Jay Riverine 2007 <9.71 319 5.25 1.36ME586‐0901 Androscoggin River, Mexico Riverine 2009 <9.90 212 2.35 1.01NH‐01‐0601 Androscoggin River, Pontook Reservoir Lacustrine 2006 <9.90 103 0.16 0.01n = 14 Mean NC 209 4.89 1.15
Standard Deviation 83 3.80 0.85
pg/g = parts‐per‐trillion, µg/g = parts‐per‐millionNC = not calculated. Value in red preceded by < symbol indicates non‐detect and detection limit
24

Table 6 (continued). TCDD, TCDD‐TEQ, ΣPCB, and DDE in bald eagle eggs from the Androscoggin and Penobscot watersheds
Nest No. Location Habitat Year 2,3,7,8‐TCDD TCDD‐TEQ ΣPCB p,p'‐DDEpg/g pg/g µg/g µg/g
Penobscot WatershedME089‐0201 Debsconeag Deadwater, T1 R9 WELS Riverine 2002 <1.81 62 1.28 0.36ME089‐0202 Debsconeag Deadwater, T1 R9 WELS Riverine 2002 <1.88 48 1.21 0.33ME095‐0401 Penobscot River, Passadumkeag Riverine 2004 <4.78 547 3.23 0.60ME141‐0601 Quakish Lake, T3 Indian Purchase Lacustrine 2006 <9.71 45 1.18 0.68ME141‐0602 Quakish Lake, T3 Indian Purchase Lacustrine 2006 <9.80 50 1.48 0.86ME141‐0701 Quakish Lake, T3 Indian Purchase Lacustrine 2007 <7.92 72 2.60 0.86ME149‐0401 Penobscot River, Chester Riverine 2004 <4.93 671 2.90 0.53ME149‐0701 Penobscot River, Chester Riverine 2007 <15.90 219 4.31 0.70ME154‐0701 Penobscot River, Mattamiscontis Riverine 2007 <10.50 196 4.88 0.91ME172‐0801 Passadumkeag River, Lowell Riverine 2008 <9.35 335 3.84 0.57ME176‐0501 Mattamiscontis Lake, T3 R9 NWP Lacustrine 2005 <8.77 92 3.34 0.46ME184‐0402 Penobscot River, Argyle Riverine 2004 <4.85 404 2.82 0.31ME186‐0601 Gero Island, Chesuncook TWP Lacustrine 2006 <9.26 155 2.87 1.64ME277‐0901 Penobscot River, Old Town Riverine 2009 <9.17 234 2.83 0.80ME289‐0401 Dolby Pond, Millinocket Lacustrine 2004 <4.88 1145 4.21 1.37ME289‐0701 Dolby Pond, Millinocket Lacustrine 2007 <3.60 144 4.23 0.58ME392‐0601 Hermon Pond, Hermon Lacustrine 2006 <9.71 69 2.92 0.52ME439‐0401 Pemadumcook Lake, T1 R10 WELS Lacustrine 2004 <5.08 492 3.02 1.00ME498‐0701 Penobscot River, Medway Riverine 2007 <3.92 211 4.01 0.50n = 19 Mean BDL 273 3.01 0.71
Standard Deviation 281 1.11 0.34
pg/g = parts‐per‐trillion, µg/g = parts‐per‐millionBDL = below detection limit. Value in red preceded by < symbol indicates non‐detect and detection limit
25

Table 7. TCDD, TCDD‐TEQ, ΣPCB, and DDE in common loon eggs from the Androscoggin and Kennebec watersheds
Sample No. Location Year 2,3,7,8‐TCDD TCDD‐TEQ ΣPCB p,p'‐DDEpg/g pg/g µg/g µg/g
Androscoggin LakeAND01E2 Androscoggin Lake 2001 < 1.46 35 0.82 0.19ANDR02 Androscoggin Lake 2002 < 1.77 47 1.15 0.29ANDR04‐1 Androscoggin Lake 2004 < 4.57 388 1.75 0.33ANDR04‐02 Androscoggin Lake 2004 < 20.00 16 0.98 0.18
Androscoggin WatershedPOCA02 Pocasset Lake 2002 < 1.87 37 0.76 0.23Azisco1 Aziscohos Lake 2003 5.1 45 1.73 0.19AZIS04‐1 Aziscohos Lake 2004 < 5.43 346 1.88 0.20Mooselk1 Mooselookmeguntic Lake 2003 < 1.72 11 0.65 0.14
Kennebec WatershedLongPd1 Long Pond 2003 1.9 115 2.38 1.04FLAG04‐1 Flagstaff Lake 2004 < 5.00 103 0.48 0.07
Mean (All samples combined) 114 1.26 0.29Standard Deviation 138 0.63 0.27
pg/g = parts‐per‐trillion, µg/g = parts‐per‐millionValue in red preceded by < symbol indicates non‐detect and detection limit
26

27
6. Discussion 6.1 Bald Eagle. One pair of bald eagles currently nests on Lothrop Island at the southern end of Androscoggin Lake. Bald eagles regularly nested on the lake between 1968 and 1972, but the territory went vacant for 17 years (Table 1). From 1990 to 2000, the Lothrop Island eagles fledged 13 eaglets over an 11 year span for a productivity rate of 1.18. During the study period (2001 ‐ 2009), nest success was lower and only seven eaglets were produced at the territory over the nine‐year period for a productivity rate of 0.88. Dioxin or 2,3,7,8‐TCDD was above detection limits in only two eagle eggs – one from Androscoggin Lake (7.8 pg/g) and one from Gulf Island Pond (9.3 pg/g) in the Androscoggin River. TCDD‐TEQ levels in bald eagle eggs were not significantly different between the Androscoggin and Penobscot watersheds. Mean concentrations of TCDD‐TEQ in bald eagle eggs from the Androscoggin watershed (209 pg/g) and Penobscot watershed (273 pg/g) were below the no‐observable‐adverse‐effect level, NOAEL, for hatching in bald eagles (303 pg/g, Elliott and Harris 2002, Henny and Elliott 2007). However, three of 14 bald eagle eggs from the Androscoggin and six of 19 eggs from the Penobscot watershed contained TCDD‐TEQ concentrations above the suggested NOAEL of 303 pg/g. ΣPCB concentrations between 8 and 25 µg/g have been associated with decreased hatching success in terns, cormorants, and eagles (Hoffman et al. 1996). Henny and Elliott (2007) suggested a toxicity threshold value based on reduced probability of producing young of 20 µg/g for ΣPCB in bald eagles. None of the bald eagle eggs from the Androscoggin or Penobscot watersheds contained ΣPCB approaching 20 µg/g, but two eggs from the Androscoggin drainage had levels that exceeded 10 µg/g and could be considered elevated. There was no significant difference in ΣPCB concentrations in bald eagle eggs collected from the Androscoggin (mean 4.89 ± 3.80 µg/g) and Penobscot watersheds (mean 3.01 ± 1.11 µg/g). Mean p,p’‐DDE in bald eagle eggs from the Androscoggin watershed (1.15 µg/g) and Penobscot watershed (0.71 µg/g) were well below the 3.6 µg/g threshold associated with eggshell thinning suggested by Wiemeyer et al. (1993) and the 5.5 µg/g threshold value associated with embryo lethality suggested by Henny and Elliott (2007). Significantly higher p,p’‐DDE levels were found in bald eagle eggs from the Androscoggin watershed (mean 1.15 ± 0.85 µg/g) versus the Penobscot (mean 0.71 ± 0.34 µg/g) watershed, but the difference is likely not biologically relevant. Levels of other organochlorine compounds including benzene hexachloride, chlordane compounds, cyclodiene pesticides, and other compounds were below detection limits or found only in the low ng/g range in bald eagle eggs from the Androscoggin and Penobscot watersheds. Typically, adverse effects of these compounds to eggs of raptors and other bird species occur in the µg/g range (Peakall 1996, Wiemeyer 1996, Blus 2003). 6.2 Common Loon. Androscoggin Lake supports up to six pairs of common loons. Androscoggin

28
Lake is annually surveyed for common loons by volunteers as part of the Maine Audubon Society Loon Project (Maine Audubon 2009). The index count of common loons is conducted on the 3rd Saturday of July. As many as 39 adult birds have been observed on the lake during the annual count, but chick observations are typically less than five. Two common loon eggs – one from Aziscohos Lake (5.1 pg/g) in the Androscoggin watershed and one from Long Pond (1.9 pg/g) in the Kennebec watershed – had detectable levels of 2,3,7,8‐TCDD. No pattern was evident in TCDD‐TEQ concentrations among ten common loon eggs (range: 11 – 388 pg/g) collected from Androscoggin and Kennebec. A TCDD‐TEQ toxicity threshold for common loon eggs has not been proposed. Two of the ten loon eggs, however, had TCDD‐TEQ levels that exceeded suggested toxicity thresholds for bald eagles (303 pg/g, Elliott and Harris 2002) and osprey (136 pg/g, Woodford et al. 1998). No pattern was evident in ΣPCB concentrations among ten common loon eggs collected from the Androscoggin and Kennebec watersheds (mean 1.26 ± 0.63 µg/g). Among the ten common loon eggs analyzed, the highest (2.38 µg/g) and lowest ΣPCB (0.48 µg/g) concentrations were found in two different lakes in the Kennebec watershed. A ΣPCB toxicity threshold for common loon eggs has not been proposed. As noted earlier, ΣPCB concentrations between 8 and 25 µg/g have been associated with decreased hatching success in terns, cormorants, and eagles (Hoffman et al. 1996). ΣPCB concentrations in ten common loon eggs from Maine were below the decreased hatching success range listed by Hoffman et al. (1996). Among the ten common loon eggs analyzed for p,p’‐DDE (mean 0.29 ± 0.27 µg/g), the highest (1.04 µg/g) and lowest (0.07 µg/g) concentrations were found in two different lakes in the Kennebec watershed. These common loon egg DDE levels were quite low compared to the suggested threshold levels for sensitive species (3.0 µg/g in brown pelican, Blus 2011). Like the bald eagle eggs collected for this investigation, levels of other organochlorine compounds including benzene hexachloride, chlordane compounds, cyclodiene pesticides, and other compounds were below detection limits or found only in the low ng/g range in common loon eggs from the Androscoggin and Kennebec watersheds. 6.3 Overall Assessment. Statistically significant higher concentrations of some organochlorine compounds were detected in bald eagle eggs from the Androscoggin versus the Penobscot watersheds. However, mean organochlorine levels in bald eagle eggs did not exceed suggested toxicity threshold levels. Eagle eggs from certain nest territories in both watersheds contained elevated organochlorine levels, but these levels were inconsistent between different years and for different compounds. For example, ΣPCB in an egg from eagle territory ME002 in Androscoggin Lake was elevated in 2003 (13.42 µg/g), but ΣPCB in an egg collected from the same nest in 2007 was lower (3.21

29
µg/g). In contrast, TCDD‐TEQ levels in eggs collected from eagle territory ME002 in 2003 (215 pg/g) and 2007 (213 pg/g) were essentially identical. Similarly, interpretation of organochlorine analytical results in common loon eggs are hampered by the small sample size (n = 10) and variability of concentrations within and among areas. Three of four loon eggs from Androscoggin Lake had low TCDD‐TEQ levels (< 50 pg/g), but one had a concentration of 388 pg/g. Two loon eggs from Aziscohos Lake had TCDD‐TEQ concentrations of 45 and 346 pg/g. Previous investigations have reported elevated levels of mercury, and to a lesser extent, PCB in Androscoggin Lake biota (Evers and Lane 2004. Note: USFWS shared its Androscoggin Lake PCB avian egg data from 2001 to 2003 with the authors). In a 2008 report by state toxicologists (Smith and Frohmberg 2008), levels of dioxins and furans in the Androscoggin River and Androscoggin Lake remained at or above the state fish tissue action level (FTAL) of 0.4 pg/g at virtually all sampling locations for sport fish, and exceeded the FTAL when coplanar PCBs were added. White suckers remained above the cancer FTAL of 1.5 pg/g for most locations on the Androscoggin River. Levels of dioxins in furans also remained above the 0.4 pg/g FTAL in white perch collected from Androscoggin Lake, and exceeded this level in both perch and smallmouth bass when coplanar PCBs are included.

Table 8. Organochlorine compounds in bald eagle eggs, ng/g fresh wet weight
Significant DifferenceNo. of No. of Between Watersheds?
Detections Mean ± Std Dev Detections Mean ± Std Dev (p < 0.05)
PCB‐TOTAL 14 4889.2 ± 3801.0 158.6 — 13419.6 19 3007.3 ± 1108.0 1181.9 — 4876.3 Noalpha BHC 2 0.4 — 2.4 6 0.2 — 3.9beta BHC 3 0.3 — 1.2 5 0.2 — 1.1gamma BHC 4 1.2 — 2.6 2 0.5 — 1.1delta BHC 1 0.7 0alpha chlordane 14 4.8 ± 3.1 1.6 — 11.1 19 2.5 ± 1.4 0.5 — 6.3 Yesgamma chlordane 7 0.3 — 11.2 14 0.3 — 5.3cis‐nonachlor 14 15.7 ± 11.7 0.1 — 48.7 19 12.2 ± 7.0 4.2 — 26.6 Notrans‐nonachlor 14 50.0 ± 35.9 1.0 — 151.1 19 37.4 ± 15.8 14.8 — 73.3 Nooxychlordane 14 14.8 ± 10.1 1.1 — 40.1 19 12.8 ± 6.1 6.3 — 27.4 Noheptachlor 3 0.3 — 2.3 3 0.2 — 2.4heptachlor epoxide 10 0.8 — 5.3 19 1.9 ± 0.9 1.2 — 4.4o,p'‐DDD 14 12.4 ± 10.4 0.3 — 38.7 19 7.6 ± 4.4 1.7 — 16.8 Noo,p'‐DDE 6 0.2 — 1.6 9 0.2 — 3.6o,p'‐DDT 13 0.7 — 47.5 19 7.7 ± 4.8 1.0 — 17.4p,p'‐DDD 14 54.9 ± 27.4 0.9 — 106.3 19 29.2 ± 14.1 9.0 — 65.6 Yesp,p'‐DDE 14 1154.1 ± 845.8 10.5 — 3418.2 19 716.1 ± 343.5 312.0 — 1642.3 Yesp,p'‐DDT 9 0.7 — 9.2 11 1.0 — 13.1aldrin 1 2.9 3 0.7 — 1.4endrin 3 1.7 — 11.3 4 0.5 — 8.4dieldrin 14 17.4 ± 13.2 0.1 — 51.8 19 13.0 ± 4.4 7.6 — 24.8 Noendosulfan II 3 1.8 — 4.1 10 0.5 — 14.8HCB 14 4.4 ± 2.5 0.5 — 8.7 19 2.8 ± 0.8 1.5 — 5.1 Nomirex 14 6.5 ± 5.0 0.1 — 15.5 19 9.2 ± 6.1 1.9 — 23.8 Nopentachloro‐anisole 6 0.6 — 18.0 14 0.5 — 1.2toxaphene 0 0
Significant difference determined with Mann‐Whitney U TestSignificant difference was only determined for compounds that were detected in all egg samples.
30
Androscoggin Watershed (n = 14) Penobscot Watershed (n = 19)
Range Range

Table 9. Other organochlorine compounds in common loon eggs, ng/g fresh wet weight
No. of No. of No. of Detections Mean ± StdDev Detections Mean ± StdDev Detections Mean
PCB‐TOTAL 4 1155.6 ± 425.5 748.8 — 1746.0 4 1261.8 ± 637.3 647.6 — 1885.0 2 1433.7 484.0 — 2383.4alpha BHC 2 0.6 — 1.4 0 0beta BHC 2 1.2 — 1.9 1 0.5 1 0.4gamma BHC 1 1.1 0 0delta BHC 0 0 0alpha chlordane 4 0.8 ± 0.4 0.4 — 1.3 2 1.2 — 1.3 0gamma chlordane 0 0 0cis‐nonachlor 4 4.4 ± 1.6 2.9 — 5.9 4 4.3 ± 1.3 2.5 — 5.4 2 7.7 1.7 — 13.7trans‐nonachlor 4 9.7 ± 3.6 6.4 — 14.0 4 13.2 ± 2.4 11.4 — 16.7 2 25.7 7.8 — 43.7oxychlordane 4 4.9 ± 2.6 1.8 — 7.2 4 9.5 ± 3.2 6.4 — 12.7 2 13.1 5.6 — 20.5heptachlor 0 1 1.1 0heptachlor epoxide 4 1.4 ± 0.4 0.9 — 1.9 2 1.7 — 2.0 2 4.1 1.7 — 6.6o,p'‐DDD 2 3.4 — 5.6 4 5.2 ± 1.4 3.3 — 6.6 2 9.6 2.1 — 17.1o,p'‐DDE 1 2.0 1 0.5 0o,p'‐DDT 4 3.0 ± 2.9 1.2 — 7.3 3 2.6 — 8.4 2 6.6 2.0 — 11.1p,p'‐DDD 4 5.0 ± 1.6 3.7 — 7.3 3 4.8 — 13.5 2 5.5 0.8 — 10.3p,p'‐DDE 4 244.0 ± 78.4 4 191.1 ± 36.7 143.5 — 232.7 2 555.9 72.5 — 1039.4p,p'‐DDT 3 0.7 — 1.6 2 1.2 — 4.1 1 7.8aldrin 0 0 0endrin 1 6.6 2 1.2 — 3.1 1 6.9dieldrin 4 5.2 ± 1.1 3.6 — 6.1 4 9.0 ± 7.1 1.3 — 17.0 2 13.3 3.8 — 22.8endosulfan II 1 1.3 2 0.6 — 3.5 0HCB 4 2.7 ± 0.6 1.9 — 3.2 3 4.3 — 6.6 2 3.8 2.4 — 5.3mirex 3 1.0 — 1.8 3 2.2 — 5.0 2 4.7 1.3 — 8.2pentachloro‐anisole 1 1.3 2 0.6 — 1.1 1 0.4toxaphene 0 0 0
ng/g = parts‐per‐billion.
31
Androscoggin Lake (n = 4)
Range RangeRange
Kennebec Watershed (n =2)Androscoggin Watershed (n = 4)

32
7. Summary of Results and Management Action Recommendation Statistically significant higher concentrations of some organochlorine compounds were detected in bald eagle eggs from the Androscoggin versus the Penobscot watersheds. However, average organochlorine levels in bald eagle eggs did not exceed suggested toxicity threshold levels. Eagle eggs from certain nest territories in both watersheds contained elevated organochlorine levels, but these levels were inconsistent between different years and for different compounds. For example, ΣPCB in an egg from territory ME002 in Androscoggin Lake was elevated in 2003 (13.42 µg/g), but ΣPCB in an egg collected from the same nest in 2007 was lower (3.21 µg/g). In contrast, TCDD‐TEQ levels in eggs collected from territory ME002 in 2003 (214 pg/g) and 2007 (213 pg/g) were essentially identical. Similarly, interpretation of organochlorine analytical results in common loon eggs are hampered by the small sample size (n = 10) and variability of concentrations within and among areas. Three of four loon eggs from Androscoggin Lake had low TCDD‐TEQ levels (< 50 pg/g), but one had a concentration of 388 pg/g. Two loon eggs from Aziscohos Lake had TCDD‐TEQ concentrations of 45 and 346 pg/g. Organochlorine analytical results by species are summarized below: Bald Eagle • TCDD was detected in only two of 14 samples from the Androscoggin watershed – an egg from Androscoggin Lake (7.8 pg/g) and an egg from Gulf Island Pond (9.3 pg/g) within the Androscoggin River. TCDD was below sample detection limits in all 19 bald eagle eggs collected from the Penobscot watershed. • There was no significant difference in TCDD‐TEQ concentrations in bald eagle eggs collected from the Androscoggin (mean 209 ± 83 pg/g) and Penobscot (mean 273 ± 281 pg/g) watersheds. Mean concentrations of TCDD‐TEQ in bald eagle eggs from the Androscoggin watershed and Penobscot watershed were below the NOAEL for hatching in bald eagles (303 pg/g, Henny and Elliott 2007). Three of 14 bald eagle eggs from the Androscoggin (max. 319 pg/g) and six of 19 eggs from the Penobscot watershed (max. 1145 pg/g), however, contained TCDD‐TEQ concentrations above the suggested NOAEL. • There was no significant difference in ΣPCB concentrations in bald eagle eggs collected from the Androscoggin (mean 4.89 ± 3.80 µg/g) and Penobscot watersheds (mean 3.01 ± 1.11 µg/g). None of the bald eagle eggs from the Androscoggin or Penobscot watersheds contained ΣPCB approaching 20 µg/g (Henny and Elliott 2007), but two eggs from the Androscoggin drainage had levels that exceeded 10 µg/g and could be considered elevated. One of eagle eggs from the Androscoggin drainage with an elevated ΣPCB concentration was collected in Androscoggin

33
Lake in 2003 (13.42 µg/g), but an egg collected from the same nest territory in 2007 only had a ΣPCB level of 3.21 µg/g. • Significantly higher p,p’‐DDE levels were found in bald eagle eggs from the Androscoggin watershed (mean 1.15 ± 0.85 µg/g) versus the Penobscot (mean 0.71 ± 0.34 µg/g) watershed, but the difference is likely not biologically relevant. DDE in bald eagle eggs from the Androscoggin watershed (max. 3.42 µg/g) and Penobscot watershed (max. 1.64 µg/g) were below the 5.5 µg/g threshold value associated with embryo lethality suggested by Henny and Elliott (2007). Common Loon • Two common loon eggs – one from Aziscohos Lake (5.1 pg/g) in the Androscoggin watershed and one from Long Pond (1.9 pg/g) in the Kennebec watershed – had detectable levels of TCDD. • No pattern was evident in TCDD‐TEQ concentrations among ten common loon eggs (range: 11 – 388 pg/g) collected from Androscoggin and Kennebec. Two of the ten loon eggs, however, had TCDD‐TEQ levels that exceeded suggested toxicity thresholds for bald eagles (303 pg/g, Elliott and Harris 2002) and osprey (136 pg/g, Woodford et al. 1998). A TCDD‐TEQ toxicity threshold for common loon eggs has not been established. • No pattern was evident in ΣPCB concentrations among ten common loon eggs collected from the Androscoggin and Kennebec watersheds (mean 1.26 ± 0.63 µg/g). Among the ten common loon eggs analyzed, the highest (2.38 µg/g) and lowest ΣPCB (0.48 µg/g) concentrations were found in two different lakes in the Kennebec watershed. These loon egg PCB levels were lower than a decreased hatching effect range for other avian species (Hoffman et al. 1996). • Among the ten common loon eggs analyzed for p,p’‐DDE (mean 0.29 ± 0.27 µg/g), the highest (1.04 µg/g) and lowest (0.07 µg/g) concentrations were found in two different lakes in the Kennebec watershed. These loon egg DDE levels were low compared to the suggested threshold levels for sensitive species (3.0 µg/g in brown pelican, Blus 2011). Management Action Recommendation A long‐term monitoring program of the fish‐eating birds at Androscoggin Lake for organochlorine compounds is not recommended. State monitoring of legacy organochlorine compounds such as dioxin in fish tissue show a decreasing trend in the Androscoggin River, but dioxin concentrations in fish continue to exceed the state’s fish tissue action level (MEDEP 2011). Continuing to analyze opportunistically‐acquired eagle and loon eggs from Androscoggin Lake and the Androscoggin watershed for organochlorine compounds is recommended.

34
8. Literature Cited Blus L.J. 2003. Organochlorine pesticides. Pages 313 – 339 in Hoffman D.J., B.A. Rattner, G.A. Burton Jr. and J. Cairns Jr. (eds.). Handbook of ecotoxicology. 2nd Edition. Lewis Publishers. Boca Raton, FL. 1290 pp. Blus L.J. 2011. DDT, DDD and DDE in birds. Pages 425 – 444 in Beyer W.N. and J.P. Meador (eds.). Environmental contaminants in biota – interpreting tissue concentrations. 2nd Edition. CRC Press. Boca Raton, FL. 751 pp. Elliott J.E. and M.L. Harris. 2002. An ecotoxicological assessment of chlorinated hydrocarbon effects on bald eagle populations. Reviews Toxicol. 4:1‐60. Elliott J.E., R.J. Norstrom, A. Lorenzen, L.E. Hart, H. Philibert, S.W. Kennedy, J.J. Stegeman, G.D. Bellward and K.M. Cheng. 1996. Biological effects of polychlorinated dibenzo‐p‐dioxins, dibenzofurans, and biphenyls in bald eagle (Haliaeetus leucocephalus) chicks. Environ. Toxicol. Chem. 15(5):782‐793. Evers D.C., K.M. Taylor, A. Major, R.J. Taylor, R.H. Poppenga and A.M. Scheuhammer. 2003. Common loon eggs as indicators of methylmercury availability in North America. Ecotoxicology 12:69‐81. Evers D.C. and O.P. Lane. 2004. Androscoggin Lake wildlife risk assessment: 2001‐03 comprehensive report. BRI Report 2004‐02. BioDiversity Research Institute. Gorham, ME. 40 pp. Henny C.J. and J.E. Elliott. 2007. Toxicology. Pages 329 – 350 in Bird D.M. and K.L. Bildstein (eds.). Raptor research and management techniques. Hancock House Publishers. Hoffman D.J., C.P. Rice and T.J. Kubiak. 1996. PCBs and dioxins in birds. Pages 165 – 207 in Beyer W.N., G.H. Heinz and A.W. Redmon‐Norwood (eds.). Environmental contaminants in wildlife – interpreting tissue concentrations. Lewis Publishers. Boca Raton, FL. 494 pp. Hoyt D.F. 1979. Practical methods of estimating volume and fresh weight of bird eggs. Auk 96:73‐77. LOM (Lakes of Maine.Org). 2012. Androscoggin Lake. http://www.lakesofmaine.org/index.html Maine Audubon. 2009. The Maine Loon Project. http://www.maineaudubon.org/conserve/loon/index.shtml MEDEP (Maine Department of Environmental Protection). 2000. Dioxin monitoring program ‐ 1999. MEDEP. DEPLW2000‐10. Augusta, ME.

35
MEDEP (Maine Department of Environmental Protection). 2011. Surface water ambient toxics monitoring program ‐ 2010 Final Report. MEDEP. DEPLW‐1206. Augusta, ME. 169 pp. Mierzykowski S.E. and K.C. Carr. 2002. Organochlorine compounds and mercury in bald eagle eggs, Penobscot River, Maine. USFWS. Maine Field Office. Spec. Proj. Rep. FY02‐MEFO‐1‐EC. Old Town, ME. MESPO (Maine State Planning Office). 2007. Maine River Basin Report. Chapter 3 – Penobscot, Chapter 4 – Kennebec. Chapter 5 – Androscoggin. http://www.maine.gov/spo/flood/docs/maineriverbasin/maineriverbasinreport_chap3.pdf http://www.maine.gov/spo/flood/docs/maineriverbasin/maineriverbasinreport_chap4.pdf http://www.maine.gov/spo/flood/docs/maineriverbasin/maineriverbasinreport_chap5.pdf Peakall D.B. 1996. Dieldrin and other cyclodiene pesticides in wildlife. Pages 73 – 97 in Beyer W.N., G.H. Heinz and A.W. Redmon‐Norwood (eds.). Environmental contaminants in wildlife – interpreting tissue concentrations. Lewis Publishers. Boca Raton, FL. 494 pp. Smith A.E. and E. Frohmberg. 2008. Evaluation of the health implications of levels of polychlorinated dibenzo‐p‐dioxins (dioxins) and polychlorinated dibenzofurans (furans) in fish from Maine rivers – 2008 update. Maine Center for Disease Control. Maine Department of Health and Human Services. Augusta, ME. 33 pp. Stickel L.F., S.N. Wiemeyer and L.J. Blus. 1973. Pesticide residues in eggs of wild birds: adjustment for loss of moisture and lipid. Bull. Environ. Contam. Toxicol. 9(4):193‐196. USFWS (US Fish and Wildlife Service). 2000. Biological opinion on the effects of proposed NPDES permits for six kraft pulp and paper mills in Maine on the bald eagle. New England Field Office. Concord, NH. USFWS (US Fish and Wildlife Service). 2007. Analytical Control Facility – Quality Assurance and Quality Control. USFWS. Shepherdstown, WV. 7 pp. Van den Berg M., L. Birnbaum, A.T.C. Bosveld, B. Brunstrom, P. Cook, M. Feeley, J.P. Giesy, A. Hanberg, R. Hasegawa, S.W. Kennedy, T. Kubiak, J.C. Larsen, F.X. Rolaf van Leewen, A.K.D. Liem, C. Nolt, R.E. Peterson, L. Poellinger, S. Safe, D. Schrenk, D. Tillitt, M. Tysklind, M. Younes, F. Waern and T. Zacharewski. 1998. Toxic equivalency factors (TEFs) for PCBs, PCDDs, PCDFs for humans and wildlife. Environ. Health Persp. 106(12):775‐792. Wiemeyer S.N., C.M. Bunck and C.J. Stafford. 1993. Environmental contaminants in bald eagle eggs 1980 – 1984 and further interpretations of relationships to productivity and shell thickness. Arch. Environ. Contam. Toxicol. 24:213‐227.
36
Wiemeyer S.N. 1996. Other organochlorine pesticides in birds. Pages 99 – 115 in Beyer W.N., G.H. Heinz and A.W. Redmon‐Norwood (eds.). Environmental contaminants in wildlife – interpreting tissue concentrations. Lewis Publishers. Boca Raton, FL. 494 pp. Woodford J.E., W.H. Karasov, M.W. Meyer and L. Chambers. 1998. Impact of 2,3,7,8‐TCDD exposure on survival, growth, and behavior of ospreys breeding in Wisconsin, USA. Environ. Toxicol. Chem. 17(7):1323‐1331.

Table A‐1. Sample numbers and corresponding catalogs or sample delivery groups
Sample No. Location Catalog
Bald Eagle (n = 33)ME274‐0201 Androscoggin River, Greene Catalog 5100001ME089‐0201 Debsconeag Deadwater, T1 R9 WELS Catalog 5100003ME089‐0202 Debsconeag Deadwater, T1 R9 WELS Catalog 5100003ME002‐0301 Androscoggin Lake, Leeds Catalog 5100004ME095‐0401 Penobscot River, Passadumkeag Catalog 5100009ME149‐0401 Penobscot River, Chester Catalog 5100009ME184‐0402 Penobscot River, Argyle Catalog 5100009ME289‐0401 Dolby Pond, Millinocket Catalog 5100009ME439‐0401 Pemadumcook Lake, T1 R10 WELS Catalog 5100009ME176‐0501 Mattamiscontis Lake, T3 R9 NWP Catalog 5100015ME252‐0501 Richardson Lake, Richardsontown Twp Catalog 5100015ME412‐0501 Androscoggin River, Jay Catalog 5100015ME412‐0502 Androscoggin River, Jay Catalog 5100015ME141‐0601 Quakish Lake, T3 Indian Purchase Catalog 5100018ME141‐0602 Quakish Lake, T3 Indian Purchase Catalog 5100018ME186‐0601 Gero Island, Chesuncook TWP Catalog 5100018ME392‐0601 Hermon Pond, Hermon Catalog 5100018NH‐01‐0601 Androscoggin River, Pontook Reservoir Catalog 5100018ME289‐0701 Dolby Pond, Millinocket Catalog 5100026ME498‐0701 Penobscot River, Medway Catalog 5100026ME154‐0701 Penobscot River, Mattamiscontis Catalog 5100029ME141‐0701 Quakish Lake, T3 Indian Purchase Catalog 5100035ME149‐0701 Penobscot River, Chester Catalog 5100035ME365‐0801 Pond in the River, Township C Catalog 5100035ME002‐0701 Androscoggin Lake, Leeds GERG SDG K2729ME172‐0801 Passadumkeag River, Lowell GERG SDG K2729ME277‐0901 Penobscot River, Old Town GERG SDG K2729ME407‐0701 Sabattus Pond, Greene GERG SDG K2729ME407‐0801 Sabattus Pond, Greene GERG SDG K2729ME407‐0802 Sabattus Pond, Greene GERG SDG K2729ME412‐0701 Androscoggin River, Jay GERG SDG K2729ME412‐0702 Androscoggin River, Jay GERG SDG K2729ME586‐0901 Androscoggin River, Mexico GERG SDG K2729
Common Loon (n = 10)AND01E2 Androscoggin Lake Catalog 5100001ANDR02 Androscoggin Lake Catalog 5100003ANDR04‐1 Androscoggin Lake Catalog 5100009 Catalog 5100028ANDR04‐02 Androscoggin Lake Catalog 5100016POCA02 Pocasset Lake Catalog 5100003Azisco1 Aziscohos Lake Catalog 5100004AZIS04‐1 Aziscohos Lake Catalog 5100009 Catalog 5100028Mooselk1 Mooselookmeguntic Lake Catalog 5100004LongPd1 Long Pond Catalog 5100004FLAG04‐1 Flagstaff Lake Catalog 5100009 Catalog 5100028
GERG = Geochemical and Environmental Research Group. SDG = Sample Delivery Group.
37

Appendix Table A‐2a. TCDD‐TEQs in bald eagle eggs by sample number, pg/g fresh wet weight
ME002‐0301 ME002‐0701 ME252‐0501 ME274‐0201 ME365‐0801 ME407‐0701 ME407‐0801 ME407‐0802
TEF TEF Adjusted TEF Adjusted TEF Adjusted TEF Adjusted TEF Adjusted TEF Adjusted TEF Adjusted TEF Adjusted
pg/g FWW pg/g FWW pg/g FWW pg/g FWW pg/g FWW pg/g FWW pg/g FWW pg/g FWW
2,3,7,8‐TCDD 1 7.765 BDL BDL 9.282 BDL BDL BDL BDL
1,2,3,7,8‐PeCDD 1 BDL BDL BDL BDL BDL BDL BDL BDL
1,2,3,4,7,8‐HxCDD 0.05 BDL BDL BDL BDL BDL BDL BDL BDL
1,2,3,6,7,8‐HxCDD 0.01 BDL BDL BDL BDL BDL BDL BDL BDL
1,2,3,7,8,9‐HxCDD 0.1 BDL BDL BDL BDL BDL BDL BDL BDL
1,2,3,4,6,7,8‐HpCDD < 0.001 BDL BDL BDL 0.031 BDL BDL BDL BDL
OCDD 0.0001 0.020 0.036 BDL 0.073 BDL 0.004 BDL BDL
2,3,7,8‐TCDF 1 9.959 BDL BDL 7.168 BDL BDL BDL BDL
1,2,3,7,8‐PeCDF 0.1 BDL BDL BDL BDL 19.430 BDL BDL BDL
2,3,4,7,8‐PeCDF 1 31.566 BDL BDL 13.050 BDL BDL BDL BDL
1,2,3,4,7,8‐HxCDF 0.1 BDL 34.162 BDL BDL BDL 29.653 26.404 24.674
1,2,3,6,7,8‐HxCDF 0.1 BDL BDL BDL BDL BDL 18.335 BDL BDL
2,3,4,6,7,8‐HxCDF 0.1 BDL BDL BDL BDL BDL BDL BDL BDL
1,2,3,7,8,9‐HxCDF 0.1 BDL BDL BDL BDL BDL BDL BDL BDL
1,2,3,4,6,7,8‐HpCDF 0.01 BDL BDL BDL BDL BDL BDL BDL BDL
1,2,3,4,7,8,9‐HpCDF 0.01 BDL BDL BDL BDL BDL BDL BDL BDL
OCDF 0.0001 BDL BDL BDL BDL BDL BDL BDL BDL
PCB‐77 0.05 37.094 18.366 118.695 17.783 23.112 76.675 33.671 35.195
PCB‐81 0.1 BDL 5.966 37.280 16.174 8.197 17.457 13.941 10.515
PCB‐126 0.1 97.060 148.240 113.981 96.495 41.517 159.218 148.386 143.661
PCB‐169 0.001 0.103 0.116 0.268 0.092 BDL 0.200 0.156 0.149
PCB‐105 0.0001 10.128 2.053 10.198 5.385 2.194 4.581 3.443 2.971
PCB‐114 0.0001 BDL 0.156 0.824 BDL 0.313 0.323 0.246 0.218
PCB‐118 0.00001 3.781 0.715 1.174 5.091 0.744 1.660 1.231 1.084
PCB‐123 0.00001 2.574 0.015 0.147 1.535 0.021 0.027 0.019 0.018
PCB‐156 0.0001 14.010 2.478 7.387 11.396 1.943 3.648 3.033 2.355
PCB‐157 0.0001 nr 0.369 1.217 na 0.371 0.600 0.475 0.391
PCB‐167 0.00001 0.555 0.169 0.459 0.533 0.114 0.200 0.178 0.141
PCB‐189 0.00001 0.135 0.015 0.145 0.003 0.033 0.016 0.027 0.010
TCDD‐TEQ 215 213 292 184 98 313 231 221
pg/g = parts per trillion, FWW = fresh wet weight (i.e., adjusted for moisture loss), TEF = toxic equivalency factor (Van den Berg et al. 1998),nr = not reported, BDL = below detection limit
38

Appendix Table A‐2b. TCDD‐TEQs in bald eagle eggs by sample number, pg/g fresh wet weight
ME412‐0501 ME412‐0502 ME412‐0701 ME412‐0702 ME586‐0901 NH‐01‐0601
TEF TEF Adjusted TEF Adjusted TEF Adjusted TEF Adjusted TEF Adjusted TEF Adjusted
pg/g FWW pg/g FWW pg/g FWW pg/g FWW pg/g FWW pg/g FWW
2,3,7,8‐TCDD 1 BDL BDL BDL BDL BDL BDL
1,2,3,7,8‐PeCDD 1 BDL BDL BDL BDL BDL BDL
1,2,3,4,7,8‐HxCDD 0.05 BDL BDL BDL BDL BDL BDL
1,2,3,6,7,8‐HxCDD 0.01 BDL BDL BDL BDL BDL BDL
1,2,3,7,8,9‐HxCDD 0.1 BDL BDL BDL BDL BDL BDL
1,2,3,4,6,7,8‐HpCDD < 0.001 BDL BDL BDL BDL BDL BDL
OCDD 0.0001 BDL BDL BDL 0.033 BDL BDL
2,3,7,8‐TCDF 1 BDL BDL BDL BDL BDL BDL
1,2,3,7,8‐PeCDF 0.1 BDL BDL BDL BDL BDL BDL
2,3,4,7,8‐PeCDF 1 BDL BDL 29.546 BDL 41.153 BDL
1,2,3,4,7,8‐HxCDF 0.1 BDL BDL 34.594 32.108 22.034 BDL
1,2,3,6,7,8‐HxCDF 0.1 BDL BDL BDL BDL 7.284 BDL
2,3,4,6,7,8‐HxCDF 0.1 BDL BDL BDL BDL BDL BDL
1,2,3,7,8,9‐HxCDF 0.1 BDL BDL BDL BDL BDL BDL
1,2,3,4,6,7,8‐HpCDF 0.01 BDL BDL 9.404 BDL BDL BDL
1,2,3,4,7,8,9‐HpCDF 0.01 BDL BDL BDL BDL BDL BDL
OCDF 0.0001 BDL BDL 0.002 BDL BDL BDL
PCB‐77 0.05 41.410 46.170 51.648 53.995 14.388 31.725
PCB‐81 0.1 10.414 10.260 11.982 13.405 5.944 7.968
PCB‐126 0.1 36.326 38.714 170.614 205.855 115.234 55.044
PCB‐169 0.001 0.103 0.115 0.136 0.167 0.087 0.155
PCB‐105 0.0001 3.329 3.441 3.610 4.825 2.359 3.173
PCB‐114 0.0001 0.268 0.291 0.251 0.343 0.191 0.210
PCB‐118 0.00001 1.492 1.607 1.506 2.023 0.947 1.513
PCB‐123 0.00001 0.041 0.054 0.024 0.032 0.014 0.025
PCB‐156 0.0001 3.387 3.687 3.726 4.845 1.700 2.230
PCB‐157 0.0001 0.494 0.531 0.485 0.596 0.315 0.394
PCB‐167 0.00001 0.203 0.226 0.200 0.253 0.098 0.162
PCB‐189 0.00001 0.075 0.084 0.018 0.024 0.008 0.041
TCDD‐TEQ 98 105 318 319 212 103
pg/g = parts per trillion, FWW = fresh wet weight (i.e., adjusted for moisture loss), TEF = toxic equivalency factor (Van den Berg et al. 1998),nr = not reported, BDL = below detection limit
39
Appendix Table A‐2c. TCDD‐TEQs in bald eagle eggs by sample number, pg/g fresh wet weight
ME089‐0201 ME089‐0202 ME095‐0401 ME141‐0601 ME141‐0602 ME141‐0701 ME149‐0401 ME149‐0701
TEF TEF Adjusted TEF Adjusted TEF Adjusted TEF Adjusted TEF Adjusted TEF Adjusted TEF Adjusted TEF Adjusted
pg/g FWW pg/g FWW pg/g FWW pg/g FWW pg/g FWW pg/g FWW pg/g FWW pg/g FWW
2,3,7,8‐TCDD 1 BDL BDL BDL BDL BDL BDL BDL BDL
1,2,3,7,8‐PeCDD 1 BDL BDL BDL BDL BDL BDL BDL BDL
1,2,3,4,7,8‐HxCDD 0.05 BDL BDL BDL BDL BDL BDL BDL BDL
1,2,3,6,7,8‐HxCDD 0.01 BDL BDL BDL BDL BDL BDL BDL BDL
1,2,3,7,8,9‐HxCDD 0.1 BDL BDL BDL BDL BDL BDL BDL BDL
1,2,3,4,6,7,8‐HpCDD < 0.001 BDL BDL BDL BDL BDL BDL BDL BDL
OCDD 0.0001 BDL BDL BDL BDL BDL BDL BDL BDL
BDL
2,3,7,8‐TCDF 1 BDL BDL BDL BDL BDL BDL BDL BDL
1,2,3,7,8‐PeCDF 0.1 BDL BDL 9.710 BDL BDL 13.057 9.928 35.515
2,3,4,7,8‐PeCDF 1 BDL BDL BDL BDL BDL BDL 83.950 113.680
1,2,3,4,7,8‐HxCDF 0.1 BDL BDL BDL BDL BDL BDL BDL BDL
1,2,3,6,7,8‐HxCDF 0.1 BDL BDL BDL BDL BDL BDL BDL BDL
2,3,4,6,7,8‐HxCDF 0.1 BDL BDL BDL BDL BDL BDL BDL BDL
1,2,3,7,8,9‐HxCDF 0.1 BDL BDL BDL BDL BDL BDL BDL BDL
1,2,3,4,6,7,8‐HpCDF 0.01 BDL BDL BDL BDL BDL BDL BDL BDL
1,2,3,4,7,8,9‐HpCDF 0.01 BDL BDL BDL BDL BDL BDL BDL BDL
OCDF 0.0001 BDL BDL BDL BDL BDL BDL BDL BDL
PCB‐77 0.05 11.240 6.780 201.144 13.105 13.892 12.530 121.910 22.893
PCB‐81 0.1 17.675 13.225 119.136 3.128 3.493 2.060 335.070 3.975
PCB‐126 0.1 29.258 24.775 204.816 25.808 28.747 38.441 55.334 35.907
PCB‐169 0.001 0.142 0.118 0.211 0.097 0.097 0.097 0.287 BDL
PCB‐105 0.0001 0.752 0.629 3.207 1.270 1.654 2.173 3.643 2.956
PCB‐114 0.0001 BDL BDL BDL 0.061 0.088 BDL BDL 0.392
PCB‐118 0.00001 0.444 0.413 1.599 0.426 0.618 0.597 1.139 0.770
PCB‐123 0.00001 0.074 0.069 0.309 0.009 0.013 0.013 0.594 0.020
PCB‐156 0.0001 2.617 2.201 5.459 0.852 1.229 2.052 4.249 2.305
PCB‐157 0.0001 nr nr 0.987 0.191 0.255 0.422 0.986 0.474
PCB‐167 0.00001 0.142 0.131 0.295 0.054 0.076 0.138 0.191 0.110
PCB‐189 0.00001 0.030 0.029 0.045 0.015 0.019 0.046 0.043 0.029
TCDD‐TEQ 62 48 547 45 50 72 617 219
pg/g = parts per trillion, FWW = fresh wet weight (i.e., adjusted for moisture loss), TEF = toxic equivalency factor (Van den Berg et al. 1998),nr = not reported, BDL = below detection limit
40
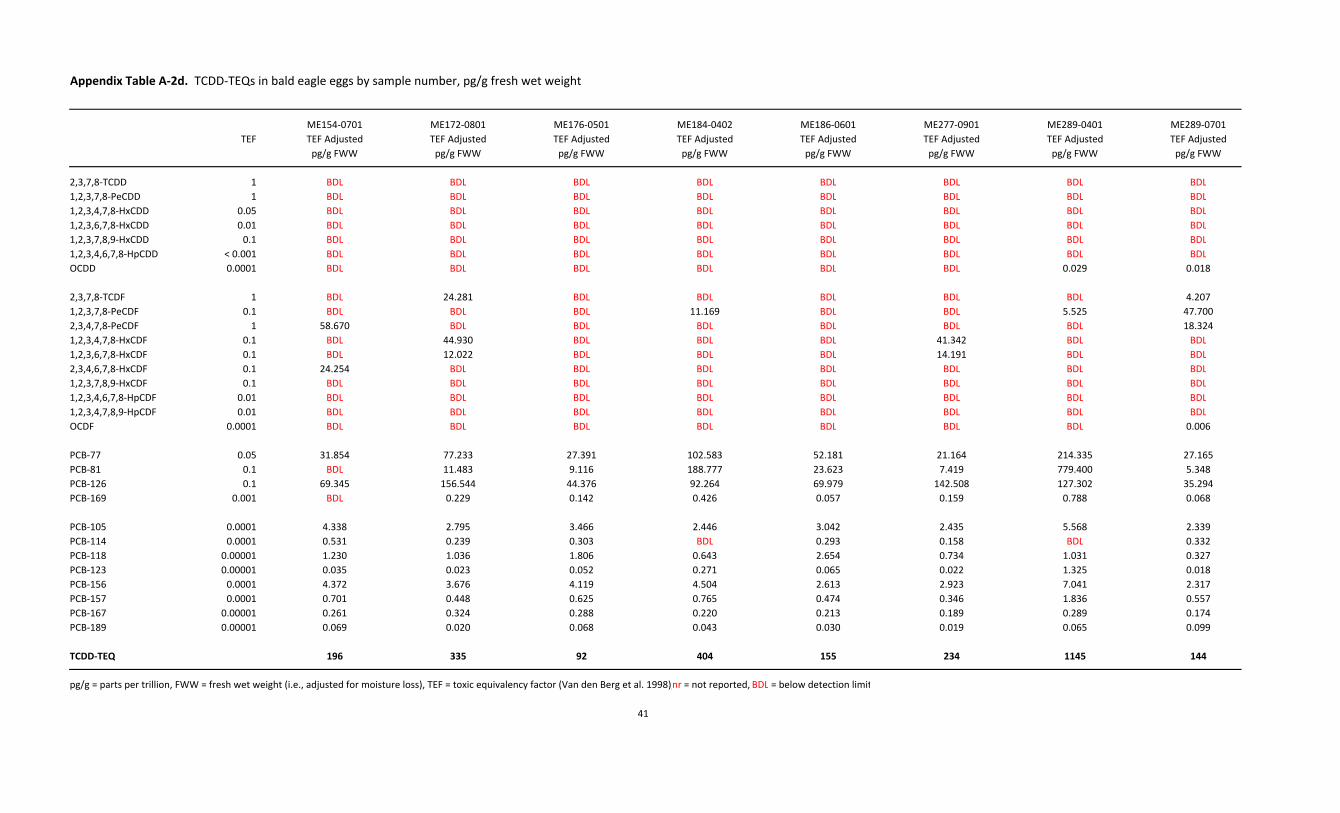
Appendix Table A‐2d. TCDD‐TEQs in bald eagle eggs by sample number, pg/g fresh wet weight
ME154‐0701 ME172‐0801 ME176‐0501 ME184‐0402 ME186‐0601 ME277‐0901 ME289‐0401 ME289‐0701
TEF TEF Adjusted TEF Adjusted TEF Adjusted TEF Adjusted TEF Adjusted TEF Adjusted TEF Adjusted TEF Adjusted
pg/g FWW pg/g FWW pg/g FWW pg/g FWW pg/g FWW pg/g FWW pg/g FWW pg/g FWW
2,3,7,8‐TCDD 1 BDL BDL BDL BDL BDL BDL BDL BDL
1,2,3,7,8‐PeCDD 1 BDL BDL BDL BDL BDL BDL BDL BDL
1,2,3,4,7,8‐HxCDD 0.05 BDL BDL BDL BDL BDL BDL BDL BDL
1,2,3,6,7,8‐HxCDD 0.01 BDL BDL BDL BDL BDL BDL BDL BDL
1,2,3,7,8,9‐HxCDD 0.1 BDL BDL BDL BDL BDL BDL BDL BDL
1,2,3,4,6,7,8‐HpCDD < 0.001 BDL BDL BDL BDL BDL BDL BDL BDL
OCDD 0.0001 BDL BDL BDL BDL BDL BDL 0.029 0.018
2,3,7,8‐TCDF 1 BDL 24.281 BDL BDL BDL BDL BDL 4.207
1,2,3,7,8‐PeCDF 0.1 BDL BDL BDL 11.169 BDL BDL 5.525 47.700
2,3,4,7,8‐PeCDF 1 58.670 BDL BDL BDL BDL BDL BDL 18.324
1,2,3,4,7,8‐HxCDF 0.1 BDL 44.930 BDL BDL BDL 41.342 BDL BDL
1,2,3,6,7,8‐HxCDF 0.1 BDL 12.022 BDL BDL BDL 14.191 BDL BDL
2,3,4,6,7,8‐HxCDF 0.1 24.254 BDL BDL BDL BDL BDL BDL BDL
1,2,3,7,8,9‐HxCDF 0.1 BDL BDL BDL BDL BDL BDL BDL BDL
1,2,3,4,6,7,8‐HpCDF 0.01 BDL BDL BDL BDL BDL BDL BDL BDL
1,2,3,4,7,8,9‐HpCDF 0.01 BDL BDL BDL BDL BDL BDL BDL BDL
OCDF 0.0001 BDL BDL BDL BDL BDL BDL BDL 0.006
PCB‐77 0.05 31.854 77.233 27.391 102.583 52.181 21.164 214.335 27.165
PCB‐81 0.1 BDL 11.483 9.116 188.777 23.623 7.419 779.400 5.348
PCB‐126 0.1 69.345 156.544 44.376 92.264 69.979 142.508 127.302 35.294
PCB‐169 0.001 BDL 0.229 0.142 0.426 0.057 0.159 0.788 0.068
PCB‐105 0.0001 4.338 2.795 3.466 2.446 3.042 2.435 5.568 2.339
PCB‐114 0.0001 0.531 0.239 0.303 BDL 0.293 0.158 BDL 0.332
PCB‐118 0.00001 1.230 1.036 1.806 0.643 2.654 0.734 1.031 0.327
PCB‐123 0.00001 0.035 0.023 0.052 0.271 0.065 0.022 1.325 0.018
PCB‐156 0.0001 4.372 3.676 4.119 4.504 2.613 2.923 7.041 2.317
PCB‐157 0.0001 0.701 0.448 0.625 0.765 0.474 0.346 1.836 0.557
PCB‐167 0.00001 0.261 0.324 0.288 0.220 0.213 0.189 0.289 0.174
PCB‐189 0.00001 0.069 0.020 0.068 0.043 0.030 0.019 0.065 0.099
TCDD‐TEQ 196 335 92 404 155 234 1145 144
pg/g = parts per trillion, FWW = fresh wet weight (i.e., adjusted for moisture loss), TEF = toxic equivalency factor (Van den Berg et al. 1998),nr = not reported, BDL = below detection limit
41

Appendix Table A‐2e. TCDD‐TEQs in bald eagle eggs by sample number, pg/g fresh wet weight
ME392‐0601 ME439‐0401 ME498‐0701
TEF TEF Adjusted TEF Adjusted TEF Adjusted
pg/g FWW pg/g FWW pg/g FWW
2,3,7,8‐TCDD 1 BDL BDL BDL
1,2,3,7,8‐PeCDD 1 BDL BDL BDL
1,2,3,4,7,8‐HxCDD 0.05 BDL BDL BDL
1,2,3,6,7,8‐HxCDD 0.01 BDL BDL BDL
1,2,3,7,8,9‐HxCDD 0.1 BDL BDL BDL
1,2,3,4,6,7,8‐HpCDD < 0.001 BDL BDL BDL
OCDD 0.0001 0.072 BDL 0.017
2,3,7,8‐TCDF 1 BDL BDL 9.339
1,2,3,7,8‐PeCDF 0.1 BDL 9.012 84.232
2,3,4,7,8‐PeCDF 1 BDL BDL 39.602
1,2,3,4,7,8‐HxCDF 0.1 BDL 1.661 BDL
1,2,3,6,7,8‐HxCDF 0.1 BDL BDL BDL
2,3,4,6,7,8‐HxCDF 0.1 BDL BDL BDL
1,2,3,7,8,9‐HxCDF 0.1 BDL BDL BDL
1,2,3,4,6,7,8‐HpCDF 0.01 BDL BDL BDL
1,2,3,4,7,8,9‐HpCDF 0.01 BDL BDL BDL
OCDF 0.0001 BDL BDL 0.004
PCB‐77 0.05 23.528 30.039 26.491
PCB‐81 0.1 BDL 310.403 7.040
PCB‐126 0.1 38.373 129.580 36.189
PCB‐169 0.001 0.104 0.654 0.081
PCB‐105 0.0001 2.307 2.474 3.305
PCB‐114 0.0001 0.185 BDL 0.355
PCB‐118 0.00001 1.199 1.037 0.472
PCB‐123 0.00001 0.021 0.133 0.021
PCB‐156 0.0001 2.870 5.266 3.385
PCB‐157 0.0001 0.560 1.119 0.418
PCB‐167 0.00001 0.150 0.369 0.202
PCB‐189 0.00001 0.037 0.056 0.135
TCDD‐TEQ 69 492 211
pg/g = parts per trillion, FWW = fresh wet weight (i.e., adjusted for moisture loss), TEF = toxic equivalency factor (Van den Berg et al. 1998),nr = not reported, BDL = below detection limit
42

Appendix Table A‐3. TCDD‐TEQs in common loon eggs by sample number, pg/g fresh wet weight
AND01E2 ANDR02 ANDR04‐1 ANDR04‐02 POCA02 Azisco1 AZIS04‐1 Mooselk1 LongPd1 FLAG04‐1
TEF Adjusted TEF Adjusted TEF Adjusted TEF Adjusted TEF Adjusted TEF Adjusted TEF Adjusted TEF Adjusted TEF Adjusted TEF Adjusted
pg/g FWW pg/g FWW pg/g FWW pg/g FWW pg/g FWW pg/g FWW pg/g FWW pg/g FWW pg/g FWW pg/g FWW
2,3,7,8‐TCDD 1 BDL BDL BDL BDL BDL 4.442 BDL BDL 1.702 BDL
1,2,3,7,8‐PeCDD 1 BDL BDL BDL BDL BDL BDL BDL BDL 10.035 BDL
1,2,3,4,7,8‐HxCDD 0.05 BDL BDL BDL BDL BDL BDL BDL BDL BDL BDL
1,2,3,6,7,8‐HxCDD 0.01 BDL BDL BDL BDL BDL 0.110 BDL BDL BDL BDL
1,2,3,7,8,9‐HxCDD 0.1 BDL BDL BDL BDL BDL BDL BDL BDL BDL BDL
1,2,3,4,6,7,8‐HpCDD < 0.001 BDL BDL BDL BDL BDL BDL BDL BDL BDL BDL
OCDD 0.0001 0.009 BDL BDL BDL BDL BDL BDL BDL BDL BDL
2,3,7,8‐TCDF 1 BDL BDL BDL BDL BDL BDL BDL BDL BDL BDL
1,2,3,7,8‐PeCDF 0.1 BDL BDL BDL BDL BDL BDL BDL BDL BDL BDL
2,3,4,7,8‐PeCDF 1 11.458 13.806 BDL BDL BDL 9.929 BDL BDL 17.203 BDL
1,2,3,4,7,8‐HxCDF 0.1 BDL BDL BDL BDL BDL BDL BDL BDL BDL BDL
1,2,3,6,7,8‐HxCDF 0.1 BDL BDL BDL BDL BDL BDL BDL BDL BDL BDL
2,3,4,6,7,8‐HxCDF 0.1 BDL BDL BDL BDL BDL BDL BDL BDL BDL BDL
1,2,3,7,8,9‐HxCDF 0.1 BDL BDL BDL BDL BDL BDL BDL BDL BDL BDL
1,2,3,4,6,7,8‐HpCDF 0.01 0.063 BDL BDL BDL BDL BDL BDL BDL BDL BDL
1,2,3,4,7,8,9‐HpCDF 0.01 BDL BDL BDL BDL BDL BDL BDL BDL BDL BDL
OCDF 0.0001 BDL BDL BDL BDL BDL BDL BDL BDL BDL BDL
PCB‐77 0.05 1.448 3.186 42.971 3.900 BDL BDL 37.577 8.297 BDL 31.696
PCB‐81 0.1 2.895 BDL 251.230 BDL 6.172 BDL 172.176 BDL BDL 43.566
PCB‐126 0.1 18.234 27.878 88.367 10.639 28.273 24.562 126.480 BDL 79.296 25.573
PCB‐169 0.001 BDL 0.059 0.226 BDL 0.056 0.176 0.849 BDL BDL 0.256
PCB‐105 0.0001 0.548 0.664 1.513 0.646 1.309 4.059 3.615 0.896 2.688 0.780
PCB‐114 0.0001 BDL BDL BDL 0.037 BDL BDL BDL BDL BDL BDL
PCB‐118 0.00001 0.189 0.306 0.527 0.249 0.420 0.793 1.151 0.414 1.514 0.276
PCB‐123 0.00001 0.111 0.258 0.331 0.004 0.116 0.066 0.268 0.005 0.097 0.013
PCB‐156 0.0001 0.473 0.671 1.688 0.587 0.614 1.132 2.954 0.840 2.204 0.473
PCB‐157 0.0001 na nr 0.703 0.114 nr nr 0.906 nr nr 0.271
PCB‐167 0.00001 0.034 0.058 0.099 0.036 0.065 0.082 0.150 0.060 0.152 0.041
PCB‐189 0.00001 0.002 0.015 0.023 0.011 0.011 0.015 0.024 0.007 0.025 0.004
TCDD‐TEQ 35 47 388 16 37 45 346 11 115 103
43

Appendix Table A‐4a. Organochlorine compounds in bald eagle eggs by sample number, ng/g fresh wet weight
Sample Number ME002‐0301 ME002‐0701 ME252‐0501 ME274‐0201 ME365‐0801 ME407‐0401 ME407‐0801 ME407‐0802 ME412‐0501 ME412‐0502 ME412‐0701 ME412‐0702 ME586‐0901 NH‐01‐0601
Polychlorinated Biphenyl
PCB‐TOTAL 13419.6 3209.1 6650.3 12866.0 3529.4 3793.4 2780.8 2570.4 3230.8 3946.7 4690.3 5252.2 2351.3 158.6
Benzene Hexachloride
alpha BHC < 2.91 BDL 0.4 < 4.81 2.4 BDL BDL BDL < 0.410 < 0.376 BDL BDL BDL < 0.239
beta BHC < 2.91 BDL 1.2 < 4.81 < 0.980 BDL BDL BDL 0.6 < 0.376 BDL BDL BDL 0.3
gamma BHC < 2.91 BDL 2.6 < 4.81 < 0.980 BDL BDL BDL 1.5 1.2 BDL BDL BDL 1.2
delta BHC < 2.91 BDL 0.7 < 4.81 < 0.980 BDL BDL BDL < 0.410 < 0.376 BDL BDL BDL < 0.239
ΣBHC BDL BDL 4.8 BDL 2.4 BDL BDL BDL 2.2 1.2 BDL BDL BDL 1.5
Chlordane Compounds
alpha chlordane 9.5 1.6 11.1 6.3 8.1 2.9 2.5 2.7 5.2 6.6 1.9 1.9 2.3 3.9
gamma chlordane < 2.91 BDL 11.2 < 4.81 < 0.980 3.5 2.2 0.4 < 0.410 < 0.376 BDL 0.3 1.3 1.8
cis‐nonachlor 48.7 8.9 29.0 23.8 17.2 14.9 12.6 10.6 12.5 11.1 8.6 10.8 11.7 < 0.239
trans‐nonachlor 151.1 22.9 90.8 71.1 48.3 52.9 39.9 35.1 33.5 40.8 30.3 35.6 47.1 1.0
oxychlordane 24.0 2.4 40.1 26.1 10.6 15.2 6.7 8.5 14.4 17.0 12.1 14.5 14.5 1.1
ΣChlordane 233.3 35.9 182.3 127.4 84.2 89.5 64.0 57.1 65.5 75.5 52.9 63.1 77.0 7.7
heptachlor < 2.91 BDL 2.0 < 4.81 < 0.980 BDL BDL BDL 2.3 < 0.376 BDL BDL BDL 0.3
heptachlor epoxide < 2.91 BDL 5.3 5.0 0.8 2.3 BDL 1.2 2.6 4.2 2.4 2.0 2.2 < 0.239
DDT Metabolites and Isomers
o,p'‐DDD 38.7 10.7 7.1 28.5 20.8 11.4 10.6 2.5 12.7 8.7 7.6 9.0 5.3 0.3
o,p'‐DDE < 2.91 BDL 1.0 < 4.81 1.6 0.2 BDL BDL 1.4 1.1 0.0 0.0 BDL 1.0
o,p'‐DDT 47.5 BDL 17.7 34.6 14.4 13.4 7.6 8.3 10.9 8.2 10.0 12.7 5.3 0.7
p,p'‐DDD 106.3 31.8 76.9 56.3 38.0 48.1 37.7 31.8 48.1 53.5 79.2 87.9 71.8 0.9
p,p'‐DDE 3418.2 701.2 968.4 2398.6 668.7 1273.6 987.3 1008.1 524.0 596.4 1235.0 1360.5 1006.2 10.5
p,p'‐DDT < 2.91 0.7 6.8 < 4.81 < 0.980 1.8 BDL 1.2 5.6 9.2 0.9 BDL 0.9 5.0
ΣDDT 3610.7 744.4 1077.9 2518.0 743.4 1348.4 1043.2 1051.9 602.6 677.1 1332.7 1470.0 1089.4 18.5
Other organochlorines
aldrin < 2.91 BDL < 0.286 < 4.81 2.9 BDL BDL BDL < 0.410 < 0.376 BDL BDL BDL < 0.239
endrin 11.3 BDL < 0.286 < 4.81 < 0.980 BDL BDL BDL 1.7 3.1 BDL BDL BDL < 0.239
dieldrin 51.8 7.7 32.7 32.2 12.2 14.5 11.1 7.9 15.1 15.3 11.8 13.5 17.1 < 0.239
endosulfan II 4.1 BDL < 0.286 < 4.81 < 0.980 0.0 BDL BDL 1.8 2.1 BDL BDL BDL < 0.239
HCB 3.9 1.5 8.7 7.2 7.4 3.6 2.1 2.0 7.3 6.3 4.0 4.3 3.1 0.5
mirex 15.5 1.6 14.9 11.9 6.4 4.0 5.0 4.1 9.6 9.6 3.7 2.9 2.2 < 0.239
pentachloro‐anisole < 2.91 1.5 0.8 < 4.81 18.0 BDL BDL BDL 1.2 1.1 BDL BDL BDL 0.6
toxaphene < 29.1 NA < 5.71 < 24.0 < 19.6 NA NA NA < 8.20 < 7.52 NA NA NA < 4.78
ng/g = parts‐per‐billion. Values in red preceded by < symbol indicate non‐detects and detection limit. NA = not analyzed. BDL = below detection limit.
44
Androscoggin Lake Androscoggin Watershed

Appendix Table A‐4b. Organochlorine compounds in bald eagle eggs by sample number, ng/g fresh wet weight
Sample Number ME089‐0201 ME089‐0202 ME095‐0401 ME141‐0601 ME141‐0602 ME141‐0701 ME149‐0401 ME149‐0701 ME154‐0701 ME172‐0801
Polychlorinated Biphenyl
PCB‐TOTAL 1278.4 1213.7 3231.4 1181.9 1485.6 2603.3 2898.1 4312.0 4876.3 3835.8
Benzene Hexachlorides
alpha BHC < 1.57 < 1.52 < 0.478 < 0.350 0.2 3.1 < 0.493 1.1 3.9 BDL
beta BHC < 1.57 < 1.52 < 0.478 0.7 < 0.178 < 0.877 0.7 < 0.893 < 0.943 BDL
gamma BHC < 1.57 < 1.52 < 0.478 < 0.350 0.5 < 0.877 < 0.493 < 0.893 < 0.943 BDL
delta BHC < 1.57 < 1.52 < 0.478 < 0.350 < 0.178 < 0.877 < 0.493 < 0.893 < 0.943 BDL
ΣBHC BDL BDL BDL 0.7 0.6 3.1 0.7 1.1 3.9 BDL
Chlordane Compounds
alpha chlordane 2.8 4.6 1.1 2.4 3.3 2.5 2.1 1.6 < 0.943 2.2
gamma chlordane < 1.57 1.4 < 0.478 < 0.350 0.3 3.9 0.5 5.3 < 0.943 0.5
cis‐nonachlor 6.5 6.1 5.3 12.1 13.6 26.6 8.3 23.4 22.0 10.2
trans‐nonachlor 23.2 21.9 18.0 32.5 41.0 56.6 29.9 34.1 55.9 40.4
oxychlordane 9.1 8.9 8.1 6.5 6.3 12.0 11.5 16.5 27.4 7.4
ΣChlordane 41.6 43.0 32.4 53.6 64.5 101.6 52.3 81.0 105.3 60.6
Heptachlor < 1.57 < 1.52 < 0.478 < 0.350 0.2 < 0.877 < 0.493 < 0.893 < 0.943 BDL
heptachlor epoxide 1.6 1.5 1.3 1.4 1.8 3.3 1.5 1.5 1.2 1.8
DDT Metabolites and Isomers
o,p'‐DDD 1.7 1.8 5.0 2.3 2.5 12.4 5.9 16.8 6.2 6.2
o,p'‐DDE < 1.57 < 1.52 < 0.478 < 0.350 0.2 0.8 0.4 1.9 1.8 BDL
o,p'‐DDT 2.5 3.1 10.0 4.6 3.1 1.0 10.9 1.2 7.5 9.3
p,p'‐DDD 10.0 9.0 22.3 27.3 30.8 37.2 28.3 49.0 43.0 29.7
p,p'‐DDE 364.7 334.8 603.0 687.4 867.2 859.7 529.3 697.0 913.8 566.9
p,p'‐DDT < 1.57 < 1.52 < 0.478 < 0.350 1.3 10.9 < 0.493 5.0 7.0 BDL
ΣDDT 378.9 348.8 640.3 721.6 905.1 921.9 574.7 770.9 979.3 612.2
Other organochlorines
aldrin < 1.57 < 1.52 < 0.478 < 0.350 < 0.178 0.8 < 0.493 1.4 < 0.943 BDL
endrin < 1.57 < 1.52 < 0.478 < 0.350 < 0.178 < 0.877 < 0.493 < 0.893 < 0.943 BDL
dieldrin 8.2 7.6 10.7 10.1 13.0 12.6 11.4 14.3 11.0 13.8
endosulfan II < 1.57 < 1.52 1.0 0.5 0.7 < 0.877 1.3 < 0.893 < 0.943 BDL
HCB 2.6 2.5 2.3 2.8 3.7 3.3 2.8 2.2 3.0 2.3
mirex 7.1 6.7 8.5 4.4 5.7 6.6 6.1 5.8 13.1 7.9
pentachloro‐anisole < 1.57 < 1.52 1.0 0.7 0.5 1.0 0.8 < 0.893 1.1 BDL
toxaphene < 19.7 < 18.9 < 4.78 < 6.99 < 3.56 < 17.5 < 4.93 < 17.9 < 18.9 NA
ng/g = parts‐per‐billion. Values in red preceded by < symbol indicate non‐detects and detection limit. NA = not analyzed. BDL = below detection limit.
45
Penobscot Watershed

Appendix Table A‐4c. Organochlorine compounds in bald eagle eggs by sample number, ng/g fresh wet weight
Sample Number ME176‐0501 ME184‐0402 ME186‐0601 ME277‐0901 ME289‐0401 ME289‐0701 ME392‐0601 ME439‐0401 ME498‐0701
Polychlorinated Biphenyl
PCB‐TOTAL 3336.8 2816.5 2863.9 2829.8 4208.8 4228.1 2911.0 3021.6 4005.1
Benzene Hexachlorides
alpha BHC < 0.439 < 0.485 0.5 BDL < 0.488 < 0.239 0.4 < 0.508 < 0.237
beta BHC < 0.439 < 0.485 0.3 BDL 1.1 0.2 < 0.450 < 0.508 < 0.237
gamma BHC 1.1 < 0.485 < 0.360 BDL < 0.488 < 0.239 < 0.450 < 0.508 < 0.237
delta BHC < 0.439 < 0.485 < 0.360 BDL < 0.488 < 0.239 < 0.450 < 0.508 < 0.237
ΣBHC 1.1 BDL 0.8 BDL 1.1 0.2 0.4 BDL BDL
Chlordane Compounds
alpha chlordane 6.3 0.9 3.0 1.0 3.2 3.8 1.9 2.1 2.9
gamma chlordane < 0.439 0.3 0.6 2.3 0.8 3.5 0.8 0.5 2.9
cis‐nonachlor 13.2 4.2 24.5 7.8 14.4 6.5 6.4 13.0 8.4
trans‐nonachlor 51.6 14.8 73.3 26.3 48.6 23.2 54.3 40.0 26.1
oxychlordane 12.1 7.2 26.4 15.7 16.3 11.6 18.1 13.1 9.0
ΣChlordane 83.3 27.4 127.8 53.1 83.3 48.6 81.5 68.7 49.3
Heptachlor 2.4 1.4 < 0.360 BDL < 0.488 < 0.239 < 0.450 < 0.508 < 0.237
heptachlor epoxide 2.2 1.2 4.4 2.3 2.9 2.7 1.2 1.4 1.7
DDT Metabolites and Isomers
o,p'‐DDD 12.2 4.9 9.4 7.4 9.9 6.4 14.6 11.4 7.6
o,p'‐DDE 1.3 < 0.485 < 0.360 BDL 0.7 1.2 < 0.450 < 0.508 3.6
o,p'‐DDT 9.2 9.0 11.3 5.2 16.3 5.0 17.4 12.8 7.1
p,p'‐DDD 23.4 20.5 30.3 47.8 65.6 17.8 23.5 22.9 17.2
p,p'‐DDE 463.5 312.0 1642.3 794.8 1368.3 581.8 521.0 1001.3 497.5
p,p'‐DDT 13.1 < 0.485 1.0 4.0 < 0.488 5.3 1.5 1.5 1.6
ΣDDT 522.8 346.4 1694.3 859.0 1460.7 617.5 578.1 1049.9 534.5
Other organochlorines
aldrin < 0.439 < 0.485 < 0.360 BDL < 0.488 < 0.239 < 0.450 < 0.508 0.7
endrin 8.4 < 0.485 < 0.360 BDL < 0.488 0.7 0.5 < 0.508 1.0
dieldrin 18.8 11.4 24.8 15.5 21.2 11.2 9.4 11.9 10.9
endosulfan II 8.2 1.0 < 0.360 BDL 3.3 14.8 2.4 0.5 < 0.237
HCB 3.1 2.0 4.1 2.9 5.1 2.1 1.5 2.8 2.8
mirex 15.2 4.3 23.8 10.5 6.3 1.9 21.9 15.4 2.8
pentachloro‐anisole 1.0 0.9 0.5 BDL 1.2 0.5 0.9 0.5 0.8
toxaphene < 8.77 < 4.85 < 7.19 NA < 4.88 < 4.78 < 9.01 < 5.08 < 4.74
ng/g = parts‐per‐billion. Values in red preceded by < symbol indicate non‐detects and detection limit. NA = not analyzed. BDL = below detection limit.
46
Penobscot Watershed

Appendix Table A‐5. Organochlorine compounds in common loon eggs by sample number, ng/g fresh wet weight
Sample Number AND01E2 ANDR02 ANDR04‐1 ANDR04‐02 POCA02 Azisco1 AZIS04‐1 Mooselk1 LongPd1 FLAG04‐1
Polychlorinated Biphenyl
PCB‐TOTAL 748.8 1141.7 1746.0 985.9 781.5 1733.3 1885.0 647.6 2383.4 484.0
Benzene Hexachlorides
alpha BHC 1.4 < 1.24 < 0.457 0.6 < 1.26 < 3.52 < 0.543 < 3.05 < 3.97 < 0.500
beta BHC 1.9 < 1.24 < 0.457 1.2 < 1.26 < 3.52 0.5 < 3.05 < 3.97 0.4
gamma BHC < 1.68 < 1.24 < 0.457 1.1 < 1.26 < 3.52 < 0.543 < 3.05 < 3.97 < 0.500
delta BHC < 1.68 < 1.24 < 0.457 < 1.00 < 1.26 < 3.52 < 0.543 < 3.05 < 3.97 < 0.500
ΣBHC 3.3 BDL BDL 2.9 BDL BDL 0.5 BDL BDL 0.4
Chlordane Compounds
alpha chlordane 1.0 1.3 0.5 0.4 1.2 < 3.52 1.3 < 3.05 < 3.97 < 0.500
gamma chlordane < 1.68 < 1.24 < 0.457 < 1.00 < 1.26 < 3.52 < 0.543 < 3.05 < 3.97 < 0.500
cis‐nonachlor 3.2 5.7 5.9 2.9 2.5 5.2 5.4 4.0 13.7 1.7
trans‐nonachlor 7.0 11.5 14.0 6.4 11.4 12.1 16.7 12.7 43.7 7.8
oxychlordane 3.7 6.7 7.2 1.8 7.1 12.7 11.8 6.4 20.5 5.6
ΣChlordane 14.8 25.2 27.6 11.5 22.2 30.0 35.2 23.2 78.0 15.1
heptachlor < 1.68 < 1.24 < 0.457 < 1.00 1.1 < 3.52 < 0.543 < 3.05 < 3.97 < 0.500
heptachlor epoxide 1.2 1.5 1.9 0.9 1.7 < 3.52 2.3 < 3.05 6.6 1.7
DDT Metabolites and Isomers
o,p'‐DDD < 1.68 3.4 5.6 < 1.00 3.3 6.6 5.4 5.4 17.1 2.1
o,p'‐DDE 2.0 < 1.24 < 0.457 < 1.00 < 1.26 < 3.52 0.5 < 3.05 < 3.97 < 0.500
o,p'‐DDT 2.0 1.6 7.3 1.2 2.6 8.4 6.8 < 3.05 11.1 2.0
p,p'‐DDD 4.2 3.7 4.9 7.3 8.6 4.8 13.5 < 3.05 10.3 0.8
p,p'‐DDE 177.3 291.2 329.8 177.5 232.7 189.9 198.3 143.5 1039.4 72.5
p,p'‐DDT < 1.68 1.3 0.7 1.6 1.2 < 3.52 < 0.543 4.1 7.8 < 0.500
ΣDDT 185.5 301.2 348.3 187.6 248.3 209.7 224.6 153.0 1085.7 77.4
Other organochlorines
aldrin < 1.68 < 1.24 < 0.457 < 1.00 < 1.26 < 3.52 < 0.543 < 3.05 < 3.97 < 0.500
endrin < 1.68 < 1.24 < 0.457 6.6 1.2 3.1 < 0.543 < 3.05 6.9 < 0.500
dieldrin 3.6 6.1 5.5 5.8 1.3 12.5 17.0 5.1 22.8 3.8
endosulfan II < 1.68 < 1.24 < 0.457 1.3 3.5 < 3.52 0.6 < 3.05 < 3.97 < 0.500
HCB 2.7 1.9 2.9 3.2 4.7 < 3.52 6.6 4.3 5.3 2.4
mirex 1.0 1.8 1.8 < 1.00 2.2 < 3.52 3.2 5.0 8.2 1.3
pentachloro‐anisole < 1.68 < 1.24 < 0.457 1.3 1.1 < 3.52 0.6 < 3.05 < 3.97 0.4
toxaphene < 8.39 < 15.5 < 4.57 < 20.0 < 15.7 < 35.2 < 5.43 < 30.5 < 39.7 < 5.00
ng/g = parts‐per‐billion. Values in red preceded by < symbol indicate non‐detects and detection limit. NA = not analyzed. BDL = below detection limit.
47
Androscoggin Lake Androscoggin Watershed Kennebec Watershed