spearman simultaneous estimation - nasa · the regression equations of (l.l), we make use...
TRANSCRIPT

Spearman Simultaneous Estimation
for a Compartmental Model
John J . Beauchamp and Richard G . Cornel1
Technical Report Number 9
NASA Grant Number NGR-10-004-029
Department of S t a t i s t i c s Florida State Univers i ty
Tallahassee , Florida
https://ntrs.nasa.gov/search.jsp?R=19670009709 2020-04-03T03:04:22+00:00Z

1
SPEARMAN SIMULTANEOUS ESTIMATION
TOR A COMPARTMENTAL MODEL*
John J. Beauchamp and Richard G. Cornel1 Oak Ridge National Laboratory, Oak Ridge, Tennessee, U.S.A. and
Florida State University, Tallahassee, Florida, U.S.A.
SUMi4ARY
A compartmental model is presented for tracer experiments with a fixed
and known amount of tracer material which is injected initially into a single
compartment and accumulates in another compartment.
as a description of chemical reactions.
The model could also arise
The model is represented as a system
of linear combinations of exponentials with common exponential parameters.
Then a simultaneous estimation procedure, which is a generalization of the
Spearman estimation procedure presented by Johnson and Brown [1961] for a single
equation, is developed for this model under the assumption that the values of
the independent variable in the model are equally spaced on a logarithmic
scale.
an example is given.
Asymptotic properties of the estimation procedure are investigated and
* This investigation was part of the doctoral research of John J.
Beauchamp at Florida State university. Service fellowship S-Fl-GM-15,632-03 and training graht 5T1 GM-913 from the National Institute of General Medical Sciences, and by NASA grane number
It was supported by Public Health
NGR 10-004-029.
- 2 -
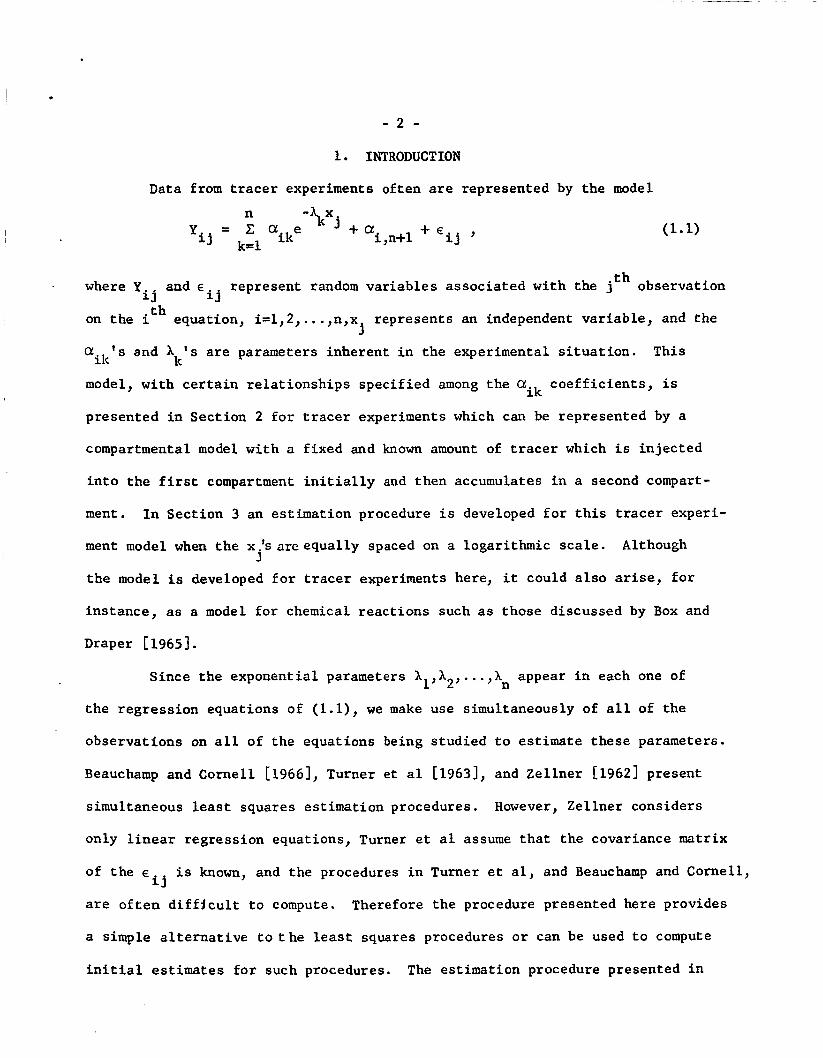
1 INTRODUCTION
Data from tracer experiments often are represented by the model
and E where Yij represent random variables associated with the jth observation ij th on the i equation, i=1,2, ..., n,x represents an independent variable, and the
Q:
model, with certain relationships specified among the CII coefficients, is
presented in Section 2 for tracer experiments which can be represented by a
compartmental model with a fixed and known amount of tracer which is injected
into the first compartment initially and then accumulates in a second compart-
ment.
ment model when the x.'snreequally spaced on a logarithmic scale.
the model is developed for tracer experiments here, it could also arise, for
instance, as a model for chemical reactions such as those discussed by Box and
Draper [ 1965 1.
j ' s and 1 ' s are parameters inherent in the experimental situation. This i 1c k
ik
In Section 3 an estimation procedure is developed for this tracer experi-
Although J
Since the exponential parameters X 1,X2,...,h appear in each one of
the regression equations of (l.l), we make use simultaneously of all of the
observations on all of the equations being studied to estimate these parameters.
Beauchamp and Cornell [1966], Turner et a1 [1963], and Zellner C19621 present
simultaneous least squares estimation procedures. However, Zellner considers
n
only linear regression equations, Turner et a1 assume that the covariance matrix
of the cij is known, and the procedures in Turner et al, and Beauchamp and Cornell,
are often difficult to compute.
a simple alternative tothe least squares procedures or can be used to compute
Therefore the procedure presented here provides
initial estimates for such procedures. The estimation procedure presented in

- 3 -
Section 3 is a generalization of the Spearman estimation technique presented by
Johnson and Brown c19611, who considered the estimation problem for n=l and
-all= 1 in equation (l.l), that is, for a single equation simple exponential
regression model. In Section 4 some of the asymptotic properties of the estimators
. found by the procedure developed in Section 3 are stated. An example showing the
application of the procedure for a particular regression model is given in Section
5.
2. MODELS
The use of radioactive tracer material is an example of an experimental
situation which yields data that may be described by the set of regression equations
given by (1.1).
the formulation of mathematical models for such experiments.
experiment these formulations represent an organism by several chemical states
or sites of a physiological substance designated as compartments.
that there are fixed transition probabilities or turnover rates from one compart-
ment to another, and the whole system is assumed to be in steady state.
turnover rates are also assumed to be proportional to the amounts of material
in the compartments. The mammillary and catenary systems are two examples of
compartmentalized systems in steady state and Sheppard [1962] gives a detailed
discussion of these systems.
(1) The catenary system involves (n+l) compartments that may be thought of as
arranged in a chain-like manner where each compartment has non-zero transition
rates only with the compartments adjacent to it.
(2)
rates with a central compartment but no turnover between the n peripheral
compartments.
Berman and Schoenfeld c19561 and Sheppard E19621 have discussed
In a biological
It is assumed
The
-
These models may be formally described as follows:
The mammillary system involves n peripheral compartments that have turnover
- 4 -
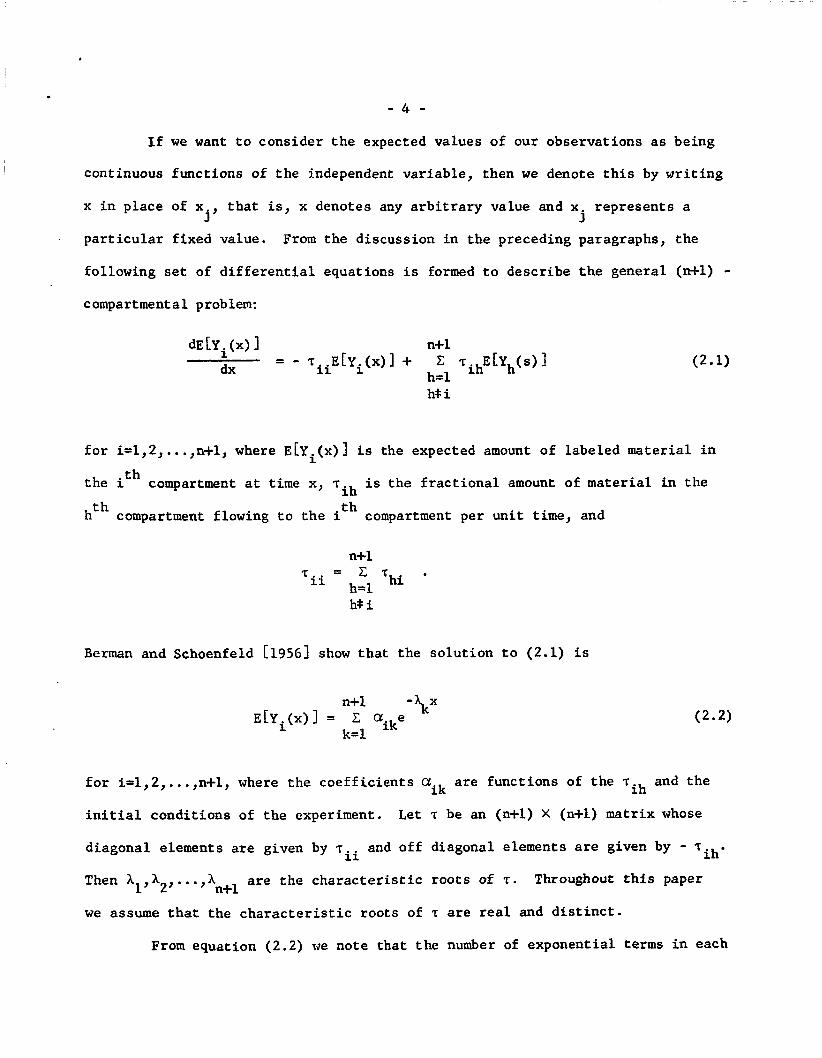
I f we want t o consider t he expected values of our observations a s being
continuous functions of the independent var iable , then we denote t h i s by wri t ing
x i n place of x t h a t is , x denotes any a r b i t r a r y value and x represents a 1’ j
I par t i cu la r f ixed value. From the discussion i n the preceding paragraphs, the
following s e t of d i f f e r e n t i a l equations i s formed t o descr ibe the general (n-kl)
compartmental problem:
-
f o r
the
ht
i=1,2, . . . ,n+l, where E[Yi(x) 1 i s the expected amount of labeled mater ia l i n
t h i compartment a t time x, T is the f r ac t iona l amount of mater ia l i n the i h t h compartment flowing t o the i compartment per un i t time, and
7 . . = c Thi * 11 h-1
M i
Berman and Schoenfeld [1956] show tha t the so lu t ion t o (2.1) is
n+l -XkX EIYi(x)l = C aike
k=l
f o r i=1,2, ..., n+l, where the coef f ic ien ts aik a re functions of the 7
i n i t i a l conditions of the experiment. Let T be an (n+l) X (n+l) matrix whose
diagonal elements a re given by T~~ and off diagonal elements a r e given by - T Then X1,X2,. . . , 1 a r e the cha rac t e r i s t i c roots of 7. Throughout t h i s paper
we assume t h a t the c h a r a c t e r i s t i c roots of T a r e r e a l and d i s t i n c t .
and the i h
i h
n+l
From equation (2.2) we note tha t the number of exponential terms i n each

- 5 -
equation is determined by the number of nonzero characteristic roots of 7, which
is either n or n+l when these roots are distinct and which is also equal to the
rank of T. By investigating the matrix T for the general (n+l) - compartment catenary and mammillary systems, we can show that the rank of 7 is equal to n,
so exactly one A, say A is zero. In addition, when the amount of tracer
material in the system is fixed and known, we can express the system of equations n+l’
given in equation ( 2 . 2 ) in terms of new quantities which represent the proportions
of labeled material in the compartments at time x.
only n independent equations in (2.2) since
In this instance there are
n+l C EIYi(x)l i=l
is fixed €or all x. We also impose the following conditions: (1) EIY1(0)l =
E[Y2(+ -)I = 1 and (2) EIY1(+ m ) ] = E[Y2(0)] = 0, which would be satisfied by
an (n+l) - compartment catenary or mammillary system where a fixed amount of tracer material is injected into the first compartment of the system and is
allowed to accumulate in the second compartment of the system. We may now
combine the above discussion into the following theorem:
Theorem 1: The regression model used to describe the general (n+l) - compart- ment catenary or mammillary systems, when a fixed and known amount of tracer
material is injected into the first compartment and accumulates in the second
compartment of the system, is given by the model in equation (1.1) with the
following relations satisfied by the coefficients of (1.1):
(1) “l,a+l= 0; a = ball- . . -0 In 1,n-f ’
(2) a2,n+l ’1; a 2n = - (a21+ a22+...+ a2,J 012,n+l 1
= - “w2,n-1) ,

- 6 -
= 0 f o r i=3,4, ..., n, (3) ai,n+l
(4) ain = - (ail+ ai2+".wi,n-l ) f o r i=3,4 ,..., n.
During the development of the estimation procedure given i n the next
section, the only assumption t h a t we need t o make about the random variables
E However, addi t ional assumptions are
needed i n order t o invest igate some of the asymptotic properties of the estimators
found by t h i s procedure and these assumptions a r e given i n Sect ion.4.
i s t h a t E(eij) = 0 f o r a l l i and j. i j
'
3. GENERALIZED SPEARMAN ESTIMATION
I n t h i s sect ion w e develop an estimation procedure f o r equally spaced
x values on a logarithmic scale, which i s a general izat ion of the Spearman estimation
procedure presented by Johnson and Brown [1961], t o estimate the parameters i n
the regression model given i n Theorem 1. We assume here tha t the independent
var iab le i s of the form x = exp(z).
equations of our model a re of two d i f fe ren t types:
From Theorem 1 we note t h a t the regression
(3 1) z n-1
k=l E[Yi(z)] = C a. l k exp(-h k e ) + (l-ail- ...-a i ,n-1 )exp(-hne2) ,
i=l ,2;
i=3,4, ..., n. Thenconsideration of equation (3.1) and the i n t e g r a l
f o r s=1,2, ..., n, leads ,a f te r extensive algebra, t o the relat ionship

. - 7 -
i=1,2, where
Ki2 = Id2)+ 1 12- 211Kil
00 h -t Ih = 1 (ant) e dt, h=1,2,.. .,n, 0
IC and the A ,r=1,2,...,n, are the n elementary symmetric functions of the JnX r That is, A equals the sum of all possible products of the terms $n\ taken
r at a time. Also, equations(3.2) and ( 3 . 3 ) can be used to show that r
'i,n-lA1+ 1 K;,n-2 A 2 +...+ Kf2Anm2+ KflAn-l = Kin ,
i = 3 , 4 , ..., n, where
n -. . . -(n-l)I K' Kin 1 1 i,n-1
and I and A are defined above. The detailed algebra leading
( 3 . 5 ) is given by Beauchamp [1966].
h r
( 3 5)
to ( 3 . 4 ) and
From the set of linear equations in the Arts given by ( 3 . 4 ) and ( 3 . 5 ) , I
we solve for the quantities \,A2, ..., An in terms of the K's and K ' s . Using

- 8 - these so lu t ions w e proceed t o solve for .hhl,Jnhp, ..., h h n , by applying the
same technique as discussed by Cornel1 119621, t ha t i s , we obtain the n roots
of the polynomial
w I- (-l)"An = 0 . n n-1 w - A 1 wn-l+ A2wn-2-. . .+(-1) 'n-1
These roots , say wk,k=1,2, ... ,n, a r e re la ted t o the
where the ordering of the hlCts i s a rb i t r a ry .
parameters by )lk= exp(wk),
tle note t h a t the solut ions fo r
Xk,k=1,2, ..., n, a r e functions of the K ' s and Kits, which, i n turn, a r e functions
of known constants and the unknown quan t i t i e s p!') f o r i ,s=1,2, ..., n.
i n order t o obtain estimators of the exponential parameters we need only t o
Hence, 1
(SI . propose est imators f o r the pi
The observations fo r each regression equation of our model a r e taken i n
a manner similar t o t h a t discussed by Johnson and Brown [1961], t h a t is, f o r an
odd number of observations the values of the independent var iable a r e given by
z
values of the independent var iab le a re given by z = z + d(j+%) f o r j = O , f l , f 2 , . . . ,
= z + j d where j=0,21,22, ..., kM, and for an even number of observations the j 0
j 0
rh *(M-1), -M. L e t y represent t h e value of the j t h observation on the i i j
equation.
we take as an estimator of p i s ) the sum
Then by considering the de f in i t i on of a Riemann-Stieltjes i n t eg ra l ,
N - 1 Z . + Z
= c ( ' 2i+l)sAyij , 'i j = - M
(3.7)
where bij= yi,j+l- yij,z has been defined e a r l i e r , and N=M-l i f an even number
of observations i s taken and N=M i f an odd number of observations i s taken. We
assume t h a t M i s large enough so t ha t y
j
= E[Yi(-=) 1 and y i , N = E[Yi(m) 1. i, -M

Then by using the estimators of
the K's and K '6, we obtain our I
- 9 -
P i s ) given by (3.13) in the expressions for
estimators of the X.,k=l,2,...,n. 1
Next we want to estimate the coefficients or linear parameters in our
regression model. To obtain these estimators we substitute the estimators of the
xlc) found by the generalized Spearman estimation procedure described above, into
our set of n independent regression equations.
ik ' of n regression equations which are linear in the unknown coefficients a!
Therefore, to estimate these coefficients we use the weighted least squares
procedure as given by Zellner [1962] if it is reasonable to assume that the
covariance matrix of the random variables E is known apart from a constant ij multiplier. Otherwise, we apply a weighted least squares procedure using an
estimated covariance matrix as discussed by Beauchamp and Cornel1 [19661 and
Telser [1964].
estimation of the exponential or nonlinear parameters by a generalized Spearman
estimation procedure; and (2) the estimation of the coefficients or linear para-
meters by a weighted least squares procedure after substituting the estimates
of the nonlinear parameters into the regression equations.
experiments estimation of the exponential parameters is of primary importance
so that only the first step might be completed.
After doing this we have a set
So our estimation procedure involves two main steps: (1) the
In most tracer
4 . EVALUATION OF THE ESTIMATORS
In order to apply the estimation procedure developed in Section 3, we
need only assume that E(€..) = 0 for all i and j and that M is large enough
so that y The consistency of
the estimators of the exponential parameters can be shown under the following
additional assumptions:
(1) For fixed i, the random variables E
1 3
= E[Yi(-m)] and yiN = E[Y.(m)l for all i. i, -M 1
where i=1,2, ..., n and j=0,*1,*2, ...,* M ij'

- 10 - or j=O,fl,f2, ...,+( M-l),-M, are uncorrelated with finite variance such that
Var(E. ) tends to zero as M 34).
(2) For i*.u and j*v, the random variables E and E are uncorrelated.
(3) For i,s=1,2, ..., n,
iM
ij uv
lim Var(pi M + w
exists and equals zero.
(4)
The consistency of the estimators of the exponential parameters is demonstrated
For all j,d=zj+l- z is such that lim d = 0 and lim dM = 4).
M + a M - 4 ) j
by Beauchamp E19661 by considering the estimators as functions of the h ( S ) Pi
estimators defined in (3.7), and applying the definition of a Riemann-Stieltjes
integral and a form of Tchebycheff's theorem given by Cramlr [1946]. Using the
same set of assumptions, it can also be shown that the estimators of the linear
parameters are also consistent if these estimators are continuous functions of
the 1 's, the estimators of the exponential parameters, and if the covariance
matrix of the cij's is specified apart from a constant multiplier or is replaced
by a consistent estimator in the weighted least squares calculations.
h
k
h
If X represents the n X 1 vector of estimators of the exponential
parameters whose true values are given by the vector A, then it can be shown that 1, 3 h
as M + 00, (l-A)/[d (M+N-2)]'* has a limiting multivariate normal distribution
under the assumptions stated at the beginning of this section plus the additional
assumption that the elements of A have continuous second order derivatives of h
h
every kind with respect to the elements of p:)> where
represents the transpose of a vector. The mean vector of this limiting distri-
bution is shown to be equal to the zero vector and the covariance matrix is given by

- 11 -
A(*)- E ( P r ) ) , F = (F1,F2 T T ,..., Fn> T T , A
where d,M, and N are defined in Section 3, E*,= W*
and n A A A
evaluated at the point ir’= pr’ for k=1,2, ..., n. Each entry in this covariance
matrix exists under the assumptions given above.
are also given by Beauchamp [1966].
The details of this demonstration
5 . EXAMPLE
In this section we apply the estimation technique developed in Section 3
to the set of data given in Table 1.
compartmental model represented by the following diagram for a tracer experiment:
These data have been generated for a
The experiment could consist of a test of the rapidity with which particulate
contamination is removed from a horizantal laminar flow clean room. Compartment
3 would represent a site near the wall where the air stream enters the laminar
flow room, while Compartments 2 and 1 would represent sites in the middle and
at the exhaust end of such a room, respectively.
in Compartment 3 and the relative amount of contamination in each of the com-
partments would be determined at time intervals equally spaced on a logarithmic
scale.
Contaminants would be released

- 12a - We now note t h a t we have brought t h i s example i n t o the same framework
as the general compartmental problem discussed i n Section 2.
a system of d i f f e r e n t i a l equations corresponding t o those given i n equation
(2 .1) f o r n=2.
t he expected proportion of contamination present a t t i m e x i n the i
ment. The following boundary conditions are sa t i s f i ed :
Therefore we have
For t h i s pa r t i cu la r example l e t E[Y.(x)], i=1,2,3, represent 1
t h . compart-
E[Y3(x)l = 1 and E[Y2(x)] = ELYl(x)] = 0 a t x = 0.

- 12b -
TABLE 1 --Data to be fitted by generalized Spearman estimation procedure
-5
-4
-3
-2
-1
0
1
2
3
4
1 4 - 1 2
1
-
2
4
8
16
32
64
128
-1.38630
-0.69315
0
0.69315
1.38630
2.07945
2.77260
3.46575
4.15890
4.85205
1 00000
0.92696
0.87213
0.75029
0.60339
0.37711
0.18042
0.05943
0.02628
0.00000
0.00000
0.01463
0.02986
0.04675
0.10608
0.16495
0.19098
0.14191
0.09154
0 00000

- 13 - Corresponding to equation (2.2) we have the following system of equations:
'AIX - X2X -A3x E[Y3(x)1 = a31e + a32e + ,
for all x.
we take to be the first two.
l-E[Y (x) 1, then the equation for E[Ti(x) 1 becomes
Hence there are only two independent equations in (5.1), which
If we let a1 = -all,x = exp(z), and E[Y;(X)I =
1
which is of the same form a s equation (3.1).
then the equation for E[Y2(x)l is given by
In addition, if we let d2 = Q ~ ~ ,
which is of the sane form as equation (3.2).
By using the techniques presented in Section 3, we arrive at the
system of equations corresponding to ( 3 . 4 ) and (3.5) given by

K12 ' KllAl - A2 = -
- 14 -
The estimates of p"), p:2) , pi1 ) , and ~ 1 ' ~ ) f o r t h i s par t icu lar example are 1 2
h
n(l)= -1.59148; A(2)= p1 -4.28851; phl)= -0.54531; and b:2)= -2.65332. given by p 2
t Subs t i tu t ing these values i n t o the expressions f o r the K ' s and K I s , the system
of equations given i n (5.4) becomes
- 2.16870L1- L2 = 4.81403,
- 0.54531L1 = 3.26345, (5.5)
where L and L a r e the estimates of 5 and A respectively. Solving ( 5 . 5 ) ,
1.70- f i n d L1 = -6.02125 and L2 = 8.24425.
an1
1 2 2'
I n order t o obtain the estimates of
and JnA we ca lcu la te the roots of the following quadratic equation: 1 2
(5.6) 2 w I- 6 . 0 2 1 2 5 ~ -1- 8.24425 = 0.
The roots of (5.6) a r e given by w = -3.91595 and w2 = -2.10530. We take n A
1 h
so our estimates of X and A a r e X = 0.01990 and X2 = 0.12181, \ = exP(wk), 1 2 1
respect ively.
The next s t e p i n our estimation procedure i s t o estimate the l i n e a r
parameters, a
Table 1 were generated by adding random normal deviates t o calculated expected
and a2, i n equations (5.2) and (5.3). The observations i n 1
.. i
- 15 -
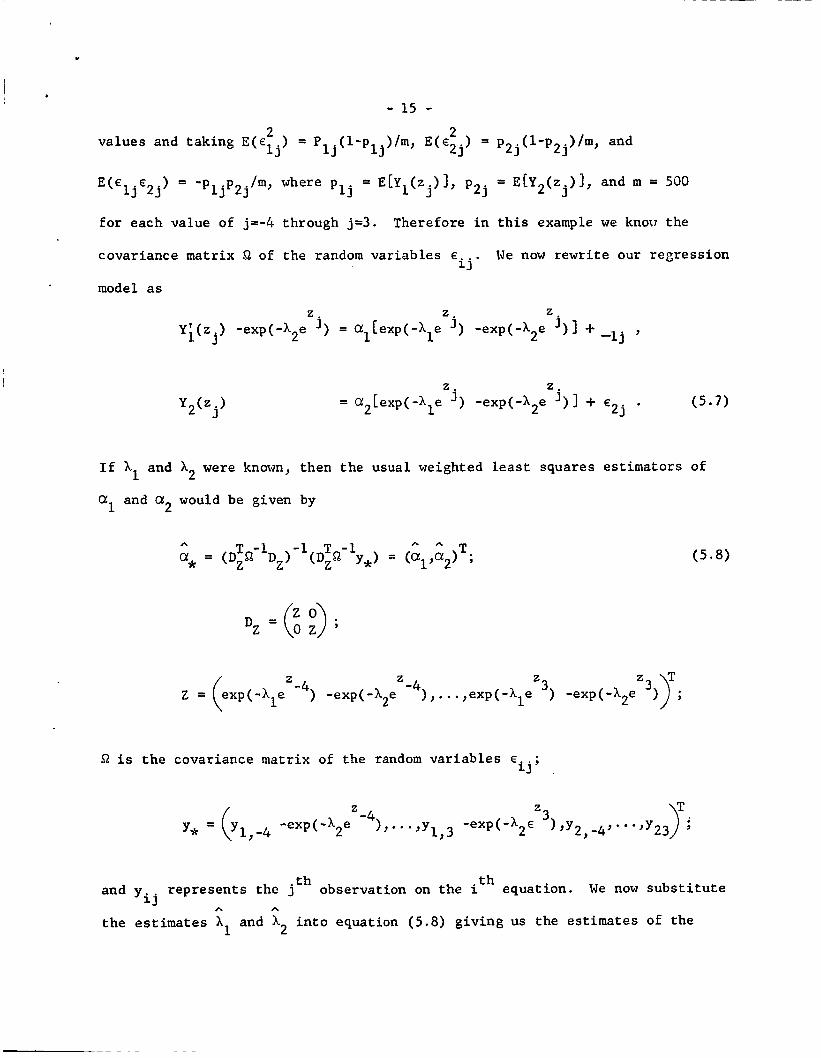
for each value of j=-4
covariance matrix Q of
= E[Y ( z . ) ] , and m = 500 where p = E[Y1(zj)1, p2j 2 3 1j
through j = 3 . Therefore in this example we know the
the random variables E . We now rewrite our regression ij model as
If
a! and (31 would be given by
and X2 were known, then the usual weighted least squares estimators of
1 2
Q is the covariance matrix of the random variables E * ij’
th and y represents the jth observation on the i equation. We now substitute
the estimates X ij
h h
and A2 into equation (5.8) giving us the estimates of the 1

- 16 - * A
psrameters 0: and CU2, denoted by a = 0.05501 and = 0.30899, respect ively.
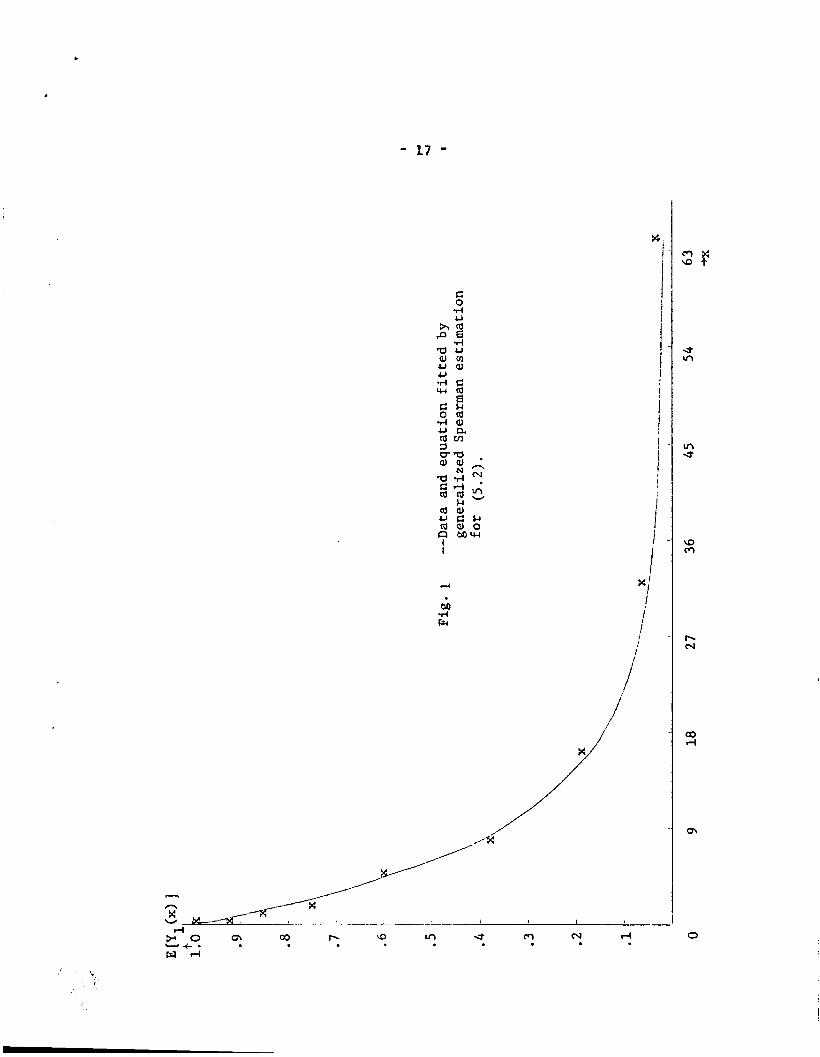
Graphs showing the or ig ina l data (x) with the f i t t e d regression equations of
our model a r e given i n Figures 1 and 2.
1 1
.
- 17 -
C 0
I
d
M d Irr
/ /
si
i

- 18 -
h m rn v &I 0 w N 4
l-
m a
(v
I 1
i xi !,
.!
I
I I
1 .i
I / 1
t I !X I
, i I
0

. .
- 19 -
REFERENCES
Beauchamp, J. J . c19661. Simultaneous Nonlinear Estimation. Ph.D. Dissertation. Florida State University.
Beauchamp, J. J. and Cornell, R. G. [1966]. Simultaneous nonlinear estimation. Technometrics 6, 319-326.
Berman, M. and Schoenfeld, R. c19561. Invariants in experimental data on linear kinetics and the formulation of models. J. of Applied Physics - 27, 1361-1370.
Box, G. E. P. and Draper, N. R. 119651. The Bayesian estimation of common parameters from several responses. Biometrika 52, 355-364.
Cornell, R. G. E19621.
Cradr, H. [1946]. Mathematical Methods of Statistics. Princeton University
A method for fitting linear combinations of exponentials. Biometrics - 18, 104-113.
Press, Princeton.
Johnson, E. A. and Brown, B. \I., Jr. [1961]. The Spearman estimator for serial dilution assays. Biometrics 17, 79-88.
Sheppard, C. W. [1962]. Basic Principles of the Tracer Method. John Wiley and Sons, Incorporated, New York.
Telser, L. G. [1964]. Iterative estimation of a set of linear regression equaticms. J . of the Amer. Statist. Assoc. - 59, 845-862.
Turner, M. E., Monroe, R. J. and Homer, L. D. [1963]. Generalized kinetic regression analysis: hypergeometric kinetics. Biometrics l.9, 406-428.
Zellner, A. [19621. An efficient method of estimating seemingly unrelated regressionsand tests for aggregation bias. J. of the Amer. Statist. - ASSOC. 57, 348-368.