spatio-temporal wavelet regularization for parallel mri reconstruction: application to functional...
TRANSCRIPT

RESEARCH ARTICLE
Spatio-temporal wavelet regularization for parallel MRIreconstruction: application to functional MRI
Lotfi Chaari • Philippe Ciuciu • Sebastien Meriaux •
Jean-Christophe Pesquet
Received: 12 July 2013 / Revised: 9 February 2014 / Accepted: 11 February 2014
� ESMRMB 2014
Abstract
Background Parallel magnetic resonance imaging (MRI)
is a fast imaging technique that helps acquiring highly
resolved images in space/time. Its performance depends on
the reconstruction algorithm, which can proceed either in
the k-space or in the image domain.
Objective and methods To improve the performance of
the widely used SENSE algorithm, 2D regularization in the
wavelet domain has been investigated. In this paper, we
first extend this approach to 3D-wavelet representations
and the 3D sparsity-promoting regularization term, in order
to address reconstruction artifacts that propagate across
adjacent slices. The resulting optimality criterion is convex
but nonsmooth, and we resort to the parallel proximal
algorithm to minimize it. Second, to account for temporal
correlation between successive scans in functional MRI
(fMRI), we extend our first contribution to 3D ? t
acquisition schemes by incorporating a prior along the time
axis into the objective function.
Results Our first method (3D-UWR-SENSE) is validated
on T1-MRI anatomical data for gray/white matter seg-
mentation. The second method (4D-UWR-SENSE) is val-
idated for detecting evoked activity during a fast event-
related functional MRI protocol.
Conclusion We show that our algorithm outperforms the
SENSE reconstruction at the subject and group levels (15
subjects) for different contrasts of interest (motor or com-
putation tasks) and two parallel acceleration factors (R ¼ 2
and R ¼ 4) on 2� 2� 3 mm3 echo planar imaging (EPI)
images.
Keywords Parallel MRI � fMRI � Wavelet transform �Spatio-temporal regularization � Convex optimization
Introduction
Reducing scanning time in magnetic resonance imag-
ing (MRI) exams remains a challenging worldwide issue,
since it has to be achieved while maintaining high image
quality [2, 3]. The expected benefits are: (1) to limit
patient’s exposure to the MRI environment, either for
safety or discomfort reasons; (2) to improve acquisition
robustness against subject’s motion artifacts; and (3) to
limit geometric distortions. One basic idea to make MRI
acquisitions faster (or to improve spatial resolution in a
fixed scanning time) consists of reducing the amount of
acquired samples in the k-space (spatial Fourier domain)
and developing dedicated reconstruction pipelines. To
achieve this goal, three main research avenues have been
developed so far:
Part of this work has been presented at the IEEE ISBI 2011
conference [1].
L. Chaari (&)
IRIT-INP-ENSEEIHT, University of Toulouse,
Toulouse, France
e-mail: [email protected]
P. Ciuciu � S. Meriaux
CEA/NeuroSpin, Gif-sur-Yvette, France
e-mail: [email protected]
S. Meriaux
e-mail: [email protected]
P. Ciuciu
INRIA Saclay, Parietal, Saclay, France
J.-C. Pesquet
LIGM, University Paris-Est, Marne-la-Vallee, France
e-mail: [email protected]
123
Magn Reson Mater Phy
DOI 10.1007/s10334-014-0436-5

• Parallel imaging or parallel MRI (pMRI) that relies on
a geometrical principle involving multiple receiver
coils with complementary sensitivity profiles. This
enables k-space undersampling along the phase encod-
ing direction without degrading spatial resolution or
truncating the Field-Of-View (FOV). pMRI requires
the unfolding of reduced FOV coil-specific images to
reconstruct the full FOV image [4–6].
• Compressed sensing (CS) MRI that exploits three
ingredients: sparsity of MR images in wavelet bases;
the incoherence between Fourier and inverse wavelet
bases, which allows to randomly undersample k-space;
and the nonlinear recovery of MR images by solving a
convex but nonsmooth ‘1 minimization problem [7–11].
This approach remains usable with classical receiver
coil, but can also be combined with pMRI [12, 13].
• In the dynamic MRI context, fast parallel acquisition
schemes have been proposed to increase the acquisition
rate by reducing the amount of acquired k-space samples
in each frame using interleaved partial k-space sampling
between successive frames (UNFOLD approach [14]).
To further reduce the scanning time, some strategies
taking advantage of both the spatial (actually in the
k-space) and temporal correlations between successive
scans in the data set have been pushed forward such as
kt-BLAST [15] or kt-SPARSE [16].
In pMRI, many reconstruction methods, such as
Simultaneous Acquisition of Spatial Harmonics
(SMASH) [4], Generalized Autocalibrating Partially Par-
allel Acquisitions (GRAPPA) [6] and SENSE (Sensitivity
Encoding) [5], have been proposed in the literature to
reconstruct a full FOV image from multiple k-space un-
dersampled images acquired on separate channels. Their
main difference lies in the space on which they operate.
GRAPPA performs multichannel full FOV reconstruction
in the k-space domain, whereas SENSE carries out the
unfolding process in the image domain: all undersampled
images are first reconstructed by inverse Fourier transform
before combining them to unwrap the full FOV image.
Also, GRAPPA is autocalibrated, whereas SENSE needs a
separate coil sensitivity estimation step based on a refer-
ence scan. Note, however, that autocalibrated versions of
SENSE are now available, such as the mSENSE algo-
rithm [17] on Siemens scanners.
In the dynamic MRI context, combined strategies mixing
parallel imaging and accelerated sampling schemes along
the temporal axis have also been investigated. The corre-
sponding reconstruction algorithms have been referred to as
kt-SENSE [15, 18] and kt-GRAPPA [19]. Compared to
mSENSE where the centre of the k-space is acquired only
once at the beginning, these methods have to acquire the
central k-space area at each frame, which decreases the
acceleration factor. More recently, optimized versions of
kt-BLAST and kt-SENSE reconstruction algorithms, refer-
red to as kt-FOCUSS [20, 21], have been designed to com-
bine the CS theory in space with Fourier or alternative
transforms along the time axis. They enable further reduction
of data acquisition time without significantly compromising
image quality if the image sequence exhibits a high degree of
spatio-temporal correlation, either by nature or by design.
Typical examples that enter in this context are: (1) dynamic
MRI capturing an organ (liver, kidney, heart) during a quasi-
periodic motion due to the respiratory cycle and cardiac beat;
and (2) functional MRI based on periodic blocked design.
However, this interleaved partial k-space sampling cannot be
exploited in aperiodic dynamic acquisition schemes, like in
resting state fMRI (rs-fMRI) or during fast-event related
fMRI paradigms [22, 23]. In rs-fMRI, spontaneous brain
activity is recorded without any experimental design in order
to probe intrinsic functional connectivity [22, 24, 25]. In fast
event-related designs, the presence of jittering combined
with random delivery of stimuli introduces a trial-varying
delay between the stimulus and acquisition time points [26].
This prevents the use of an interleaved k-space sampling
strategy between successive scans, since there is no guar-
antee that the BOLD response is quasi-periodic. Because the
vast majority of fMRI studies in neurosciences make use
either of rs-fMRI or fast event-related designs [26, 27], the
most reliable acquisition strategy in such contexts
remains the ‘‘scan and repeat’’ approach, although it is
suboptimal. To our knowledge, only one kt-contribu-
tion (kt-GRAPPA [19]) has claimed its ability to accurately
reconstruct fMRI images in aperiodic paradigms.
Overview of our contribution
The present paper therefore aims at proposing new three-
dimensional (3D)/(3D ? t)-dimensional pMRI reconstruc-
tion algorithms that can be adopted irrespective of the
nature of the encoding scheme or the fMRI paradigm. In
the fMRI literature, few studies have been conducted to
measure the impact of the parallel imaging reconstruction
algorithm on subsequent statistical sensitivity for detecting
evoked brain activity [3, 28–31]. Most often, statistical
analysis is performed at the subject-level on a small group
of individuals. Here, we perform the comparison of several
parallel MRI reconstruction algorithms at the subject and
group levels for different acceleration factors. To remove
reconstruction artifacts that occur at high acceleration
factors, regularized SENSE methods have been proposed in
the literature [32, 33, 34, 35, 36] relying for instance on
wavelet transforms such as UWR-SENSE [37]. More
recently, UWR-SENSE has been assessed on EPI images
and compared with mSENSE on a brain activation fMRI
Magn Reson Mater Phy
123

dataset [38] at the subject-level. Besides, except for some
non-regularized contributions like 3D GRAPPA [39], most
of the available reconstruction methods in the literature
operate slice by slice, and thus reconstruct each slice
irrespective of its neighbours. Iterating over slices is thus
necessary to recover the whole 3D volume. This observa-
tion led us to consider 3D or full FOV image reconstruction
as a single step in which all slices are treated together. For
doing so, we introduce 3D wavelet transform (WT) and a
3D sparsity-promoting regularization term in the wavelet
domain. This approach can still apply even if the acquisi-
tion is performed in 2D instead of 3D. Following the same
principle, an fMRI run usually consists of several tens (or
hundreds) of successive scans that are reconstructed inde-
pendently one to another. Iterating over all acquired 3D
volumes remains the classical approach to reconstruct the
4D or 3D ? t data set. However, it has been shown for a
long while that fMRI data are serially correlated in time,
even under the null hypothesis (i.e., ongoing activity
only) [40–42]. To capture this dependence between suc-
cessive time points, an autoregressive model has demon-
strated its relevance [43–46]. Hence, we propose to
account for this temporal structure at the reconstruction
step. These two key ideas have played a central role to
extend the UWR-SENSE approach [37] through a more
general regularization scheme that relies on a convex but
nonsmooth criterion to be minimized. This optimization is
performed using the Parallel ProXimal Algorithm (PPXA)
[47].
The rest of this paper is organized as follows. The
‘‘Materials and methods’’ section recalls the principle of
pMRI and describes the proposed reconstruction algo-
rithms and optimization aspects. In the ‘‘Results’’ section,
experimental validation of the 3D/4D-UWR-SENSE
approaches is performed on anatomical T1 MRI and BOLD
fMRI data, respectively. In the ‘‘Discussion’’ section, we
discuss the pros and cons of our method. Finally, conclu-
sions and perspectives are drawn in the ‘‘Conclusion’’
section.
Materials and methods
Parallel imaging in MRI
In pMRI, an array of L coils is employed to indirectly
measure the spin density q 2 RX�Y [48] within the object
under investigation.1 For Cartesian 2D acquisition
schemes, the sampling period along the phase encoding
direction is R times larger than the one used for
conventional acquisition, R� L being the reduction factor.
To recover full FOV images, many algorithms have been
proposed, but only SENSE-like [5] and GRAPPA-like [6]
methods are provided by scanner manufacturers. For more
details about the pMRI formalism, interested readers can
refer to [5, 6, 37, 48]. In what follows, we focus on
SENSE-like methods operating in the image domain.
Under coil-dependent additive zero-mean Gaussian
noise assumptions, and denoting by r ¼ ðx; yÞT 2 X � Y
the spatial position in the image domain (�T being the
transpose operator), SENSE amounts to solving the fol-
lowing one-dimensional inversion problem at each spatial
position: r ¼ ðx; yÞT [5, 37]:
dðrÞ ¼ SðrÞqðrÞ þ nðrÞ; ð1Þ
where nðrÞ ðL� 1Þ is the noise term, d ðL� 1Þ the acquired
signal and q ðR� 1Þ the target image. The sensitivity
matrix S ðL� RÞ is estimated using a reference scan and
varies according to the coil geometry. Note that the coil
images as well as the sought image q are complex-valued,
although jqj is only considered for visualization purposes.
The 1D-SENSE reconstruction method [5] actually
minimizes a Weighted Least Squares (WLS) criterion
JWLS given by:
JWLSðqÞ ¼X
r2f1;...;Xg�f1;...;Y=Rgk dðrÞ � SðrÞqðrÞ k2
W�1 ;
ð2Þ
where W is the noise covariance matrix and
k � kW�1 ¼ffiffiffiffiffiffiffiffiffiffiffiffiffiffiffiffiffiffiffiffiffiffið�ÞHW�1ð�Þ
q. Hence, the SENSE full FOV
image is nothing but the maximum likelihood estimate,
which admits the following closed-form expression at each
spatial position r:
bqWLSðrÞ ¼ SHðrÞW�1SðrÞ� �]
SHðrÞW�1dðrÞ; ð3Þ
where ð�ÞH [respectively ð�Þ]] stands for the transposed
complex conjugate (respectively pseudo-inverse). It should
be noticed here that the described 1D-SENSE reconstruc-
tion method has been designed to reconstruct one slice (2D
image). To reconstruct a full volume, the 1D-SENSE
reconstruction algorithm has to be iterated over all slices.
In practice, the performance of the SENSE method is
limited because of (1) different sources of noise such as
distortions in the measurements dðrÞ, and (2) distortions in
estimation and ill-conditioning of SðrÞ mainly at brain/air
interfaces. To enhance the robustness of the solution to this
ill-posed problem, a regularization is usually introduced in
the reconstruction process. To go beyond the over-
smoothing effects of quadratic regularization [32, 33],
edge-preserving penalties have been widely investigated in
the pMRI reconstruction literature. For instance, the Total
1 The overbar is used to distinguish the ‘‘true’’ data from a generic
variable.
Magn Reson Mater Phy
123

Variation (TV) regularization has been proposed in recent
works [49, 50]. However, TV is mostly adapted to piece-
wise constant images, which don’t reflect the prior
knowledge in fMRI. As investigated by Chaari et al. [37],
Liu et al. [36] and Guerquin-Kern et al. [51], regularization
in the WT domain is a powerful tool to improve SENSE
reconstruction. In what follows, we summarize the princi-
ples of wavelet-based regularization.
Proposed wavelet-based regularized SENSE
Akin to [37] where a regularized reconstruction algorithm
relying on 2D separable WTs was investigated, to the best
of our knowledge, all the existing approaches in the pMRI
regularization literature proceed slice by slice. The draw-
back of this strategy is that no spatial continuity between
adjacent slices is taken into account. Similarly in fMRI, the
whole brain volume is acquired repeatedly during an fMRI
run. Hence, it becomes necessary to iterate over all vol-
umes to reconstruct 4D data sets. Consequently, the 3D
volumes are supposed independent in time, whereas it is
known that fMRI time-series are serially correlated [43]
because of two distinct effects: the BOLD signal itself is a
low-pass filtered version of the neural activity, and physi-
ological artifacts make the fMRI time series strongly
dependent. For these reasons, modelling temporal depen-
dence across scans at the reconstruction step may impact
subsequent statistical analysis. This has motivated the
extension of the wavelet regularized reconstruction
approach in [37] in order to:
• Account for 3D spatial dependencies between adjacent
slices by using 3D WTs,
• Exploit the temporal dependency between acquired 3D
volumes by applying an additional regularization term
along the temporal dimension of the 4D data set.
This additional regularization will help us in increasing
the signal-to-noise ratio (SNR) through the acquired vol-
umes, and therefore enhance the reliability of the statistical
analysis in fMRI. These temporal dependencies have also
been used in the dynamic MRI literature in order to
improve the reconstruction quality in conventional
MRI [52]. However, since the imaged object geometry in
the latter context generally changes during the acquisition,
taking the temporal regularization in the reconstruction
process into account becomes very difficult. An optimal
design of 3D reconstruction should integrate slice-timing
and motion correction in the reconstruction pipeline. For
the sake of computational efficiency, our approach only
performs 3D reconstruction before considering slice-timing
and motion correction. To deal with a 4D reconstruction of
the Nr acquired volumes, we will first rewrite the obser-
vation model in Eq. (1) as follows:
dtðrÞ ¼ SðrÞqtðrÞ þ ntðrÞ; ð4Þ
where t 2 f1; . . .;Nrg is the frame index and r ¼ ðx; y; zÞ is
the 3D spatial position, z 2 f1; . . .; Zg being the slice
index. At a given frame t, the full FOV 3D complex-valued
image qt of size X � Y � Z can be seen as an element of
the Euclidean space CK with K ¼ X � Y � Z endowed
with the standard inner product � j �h i and norm k � k. We
employ a dyadic 3D orthonormal wavelet decomposition
operator T over jmax resolution levels (typically 3 as used in
our results). To perform 3D wavelet decomposition using a
given filter (Symmlet for instance), the same filter is applied
across lines (X), columns (Y) and slices (Z). The coefficient
field resulting from the wavelet decomposition of a target
image qt is defined as ft ¼�ft
a; ðfto;jÞo2O;1� j� jmax
�with o 2
O ¼ f0; 1g3 n fð0; 0; 0Þg; fta ¼ ðf
ta;kÞ1� k�Kjmax
and fto;j ¼
ðfto;j;kÞ1� k�Kj
where Kj ¼ K2�3j is the number of wavelet
coefficients in a given subband at resolution j (by assuming
that X, Y and Z are multiple of 2jmax ). Note that if the image
size is not a power of 2, and as usually performed in the
wavelet literature, zero-padding can be used for the
example to reach a power of 2 matrix size.
Adopting such a notation, the wavelet coefficients have
been reindexed so that fta denotes the approximation
coefficient vector at the resolution level jmax, while fto;j
denotes the detail coefficient vector at the orientation o and
resolution level j. Using 3D dyadic WTs allows us to
smooth reconstruction artifacts along the slice selection
direction that may appear at the same spatial position,
which is not possible using a slice by slice processing.
Also, even if reconstruction artifacts do not exactly appear
in the same positions, the proposed method allows us to
incorporate reliable information from adjacent slices in the
reconstruction model.
The proposed regularization procedure relies on the
introduction of two penalty terms. The first penalty term
describes the prior 3D spatial knowledge about the
wavelet coefficients of the target solution and it is
expressed as:
gðfÞ ¼XNr
t¼1
XKjmax
k¼1
Ua fta;k
� �þX
o2O
Xjmax
j¼1
XKj
k¼1
Uo;j fto;j;k
� �" #; ð5Þ
where f¼ ðf1;f2; . . .;fNrÞ and we have, for every o2O and
j 2 f1; . . .; jmaxg (and similarly for Ua relative to the
approximation coefficients),
8n 2 C; Uo;jðnÞ ¼ UReo;jðnÞ þ UIm
o;jðnÞ ð6Þ
where UReo;jðnÞ ¼ aRe
o;jjReðn� lo;jÞj þbRe
o;j
2jReðn� lo;jÞj
2and
UImo;jðnÞ ¼ aIm
o;jjImðn� lo;jÞj þbIm
o;j
2jImðn� lo;jÞj2 with lo;j ¼
lReo;j þ ılIm
o;j 2 C, and aReo;j; bRe
o;j; aImo;j; bIm
o;j are some positive
Magn Reson Mater Phy
123

real constants. Hereabove, Reð�Þ and Imð�Þ (or �Re and �Im)
stand for the real and imaginary parts, respectively. For
both real and imaginary parts, this regularization term
allows us to keep a compromise between sparsity and
smoothness of the wavelet coefficients due to the ‘1 and ‘2
terms, respectively. This ‘1 � ‘2 regularization is therefore
more flexible and can model a larger panel of images than a
simple ‘1 regularization. The usefulness of this kind of
penalization has been demonstrated in [37].
The second regularization term penalizes the temporal
variation between successive 3D volumes:
hðfÞ ¼ jXNr
t¼2
kT�ft � T�ft�1kpp ð7Þ
where T� is the 3D wavelet reconstruction operator. The
prior parameters ao;j ¼ ðaReo;j; a
Imo;jÞ; bo;j ¼ ðbRe
o;j; bImo;jÞ; lo;j ¼
ðlReo;j; l
Imo;jÞ; j 2 ½0;þ1½ and p 2 ½1;þ1½ are unknown, and
they need to be estimated. The used ‘p norm gives more
flexibility to the temporal penalization term by allowing it
to promote different levels of sparsity depending on the
value of p. Such a penalization has been chosen based on
empirical studies that have been conducted on the time-
course of the BOLD signal at the voxel level. This
parameter has been finally fixed to p ¼ 1.
Based on the formulation hereabove, the criterion to be
minimized in order to get the 4D-UWR-SENSE solution
can be written as follows:
J STðfÞ ¼ J TWLSðfÞ þ gðfÞ þ hðfÞ ð8Þ
where J TWLS is defined as
J TWLSðfÞ ¼XNr
t¼1
JWLSðftÞ
¼XNr
t¼1
X
r2f1;...;Xg�f1;...;Y=Rg�f1;...;ZgkdtðrÞ
� SðrÞðT�ftÞðrÞk2W�1 :
ð9Þ
If only the 3D spatial regularization is considered, the 3D-
UWR-SENSE solution is obtained by minimizing the
following criterion for every acquisition frame t ¼ 1. . .Nr:
J SðftÞ ¼ JWLSðftÞ þ gsðftÞ; ð10Þ
where JWLS is defined in Eq. (2) and gs is defined as
gsðftÞ ¼XKjmax
k¼1
Ua fta;k
� �þX
o2O
Xjmax
j¼1
XKj
k¼1
Uo;j fto;j;k
� �: ð11Þ
The operator T� is then applied to each component ft of
f to obtain the reconstructed 3D volume qt related to
acquisition frame t. It should be noticed here that other
choices for the penalty functions are also possible, pro-
vided that the convexity of the resulting optimality
criterion is ensured. This condition enables the use of fast
and efficient convex optimization algorithms. Adopting
this formulation, the minimization procedure plays a
prominent role in the reconstruction process. The proposed
optimization procedure is detailed in the ‘‘Optimization
procedure for the 4D reconstruction’’ section.
Results
This section is dedicated to the experimental validation of
the reconstruction algorithm we proposed in the ‘‘Proposed
wavelet-based regularized SENSE’’ section. Experiments
have been conducted on both anatomical and functional
data, which were acquired on a 3T Siemens Trio magnet.
For fMRI acquisition, ethics approval was delivered by the
local research ethics committee (Kremlin–Bicetre, CPP: 08
032), and 15 volunteers gave their written informed con-
sent for participation.
For anatomical data, the proposed 3D-UWR-SENSE
algorithm (4D-UWR-SENSE without temporal regulariza-
tion) is compared to the scanner reconstruction pipeline. As
regards fMRI validation, results of subject and group-level
fMRI statistical analyses are compared for two recon-
struction pipelines: the one available on the scanner
workstation and our own pipeline, which for the sake of
completeness, involves either the early UWR-SENSE [37]
or the 4D-UWR-SENSE version of the proposed pMRI
reconstruction algorithm.
Anatomical data
Anatomical data has been acquired using a 3D T1-weighted
MP-RAGE pulse sequence at a 1� 1� 1:1 mm3 spatial
resolution (TE ¼ 2:98 ms; TR ¼ 2;300 ms; TI ¼ 900 ms,
flip angle ¼ 9�, slice thickness = 1.1 mm, transversal
orientation, FOV ¼ 256� 240� 176 mm3, TR between
two RF pulses: 7:1 ms, antero-posterior phase encoding).
Data has been collected using a 32-channel receiver
coil (no parallel transmission) at two different acceleration
factors, R ¼ 2 and R ¼ 4.
To compare the proposed approach to the mSENSE2 one,
Fig. 1 illustrates coronal anatomical slices reconstructed
with both algorithms while turning off the temporal regu-
larization in 4D-UWR-SENSE. Red circles clearly show
reconstruction artifacts and noise in the mSENSE recon-
struction, which have been removed using our 3D-UWR-
SENSE approach. Comparison may also be made through
reconstructed slices for R ¼ 2 and R ¼ 4, as well as with
the conventional acquisition (R ¼ 1). This figure shows
2 SENSE reconstruction implemented by the Siemens scanner,
software ICE, VB 17.
Magn Reson Mater Phy
123

that increasing R generates more noise and artifacts in
mSENSE results, whereas the impact on our results is
attenuated. Artifacts are smoothed by using the continuity
of spatial information across contiguous slices in the
wavelet space. Depending on the used wavelet basis and
the number of vanishing moments, more or less (four or
eight, for instance) adjacent slices are involved in the
reconstruction of a given slice. Here we used Symmlet
filters of length 8 (four vanishing moments), which makes
eight adjacent slices involved in the reconstruction of a
given slice.
The smoothing level inherent to the proposed method
strongly depends on the regularization parameters that are
used to set the thresholding level of wavelet coefficients.
Images reconstructed using our algorithm present a higher
smoothing level than mSENSE, without altering key infor-
mation in the images (such as contrast and contours). When
carefully analyzing the reconstructed images, and although
the effect of the wavelet transform is spatially dependent,
one can notice that this effect appears as a motion-like
artifacts in the background that do not alter the brain mask.
Such artifacts are nothing but boundary effects due to the
use of WTs. Note also that mSENSE images present a
higher contrast level, which is due to the contrast homoge-
nization step applied by the scanner manufacturer. Quanti-
tatively speaking, this image normalization can cause noise
amplification in image areas where the g-factors are high
(i.e. at low SNR), which may induce some performance loss
in any quantitative image analysis, like gray/white matter
segmentation or sulcus recognition, based on such images.
Our pipeline does not involve any contrast homogenization
in order to preserve data integrity.
In order to evaluate the impact of such smoothing, classi-
fication tests have been conducted based on images recon-
structed with both methods. Gray and white matter
classification results using the Morphologist 2012 pipeline of
T1-MRI toolbox of Brainvisa software3 at R ¼ 2 and R ¼ 4
are compared to those obtained without acceleration (i.e. at
R ¼ 1), considered as the ground truth. Displayed results in
Fig. 2 show that classification errors occur close to
Fig. 1 Coronal reconstructed slices using mSENSE (top row) and
3D-UWR-SENSE (bottom row) for R ¼ 2 and R ¼ 4 with 1� 1�1:1 mm3 spatial resolution. Reconstructed slices are also provided for
a conventional acquisition (non accelerated with R ¼ 1) as the Sum
Of Squares (SOS). Red ellipsoids indicate the position of reconstruc-
tion artifacts using mSENSE
3 http://brainvisa.info.
Magn Reson Mater Phy
123
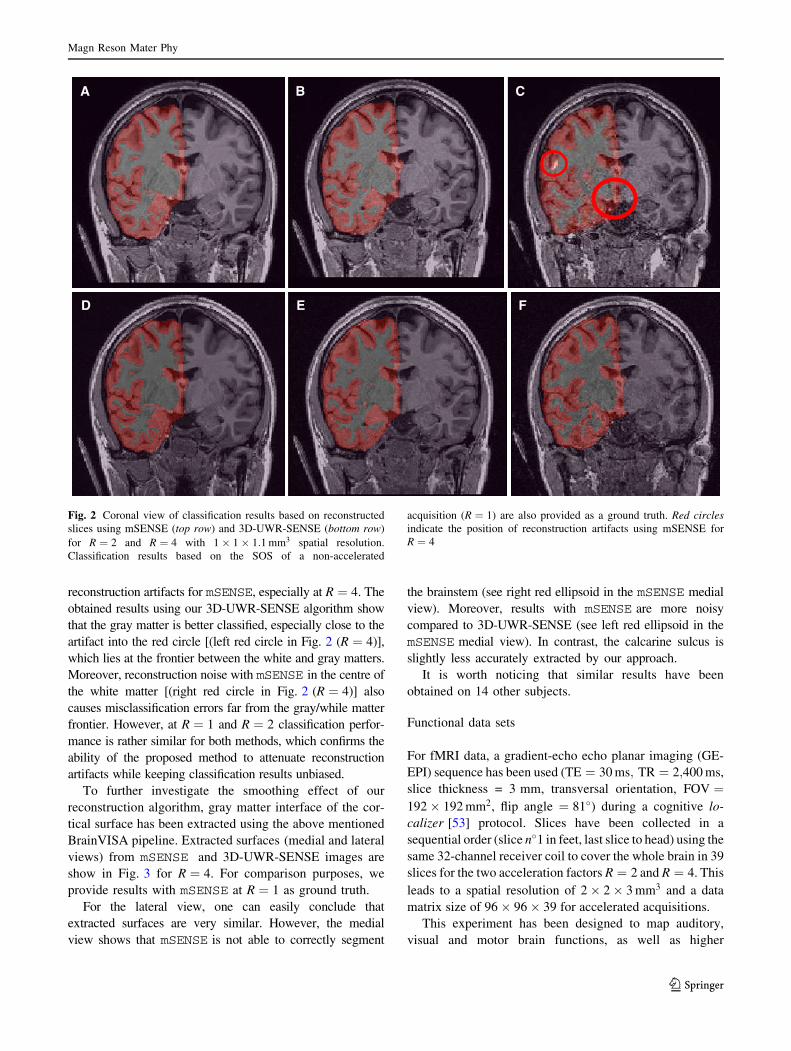
reconstruction artifacts for mSENSE, especially at R ¼ 4. The
obtained results using our 3D-UWR-SENSE algorithm show
that the gray matter is better classified, especially close to the
artifact into the red circle [(left red circle in Fig. 2 (R ¼ 4)],
which lies at the frontier between the white and gray matters.
Moreover, reconstruction noise with mSENSE in the centre of
the white matter [(right red circle in Fig. 2 (R ¼ 4)] also
causes misclassification errors far from the gray/while matter
frontier. However, at R ¼ 1 and R ¼ 2 classification perfor-
mance is rather similar for both methods, which confirms the
ability of the proposed method to attenuate reconstruction
artifacts while keeping classification results unbiased.
To further investigate the smoothing effect of our
reconstruction algorithm, gray matter interface of the cor-
tical surface has been extracted using the above mentioned
BrainVISA pipeline. Extracted surfaces (medial and lateral
views) from mSENSE and 3D-UWR-SENSE images are
show in Fig. 3 for R ¼ 4. For comparison purposes, we
provide results with mSENSE at R ¼ 1 as ground truth.
For the lateral view, one can easily conclude that
extracted surfaces are very similar. However, the medial
view shows that mSENSE is not able to correctly segment
the brainstem (see right red ellipsoid in the mSENSE medial
view). Moreover, results with mSENSE are more noisy
compared to 3D-UWR-SENSE (see left red ellipsoid in the
mSENSE medial view). In contrast, the calcarine sulcus is
slightly less accurately extracted by our approach.
It is worth noticing that similar results have been
obtained on 14 other subjects.
Functional data sets
For fMRI data, a gradient-echo echo planar imaging (GE-
EPI) sequence has been used (TE ¼ 30 ms; TR ¼ 2;400 ms,
slice thickness = 3 mm, transversal orientation, FOV ¼192� 192 mm2, flip angle ¼ 81�) during a cognitive lo-
calizer [53] protocol. Slices have been collected in a
sequential order (slice n�1 in feet, last slice to head) using the
same 32-channel receiver coil to cover the whole brain in 39
slices for the two acceleration factors R ¼ 2 and R ¼ 4. This
leads to a spatial resolution of 2� 2� 3 mm3 and a data
matrix size of 96� 96� 39 for accelerated acquisitions.
This experiment has been designed to map auditory,
visual and motor brain functions, as well as higher
A B C
D E F
Fig. 2 Coronal view of classification results based on reconstructed
slices using mSENSE (top row) and 3D-UWR-SENSE (bottom row)
for R ¼ 2 and R ¼ 4 with 1� 1� 1:1 mm3 spatial resolution.
Classification results based on the SOS of a non-accelerated
acquisition (R ¼ 1) are also provided as a ground truth. Red circles
indicate the position of reconstruction artifacts using mSENSE for
R ¼ 4
Magn Reson Mater Phy
123

cognitive tasks such as number processing and language
comprehension (listening and reading). It consisted of a
single session of Nr ¼ 128 scans. The paradigm was a fast
event-related design (ISI = 3.753 s) comprising 60 audi-
tory, visual and motor stimuli, defined in ten experimental
conditions (auditory and visual sentences, auditory and
visual calculations, left/right auditory and visual clicks,
horizontal and vertical checkerboards). Since data at R ¼1; R ¼ 2 and R ¼ 4 were acquired for each subject,
acquisition orders have been equally balanced between
these three reduction factors over the 15 subjects.
FMRI reconstruction pipeline
For each subject, fMRI data were collected at the 2�2 mm2 spatial in-plane resolution using different reduction
factors (R ¼ 2 or R ¼ 4). Based on the raw data files
delivered by the scanner, reduced FOV EPI images were
reconstructed as detailed in Fig. 4. This reconstruction is
performed in two stages:
1. the 1D k-space regridding (blip gradients along phase
encoding direction applied in-between readout
gradients) to account for the non-uniform k-space
sampling during readout gradient ramp, which occurs
in fast MRI sequences like GE-EPI;
2. the Nyquist ghosting correction to remove the odd-
even echo inconsistencies during k-space acquisition
of EPI images.
Here, it must be emphasized that since no interleaved
k-space sampling is performed during the acquisition, and
since the central lines of the k-space are not acquired for
each TR due to the available imaging sequences on the
Siemens scanner, kt-FOCUSS-like methods are not appli-
cable on the available data set.
Once the reduced FOV images are available, the proposed
pMRI 4D-UWR-SENSE algorithm and its early UWR-
SENSE version have been utilized in a final step to recon-
struct the full FOV EPI images, and compared to the
mSENSE solution. For the wavelet-based regularization,
dyadic Symmlet orthonormal wavelet bases [54] associated
with filters of length 8 have been used over jmax ¼ 3 resolu-
tion levels. The reconstructed EPI images then enter into our
fMRI study, in order to measure the impact of the recon-
struction method choice on brain activity detection. Note also
that the proposed reconstruction algorithm requires the
Fig. 3 Gray matter surface extraction based on reconstructed slices using mSENSE (b, e) and 3D-UWR-SENSE (c, f) for R ¼ 4. Results
obtained with R ¼ 1 (a, d) are also provided as a ground truth
Fig. 4 Reconstruction pipeline of reduced FOV EPI images from the raw FID data
Magn Reson Mater Phy
123
estimation of the coil sensitivity maps [matrix Sð�Þ in
Eq. (1)]. As proposed in [5], the latter were estimated by
dividing the coil-specific images by the module of the Sum Of
Squares (SOS) images, which are computed from the specific
acquisition of the k-space centre (24 lines) before the Nr
scans. The same sensitivity map estimation is then used for all
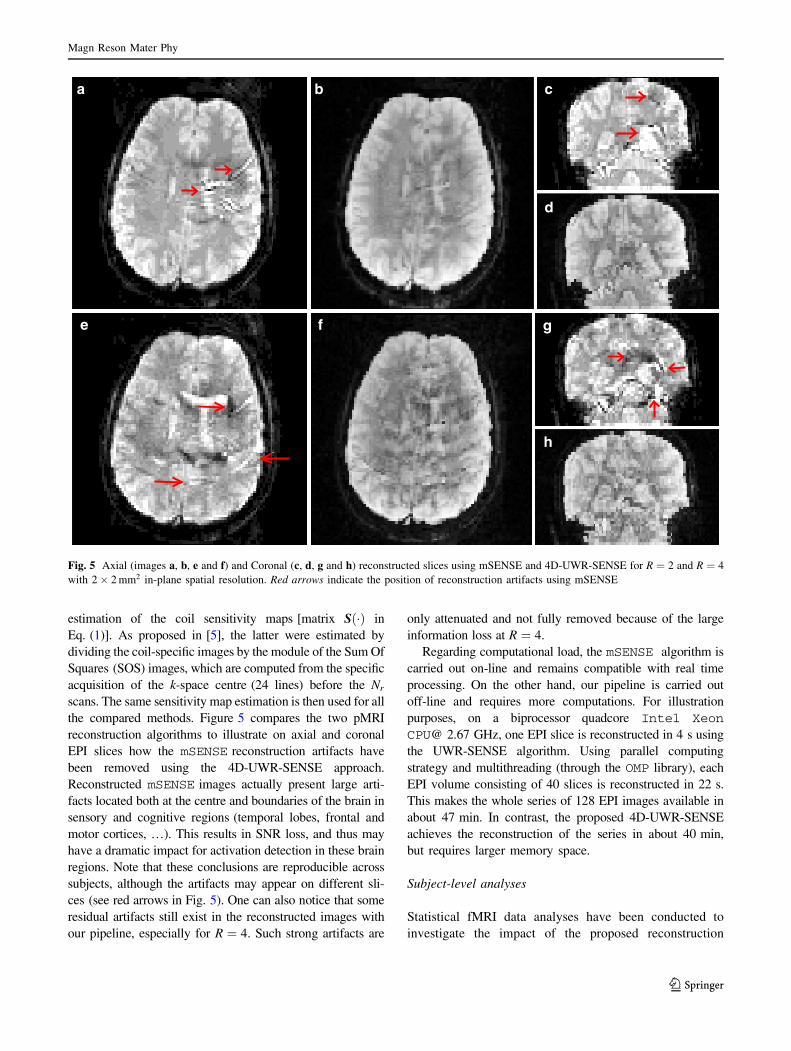
the compared methods. Figure 5 compares the two pMRI
reconstruction algorithms to illustrate on axial and coronal
EPI slices how the mSENSE reconstruction artifacts have
been removed using the 4D-UWR-SENSE approach.
Reconstructed mSENSE images actually present large arti-
facts located both at the centre and boundaries of the brain in
sensory and cognitive regions (temporal lobes, frontal and
motor cortices, …). This results in SNR loss, and thus may
have a dramatic impact for activation detection in these brain
regions. Note that these conclusions are reproducible across
subjects, although the artifacts may appear on different sli-
ces (see red arrows in Fig. 5). One can also notice that some
residual artifacts still exist in the reconstructed images with
our pipeline, especially for R ¼ 4. Such strong artifacts are
only attenuated and not fully removed because of the large
information loss at R ¼ 4.
Regarding computational load, the mSENSE algorithm is
carried out on-line and remains compatible with real time
processing. On the other hand, our pipeline is carried out
off-line and requires more computations. For illustration
purposes, on a biprocessor quadcore Intel Xeon
CPU@ 2.67 GHz, one EPI slice is reconstructed in 4 s using
the UWR-SENSE algorithm. Using parallel computing
strategy and multithreading (through the OMP library), each
EPI volume consisting of 40 slices is reconstructed in 22 s.
This makes the whole series of 128 EPI images available in
about 47 min. In contrast, the proposed 4D-UWR-SENSE
achieves the reconstruction of the series in about 40 min,
but requires larger memory space.
Subject-level analyses
Statistical fMRI data analyses have been conducted to
investigate the impact of the proposed reconstruction
a b c
e f
h
g
d
Fig. 5 Axial (images a, b, e and f) and Coronal (c, d, g and h) reconstructed slices using mSENSE and 4D-UWR-SENSE for R ¼ 2 and R ¼ 4
with 2� 2 mm2 in-plane spatial resolution. Red arrows indicate the position of reconstruction artifacts using mSENSE
Magn Reson Mater Phy
123
method on the sensitivity/specificity compromise of brain
activity detection. Before handling the statistical analysis
using the SPM software,4 full FOV fMRI images were
preprocessed using the following steps: (1) realignment, (2)
slice-timing correction, (3) anatomo-functional coregistra-
tion, (4) spatial normalization (for group-level analysis),
and (5) smoothing with an isotropic Gaussian kernel of
4 mm full-width at half-maximum. Spatial normalization
was performed on anatomical images to the MNI (Montreal
Neurological Institute) space and then applied to the co-
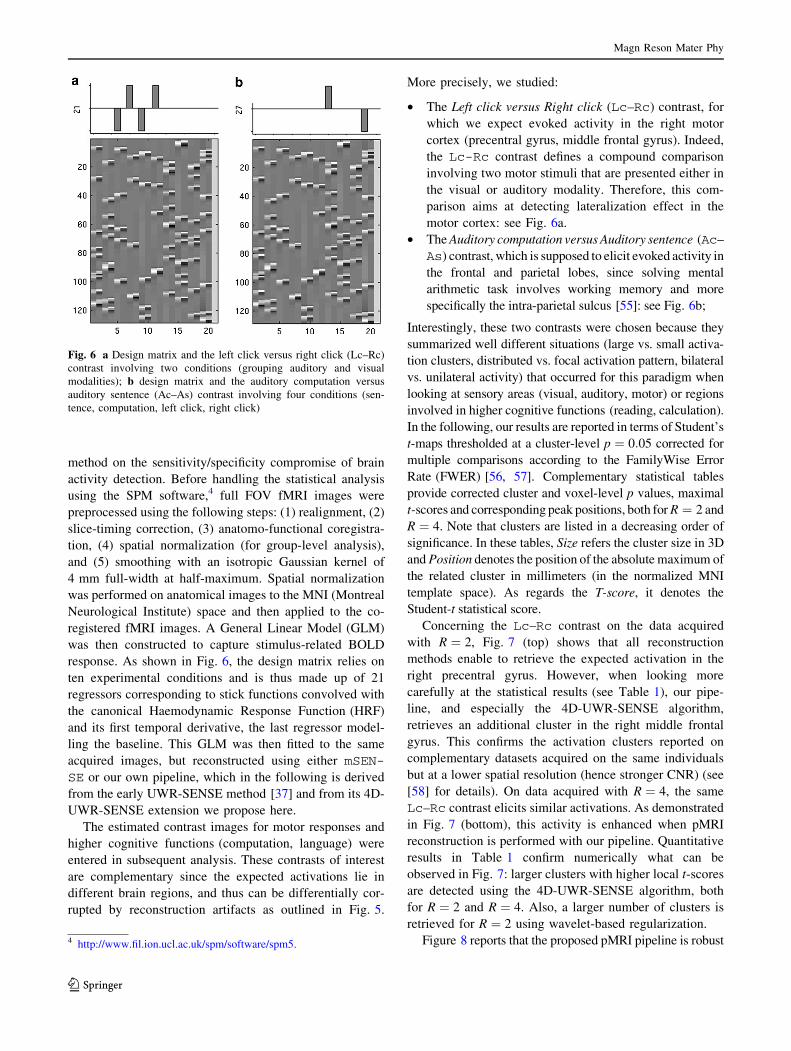
registered fMRI images. A General Linear Model (GLM)
was then constructed to capture stimulus-related BOLD
response. As shown in Fig. 6, the design matrix relies on
ten experimental conditions and is thus made up of 21
regressors corresponding to stick functions convolved with
the canonical Haemodynamic Response Function (HRF)
and its first temporal derivative, the last regressor model-
ling the baseline. This GLM was then fitted to the same
acquired images, but reconstructed using either mSEN-
SE or our own pipeline, which in the following is derived
from the early UWR-SENSE method [37] and from its 4D-
UWR-SENSE extension we propose here.
The estimated contrast images for motor responses and
higher cognitive functions (computation, language) were
entered in subsequent analysis. These contrasts of interest
are complementary since the expected activations lie in
different brain regions, and thus can be differentially cor-
rupted by reconstruction artifacts as outlined in Fig. 5.
More precisely, we studied:
• The Left click versus Right click (Lc–Rc) contrast, for
which we expect evoked activity in the right motor
cortex (precentral gyrus, middle frontal gyrus). Indeed,
the Lc-Rc contrast defines a compound comparison
involving two motor stimuli that are presented either in
the visual or auditory modality. Therefore, this com-
parison aims at detecting lateralization effect in the
motor cortex: see Fig. 6a.
• The Auditory computation versus Auditory sentence (Ac–
As) contrast, which is supposed to elicit evoked activity in
the frontal and parietal lobes, since solving mental
arithmetic task involves working memory and more
specifically the intra-parietal sulcus [55]: see Fig. 6b;
Interestingly, these two contrasts were chosen because they
summarized well different situations (large vs. small activa-
tion clusters, distributed vs. focal activation pattern, bilateral
vs. unilateral activity) that occurred for this paradigm when
looking at sensory areas (visual, auditory, motor) or regions
involved in higher cognitive functions (reading, calculation).
In the following, our results are reported in terms of Student’s
t-maps thresholded at a cluster-level p ¼ 0:05 corrected for
multiple comparisons according to the FamilyWise Error
Rate (FWER) [56, 57]. Complementary statistical tables
provide corrected cluster and voxel-level p values, maximal
t-scores and corresponding peak positions, both for R ¼ 2 and
R ¼ 4. Note that clusters are listed in a decreasing order of
significance. In these tables, Size refers the cluster size in 3D
and Position denotes the position of the absolute maximum of
the related cluster in millimeters (in the normalized MNI
template space). As regards the T-score, it denotes the
Student-t statistical score.
Concerning the Lc–Rc contrast on the data acquired
with R ¼ 2, Fig. 7 (top) shows that all reconstruction
methods enable to retrieve the expected activation in the
right precentral gyrus. However, when looking more
carefully at the statistical results (see Table 1), our pipe-
line, and especially the 4D-UWR-SENSE algorithm,
retrieves an additional cluster in the right middle frontal
gyrus. This confirms the activation clusters reported on
complementary datasets acquired on the same individuals
but at a lower spatial resolution (hence stronger CNR) (see
[58] for details). On data acquired with R ¼ 4, the same
Lc–Rc contrast elicits similar activations. As demonstrated
in Fig. 7 (bottom), this activity is enhanced when pMRI
reconstruction is performed with our pipeline. Quantitative
results in Table 1 confirm numerically what can be
observed in Fig. 7: larger clusters with higher local t-scores
are detected using the 4D-UWR-SENSE algorithm, both
for R ¼ 2 and R ¼ 4. Also, a larger number of clusters is
retrieved for R ¼ 2 using wavelet-based regularization.
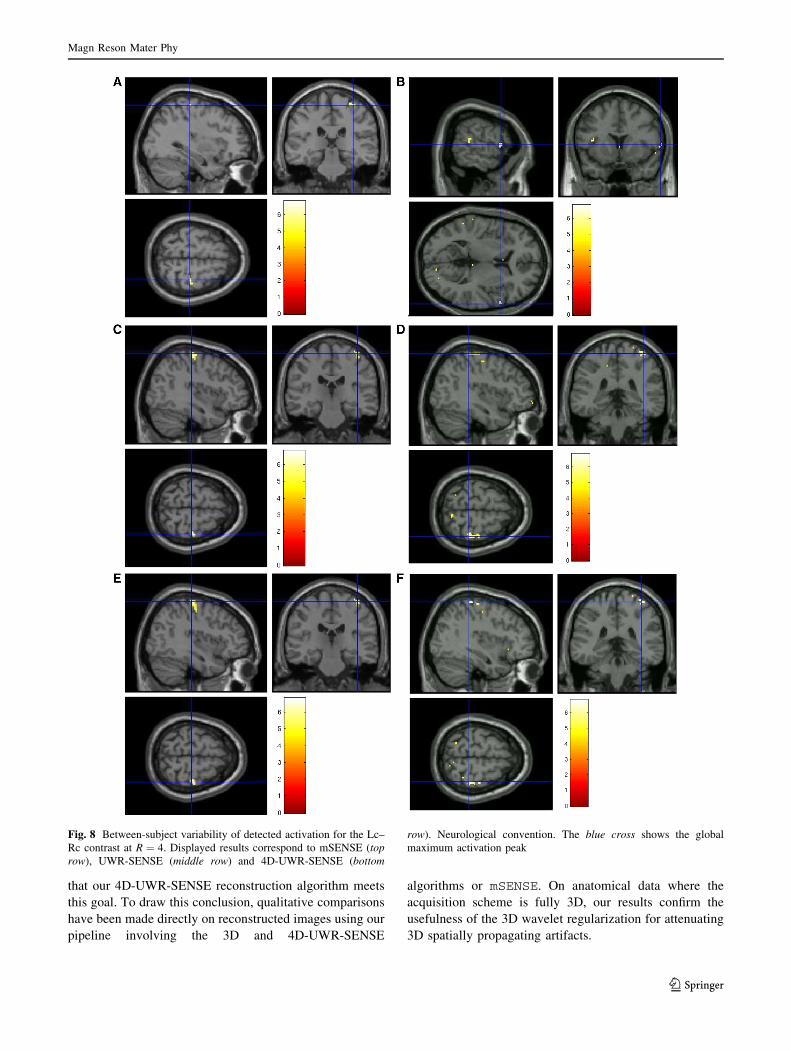
Figure 8 reports that the proposed pMRI pipeline is robust
Fig. 6 a Design matrix and the left click versus right click (Lc–Rc)
contrast involving two conditions (grouping auditory and visual
modalities); b design matrix and the auditory computation versus
auditory sentence (Ac–As) contrast involving four conditions (sen-
tence, computation, left click, right click)
4 http://www.fil.ion.ucl.ac.uk/spm/software/spm5.
Magn Reson Mater Phy
123

to the between-subject variability for this motor contrast.
Since sensory functions are expected to generate larger BOLD
effects (higher SNR) and appear more stable, our comparison
only takes place at R ¼ 4. The Student’s t-maps for two
individuals are compared in Fig. 8. For the second subject,
one can observe that themSENSE algorithm fails to detect any
Fig. 7 Student’s t-maps superimposed to anatomical MRI for the Lc–
Rc contrast. Data have been reconstructed using the mSENSE (top
row), UWR-SENSE (middle row) and 4D-UWR- SENSE (bottom
row), respectively. Neurological convention. The blue cross shows
the global maximum activation peak
Magn Reson Mater Phy
123

activation cluster in the right motor cortex. In contrast, our 4D-
UWR-SENSE method retrieves more coherent activity for
this second subject in the expected region.
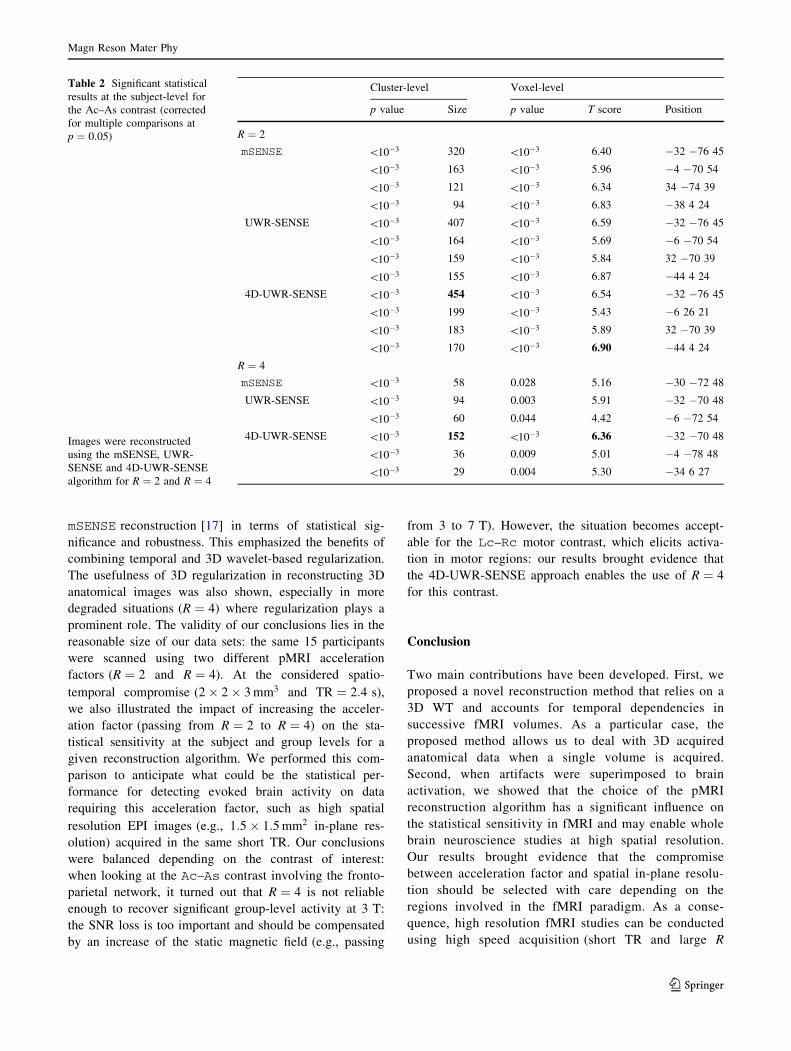
For the Ac–As contrast, Fig. 9 (top) shows, for the most
significant slice and R ¼ 2, that all pMRI reconstruction
algorithms succeed in finding evoked activity in the left
parietal and frontal cortices, more precisely in the inferior
parietal lobule and middle frontal gyrus according to the
AAL template.5 Table 2 also confirms a bilateral activity
pattern in parietal regions for R ¼ 2. Moreover, for R ¼ 4,
Fig. 9 (bottom) illustrates that our pipeline (UWR-SENSE
and 4D-UWR-SENSE) and especially the proposed 4D-
UWR-SENSE scheme enables to retrieve reliable frontal
activity elicited by mental calculation, which is lost by the
mSENSE algorithm. From a quantitative viewpoint, the
proposed 4D-UWR-SENSE algorithm finds larger clusters
whose local maxima are more significant than the ones
obtained using mSENSE and UWR-SENSE, as reported in
Table 2. Concerning the most significant cluster for R ¼ 2,
the peak positions remain stable whatever the reconstruc-
tion algorithm. However, examining their significance
level, one can realize the benefit of wavelet-based regu-
larization when comparing UWR-SENSE with mSEN-
SE results and then capture additional positive effects of
temporal regularization when looking at the 4D-UWR-
SENSE results. These benefits are also demonstrated for
R ¼ 4.
To summarize, our 4D-UWR-SENSE algorithm always
outperforms the alternative reconstruction methods used in
this paper in terms of statistical significance (number of
clusters, cluster extent, etc.), but also in terms of
robustness.
Group-level analyses
This section is devoted to illustrating the performance of the
proposed algorithm in promoting the sensitivity/specificity
compromise at the level of a whole population of subjects.
Indeed, due to between-subject anatomical and functional
variability, group-level analysis is necessary in order to derive
reproducible conclusions at the population level. For this val-
idation, random effect analyses (RFX) involving 15 healthy
subjects have been conducted on the contrast maps we previ-
ously investigated at the subject level. More precisely, one-
sample Student’s t test was performed on the individual con-
trast images (e.g., Lc–Rc, Ac–As, ...images) using SPM5. In
the following, we focus on the Lc–Rc contrast.
Maximum Intensity Projection (MIP) Student’s t-maps
are shown in Fig. 10 for R ¼ 2 and R ¼ 4.
It is shown that whatever the acceleration factor R in use,
our pipeline enables to detect more spatially extended area in
the motor cortex. This visual inspection is quantitatively con-
firmed in Table 3 when comparing the detected clusters using
4D-UWR-SENSE andmSENSE irrespective of R. Finally, the
4D-UWR-SENSE algorithm outperforms the UWR-SENSE
one, which corroborates the benefits of the proposed spatio-
temporal regularization. Similar conclusions can be drawn for
theAc–As contrast (see the technical report: http://lotfi-chaari.
net/downloads/Tech_report_fmri.pdf).
Discussion
Through illustrated results, we showed that whole brain
acquisition can be routinely used at a spatial in-plane res-
olution of 2� 2 mm2 in a short and constant repetition
time (TR ¼ 2:4 s), provided that a reliable pMRI recon-
struction pipeline is chosen. In this paper, we demonstrated
Table 1 Significant statistical
results at the subject-level for
the Lc–Rc contrast (corrected
for multiple comparisons at
p ¼ 0:05)
Images were reconstructed
using the mSENSE, UWR-
SENSE and 4D-UWR-SENSE
algorithms for R ¼ 2 and R ¼ 4
Cluster-level Voxel-level
p value Size p value T score Position
R ¼ 2
mSENSE \10�3 79 \10�3 6.49 38 �26 66
UWR-SENSE \10�3 144 0.004 5.82 40 �22 63
0:03 21 0.064 4.19 24 �8 63
4D-UWR-SENSE \10�3 189 0.001 7.03 34 �24 69
\10�3 53 0.001 4.98 50 �18 42
\10�3 47 0.001 5.14 32 �6 66
R ¼ 4
mSENSE 0.006 21 0.295 4.82 34 �28 63
UWR-SENSE \10�3 33 0.120 5.06 40 �24 66
4D-UWR-SENSE \10�3 51 0.006 5.57 40 �24 66
5 Available in the xjView toolbox of SPM5.
Magn Reson Mater Phy
123
that our 4D-UWR-SENSE reconstruction algorithm meets
this goal. To draw this conclusion, qualitative comparisons
have been made directly on reconstructed images using our
pipeline involving the 3D and 4D-UWR-SENSE
algorithms or mSENSE. On anatomical data where the
acquisition scheme is fully 3D, our results confirm the
usefulness of the 3D wavelet regularization for attenuating
3D spatially propagating artifacts.
Fig. 8 Between-subject variability of detected activation for the Lc–
Rc contrast at R ¼ 4. Displayed results correspond to mSENSE (top
row), UWR-SENSE (middle row) and 4D-UWR-SENSE (bottom
row). Neurological convention. The blue cross shows the global
maximum activation peak
Magn Reson Mater Phy
123

Quantitatively speaking, our comparison took place at
the statistical analysis level (subject and group levels)
using quantitative criteria (p values, t scores, peak
positions) at the subject and group levels. In particular,
we showed that our 4D-UWR-SENSE approach outper-
forms both its UWR-SENSE ancestor [37] and the
Fig. 9 Student’s t-maps superimposed to anatomical MRI for the
Ac-As contrast. Data have been reconstructed using the mSENSE (top
row), UWR-SENSE (middle row) and 4D-UWR-SENSE (bottom
row). Neurological convention: left is left. The blue cross shows the
global maximum activation peak
Magn Reson Mater Phy
123
mSENSE reconstruction [17] in terms of statistical sig-
nificance and robustness. This emphasized the benefits of
combining temporal and 3D wavelet-based regularization.
The usefulness of 3D regularization in reconstructing 3D
anatomical images was also shown, especially in more
degraded situations (R ¼ 4) where regularization plays a
prominent role. The validity of our conclusions lies in the
reasonable size of our data sets: the same 15 participants
were scanned using two different pMRI acceleration
factors (R ¼ 2 and R ¼ 4). At the considered spatio-
temporal compromise (2� 2� 3 mm3 and TR ¼ 2:4 s),
we also illustrated the impact of increasing the acceler-
ation factor (passing from R ¼ 2 to R ¼ 4) on the sta-
tistical sensitivity at the subject and group levels for a
given reconstruction algorithm. We performed this com-
parison to anticipate what could be the statistical per-
formance for detecting evoked brain activity on data
requiring this acceleration factor, such as high spatial
resolution EPI images (e.g., 1:5� 1:5 mm2 in-plane res-
olution) acquired in the same short TR. Our conclusions
were balanced depending on the contrast of interest:
when looking at the Ac–As contrast involving the fronto-
parietal network, it turned out that R ¼ 4 is not reliable
enough to recover significant group-level activity at 3 T:
the SNR loss is too important and should be compensated
by an increase of the static magnetic field (e.g., passing
from 3 to 7 T). However, the situation becomes accept-
able for the Lc–Rc motor contrast, which elicits activa-
tion in motor regions: our results brought evidence that
the 4D-UWR-SENSE approach enables the use of R ¼ 4
for this contrast.
Conclusion
Two main contributions have been developed. First, we
proposed a novel reconstruction method that relies on a
3D WT and accounts for temporal dependencies in
successive fMRI volumes. As a particular case, the
proposed method allows us to deal with 3D acquired
anatomical data when a single volume is acquired.
Second, when artifacts were superimposed to brain
activation, we showed that the choice of the pMRI
reconstruction algorithm has a significant influence on
the statistical sensitivity in fMRI and may enable whole
brain neuroscience studies at high spatial resolution.
Our results brought evidence that the compromise
between acceleration factor and spatial in-plane resolu-
tion should be selected with care depending on the
regions involved in the fMRI paradigm. As a conse-
quence, high resolution fMRI studies can be conducted
using high speed acquisition (short TR and large R
Table 2 Significant statistical
results at the subject-level for
the Ac–As contrast (corrected
for multiple comparisons at
p ¼ 0:05)
Images were reconstructed
using the mSENSE, UWR-
SENSE and 4D-UWR-SENSE
algorithm for R ¼ 2 and R ¼ 4
Cluster-level Voxel-level
p value Size p value T score Position
R ¼ 2
mSENSE \10�3 320 \10�3 6.40 �32 �76 45
\10�3 163 \10�3 5.96 �4 �70 54
\10�3 121 \10�3 6.34 34 �74 39
\10�3 94 \10�3 6.83 �38 4 24
UWR-SENSE \10�3 407 \10�3 6.59 �32 �76 45
\10�3 164 \10�3 5.69 �6 �70 54
\10�3 159 \10�3 5.84 32 �70 39
\10�3 155 \10�3 6.87 �44 4 24
4D-UWR-SENSE \10�3 454 \10�3 6.54 �32 �76 45
\10�3 199 \10�3 5.43 �6 26 21
\10�3 183 \10�3 5.89 32 �70 39
\10�3 170 \10�3 6.90 �44 4 24
R ¼ 4
mSENSE \10�3 58 0.028 5.16 �30 �72 48
UWR-SENSE \10�3 94 0.003 5.91 �32 �70 48
\10�3 60 0.044 4.42 �6 �72 54
4D-UWR-SENSE \10�3 152 \10�3 6.36 �32 �70 48
\10�3 36 0.009 5.01 �4 �78 48
\10�3 29 0.004 5.30 �34 6 27
Magn Reson Mater Phy
123

value), provided that the expected BOLD effect is
strong, as experienced in primary motor, visual and
auditory cortices.
A direct extension of the present work consists of
studying the impact of tight frames instead of wavelet
bases to define more suitable 3D transforms. However,
unsupervised reconstruction becomes more challeng-
ing in this framework since the estimation of
hyper-parameters becomes cumbersome (see [59] for
details). Integrating some pre-processing steps in the
Fig. 10 Group-level Students t-maps for the Lc–Rc contrast where data have been reconstructed using the mSENSE, UWR-SENSE and
4D-UWR-SENSE for R ¼ 2 and R ¼ 4. Neurological convention. Red arrows indicate the global maximum activation peak
Magn Reson Mater Phy
123

reconstruction model may also be of great interest to
account for motion artifacts in the regularization step,
especially for interleaved 2D acquisition schemes.
Such an extension deserves integration of recent
works on joint correction of motion and slice-timing
such as [60]. Another extension of our work would
concern the combination of our wavelet-regularized
reconstruction with the WSPM approach [61], in
which statistical analysis is directly performed in the
WT domain.
Acknowledgments This work has been partially supported by
ANR-11-LABX-0040-CIMI within the program ANR-11-IDEX-
0002-02. The work of Philippe Ciuciu was partially supported by the
CIMI (Centre International de Mathmatiques et d’Informatique)
Excellence program during the winter and spring of 2013.
Appendix
Optimization procedure for the 4D reconstruction
The minimization of J ST in Eq. (8) is performed by
resorting to the concept of proximity operators [62], which
was found to be fruitful in a number of recent works in
convex optimization [63–65]. In what follows, we recall
the definition of a proximity operator.
Definition 1 ([62]) Let C0ðvÞ be the class of proper
lower semicontinuous convex functions from a sepa-
rable real Hilbert space v to �� 1;þ1� and let
u 2 C0ðvÞ. For every x 2 v, the function uþ k ��xk2=2 achieves its infimum at a unique point
denoted by proxux. The operator proxu : v! v is
the proximity operator of u.
In this work, as the observed data are complex-valued,
the definition of proximity operators is extended to a class
of convex functions defined for complex-valued variables.
For the function
U : CK !��1;þ1� ; x 7!/Re ReðxÞð Þ þ /Im ImðxÞð Þ;ð12Þ
where /Re and /Im are functions in C0ðRKÞ and
ReðxÞ [respectively ImðxÞ] is the vector of the real
parts (respectively imaginary parts) of the components of
x 2 CK , the proximity operator is defined as
proxU : CK ! CK ; x 7!prox/ReðReðxÞÞ þ ıprox/Im ImðxÞð Þ:
ð13Þ
We now provide the expressions of proximity operators
involved in our reconstruction problem.
Proximity operator of the data fidelity term
According to standard rules on the calculation of proximity
operators [65, Table 1.1] while denoting qt ¼ T�ft, the
proximity operator of the data fidelity term JWLS is given
for every vector of coefficients ft (with t 2 f1; . . .;Nrg) by
proxJWLSðftÞ ¼ Tut, where the image ut is such that
8r 2 f1; . . .;Xg � f1; . . .;Y=Rg � f1; . . .;Zg,
utðrÞ¼�IRþ2SHðrÞW�1SðrÞ
��1�qtðrÞþ2SHðrÞW�1dtðrÞ
�:
ð14Þ
Proximity operator of the spatial regularization function
According to [37], for every resolution level j and orien-
tation o, the proximity operator of the spatial regularization
function Uo;j is given by
Table 3 Significant statistical
results at the group-level for the
Lc–Rc contrast (corrected for
multiple comparisons at
p ¼ 0:05)
Images were reconstructed
using the mSENSE, UWR-
SENSE and 4D-UWR-SENSE
algorithms for R ¼ 2 and R ¼ 4
Cluster-level Voxel-level
p value Size p value T score Position
R ¼ 2
mSENSE \10�3 354 \10�3 9.48 38 �22 54
0.001 44 0.665 6.09 �4 �68 �24
UWR-SENSE \10�3 350 0.005 9.83 36 �22 57
\10�3 35 0.286 7.02 4 �12 51
4D-UWR-SENSE \10�3 377 0.001 11.34 36 �22 57
\10�3 53 \10�3 7.50 8 �14 51
\10�3 47 \10�3 7.24 �18 �54 �18
R ¼ 4
mSENSE \10�3 38 0.990 5.97 32 �20 45
UWR-SENSE \10�3 163 0.128 7.51 46 �18 60
4D-UWR-SENSE \10�3 180 0.111 7.61 46 �18 60
Magn Reson Mater Phy
123
8n 2 C; proxUo;jn ¼
signðReðn� lo;jÞÞbRe
o;j þ 1
maxfjReðn� lo;jÞj � aReo;j; 0g þ ı
signðImðn� lo;jÞÞbIm
o;j þ 1
maxfjImðn� lo;jÞj � aImo;j; 0g þ lo;j ð15Þ
where the sign function is defined by signðnÞ ¼ 1 if n 0
and �1 otherwise.
Proximity operator of the temporal regularization
function
A simple expression of the proximity operator of function h
is not available. We thus propose to split this regularization
term as a sum of two more tractable functions h1 and h2:
h1ðfÞ ¼jXNr=2
t¼1
kT�f2t � T�f2t�1kpp
ð16Þ
h2ðfÞ ¼jXNr=2�1
t¼1
kT�f2tþ1 � T�f2tkpp: ð17Þ
Since h1 (respectively h2) is separable with respect to the
time variable t, its proximity operator can easily be
calculated based on the proximity operator of each of the
involved terms in the sum of Eq. (16) [respectively
Eq. (17)]. Indeed, let us consider the following function
W : CK � CK �! R ; ðft; ft�1Þ7!jkT�ft � T�ft�1kp
p
¼ w � H ft; ft�1� �
;
ð18Þ
where w ¼ jkT� � kpp and H is the linear operator defined as
H : CK � CK �! C
K ; ða; bÞ7!a� b: ð19Þ
Its associated adjoint operator H� is therefore given by
H� : CK �! CK � C
K ; a 7!ða;�aÞ: ð20Þ
Since HH� ¼ 2Id, the proximity operator of W can easily
be calculated using [66, Prop. 11]:
proxW ¼ proxw�H ¼ Idþ 1
2H� � ðprox2w � IdÞ � H: ð21Þ
The calculation of prox2w is discussed in [62].
Parallel proximal algorithm (PPXA)
The function to be minimized has been re-expressed as
J STðfÞ ¼XNr
t¼1
X
r2f1;...;Xg�f1;...;Y=Rg�f1;...;ZgkdtðrÞ
� SðrÞðT�ftÞðrÞk2W�1 þ gðfÞ þ h1ðfÞ þ h2ðfÞ:
ð22Þ
Since J ST is made up of more than two non-neces-
sarily differentiable terms, an appropriate solution for
minimizing such an optimality criterion is PPXA [47].
In particular, it is important to note that this algorithm
does not require subiterations, as was the case for the
constrained optimization algorithm proposed in [37]. In
addition, the computations in this algorithm can be
performed in a parallel manner and the convergence of
the algorithm to an optimal solution to the minimiza-
tion problem is guaranteed. The resulting algorithm for
the minimization of the optimality criterion in Eq. (22)
is given in Algorithm 1. In this algorithm, the weights
xi have been fixed to 1=4 for every i 2 f1; . . .; 4g. The
parameter c has been set to 200, since this value was
observed to lead to the fastest convergence in practice.
The stopping parameter e has been set to 10�4 and the
algorithm typically converges in less than 50
iterations.
Magn Reson Mater Phy
123

References
1. Chaari L, Meriaux S, Badillo S, Ciuciu P, Pesquet JC (2011a) 3D
wavelet-based regularization for parallel MRI reconstruction:
impact on subject and group-level statistical sensitivity in fMRI.
In: IEEE international symposium on biomedical imaging (ISBI).
Chicago, USA, pp 460–464
2. Kochunov P, Riviere D, Lancaster JL, Mangin JF, Cointepas Y,
Glahn D, Fox P, Rogers J (2005) Development of high-resolution
MRI imaging and image processing for live and post-mortem
primates. Human Brain Mapping (HBM). Canada, Toronto,
pp 1–3
3. Rabrait C, Ciuciu P, Ribes A, Poupon C, Leroux P, Lebon V,
Dehaene-Lambertz G, Bihan DL, Lethimonnier F (2008) High
temporal resolution functional MRI using parallel echo volume
imaging. Magn Reson Imaging 27:744–753
4. Sodickson DK, Manning WJ (1997) Simultaneous acquisition of
spatial harmonics (SMASH): fast imaging with radiofrequency
coil arrays. Magn Reson Med 38:591–603
5. Pruessmann KP, Weiger M, Scheidegger MB, Boesiger P (1999)
SENSE: sensitivity encoding for fast MRI. Magn Reson Med
42:952–962
6. Griswold MA, Jakob PM, Heidemann RM, Nittka M, Jellus V,
Wang J, Kiefer B, Haase A (2002) Generalized autocalibrating
partially parallel acquisitions GRAPPA. Magn Reson Med
47:1202–1210
7. Candes E, Romberg J, Tao T (2006) Robust uncertainty princi-
ples: exact signal reconstruction from highly incomplete fre-
quency information. IEEE Trans Inf Theory 52:489–509
8. Lustig M, Donoho D, Pauly JM (2007) Sparse MRI: the appli-
cation of compressed sensing for rapid MR imaging. Magn Reson
Med 58:1182–1195
9. Bilgin A, Trouard TP, Gmitro AF, Altbach MI (2008) Randomly
perturbed radial trajectories for compressed sensing MRI. In:
Meeting of the international society for magnetic resonance in
medicine. Toronto, Canada, p 3152
10. Yang A, Feng L, Xu J, Selesnick I, Sodickson D K, Otazo R (2012)
Improved compressed sensing reconstruction with overcomplete
wavelet transforms. In: Meeting of the international society for
magnetic resonance in medicine, Melbourne, Australia, p 3769
11. Holland DJ, Liu C, Song X, Mazerolle EL, Stevens MT, Seder-
man AJ, Gladden LF, D’Arcy RCN, Bowen CV, Beyea SD
(2013) Compressed sensing reconstruction improves sensitivity
of variable density spiral fMRI. Magn Reson Med 70:1634–1643
12. Liang D, Liu B, Wang J, Ying L (2009) Accelerating SENSE
using compressed sensing. Magn Reson Med 62:1574–84
13. Boyer C, Ciuciu P, Weiss P, Meriaux S (2012) HYR2PICS:
Hybrid regularized reconstruction for combined parallel imaging
and compressive sensing in MRI. In: 9th international symposium
on biomedical imaging (ISBI). Barcelona, Spain, pp 66–69
14. Madore B, Glover GH, Pelc NJ (1999) Unaliasing by Fourier-
encoding the overlaps using the temporal dimension (UNFOLD),
Magn Reson Mater Phy
123
applied to cardiac imaging and fMRI. Magn Reson Med
42:813–828
15. Tsao J, Boesiger P, Pruessmann KP (2003) k-t BLAST and k-t
SENSE: dynamic MRI with high frame rate exploiting spatio-
temporal correlations. Magn Reson Med 50:1031–1042
16. Lustig M, Santos JM, Donoho DL, Pauly JM (2001) k-t SPARSE:
high frame rate dynamic MRI exploiting spatio-temporal sparsity.
In: International society for magnetic resonance in medicine.
Washington, USA, p 2420
17. Wang J, Kluge T, Nittka M, Jellus V, Kuhn B, Kiefer B (2001)
Parallel acquisition techniques with modified SENSE recon-
struction mSENSE. In: 1st Wuzburg workshop on parallel
imaging basics and clinical applications. Wuzburg, Germany,
p 92
18. Tsao J, Kozerke S, Boesiger P, Pruessmann KP (2005) Opti-
mizing spatiotemporal sampling for k-t BLAST and k-t SENSE:
application to high-resolution real-time cardiac steady-state free
precession. Magn Reson Med 53:1372–1382
19. Huang F, Akao J, Vijayakumar S, Duensing GR, Limkeman M
(2005) k-t GRAPPA: a k-space implementation for dynamic MRI
with high reduction factor. Magn Reson Med 54:1172–1184
20. Jung H, Ye JC, Kim EY (2007) Improved k-t BLAST and k-t
SENSE using FOCUSS. Phys Med Biol 52:3201–3226
21. Jung H, Sung K, Nayak KS, Kim EY, Ye JC (2009) k-t FOCUSS:
a general compressed sensing framework for high resolution
dynamic MRI. Magn Reson Med 61:103–116
22. Damoiseaux JS, Rombouts SA, Barkhof F, Scheltens P, Stam CJ,
Smith SM, Beckmann CF (2006) Consistent resting-state net-
works across healthy subjects. Proc Natl Acad Sci USA
103:13848–1385
23. Dale AM (1999) Optimal experimental design for event-related
fMRI. Hum Brain Mapp 8:109–114
24. Varoquaux G, Sadaghiani S, Pinel P, Kleinschmidt A, Poline JB,
Thirion B (2010) A group model for stable multi-subject ICA on
fMRI datasets. Neuroimage 51:288–299
25. Ciuciu P, Varoquaux G, Abry P, Sadaghiani S, Kleinschmidt A
(2012) Scale-free and multifractal time dynamics of fMRI signals
during rest and task. Front Physiol 3:1–18
26. Birn R, Cox R, Bandettini PA (2002) Detection versus estimation
in event-related fMRI: choosing the optimal stimulus timing.
Neuroimage 15:252–264
27. Logothetis NK (2008) What we can do and what we cannot do
with fMRI. Nature 453:869–878
28. de Zwart J, Gelderen PV, Kellman P, Duyn JH (2002) Applica-
tion of sensitivity-encoded echo-planar imaging for blood oxygen
level-dependent functional brain imaging. Magn Reson Med
48:1011–1020
29. Preibisch C (2003) Functional MRI using sensitivity-encoded
echo planar imaging (SENSE-EPI). Neuroimage 19:412–421
30. de Zwart J, Gelderen PV, Golay X, Ikonomidou VN, Duyn JH
(2006) Accelerated parallel imaging for functional imaging of the
human brain. NMR Biomed 19:342–351
31. Utting JF, Kozerke S, Schnitker R, Niendorf T (2010) Compar-
ison of k-t SENSE/k-t BLAST with conventional SENSE applied
to BOLD fMRI. J Magn Reson Imaging 32:235–241
32. Liang ZP, Bammer R, Ji J, Pelc NJ, Glover GH (2002) Making
better SENSE: wavelet denoising, Tikhonov regularization, and
total least squares. In: International society for magnetic reso-
nance in medicine. Hawaı, USA, p 2388
33. Ying L, Xu D, Liang ZP (2004) On Tikhonov regularization for
image reconstruction in parallel MRI. In: IEEE engineering in
medicine and biology society. San Francisco, USA, pp 1056–1059
34. Zou YM, Ying L, Liu B (2008) SparseSENSE: application of
compressed sensing in parallel MRI. In: IEEE international
conference on technology and applications in biomedicine.
Shenzhen, China, pp 127–130
35. Chaari L, Pesquet JC, Benazza-Benyahia A, Ciuciu P (2008)
Autocalibrated parallel MRI reconstruction in the wavelet
domain. In: IEEE international symposium on biomedical
imaging (ISBI). Paris, France, pp 756–759
36. Liu B, Abdelsalam E, Sheng J, Ying L (2008a) Improved spiral
SENSE reconstruction using a multiscale wavelet model. In:
IEEE international symposium on biomedical imaging (ISBI).
Paris, France, pp 1505–1508
37. Chaari L, Pesquet JC, Benazza-Benyahia A, Ciuciu P (2011b) A
wavelet-based regularized reconstruction algorithm for SENSE
parallel MRI with applications to neuroimaging. Med Image Anal
15:185–2010
38. Chaari L, Meriaux S, Pesquet JC, Ciuciu P (2010a) Impact of the
parallel imaging reconstruction algorithm on brain activity
detection in fMRI. In: International symposium on applied sci-
ences in biomedical and communication technologies (ISABEL).
Italy, Rome, pp 1–5
39. Jakob P, Griswold M, Breuer F, Blaimer M, Seiberlich N (2006)
A 3D GRAPPA algorithm for volumetric parallel imaging. In:
Scientific meeting international society for magnetic resonance in
medicine, Seattle, USA, p 286
40. Aguirre GK, Zarahn E, D’Esposito M (1997) Empirical analysis
of BOLD fMRI statistics. II. Spatially smoothed data collected
under null-hypothesis and experimental conditions. Neuroimage
5:199–212
41. Zarahn E, Aguirre GK, D’Esposito M (1997) Empirical analysis
of BOLD fMRI statistics. I. Spatially unsmoothed data collected
under null-hypothesis conditions. Neuroimage 5:179–197
42. Purdon PL, Weisskoff RM (1998) Effect of temporal autocorre-
lation due to physiological noise and stimulus paradigm on voxel-
level false-positive rates in fMRI. Hum Brain Mapp 6:239–249
43. Woolrich M, Ripley B, Brady M, Smith S (2001) Temporal
autocorrelation in univariate linear modelling of fMRI data.
Neuroimage 14:1370–1386
44. Worsley KJ, Liao CH, Aston J, Petre V, Duncan GH, Morales F,
Evans AC (2002) A general statistical analysis for fMRI data.
Neuroimage 15:1–15
45. Penny WD, Kiebel S, Friston KJ (2003) Variational Bayesian
inference for fMRI time series. Neuroimage 19:727–741
46. Chaari L, Vincent T, Forbes F, Dojat M, Ciuciu P (2013) Fast
joint detection-estimation of evoked brain activity in event-rela-
ted fMRI using a variational approach. IEEE Trans Med Imaging
32:821–837
47. Combettes PL, Pesquet JC (2008) A proximal decomposition
method for solving convex variational inverse problems. Inverse
Probl 24:27
48. Sodickson DK (2000) Tailored SMASH image reconstructions
for robust in vivo parallel MR imaging. Magn Reson Med
44:243–251
49. Keeling SL (2003) Total variation based convex filters for
medical imaging. Appl Math Comput 139:101–1195
50. Liu B, King K, Steckner M, Xie J, Sheng J, Ying L (2008b)
Regularized sensitivity encoding (SENSE) reconstruction using
Bregman iterations. Magn Reson Med 61:145–152
51. Guerquin-Kern M, Haberlin M, Pruessmann KP, Unser M (2011)
A fast wavelet-based reconstruction method for magnetic reso-
nance imaging. IEEE Trans Med Imaging 30:1649–1660
52. Sumbul U, Santos JM, Pauly JM (2009) Improved time series
reconstruction for dynamic magnetic resonance imaging. IEEE
Trans Med Imaging 28:1093–1104
53. Pinel P, Thirion B, Meriaux S, Jobert A, Serres J, Le Bihan D,
Poline JB, Dehaene S (2007) Fast reproducible identification and
large-scale databasing of individual functional cognitive net-
works. BMC Neurosci 8:1–18
54. Daubechies I (1992) Ten lectures on wavelets. In: Society for
industrial and applied mathematics. Philadelphia
Magn Reson Mater Phy
123

55. Dehaene S (1999) Cerebral bases of number processing and
calculation. In: Gazzaniga M (ed) The new cognitive neurosci-
ences, chap 68. MIT Press, Cambridge, pp 987–998
56. Nichols TE, Hayasaka S (2003) Controlling the familywise error
rate in functional neuroimaging: a comparative review. Stat
Methods Med Res 12:419–446
57. Brett M, Penny W, Kiebel S (2004) Introduction to random field
theory. In: Frackowiak RSJ, Friston KJ, Fritch CD, Dolan RJ,
Price CJ, Penny WD (eds) Human brain function, 2nd edn.
Academic Press, New York, pp 867–880
58. Badillo S, Desmidt S, Ciuciu P (2010) A group level fMRI
comparative study between 12 and 32 channel coils at 3 Tesla. In:
16th annual meeting of the organization for human brain mapping
(HBM). Barcelona, Spain, p 937
59. Chaari L, Pesquet JC, Tourneret JY, Ciuciu P, Benazza-Benyahia
A (2010b) A hierarchical Bayesian model for frame representa-
tion. IEEE Trans Signal Process 5560–5571
60. Roche A (2011) A four-dimensional registration algorithm with
application to joint correction of motion and slice timing in fMRI.
IEEE Trans Med Imaging 30:1546–1554
61. Van De Ville D, Seghier M, Lazeyras F, Blu T, Unser M (2007)
WSPM: wavelet-based statistical parametric mapping. Neuroim-
age 37:1205–1217
62. Moreau JJ (1965) Proximite et dualite dans un espace hilbertien.
Bull de la Societe Math de Fr 93:273–299
63. Chaux C, Combettes P, Pesquet JC, Wajs VR (2007) A varia-
tional formulation for frame-based inverse problems. Inverse
Probl 23:1495–1518
64. Combettes PL, Wajs VR (2005) Signal recovery by proximal
forward–backward splitting. Multiscale Model Simul
4:1168–1200
65. Combettes PL, Pesquet JC (2010) Proximal splitting methods in
signal processing. In: Bauschke HH, Burachik R, Combettes PL,
Elser V, Luke DR, Wolkowicz H (eds) Fixed-point algorithms for
inverse problems in science and engineering, chap 1. Springer,
New York, pp 185–212
66. Combettes PL, Pesquet JC (2007) A Douglas-Rachford splitting
approach to nonsmooth convex variational signal recovery. IEEE
J Sel Top Signal Process 1:564–574
Magn Reson Mater Phy
123