spatio-temporal scales of hydrological...
TRANSCRIPT

100
200
300
400
500
500
400
300
200
100
Water & Development Publications - Helsinki University of Technology
TKK-WD-04
SPATIO-TEMPORAL SCALES OF HYDROLOGICAL IMPACT
ASSESSMENT IN LARGE RIVER BASINS: THE MEKONG CASE
Dissertation for the degree of Doctor of Science in Technology
Water & DevelopmentResearch Group
Matti Kummu
HELSINKI UNIVERSITY OF TECHNOLOGY


Spatio-temporal scales of hydrological impact assessment in large river basins: the Mekong case
Matti Kummu
Water & Development Publications - Helsinki University of Technology
Dissertation for the degree of Doctor of Science in Technology to be presented with due permission of the Faculty of Engineering and Architecture for public examination and debate in Auditorium R1 at Helsinki University of Technology (Espoo, Finland) on the 12th of December, 2008, at 12 o’clock noon.
Helsinki University of TechnologyFaculty of Engineering and ArchitectureDepartment of Civil and Environmental EngineeringWater Resources Research Unit

Helsinki University of Technology TKKWater Resources Research UnitP.O. Box 5200FIN-02015 TKKwww.water.tkk.fi/global
© Matti Kummu 2008All rights reserved.
ISBN 978-951-22-9665-1ISBN 978-951-22-9666-8 (PDF)ISSN 1797-254X
Layout and cover by Tiina MerikoskiPrinted by Yliopistopaino, Helsinki, Finland
This publication is available electronically atwww.water.tkk.fi/global/publications

i
ABSTRACT OF DOCTORAL DISSERTATION HELSINKI UNIVERSITY OF TECHNOLOGYP.O. BOX 1000, FI-02015 TKK
http://www.tkk.fi
Author Matti Kummu
Name of the dissertation Spatio-temporal scales of hydrological impact assessment in large river basins: the Mekong case
Manuscript submitted 4.8.2008 Manuscript revised 11.11.2008
Date of the defence 12.12.2008
Monograph Article dissertation (summary + original articles)
Faculty
Department Field of researchOpponent
Pre-examiners
Supervisor
Faculty of Engineering and Architecture
Department of Civil and Environmental Engineering
Water resources
Prof. Charles Vörösmarty
Prof. Anthony Jakeman and Prof. Jozsef Szilágyi
Prof. Olli Varis
Abstract: River alterations, being either natural or anthropogenic, have impacted the environment and riverine
communities, and nature, throughout human history. During the last two centuries, the scale of the anthropogenic
impacts has expanded significantly as a result of larger water resources related projects. Numerous human activities
have consequences for the environment measured along multiple scales and levels. The multiscale/-level nature of
the problems related to the impact assessment discipline requires that researchers address key issues of scales and
levels in their analyses.
The thesis aims to present the spatio-temporal scales of the hydrological impact assessment (HIA) process in a
large river basin context and analyse how the scales should be taken into account when conducting the assessment.
A special focus is on the data and methodologies used within the HIA. The levels of this work are hydrology,
hydrodynamics and sediment transport, forming the sub-disciplines of the HIA. The geographical focus is the
Mekong River Basin in Southeast Asia where HIA is presented at different scales through seven case studies, based
on the appended papers. The Mekong is facing rapid development activities and in this work their consequences on
the above-mentioned levels have been analysed and discussed at different scales.
Scales are particularly important when a) identifying the critical processes and areas of possible consequences,
b) selecting the spatio-temporal scales of the assessment, c) identifying the data needed and available, d) selecting
the methodologies and tools related to the process, and e) presenting the results of the assessment to the decision-
makers and planners. The thesis concludes that, instead of down-/up-scaling, a multiscale approach often appears to
be a more preferable solution. A more extensive inclusion of scale issues in the impact assessment process is believed
to contribute to building a more profound connection between researchers and decisions makers.
Keywords Hydrological impact assessment; hydrology; hydrodynamics; sediment transport; scale;
spatio-temporal scale; large river basin; and Mekong River
ISBN (printed) 978-951-22-9665-1
ISBN (pdf) 978-951-22-9666-8 ISSN 1797-254X
Language English Number of pages 92 + app. 112 p.
Publisher Water & Development Publications – Helsinki University of Technology
Print distribution TKK Water Resources Research Uniti
The dissertation can be read at http://lib.tkk.fi/Diss/
x
x

ii
VÄITÖSKIRJAN TIIVISTELMÄ TEKNILLINEN KORKEAKOULU PL 1000, 02015 TKK
http://www.tkk.fi
Tekijä Matti Kummu
Väitöskirjan nimiHydrologisten vaikutusten arvioinnin paikka ja aika -skaalat suurten jokien valuma-alueella:
tapaustutkimuksena Mekong
Käsikirjoituksen päivämäärä 4.8.2008 Korjatun käsikirjoituksen päivämäärä 11.11.2008
Väitöstilaisuuden ajankohta 12.12.2008
Monografia Yhdistelmäväitöskirja (yhteenveto + erillisartikkelit)
TiedekuntaLaitos TutkimusalaVastaväittäjä
Esitarkastajat Työn valvoja
Insinööritieteiden ja arkkitehtuurin tiedekunta
Yhdyskunta- ja ympäristötekniikan laitos
Vesitalous
Prof. Charles Vörösmarty
Prof. Anthony Jakeman and Prof. Jozsef Szilágyi
Prof. Olli Varis
Tiivistelmä: Luonnolliset ja ihmisen aikaansaamat muutokset jokien virtaamassa ovat vaikuttaneet yhteiskuntiin
ja ympäristöön kautta ihmisen historian. Viimeisten kahden vuosisadan aikana antropologiset vaikutukset ovat
kuitenkin kasvaneet voimakkaasti, koska vesirakennushankkeet ovat yhä suurempia kooltaan, ja niitä tehdään
entistä enemmän. Ihmisen toiminta vaikuttaa ympäristöön usealla eri tasolla ja useassa mittakaavassa. Tämä tulisi
ottaa huomioon vaikutusten arviointeja tehtäessä.
Väitöskirjan tavoitteena on esittää hydrologisten vaikutusten arvioinnin (HIA) paikka-aika –skaalat suurten jokien
yhteydessä ja analysoida, kuinka skaalat tulisi ottaa huomioon arviointia tehtäessä. Erityisesti työ keskittyy HIA:ssa
käytettävään dataan ja työkaluihin. Hydrologia, hydrodynamiikka ja sedimentin kulkeutuminen muodostavat työn
tasot ja samalla HIA:n osa-alueet. Työn maantieteellinen painopiste on Mekongin valuma-alue Kaakkois-Aasiassa.
HIA on esitetty alueella tapaustutkimusten avulla, jotka perustuvat väitöskirjan liitteinä oleviin artikkeleihin.
Mekongin alue kehittyy nopeasti, ja osana tätä tutkimusta on arvioitu alueella mahdollisesti tapahtuvia ihmisen
toiminnan vaikutuksia eri mittakaavoissa.
Skaalat ovat erityisen tärkeitä a) tunnistettaessa kriittisiä prosesseja ja vaikutuksille alttiita alueita, b)
valittaessa arvioinnissa käytettyjä skaaloja, c) tarvittavan ja olemassa olevan datan identifioinnissa, d) valittaessa
arvioinnissa käytettyjä työkaluja ja e) esitettäessä arvioinnin tuloksia päätöksentekijöille ja suunnittelijoille.
Moniskaalainen lähestymistapa vaikuttaa paremmalta lähestymistavalta skaalaukseen verrattuna. Skaalat ja
niiden kokonaisvaltaisempi sisällyttäminen vaikutusten arviointiin voisivat osaltaan parantaa kommunikointia
tutkijoiden ja päätöksentekijöiden välillä.
Asiasanat Hydrologisten vaikutusten arviointi, hydrologia, sedimentin kulkeutuminen;
hydrodynamiikka; skaala; paikka-aika -skaala; suurten jokien valuma-alueet; Mekong-joki
ISBN (painettu) 978-951-22-9665-1
ISBN (pdf) 978-951-22-9666-8 ISSN 1797-254X
Kieli Englanti Sivumäärä 92 + app. 112 p.
Julkaisija Water & Development Publications – Helsinki University of Technology
Painetun väitöskirja jakelu TKK Vesitalouden ja vesirakennuksen tutkimusryhmä
Luettavissa verkossa osoittessa http://lib.tkk.fi/Diss/
x
x

iii
This thesis is based on the following Papers:
I: Kummu, M., Varis, O. and Sarkkula, J. 2008. Impacts of land surface changes on regional hydrology - Mainland Southeast Asia. In: A common need for action: Global environmental change and development in monsoon Southeast Asia. Lebel, L., Snidvongs, A., Chen, C-T. A., and Daniel, R. (Eds.). Gerakbudaya: Kuala Lumpur, Malaysia. In press. 17 pp.
II: Kummu, M. and Varis, O. 2007. Sediment-related impacts due to upstream reservoir trapping, the Lower Mekong River. Geomorphology 85, (3-4): 275-293.
III: Kummu, M., Sarkkula, J., Koponen, J., and Nikula, J. 2006. Ecosystem management of Tonle Sap Lake: integrated modelling approach. International Journal of Water Resources Development 22, (3): 497–519.
IV: Kummu, M. and Sarkkula, J. 2008. Impact of the Mekong river flow alteration on the Tonle Sap flood pulse. Ambio 37, (3): 185-192.
V: Kummu, M., Penny, D., Sarkkula, J., and Koponen, J. 2008. Sediment - Curse or Blessing for Tonle Sap Lake? Ambio 37, (3): 158-163.
VI: Kummu, M. 2008. Water management in Angkor: human impacts on hydrology and sediment transportation. Journal of Environmental Management, Available online: doi:10.1016/j.jenvman.2008.08.007.
VII: Kummu, M., Lu, X.X., Rasphone, A., Sarkkula, J., and Koponen, J. 2008. Riverbank changes along the Mekong River: Remote sensing detection in the Vientiane-Nong Khai area. Quaternary International, 186, (1): 100-112.
Papers I–VII, reprinted with permission, are copyrighted as follows:
Paper I copyright © 2008 by Unit for Social and Environmental Research (USER), Chiang Mai University; Paper II copyright © 2007, Paper VI and Paper VII copyright © 2008 by Elsevier Science; Paper III copyright © 2006 by Taylor & Francis; Paper IV, and Paper V copyright © 2008 by Allen Press.
LIST OF APPENDED PAPERS

iv
I: The author is mainly responsible for writing the paper. Prof. Varis participated in writing the paper and provided comments during the analysis of the results and the writing stage. Dr. Sarkkula provided comments during the writing of the paper.
II: The author is responsible for the analysis, all the computations and mainly for writing the paper. Prof. Varis wrote portions of the paper and provided comments during the analysis of the results and the writing stage.
III: The author is responsible for writing portions of the paper, coordinating the writing process, and conducting a portion of the analyses and modelling. Dr. Sarkkula wrote a portion of the paper and participated in doing the analyses. Koponen is mainly responsible for the modelling component of the paper and assisted in writing the paper. Nikula is mainly responsible for writing the flood ecology portion of the paper and he also provided comments during the writing stage.
IV: The author is responsible for the GIS analysis, all computations and mainly for writing the paper. Dr. Sarkkula assisted in writing portions of the paper, and provided comments during the analysis of the results and the writing stage.
V: The author is partly responsible for writing the paper. He conducted all sediment analyses and portions of the modelling work. Dr. Penny wrote a portion of the paper, is responsible for the palaeontological analysis, and provided comments during the analysis of the results and the writing stage. Dr. Sarkkula assisted in writing portions of the paper, and provided comments during the analysis of the results and the writing stage. Koponen is mainly responsible for the modelling component of the paper.
VI: The author is responsible for writing the paper and doing all the analyses, calculations and modelling.
VII: The author wrote a portion of the paper and conducted a portion of the GIS analysis. Prof. Lu wrote a portion of the paper and provided comments during the analysis of the results and the writing stage. Rasphone was mainly responsible for the GIS data processing and a portion of the GIS analysis. Dr. Sarkkula assisted in writing portions of the paper and provided comments during the analysis of the results and the writing stage. Koponen provided comments during the analysis of the results.
Contribution of the author to Papers from I to VII is as follows:

v
The poem by Pentti Saarikoski aptly reflects my feelings during the interesting and highly didactic process of conducting this thesis. From the very start I have been fortunate enough to follow the thoughts and ideas that suited me in each particular space. I have also had, most of the time, the feeling that I was in the right place at the right time, both spatially and work-wise. All this would not have been possible without the great confidence in my work and opinions shown by Prof. Olli Varis, Prof. Pertti Vakkilainen, Prof. Roland Fletcher and Dr. Juha Sarkkula. I deeply appreciate their way of guiding me through this path and working together as a team within various projects.
The German writer Johann Wolfgang Von Goethe (1749-1832) wrote, “Teaching does much, but encouragement does more“; I could not agree more. Without the continuous encouragement of Prof. Olli Varis, Prof. Pertti Vakkilainen, Prof. Tuomo Karvonen, Prof. Ari Jolma, Prof. Roland Fletcher, Dr. Juha Sarkkula, John Dore, Jorma Koponen, Marko Keskinen, Mizanur Rahaman, Ulla Heinonen, Marie Thouvenot-Korppoo, Mira Käkönen, and my other great colleagues from TKK, Sydney, Chiang Mai and elsewhere, and of course my family and friends, this thesis would not be here. The last six years or so have been an important part of my life with all the related activities, such as spending several years on the banks of the Mekong.
During those years I had the privilege to work with and meet numerous great and inspiring persons, each of whom had a special role in the whole. I wish to mention some of them, without diminishing the role of the others.
I’m deeply grateful to the Water and Development Research Group for providing such a great working environment. I could not have imagined better place to do my research. I would particularly like to thank Prof. Olli Varis for his excellent supervising and guiding during the whole PhD work. I would like to also thank Ulla Heinonen, Tommi Kajander, Marko Keskinen, Mira Käkönen, Katri Mehtonen, Mizanur Rahaman and Virpi Stucki; I have really enjoyed working with all of you!
Professors Pertti Vakkilainen and Tuomo Karvonen from the Water Resources Laboratory of TKK are greatly acknowledged for their continuous support and insightful comments during the work. I would also like to thank all my inspiring colleagues there and particularly Marie Thouvenot-Korppoo for her great encouragement and friendship, and refreshing coffee breaks. Antti Louhio and Ari Järvinen are acknowledged for providing valuable technical support. The support of Anne-Maj Seppälä in practical matters is also greatly acknowledged.
ACKNOWLEDGMENTS
“Ajattelin ajatuksia, jotka sopivat minulle,
kävelin metsässä, ja puista satoi pisaroita päälleni,
tulin milloin mihinkin
ja tiesin, että aina olin oikeassa paikassa.” 1
Pentti Saarikoski (1937-1983)
1 “I had thoughts that suited me,I was walking through the woods, and water droplets were falling from the trees on me,wherever I came,I knew that I was always in the right place”

vi
A large part of the work was done with the WUP-FIN project. I am deeply grateful for having the opportunity to work in the project. I would like to thank all the team members over the years and particularly Dr. Juha Sarkkula, Jorma Koponen, Dr. Arto Inkala, Chitt Kimhor, Hannu Lauri, Yin Savuth, Markku Virtanen, and Sok Vongsa.
I have greatly enjoyed working as part of the Greater Angkor Project team run by the University of Sydney. I would particularly like to thank Prof. Roland Fletcher, Prof. Christophe Pottier, Dr. Dan Penny, Dr. Mitch Hendrickson, Dr. Damian Evans, Dr. Martin Polkinghorne, Dr. Terry Lustig, Sam Player, Sandra Wallace, Tessa Boer-Mah, and Martin King, among others, without forgetting the numerous local project workers who have been a great help in the field. The APSARA Authority is equally acknowledged.
The work under the Mekong River Commission, through the WUP-FIN project, was very interesting and fruitful. I would like to express my gratitude to all the colleagues I had there and particularly to John Forsius, Charlotte MacAlister, Worawan Sukraroek, Wisa Wisesjindawat, Christoph Feldkötter, Chayanis Krittasudthacheewa, Iwona Conlan, Chris Barlow, Tim Burnhill, Claus Pedersen, Lieven Geerinck, Petrina Rowcroft, Robyn Johnston, and the whole modelling team, among many others.
During my years in SE Asia I had the unique opportunity to work with many great people from the region. I learnt a lot from each of them. I’m particularly thankful to Huon Rath, Tes Sopharith, Prasith Dimanovong, Keomany Luanglith, Sukkhawit Buaphuan, Akchousanh Rasphone, Someth Paradis, Ros Sobonn, and Samal Say, among many others.
I greatly appreciate the work M-POWER is doing and I have had the privilege to be part of the network. I am grateful particularly to John Dore, Dr. Louis Lebel, Kate Lazarus, Masao Imamura, Rajesh Daniel, Maria Osbeck, Dr. François Molle, among all the others in the network.
I have also had the honour of working and collaborating with various esteemed scholars. I would particularly like to express my gratitude to Prof. Kim Irvine, Prof. Jeff Richey, Prof. János Józsa, Prof. Des Walling, Prof. Avijit Gupta, Prof. Tamas Kramer, Prof. Lu Xi Xi, Prof. Stephen Darby, Dr. Mickey Sampson, Dirk Lamberts, and Pech Sokhem.
Thanks are also due to my master students with whom I have had the privilege to work: Ina Liljeström, Hanna Melkko, Saku Härkönen and Kaisa Västilä. I have learned a lot from working with and guiding them.
I have been extremely lucky in meeting great friends during my stay abroad. I appreciate my friendship with Isabelle Beasley, Penroong Bamrungrach, Elsa Morandat, Andrew Williamson and Bridget McIntosh, Charmaine Williams, Mr. Tom Clements, and Imke Gilsing. With all of them, among many others, I have experienced the wonders of Asia. I appreciate also a lot the way Sirkka-Liisa and Juha Sarkkula supported me during my stay in Laos and Cambodia. In particular, I am thankful to Monika Schaffner for her great company in exploring the surprising paths of life and Southeast Asia, and for her invaluable support for the thesis itself.
Although I have spent a large portion of the last years abroad, I have always had my home in Finland and it has been good to come back. A large part of that good feeling is due to the great friends I

vii
have. I also appreciate the great support I have received from them during the past years. Among many others I would like to thank Kari Hillo, Hanne Junnilainen, Johanna Järvinen, Sami Korhonen, Mikko Natunen, Jussi Nikula, Petteri Saarinen, Tiina Merikoski, Matleena Muhonen, Satu Teerikangas, Susanna Valkonen and Kerkko Vanhanen for their great friendship. Tiina Merikoski is also greatly acknowledged for the excellent editing and layout work. I would particularly like to thank Liisa Kivekäs for her invaluable companionship during the years and her outstanding support while doing this work.
I am extremely grateful for my family Kati, Antero and Leena Kummu, and my grandmother Anni Hillberg, for believing in and supporting me. I would also like to thank Roope, Kaisa Reime and Riku Riski, Hannu and Kirsti Reime, and Pekka and Juha Kummu for their tireless encouragement throughout the work.
I would like to express my gratitude to Abisko Scientific Research Station, and particularly to its Director Prof. Terry Callaghan among all the staff there, for providing me an inspiring and peaceful environment to write this thesis in the beautiful Swedish Lapland. I would like to express my thanks also to the wonderful people I met there, and with whom I spent relaxing and unforgettable moments in the mountains – skiing and walking, particularly to Martin Oskarsson, Rik Van Bogaert, Mats Björkman, Marika Makkonen, and Christine Säwström. I would not have enjoyed being up there and writing this thesis so much, had it not been for all of them.
Finally, I am most thankful to Prof. Anthony Jakeman and Prof. Jozsef Szilágyi for pre-examining my manuscript and giving insightful comments for it. Prof. Charles Vörösmarty is greatly acknowledged for being the opponent for the dissertation.
It would not have been possible to conduct this thesis without the support of various funding agencies and projects, of which I’m deeply grateful. The work was mainly funded by the Academy of Finland project 111672. Additional funding was provided by Maa- ja vesitekniikan tuki ry. (MVTT), Sven Hallin Foundation, TKK Foundation (TKK:n tukisäätiö), Graduate school of TKK, Foundation of Ella and Georg Ehnrooth, Finnish Foundation for Technology Promotion (Tekniikan edistämissäätiö, TES), Foundation of Finnish Association of Civil Engineers (Suomen Rakennusinsinöörien liitto, RIL), Greater Angkor Project (GAP), and The Graduate School for Real Estate, Construction and Planning (KIRSU).
Tämä väitöskirja on omistettu mummolleni Anni Hillbergille, joka on aina pitänyt minusta erinomaista huolta ja tukenut minua jokaisessa mutkassa, sekä vanhemmilleni Katille ja Anterolle, jotka ovat ohjanneet minua elämän poluilla rakkaudella ja ymmärryksellä, tavalla jota arvostan erittäin paljon2.
2 This Thesis is dedicated to my grandmother Anni Hillberg who has always taken great care of me and sup-ported me at every turn, and to my parents Kati and Antero who have guided me through the paths of life with love and understanding in a way that I appreciate a lot.

viii

ix
List of Appended Papers iii
Acknowledgments v
Table of contents ix
List of figures xi
List of tables xiv
PhD in a nutshell xv
1 Introduction 1
1.1 Objectives of the work 31.2 Thesis domain of applicability 31.3 Definition of key terms 4 1.3.1 Impact assesment and related terms 4 1.3.2 Scale and level related terms 6 1.3.3 Large River Basin 6 1.3.4 The Mekong River Basin 101.4 Thesis outline, scales and levels 10
2 Spatio-temporal scales and levels in hydrological impact assessment 13
2.1 Concept of scale 13 2.1.1 Three-tiered conceptualisation of scale 13 2.1.2 Scale issues in the literature: IA context 15 2.1.3 Extent and resolution 16 2.1.4 Organisational levels 17 2.1.5 Multiscale, multilevel, cross-scale, and cross-level 17 2.1.6 Connectivity between the scales 17 2.1.7 Scaling 182.2 Spatial scale 18 2.2.1 Spatial scales: LRB context 19 2.2.2 Spatial scales: Impact assessment 21 2.2.3 Spatial scales: Mekong case studies 222.3 Temporal scales 27 2.3.1 Temporal scales: LRB impact assessment 29 2.3.2 Temporal scales: Mekong case studies 302.4 Spatio-temporal scales 32 2.4.1 Spatio-temporal scales: LRB impact assessment 32 2.4.2 Spatio-temporal scales: Mekong case studies 322.5 Levels in this study 332.6 Connectivity between the scales in the Mekong case studies 33
TABLE OF CONTENTS
x
3 Scale issues related to data and field work 35
3.1 Spatial, temporal and spatio-temporal scales in data issues 36 3.1.1 Spatial scales in data issues 36 3.1.2 Temporal scales in data issues 38 3.1.3 Spatio-temporal scales in data issues 413.2 Data in the Mekong case studies 41 3.2.1 Existing data 41 3.2.2 Field work 41
4 Methods and tools to assess impacts on different scales 45
4.1 Methods and tools in the IA for large river basin 45 4.1.1 HIA Tools and methodologies: introduction 45 4.1.2 Connectivity between the tools: boundary conditions 46 4.1.3 HIA Tools and methodologies: spatio-temporal scales 464.2 Methods and tools in the Mekong case studies 49
5 Results: summary of the mekong case studies 51
5.1 Regional: Mainland Southeast Asia 51
5.2 Basin: Mekong 52
5.3 Sub-basin: Tonle Sap 53
5.3.1 An integrated modelling approach for Tonle Sap Lake ecosystem management 54
5.3.2 Impact of flow alteration on Tonle Sap flood pulse 54
5.3.3 Sedimentation and sediment transport in Tonle Sap 55
5.4 Tributary: Water management in Angkor 55
5.5 Local: Vientiane - Nong Khai 56
6 Discussion: scales as part of the HIA process 57
6.1 Mekong case studies 576.2 Scales as part of the HIA process 58 6.2.1 Scoping phase 59 6.2.2 Analysis phase 60 6.2.3 Management and implication phase 60
7 Conclusions 61
References 65
Annex I: List of abbreviations 72
Annex II: Runoff of the large river basins 73

xi
Figure 1 A: Schematic illustration of the spatial and temporal scales (modified from Cash et al. 2006). B: Schematic illustration of spatio-temporal scale. 6
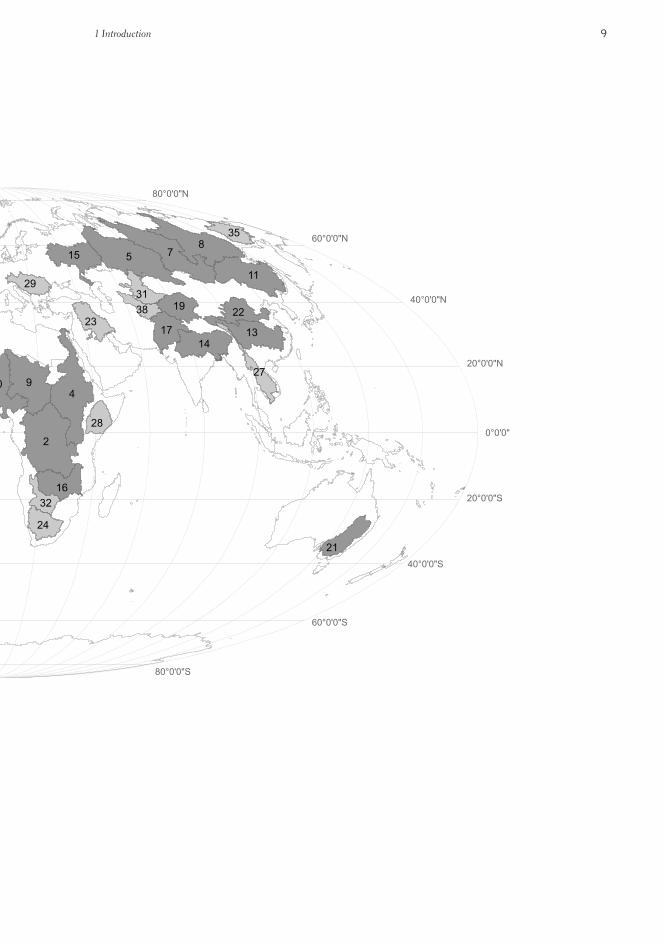
Figure 2 World Large River Basins (i.e. basins with a basin area larger than 500 x 103 km2). Darker basins have an area over 1,000 x 103 km2 and lighter ones between 500 x 103 km2 and 1,000 x 103 km2. The number in each basin refers to the list in Table 2 where the name and area of each basin are given. Source: USGS (2001). Projection: Mollweide, Datum: WGS 1984. 8
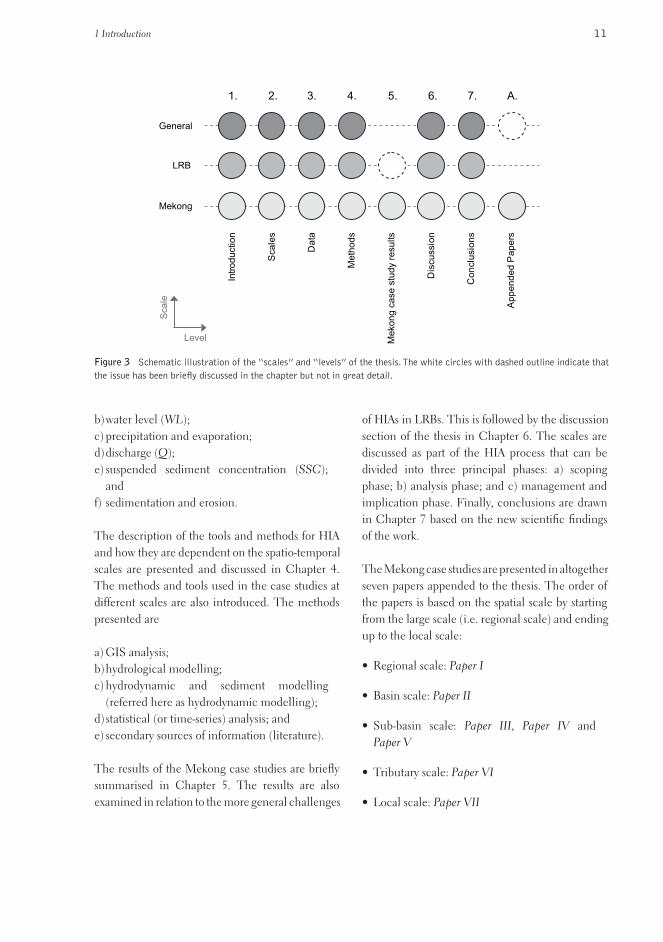
Figure 3 Schematic illustration of the “scales” and “levels” of the thesis. The white circles with dashed outline indicate that the issue has been briefly discussed in the chapter but not in great detail. 11
Figure 4 A hierarchy of scale concepts: A) dimensions of scale; B) kinds of scale; and C) components of scale (adapted from Wu and Li 2006a: 6). 14
Figure 5 Schematic illustration of A) increasing extent in landuse dataset over Tonle Sap delta area; and B) decreasing resolution in landuse dataset over Tonle Sap delta area from 1 km to 4 km increasing extent in landuse dataset over Tonle Sap delta area. The number of cells aggregated to form a new data unit is indicated by n; total area is indicated by a [km2]. Source: modified and applied from Turner et al. (1989b: 154) to Tonle Sap landuse dataset (JICA 1999). 16
Figure 6 Schematic illustration of cross-level, cross-scale, multilevel and multiscale interactions (modified from Cash et al. 2006). The more specific definitions of the terms can be found in the text. 17
Figure 7 Spatial scales in LRB context with special focus on the Mekong Basin. The areas after each marked spatial scale are in 103 km2 (note: areas smaller than 102 km2 cut off from figure). 21
Figure 8 Spatial scales of the possible hydrological impacts due to variation of actions (note: areas smaller than 102 km2 cut off from the figure). 22
Figure 9 Illustration of the spatial scales of the case studies. 22
Figure 10 Extent of the regional scale of the Mekong study: Southeast Asia mainland combined with the LRB (Mekong) and IRB (Irrawaddy, Salween, Chao Phraya, and Red River) of the region. (Map projection: WGS 1984, UTM, Zone 47N – Source of the Basins GIS data (USGS 2001). Map modified from Paper I). 23
LIST OF FIGURES
xii
Figure 11 Basin scale of the Mekong study: map of the Mekong Basin including the locations of smaller scale studies with capital letters: A: Sub-basin scale – Tonle Sap Lake and its floodplains; B: Tributary scale - Angkor watershed area; C: Local scale – Vientiane – Nong Khai reach of the Mekong River (Map projection: WGS 1984, UTM, Zone 48N – Source of the Basins GIS data (USGS 2001). Map modified from Paper II). 25
Figure 12 Sub-basin scale of the Mekong study: map of the Tonle Sap system, including the permanent lake, Tonle Sap River NNW from Prek Kdam and inundated area NW from the dashed line crossing the floodplain at Prek Kdam. (Map projection: WGS 1984, UTM, Zone 48N – Source of the GIS data: Mekong River Commission (2006). Map modified from Paper III). 27
Figure 13 Tributary scale of the Mekong study: map of the Angkor study area, including the higher plane and floodplain. (Map projection: WGS 1984, UTM, Zone 48N – Source of the GIS data: Mekong River Commission (2006) and Evans et al. (2007). Map modified from Paper VI). 28
Figure 14 Local scale of the Mekong study: Map of the Vientiane – Nong Khai reach of the Mekong. (Map projection: WGS 1984, UTM, Zone 48N – Source of the GIS data: Mekong River Commission (1992; 2006). Map modified from Paper VII). 28
Figure 15 Temporal scales. 29
Figure 16 Temporal scales of the possible hydrological impacts due to variation of actions. 31
Figure 17 Temporal scales of the Mekong case studies. 31
Figure 18 Spatio-temporal scales of the consequences of human actions in a LRB. 32
Figure 19 Spatio-temporal scales of the Mekong case studies. 33
Figure 20 Schematic and simplified illustration of the levels of this study and possible relations with the next levels in the EIA process. 34
Figure 21 Process scale versus observation scale (modified from Blöschl and Sivapalan 1995: 256). 36
Figure 22 Three alternatives definitions of observation scale in space or time: a) spatial/temporal extent; b) spacing (i.e. resolution); c) integration volume / time constant (modified from Blöschl and Sivapalan 1995: 256). 37
Figure 23 Spatial observation scales for selected data categories; a) spatial extent; b) resolution; c) integration volume. (See also Figure 22). 38

xiii
Figure 24 Example of the spatial resolution impacts on the mapping of the Mekong Basin. a) sample from the Upper Mekong Basin in China; and b) sample from the Mekong Delta. Locations are shown in the whole basin map on the left. [GWSP stands for GWSP Digital Water Atlas (2008); GRDC stands for Global Runoff Data Centre (2007); USGS stands for USGS (2001); and WRI stands for World Resources Institute (2006)]. 39
Figure 25 Temporal observation scales for selected data categories; a) temporal extent; b) spacing; c) time constant. (See also Figure 22). 39
Figure 26 Scales and heterogeneity at the time scale of time series data: daily (left), monthly and annual scale with hourly, daily and monthly data [water level data from Chaktomuk confluence of the Mekong mainstream, at Phnom Penh, Cambodia; see Figure 12 for location – Source: MoWRaM (2006).] 40
Figure 27 Spatio-temporal observation scales for selected data categories; a) extent; b) resolution/spacing; c) integration volume/time constant (See also Figure 22, Figure 23 and Figure 25). 40
Figure 28 Spatio-temporal model and analysis scales for the selected HIA tools; a) extent; b) resolution/spacing; c) integration volume/time constant [Note: different spatial scale (y-axis) in a) and b) & c)]. 47
Figure 29 Tools and methodologies used in the Mekong case studies (the dashed circles are explained in the footnotes to the table). 48
Figure 30 Spatio-temporal scales of the tools used in the Mekong case studies. 49
Figure 31 The levels of HIA covered by each of the Mekong case studies (the dashed circle is explained in the footnotes to the table). 51
Figure 32 Conceptual process for assessing hydrological impacts (adapted and modified from MacDonald 2000: 302). 58
Figure 33 Runoff vs. latitudinal centre point of LRBs (see also Table 9) (adapted from Adamson 2008). 74

xiv
LIST OF TABLES
Table 1 Definitions of key terms related to the concept of scale with the source of the definition. 5
Table 2 List of the Large River Basins and affiliated basin area in thousands square kilometres presented with annual average discharge data. The basins are mapped in Figure 2. (Source: Area is based on the GIS analysis of Global GIS Database compiled by USGS (2001). Discharge sources are listed in table footnotes). 7
Table 3 Summary of the spatial scales in the LRB and Mekong River Basin context. 20
Table 4 Water resources related actions in the LRB context with definition and impacts of the actions including the range of scales. 24
Table 5 List of the different sources and basin areas of the Mekong. 26
Table 6 Water resources related actions in the LRB context with definition and impacts of these actions including the range of scales. 30
Table 7 Spatial scales (extent, resolution and integration volume) of the existing data used in the Mekong case studies. The source of the data is presented in the appended paper in question. 42
Table 8 Temporal scales (extent, spacing and time constant) of the existing data used in the Mekong case studies. The source of the data is presented in the appended paper in question. 43
Table 9 Runoff of the Large River Basins with the affiliated basin area in thousands square kilometres presented with latitudinal location of basin centre point. The basins are mapped in Figure 2. (Source: Area and latitude is based on the GIS analysis of Global GIS Database compiled by USGS (2001). Discharge sources are listed in Table 2). 73

xv
PhD in a nutshell:
• Scope: scales as part of the Hydrological Impact Assessment (HIA) process in large river basins
- Geographical scope of the case studies is the Mekong Basin in Southeast Asia
• Aim: to analyse how the different spatio-temporal scales can be identified and taken into account when conducting a HIA process in a large river basin. A special focus is on the tools and methodologies used within the assessment. The HIA is presented in a range of scales through the Mekong case studies.
• Scales & levels: - Spatial scales: ranging spatially from local to regional scale - Temporal scales: past, present and future – ranging from minutes to decades - Spatio-temporal scales: combination of spatial and temporal scales - Levels: hydrology, hydrodynamics and sediment transport
• Data – The following datasets have been analysed and used: a) remote sensing and spatial (referred to here simply as GIS) data (various different datasets, such as land use, flood extent, digital elevation model, etc.); b) water level; c) precipitation and evaporation; d) discharge; e) suspended sediment concentration; and f) sedimentation and erosion. The observation scales of the different data categories are analysed. Additionally, included is a discussion of how different datasets can be used / collected at different spatio-temporal scales.
• Methodologies – The following methods have been analysed and used: a) GIS analysis; b) hydrological modelling; c) hydrodynamic and sediment modelling (referred to here as hydrodynamic modelling); d) statistical (or time series) analysis; and e) secondary sources of information (literature). The model and analysis scales of the tools are analysed, and a discussion of how different methodologies can be used in each spatio-temporal scale is included.

xvi

1 INTRODUCTION
“The life as we know it is water-based and water dependent life.”
Albert Szent-Gyorgyi (1972)
Rivers and river basins have been a cradle for human societies since the beginning of human history. Many large rivers have been characterized as ‘mother of waters’ and ‘father of waters‘3 (Ettema 2005) symbolising their importance for human communities. Moreover, and probably even more importantly, large river basins with a variety of ecological zones and corridors are important lifelines for unique ecosystems housing innumerable aquatic and semi-aquatic species.
Humanity has utilised water resources for millennia by modifying the natural water courses through the construction of e.g. canals and dams. The earliest evidence of river engineering is the ruins of irrigation canals that are over eight thousand years old found in Mesopotamia, Southwest Asia (McNeill and McNeill 2003). Remains of water storage dams found in Jordan, Egypt and other parts of the Middle East date back to at least 3000 before the Common Era (BCE) (WCD 2000). The water resources related constructions occurred mostly at a relatively small scale4 up to the 19th century. Thus, the impacts of such activities were also limited to a rather small area. There are, of course, exceptions like the extensive Dujiang irrigation project in Eastern China, which supplied water for around 800,000 hectares of fields and was built 2,200 years ago (Jackson and Sleigh 2000; WCD 2000). Relatively extensive agriculture practices in various places, mainly in Asia and Europe, have also had impacts on the nature, and consequently on water resources, at least as early as 1000 BCE (McNeill and McNeill 2003).
Only quite recently, since around the mid 19th century, the water resources related projects have grown in both number and size. The first hydropower dam for electricity production was built in 1890 (WCD 2000), and food for a rapidly growing population was cultivated more and more in fields supplied by irrigation (McNeill and McNeill 2003). The construction of large projects really boosted after the Second World War, particularly in the United States and Europe. During the latter half of the 20th century the number of large dams5 increased worldwide from 5,000 to 45,000 (WCD 2000). This has led to a situation where altogether 8,400 km3 of water is estimated to be stored behind the registered dams (Vörösmarty et al. 1997). This represents a sevenfold increase in the standing stock of natural river water and a manifold increase in the natural residence time of channel waters (ibid).
At the same time around 4,000-5,000 km3 of fresh water are withdrawn annually from the world’s lakes, rivers and aquifers (Vörösmarty 2000), mostly for agricultural practices. Despite reductions in the annual rate of increase in withdrawals from 1970, global water use has grown more or less exponentially with human population and economic development over the industrial era (ibid).
River alterations, being either natural or anthropogenic, have impacted riverine communities throughout human history. During the last two centuries, while the projects have
3 The Mekong River in most of the basin countries has the maternal epithet ‘mother of waters’, while for example Burma’s Irrawaddy is a ‘father of waters’ (Ettema 2005).4 The term small scale refers in this thesis to phenomena that are small in regard to scales of space or time.5 A large dam is defined by WCD (2000) as a dam higher than 15 m.
1

2
grown larger, the scale of the anthropogenic impacts has expanded significantly. The human-made construction has often increased the impact of natural river alterations, and also led to other consequences such as blocking the migratory fish routes and trapping the fertile sediments behind dams. This has significantly altered the natural hydrological cycle (Vörösmarty 2000) and sediment transport (Walling 2006). The anthropogenic changes also have an impact on ecosystem well-being and especially on the poorest people whose livelihoods are directly dependent on natural resources. Floodplains are one of the most important parts of rivers and other freshwater ecosystems. The degradation and loss of wetlands, alarmingly, occur more rapidly than that of other ecosystems (Finlayson and Spiers 1999; Millennium Ecosystem Assessment 2005). Therefore, maintenance of the hydrological regime of a floodplain and its natural variability is necessary to sustain the ecological characteristics of the floodplain, including its biodiversity (Millennium Ecosystem Assessment 2005).
The most radical changes in ecosystems due to anthropogenic impacts have so far occurred in Europe and countries such as U.S., Japan, Russia, China and Australia. In that part of the world, there are very few untamed rivers left. During the last decades, however, the rate of human impact on water resources has increased rapidly in less developed countries in South America, Africa and Asia, and this trend seems to be still continuing (e.g. UN/WWAP 2006; ADB 2007; UNEP 2007). At the same time, the direction is opposite in the developed countries, where dams are removed and wetlands restored.
Some decades after the Second World War, when large water resources projects started to mushroom rapidly, the Environment Impact Assessment (EIA) emerged as a discipline. This happened first in the United States in the early 1970s with the introduction of the National Environment Policy
Act (NEPA) of 1969 (Ortolano and Shepherd 1995). In the European Union (EU) the EIA Directive on Environmental Impact Assessment of the effects of projects on the environment was introduced in 1985 and amended in 1997 (European Commission 2008). The EIA is currently incorporated into most of the international and national water laws (Petts 1999) and is a natural component of every large scale water resources project.
Numerous human activities – from cutting the forest for paper industry in Finland to large dam building in Brazil – have consequences for the environment measured along multiple levels and scales (Gibson et al. 2000). The multilevel/multiscale nature of the problems related to the EIA requires that researchers address key issues of scales and levels in their analyses. Scale issues have been the core research areas in many scientific disciplines, such as geography (e.g. Meentemeyer 1989), ecology (e.g. Turner et al. 1989a; Wiens 1989; Levin 1992), hydrology (e.g. Robinson and Sivapalan 1997; Western and Blöschl 1999; Blöschl 2001), archaeology (e.g. Stein and Linse 1993), and sociology (e.g. Gibson et al. 2000; Evans et al. 2002). Despite their importance, scale issues have been addressed within the EIA literature only rather recently (João 2002).
The ongoing and planned large scale water resources related development projects in Large River Basins (LRB)6, particularly in Asia, South America and Africa, are providing many economic opportunities for the countries but at the same time they will challenge human well-being and ecosystem health in the future (e.g. UN/WWAP 2006; ADB 2007; UNEP 2007). It is thus important and timely to emphasise scale issues in assessing the impacts of development activities on hydrology in a LRB context, which is the aim of this work, and further on ecosystems and people’s livelihoods. The Mekong River, one of the LRBs and the geographical focus of the thesis7, is the largest river basin in Southeast Asia. The Mekong
6 The term ‘Large River Basin’ is defined later in this Chapter, under the section ‘Definition of key terms’.7 Hydrological impact assessment is presented in the Mekong through seven case studies that are appended to the thesis
Spatio-temporal scales of hydrological impact assessment in large river basins: the Mekong case

3
8 The term ‘Hydrological Impact Assessment’ is defined later in this Chapter, under the section Definition of key terms. 9 Direct human impact refers here to development actions such as irrigation, dams, water diversion, road construction, etc., having a direct impact on hydrology and/or sediment transport locally or on a larger scale. 10 Here termed Hydrological Impact Assessment and defined in more detail below in the next section.
is currently facing rapid economic development (Varis et al. 2008). This is contributing to the rapid expansion and scale of water management projects, such as hydropower dams and irrigation schemes.
1.1 OBJECTIVES OF THE WORK
The overall objectives of the work is to present the different spatio-temporal scales of the Hydrological Impact Assessment (HIA)8 process in a LRB context and to analyse how and when the scales can be taken into account when conducting the assessment. A special focus is on the data and methodologies used within HIA. The geographical focus of the thesis is the Mekong River Basin (MRB) in Southeast Asia (see location in Figure 2) where HIA is presented in different scales through case studies. The case studies are presented in seven papers appended to this thesis.
More specifically, the objectives of the study are to:
• Define the spatial and temporal scales of the Large River Basin context with a special focus on processes within HIA
• Define the spatio-temporal scales of the consequences and impacts of water resources related actions
• Analyse the past, present and predicted human impacts on sediment transport and hydrology in the Mekong in different spatio-temporal scales by various methods and tools
• Analyse the data, methods and tools used in the Mekong HIA case studies from the spatio-temporal scale perspective
The domain of applicability of the study is within the spatio-temporal scales in assessing the direct human impacts9 on hydrology and sediment transport in large river basins in general, and more specifically in the Mekong. The data, tools and methods related to different scales, both spatial and temporal, of HIA are discussed. The LRBs differ greatly from each other, having their own specific geographical, hydrological and climatic characteristics. Each case is, therefore, unique and the aim here is not to develop a scale template to fit all the cases. On the contrary, each assessment should be tailor-planned and made while considering local conditions and scales, varying within and between the basins.
The overall domain, presented briefly above, concentrates on three “scales” in each of its sub-areas: a) scales in general; b) Large River Basins; and c) specifically the Mekong Basin, reflected through the case studies.
Phenomena altered by human action can be caused by various different reasons, alone or together, such as climate, policies, management, etc. Here, however, the aim is not to become absorbed in the causes but in the assessment of impacts. And more broadly in scales, tools and methodologies related to HIA.
Moreover, the impacts can, and should, be assessed in various disciplines such as environmental, ecological, and social studies, economics, etc. in an integrated and interrelated approach. In this work, however, the impacts are discussed and assessed mainly from the hydrological, hydrodynamic and sediment transport perspective10, with full awareness that this discipline is just part of a wider context and strongly linked to other disciplines and more broadly to Integrated Water Resources
1.2 THESIS DOMAIN OF APPLICABILITY
1 Introduction

4
assessment (CIA), hydrological impact assessment (HIA), etc. The different forms of impact assessment discussed in this work are defined below.
Environmental Impact Assessment (EIA): International Association for Impact Assessment (IAIA 1999: 2) defines the EIA as follows: “The process of identifying, predicting, evaluating and mitigating the biophysical, social, and other relevant effects of development proposals prior to major decisions being taken and commitments made.” The major dilemma across the world is what does ‘the environment’ in EIA mean? For most writers environmental impacts mean “biogeophysical, socio-economic and cultural” effects (Vanclay 2004). In other words, EIA is a triple bottom line phenomenon (ibid).
Cumulative Impact Assessment (CIA)13: Cumulative effects are the net result of environmental impact from a number of projects and activities (Sadler 1996). By definition, they are combined within a time and space framework established through direct and indirect activity effect relationships (ibid), and often in combination with the impacts of other past, existing and proposed actions. Each increment from each action may not be noticeable but cumulative impacts may become apparent when all increments are considered together. Consequently, CIA can be defined as “a systematic procedure for identifying and evaluating the significance of effects from multiple activities. The analysis of the causes, pathways and consequences of these impacts is an essential part of the process” (Cooper 2004: 4). CIA is, according to Hegmann et al. (1999: 3), “environmental assessment as it should always have been: an EIA done well”.
Hydrological Impact Assessment (HIA)14: HIA is defined here as the prediction or estimation of
“Impact assessment can be broadly defined as the prediction or estimation of the consequences of a current or proposed action (project, policy, technology)” (Vanclay and Bronstein 1995), while International Association for Impact Assessment (IAIA 2008) defines IA as: “Impact assessment, simply defined, is the process of identifying the future consequences of a current or proposed action”.
Impact assessment is a generic term that can mean either an integrated approach or the composite/totality of all forms of impact assessment (Vanclay 2004) such as environmental impact assessment (EIA), strategic environmental assessment (SEA), social impact assessment (SIA), cumulative impact
1.3.1 Impact assessment and related terms
It is obvious that terms, such as scale, level, impact assessment and large river basin, are often used interchangeably and that many of the key concepts related to these terms are used differently across disciplines and scholars. Thus, the terms used in this thesis are defined and presented below, drawing mainly on the literature cited in the bibliography. Some terms are also defined within the text when they appear for the first time. The statement by Wu and Li (2006a: 4): “good science starts with clear definitions” aptly defines the aim of this section.
1.3 DEFINITION OF KEY TERMS
Management (IWRM)11.
Scaling12 is a very important part of scale issues and research. Scaling is not, despite its importance, within the domain of this thesis and therefore it is not discussed or analysed in great detail within the HIA domain.
11 IWRM can be summarised in the following way (GWP 2000): waters should be used to provide economic well-being to the people, without compromising social equity and environmental sustainability.12 Scaling is the translation of information between or across spatial and temporal scales (Turner et al. 1989a; Blöschl and Sivapalan 1995; Wu and Li 2006a)13 CIA is often also termed Cumulative Effect Assessment (CEA). In the literature used for the thesis the term CEA is com-monly used. However, the term CIA is used in this study from here onwards.14 The abbreviation of Hydrological Impact Assessment, HIA, should not be confused with Health Impact Assessment that has the same abbreviation and is more widely used.
Spatio-temporal scales of hydrological impact assessment in large river basins: the Mekong case

5
Table 1 Definitions of key terms related to the concept of scale with the source of the definition.
Term Definition Source
Scale The spatial, temporal, quantitative, or analytical dimensions used to measure and study a phenomenon
Gibson et al. (2000)
Characteristic scale The distinctive scale (or range of scales) of a natural phenomenon that characterizes its behaviour
Wu and Li (2006a)
Scale effect Usually refers to the changes in the result of a study due to a change in the scale at which the study is conducted
Wu and Li (2006a)
Process scale The scale on which a process actually operates (also called intrinsic scale)
Blöschl and Sivapalan (1995)
Observation scale The scale at which sampling or measurement is taken (also referred to as sampling scale or measurement scale)
Wu and Li (2006a)
Cartographic scale Ratio of map distance to actual distance on the earth surface, usually expressed in terms such as 1: 10,000. A so called large-scale map usually covers a smaller area with greater detail.
Turner et al. (1989a); Wu and Li (2006a)
Geographic scale Size of a particular map (equivalent to the term extent) Lam and Quattrochi (1992); Wu and Li (2006a)
Absolute scale The actual distance, time or quantity Turner et al. (1989a); Gibson et al. (2000)
Relative scale A transformation of an absolute scale to one that describes the functional relationship of one object or process to another (e.g., the relative distance between two locations based on the time required by an organism to move between them).
Turner et al. (1989a); Gibson et al. (2000)
Scaling Translation of information between or across spatial and temporal scales or organizational levels (e.g. upscaling or downscaling)
Turner et al. (1989a); Blöschl and Sivapalan (1995); Wu and Li (2006a)
Extent Total spatial or temporal expanse of a study Turner et al. (1989a); Wiens (1989); Wu and Li (2006a)
Resolution The precision used in measurement Turner et al. (1989a); Gibson et al. (2000)
Coverage Sampling intensity in space or time Wu and Li (2006a)
Spacing Interval between two adjacent samples or lag Wu and Li (2006a)
Grain The finest resolution of a phenomenon or a data set in space or time within which homogeneity is assumed (e.g. pixel size for raster data)
Turner et al. (1989a); Wiens (1989); Wu and Li (2006a)
Organisational levels The units of analysis that are located at the same position on a scale. Many conceptual scales contain levels that are ordered hierarchically, but not all levels are linked to each other in a hierarchical system (also called just ‘levels’) – usually constructed by the observer
Gibson et al. (2000); Wu and Li (2006a)
Scale class The different levels along the scale, such as global, regional, basin, sub-basin, etc.
-
Hierarchy A conceptually or causally linked system of grouping objects or processes along an analytical scale
Gibson et al. (2000)
1 Introduction

6
SpatialA: B:
Spatial extent,
geographical detail
Rates, durations,
and frequencies
Temporal
Globe
Regions
Basins
Local
Century
Annual
Monthly
Daily
Spatio-temporal
Spatial
Temporal
Globe
Regions
Basins
Local
Ce
ntu
ry
An
nu
al
Month
ly
Daily
Figure 1 A: Schematic illustration of the spatial and temporal scales (modified from Cash et al. 2006). B: Schematic illustration of spatio-temporal scale.
In natural sciences scale usually refers to the spatial or temporal dimension of a phenomenon (Wu and Li 2006a). The meaning of scale, however, varies significantly between disciplines and communities, and its usage within any one discipline is largely tacit (Goodchild and Quattrochi 1997). The scale is used to refer both to the magnitude of the study and also to the degree of detail, as well as context of
1.3.2 Scale and level related terms
15 HIA is here expanded to cover the phenomena closely related to pure hydrological impacts in the LRB context, in this case hydrodynamics and sediment transport. 16 This conforms well to the usage of this term within the domain of ecology and natural sciences but is exactly the opposite of how the term is being used by cartographers (Turner et al. 1989a).17 A basin is a geographic area drained by a single major stream; consists of a drainage system comprised of streams and often natural or man-made lakes. It is also referred to as Drainage Basin, Watershed, or Hydrographic Region. Source: Water Words Dictionary (2008).
space, time and many other dimensions of research (ibid). Therefore, it is important to define the main terms related to the concept of scale within the domain of this work (Table 1).
The term small scale (or fine scale) refers in this thesis to phenomena that are small in regard to scales of space or time, as used commonly in e.g. ecology (Turner et al. 1989a). Thus, large scale (or broad scale) refers to big items or spaces16.
Wu and Li (2006a) list three primary dimensions of scale: space, time and organisational level. The spatial and temporal scales are discussed in this work both separately and together, namely as spatio-temporal scale (Figure 1). The organisational level refers in this work to the HIA sectors that are assessed within the domain of the thesis, being a) hydrology, b) hydrodynamics, and c) sediment transportation.
the consequences of a current or proposed human action on hydrology, sediment transport and hydrodynamics15. The impacts on global climate, such as increased evaporation into the atmosphere due to irrigated fields or greenhouse gas emissions from the reservoirs, are not considered in this work to be part of the HIA analysis. The HIA could be classified as a CIA conducted in the fields of hydrology, sediment transport and hydrodynamics. The term HIA is not very widely used in the literature but can nevertheless be found in a number of studies across various scientific disciplines such as climate change (Andréasson et al. 2004), flood control (Brouwer and van Ek 2004) and afforestation (Wattenbach et al. 2007).
A Large River Basin (LRB) is defined here as a basin17 larger than 500×103 km2. The LRB has not been defined precisely in the literature based
1.3.3 Large River Basin
Spatio-temporal scales of hydrological impact assessment in large river basins: the Mekong case

7
N Name Area [×103 km2]
Discharge [km3/yr]
Sr N Name Area [×103 km2]
Discharge [km3/yr]
Sr
1 Amazon 6,121 6,923 s 23 Tigris-Euphrates 983 72 r
2 Congo 3,707 1,320 s 24 Orange 971 5 r
3 Mississippi 3,268 510 s 25 Orinoco 962 1,007 s
4 Nile 3,155 161 s 26 Yukon 849 196 s
5 Ob 3,052 404 s 27 Mekong 816 505 s
6 Paraná 2,738 811 s 28 Jubba-Shibeli 807 8 r
7 Yenisey 2,611 618 s 29 Danube 788 225 s
8 Lena 2,433 539 s 30 Tocantins 778 381 r
9 Lake Chada 2,421 n/a 31 Syr Daryac 774 37 w&r
10 Niger 2,153 302 s 32 Okavango 710 15 w&r
11 Amur 2,097 360 s 33 Columbia 670 237 s
12 Mackenzie 1,770 325 s 34 Rio Grande 668 4 r
13 Yangtze 1,723 1,006 s 35 Kolyma 667 119 s
14 Ganges-Brahmaputrab 1,637 1386 s 36 Colorado 657 20 w&r
15 Volga 1,453 255 s 37 São Francisco 634 104 s
16 Zambezi 1,392 154 s 38 Amu Daryac 577 44 r
17 Indus 1,145 226 s
18 Nelson 1,112 76 r 39 Lake Balkhashc 498 n/a
19 Tarimc 1,069 5 r 40 Dnieper 497 53 s
20 St. Lawrence 1,058 318 s 41 Dond 459 29 w&r
21 Murray-Darlingc 1,052 24 s 42 Limpopod 421 5 w&r
22 Yellow River 1,024 67 s 43 Senegald 420 19 r
a Lake Chad Basin is not a single river but the area that drains to the Lake
b Ganges-Brahmaputra basin can be divided into three basins: Ganges (1,006×103 km2), Brahmaputra (549×103 km2) and Meghna (80×103 km2)
c Data from the World Resource Institute (2006) were used, either partially or fully (Murray-Darling), in the definition of the basin
d Data from the World Resource Institute (2006) were used for Intermediate River Basins smaller than Dnieper Basin
Sr Source for discharge data s Shiklomanov (1999)
r RivDis data (Vörösmarty et al. 1998)
w Wikipedia (2008b)
Table 2 List of the Large River Basins and affiliated basin area in thousands square kilometres presented with annual average discharge data. The basins are mapped in Figure 2. (Source: Area is based on the GIS analysis of Global GIS Database compiled by USGS (2001). Discharge sources are listed in table footnotes).
on spatial extent and thus, a new definition was needed. There is, however, a definition for Large River System (LRS) by Dynesius and Nilsson (1994) and Nilsson et al. (2005) who defined the LRS as being a river with virgin mean annual discharge >350 m3/s. Nevertheless, in this thesis a spatial determination is required as spatial scales
of LRB are discussed. Thus, the definition based on the discharge is not directly applicable to this work.
The various global GIS databases including the largest river basins (USGS 2001; World Resources Institute 2006; Global Runoff Data Centre 2007;
1 Introduction

8
18 Mollweide projection is selected to be used here as it has an accurate depiction of area, which is important when analysing the basin areas.
Figure 2 World Large River Basins (i.e. basins with a basin area larger than 500 x 103km2). Darker basins have an area over 1,000 x 103 km2 and lighter ones between 500 x 103 km2 and 1,000 x 103 km2. The number in each basin refers to the list in Table 2 where the name and area of each basin are given. Source: USGS (2001). Projection: Mollweide18, Datum: WGS 1984.
1
3
6
10
12
1820
25
26
30
33
34
36
37
Spatio-temporal scales of hydrological impact assessment in large river basins: the Mekong case
9
40°0'0"N
20°0'0"N
0°0'0"
20°0'0"S
40°0'0"S
60°0'0"S
80°0'0"S
60°0'0"N
80°0'0"N
2
4
5 78
9
11
0
1314
15
16
17
19
21
2223
24
28
29
32
27
31
35
38
1 Introduction

10
19 In the appended papers an area of 795×103 km2 is used for the Mekong based on the definition of the basin area used by the Mekong River Commission (Mekong River Commission 2003; 2005)20 The term ‘Very Large River Basins’ could be used for these basins if there is a need to differentiate these from the LRBs with
an area less than 1,000×103 km2. In this work, however, only the definition LRB is used for all the basins with an area over
500×103 km2.
The Mekong is the largest river in Southeast Asia having a basin area of 816×103 km2. The length of
1.3.4 The Mekong River Basin
1.4 THESIS OUTLINE, SCALES AND LEVELS
The thesis has been divided into seven chapters. A brief introduction to each chapter is given below. The work has three “scales”: a) scales in general, b) LRB, and c) Mekong basin; while the chapters and appended papers form the “levels” of the work (Figure 3).
After Introduction (Chapter 1), Chapter 2 presents previous work on scale issues in the hydrological and impact assessment fields. The spatial, temporal and spatio-temporal scales are defined in LRB and HIA context in more detail. This is followed by a more specific analysis of the scales in the Mekong River Basin and case studies conducted there.
Chapter 3 includes the spatio-temporal relations of the data issues and field work in the LRB context and more specifically in the Mekong case studies. The data are crucial for conducting the HIA. The following data types are included in the analysis:
a) remote sensing & spatial (referred here simply GIS) data (datasets of various different types, such as land use, flood extent, digital elevation model, etc.);
GWSP Digital Water Atlas 2008) were analysed to determine their accuracy, coverage, availability, and date of creation. The USGS (2001) database was found to be the most accurate dataset (see Section 3.1.1 and Figure 24). The areas of LRBs vary between different sources due to different types of data, basin definition, and resolution used in each study.
River basin boundaries created in this study are based on two datasets on the Global GIS Database compiled by USGS (2001): The Hydro1k Drainage Basins and River Basins. The information from Water Resources eAtlas (2003), World Resources Institute (2006) and Revenga et al. (1998) was used as support in defining the boundaries and cross-checking them. Moreover, Small Rivers and Streams and Perennial Rivers datasets from USGS (2001) were used as a support files.
The Large River Basins, determined by the definition presented above and created by using the above mentioned datasets, are mapped globally in Figure 2 and listed with annual average discharge in Table 2. The runoff of the large river basins is presented in Annex II. There are altogether 38 LRBs with areas varying from 577×103 km2 (Amu Darya) to 6,121×103 km2 (Amazon). The Mekong, having an area19 of 816×103 km2, is the 27th largest basin in the list. 29 basins out of the 38 are shared by two or more countries. There are in total 22 basins20 with an area larger than 1,000×103 km2 and 16 basins with an area between 500×103 km2 and 1,000×103 km2 (Table 2). There are altogether 44 basins having an area between 100×103 km2 and 500×103 km2 (World Resources Institute 2006) of which the term Intermediate River Basins (IRB) is used in this work.
the river is 4,909 km (Liu et al. 2007). The Mekong originates from the Qinghai Province and Eastern Tibet, China. The highest point of Mekong is in Qinghai Province being 5,200 m AMSL (ibid). From there, the river crosses the Chinese province of Yunnan, flowing through narrow gorges in a very steep topography for most of its upper course. After leaving China, the Mekong marks the border between Myanmar and Lao PDR. Further downstream, the river runs through Lao PDR, Thailand, Cambodia, and Vietnam to the South China Sea (see Figure 11). With approximately 505 km3 of water the Mekong carries each year, the Mekong is the world’s 10th largest river (Table 2), while the Mekong runoff (619 mm/yr) is 4th greatest of the LRBs (see Annex II).
Spatio-temporal scales of hydrological impact assessment in large river basins: the Mekong case
11
Figure 3 Schematic illustration of the “scales” and “levels” of the thesis. The white circles with dashed outline indicate that the issue has been briefly discussed in the chapter but not in great detail.
Mekong
LRB
General
Intro
duct
ion
Sca
les
Dat
a
Met
hods
Mek
ong
case
stu
dy re
sults
Dis
cuss
ion
Con
clus
ions
App
ende
d P
aper
s
1. 2. 3. 4. 5. 6. 7. A.
Level
Sca
le
b) water level (WL); c) precipitation and evaporation; d) discharge (Q); e) suspended sediment concentration (SSC);
and f) sedimentation and erosion.
The description of the tools and methods for HIA and how they are dependent on the spatio-temporal scales are presented and discussed in Chapter 4. The methods and tools used in the case studies at different scales are also introduced. The methods presented are
a) GIS analysis; b) hydrological modelling; c) hydrodynamic and sediment modelling
(referred here as hydrodynamic modelling); d) statistical (or time-series) analysis; and e) secondary sources of information (literature).
The results of the Mekong case studies are briefly summarised in Chapter 5. The results are also examined in relation to the more general challenges
of HIAs in LRBs. This is followed by the discussion section of the thesis in Chapter 6. The scales are discussed as part of the HIA process that can be divided into three principal phases: a) scoping phase; b) analysis phase; and c) management and implication phase. Finally, conclusions are drawn in Chapter 7 based on the new scientific findings of the work.
The Mekong case studies are presented in altogether seven papers appended to the thesis. The order of the papers is based on the spatial scale by starting from the large scale (i.e. regional scale) and ending up to the local scale:
• Regional scale: Paper I
• Basin scale: Paper II
• Sub-basin scale: Paper III, Paper IV and Paper V
• Tributary scale: Paper VI
• Local scale: Paper VII
1 Introduction

121212

In general terms, scale is the dimension used to measure or assess a phenomenon (Gibson et al. 2000). Scale and level help to identify patterns, but they do not explain them (ibid). Wu and Li (2006a) propose a three-tiered conceptualisation of scale, organising the scale definitions into a conceptual hierarchy that consist of the dimensions, kinds, and components of scale (Figure 4). Dimensions are more general, components of scale are most specific, while kinds of scale fall between these two (ibid). The three-tiered structure provides a logical outline for the various scale concepts and how those differ from or relate to each other. It has been used as a base for the scale approach of the thesis.
2 SPATIO-TEMPORAL SCALES AND LEVELS IN HYDROLOGICAL IMPACT ASSESSMENT
“Scale is a fundamental concept in ecology and all sciences”
Wu et al. (2006b: 329)
Scale is an elemental component of the environmental sciences and an important part of each of their subfields. Scales play a central role in studies of environmental changes, and moreover, environmental impacts. The causes and consequences of environmental change may occur on, and can be measured, at different levels and along multiple scales (Gibson et al. 2000). Scale can also be seen as one of the unifying concepts that cross all the natural and social sciences (Wu et al. 2006a). The world is intriguing at least in part because of its ability to reveal more detail almost ad infinitum: the closer we look at the world, the more detail we see (Goodchild and Quattrochi 1997).
2.1 CONCEPT OF SCALE
Wu and Li (2006a) list three primary dimensions of scale, as stated earlier: time, space and organisational level (Figure 4A), being also the primary dimensions discussed in this work. The relationship between temporal and spatial scales is a fundamental part of the physical and ecological phenomena, and many characteristic scales are related in space versus time (ibid). Often the ratio between spatial and temporal scales is also likely to be relatively invariant over a range of scales21 (Blöschl and Sivapalan 1995). Moreover, large-sized events tend to have slower rates and lower frequencies, whereas smaller events are faster and more frequent (Wu and Li 2006a). However, not all the natural phenomena strictly obey the space-time correspondence principle, such as cyclic events (ibid). According to Rotmans (2002), there is also one more important scale referred to as functional scale. The functional scale is not, however, within the focus of the thesis and is discussed elsewhere (see e.g. Lebel et al. 2005; Cash et al. 2006; Lebel 2006; Keskinen 2008).
Several kinds of scales can be distinguished based on any of the three dimensions of scale (Figure 4B) (Wu and Li 2006a). Process scale22 is the scale on which a process actually operates, while observation scale is the scale at which sampling or measurement is taken (ibid). The spatial and temporal dimensions of an experimental system represent the experimental scale, and similarly, resolution and extent in space and time of statistical
2.1.1 Three-tiered conceptualisation of scale
21 This ratio is termed characteristic velocity (Blöschl and Sivapalan 1995)22 Wu and Li (2006a) use the term intrinsic scale. Process scale is adapted from Blöschl and Sivapalan (1995), as it better describes the definition used in this study.
13

14
Process scale(scale at which process operates)
Observed/inferredscale of phenomenon
Observation scale(scale of measurement and sampling)
Experimental scale(scale of experiments)
Analysis/Modelling scale(scale of analysis/modelling)
Policy scale(scale for policy making)
- time- space- organisational level
Grain: resolution, support, minimummapping unit (lx×ly)Extent: study area or time duration,geographic scale (Lx×Ly)Coverage: sampling densitySpacing: sample interval, lagCartographic scale: map scale
A: DIMENSIONS OF SCALE
B: KINDS OF SCALE
C: COMPONENTS OF SCALE
space
orga
nisa
tiona
l lev
el
time
phenomenon
Ly
Lx
ly
lx
analysis and dynamic model define the analysis scale and modelling scale (ibid). The policy scale, related to functional scale, refers to the scale for policy making within environmental management and planning and is influenced by a suite of economic, political and social factors (ibid).
Components of scale define more specific and measurable dimensions of scale (Figure 4C). The primary components include grain, extent, coverage, spacing, and cartographic scale (Wu and
Figure 4 A hierarchy of scale concepts: A) dimensions of scale; B) kinds of scale; and C) components of scale (Adapted from Wu and Li 2006a: 6).
Li 2006a). All the components are defined in Table 1 and, moreover, extent and resolution (grain) are discussed in more detail in a later section.
The dimensions of scale are mainly discussed within this Second Chapter in three contexts: large river basin, hydrological impact assessment, and Mekong case studies. Chapter 3 covers the process and observations scales from the kinds of scale category, while analysis/modelling scales are discussed in Chapter 4. Components of the
Spatio-temporal scales of hydrological impact assessment in large river basins: the Mekong case

15
• cumulative effect assessment (MacDonald 2000; Therivel and Ross 2007),
• environmental impact assessment (João 2000; Stewart-Oaten and Bence 2001; João 2002; Lebel 2006; Keskinen 2008),
• integrated assessment (Rotmans 2002; Rotmans and Rothman 2003), and
• strategic environmental assessment (João 2007a; 2007b).
There exists, however, rather extensive literature on the specific effects of scale in disciplines related to EIAs, and more precisely to the HIA discussed in this thesis, particularly hydrology and geomorphology (including sediment transportation). Scale issues have been discussed in many sub-fields of hydrology (Blöschl et al. 1997; Blöschl 2001), concentrating especially on topics such as
• modelling (Blöschl and Sivapalan 1995; Quinn 2004; Quinn et al. 2004),
• flood analysis (Blöschl and Sivapalan 1997; Robinson and Sivapalan 1997),
• watershed processes (Sivapalan 2003a; Sivapalan 2003b; Merz et al. 2006),
• scaling (Blöschl and Sivapalan 1995; Dooge and Bruen 1997; Blöschl 2001),
• rainfall analysis (Berndtsson and Niemczynowicz 1988; Woods 2004), and
• soil moisture (Merz and Plate 1997; Western and Blöschl 1999; Merz et al. 2006).
Scale issues concerning sediment dynamics have also been discussed in the literature (Church and Mark 1980; de Boer 1992; Schreier and Brown 2004) but not as extensively as within the hydrological discipline. Moreover, scales have been covered in disciplines other than mentioned above, related loosely to this study, such as sociology (Gibson et al. 2000; Evans et al. 2002) and archaeology (Stein and Linse 1993).
Scale issues have been one of the key research topics during the last decades in many disciplines of natural and social sciences. Scales have been extensively studied particularly in geography (e.g. Harvey 1969; Meentemeyer 1989) and ecology (e.g. Turner et al. 1989a; Wiens 1989; Allen and Hoekstra 1990; O’Neill et al. 1991; Levin 1992; Pickett and Cadenasso 1995). One of the major focuses of geographers is to describe and explain spatial patterns and relationships (Gibson et al. 2000). And as spatial phenomena come in different size classes, geographers have conducted analyses across many orders of spatial magnitude (Meentemeyer 1989). Spatial scales are therefore an issue of critical importance in many of the major sub-disciplines of geography (ibid), such as physical and human geography. Moreover, those sub-disciplines parallel most of the major disciplines across natural and social sciences (Gibson et al. 2000). Consequently, the major input for the ‘scale science’ originates from geography. Although the topics within ecology are diverse, scale issues are at the core of this discipline (Levin 1992). Through landscape ecology the scale issues became increasingly important to ecologists (Pickett and Cadenasso 1995), and are widely discussed also in hierarchy theory, population biology, and ecosystem and evolutionary ecology (O’Neill et al. 1989).
The importance of scale is particularly true for the impact assessment field which normally operates in multiple spatial and temporal scales. Actions and consequences, i.e. impacts, are often also occurring at different scales and levels. Even though the importance of scale in EIA has been recognized, the EIA literature only very rarely addresses the issue of scale and how the choice of scale(s) can affect the outcomes of impact assessment (João 2002). Nevertheless, there does exist some literature in different disciplines of IA covering scale issues, such as
2.1.2 Scale issues in the literature: IA context
process, observation and analysis/modelling scales are included in each chapter mentioned above.
2 Spatio-temporal scales and levels in hydrological impact assessment

16
Figure 5 Schematic illustration of A) increasing extent in landuse dataset over Tonle Sap delta area; and B) decreasing resolution23 in landuse dataset over Tonle Sap delta area24 from 1 km to 4 km increasing extent in landuse dataset over Tonle Sap delta area. The number of cells aggregated to form a new data unit is indicated by n; total area is indicated by a [km2]. Source: modified and applied from Turner et al. (1989b: 154) to Tonle Sap landuse dataset (JICA 1999).
Each earth observation has a small spatial dimension, defined as the limiting spatial resolution, the size of the smallest observable object, the pixel size, or some similarly defined parameter (Goodchild and Quattrochi 1997). Observation also has a large spatial dimension, defining the geographic extent of the study or data collection effort (ibid). Therefore, each scale has an extent and a resolution (Gibson et al. 2000; Rotmans 2002), being the two primary components of scale (Wu and Li 2006a).
The extent is the overall size or magnitude of the spatial or temporal dimension (see Table 1).
2.1.3 Extent and resolution
a = 16
n = 1 n = 4
a = 64
a = 576A) Increasing extent
B) Decreasing resolution (= increasing grain size)
In regard to space, extent may range from a few meters to millions of square kilometres. In regard to time, extent may vary between a second and many centuries or millennia. The extent of a measurement fixes the outer boundary of the measured phenomenon (Gibson et al. 2000) as illustrated in Figure 5. The resolution is the precision used in measurement or assessment. In regard to space, the resolutions can vary from meters to thousands of kilometres, and regarding time, resolution varies from one second or less (e.g. current meter) to years or centuries (geological formations)25.
23 Higher resolution means more image detail.24 A method based on medians has been used to combine the grid boxes.25 For example, the Tonle Sap hydrodynamic model (MRCS/WUP-FIN 2007) has a spatial extent of 51,156 km2 and a resolu-tion of 1 km by 1 km (261 × 196 grid cells). It has a temporal extent of around 1-10 years with a temporal spacing of 1-60 minutes, depending on the computation process in question (see Paper III).
Spatio-temporal scales of hydrological impact assessment in large river basins: the Mekong case

17
Levels are defined as units of assessment that are located at the same position on a scale (Gibson et al. 2000). Often levels are ordered hierarchically but not necessarily (Turner et al. 1989a). Level should not be confused with the scale class that is used to determine the different steps along the scale, such as international, national, community, and household. Here the term level is used to describe phenomena, or units of assessment, that are related to each other either hierarchically or non-hierarchically.
Phenomena occurring at any one level are affected by mechanisms occurring at the same level, and by levels below and above (Gibson et al. 2000). Thus, research on e.g. basin-wide impact assessment should examine the impacts from a multilevel perspective. In complex ecosystems, such as Tonle Sap Lake where the flood pulse is the key driver for the ecosystem productivity, cross-level (or cross-sectoral) assessment has been proposed to be used to assess the impacts (Lamberts 2008) instead of merely multi-level assessment. The cross-level assessment is needed to understand the important linkages between the levels. This is particularly essential in a flood pulse context (ibid).
2.1.4 Organisational Levels
Interaction may, and often does, occur within or across scales, leading to substantial complexity in dynamics (Cash et al. 2006). Cross-level interactions refer to interactions among levels within a scale, whereas cross-scale means interactions across different scales, for example, between spatial domains and jurisdictions (ibid). Multilevel is used to indicate the presence of more than one level, and multiscale the presence of more than one scale, but without implying that there are important cross-level or cross-scale interactions (ibid). The cross-level, cross-scale, multilevel and multiscale interactions are schematically illustrated in Figure 6. The multiscale issues are presented in the literature through practical case studies related to watershed modelling and management issues (see e.g. Quinn et al. 2004; Schreier and Brown 2004; Tchiguirinskaia et al. 2004).
2.1.5 Multiscale, multilevel, cross-scale, and
cross-level
Figure 6 Schematic illustration of cross-level, cross-scale, multilevel and multiscale interactions (modified from Cash et al. 2006). The more specific definitions of the terms can be found in the text.
Level:Scale:
Level:Scale:
Multi-Multi-
Cross-Multi-
Cross-Cross-
Single-Single-
Single-Multi-
Multi-Single-
Cross-Single-
Level
Sca
le
The connectivity between the scales is important when operating multiple scales, and particularly crucial for a cross-scale approach. The connectivity can occur to either direction: from larger to smaller
2.1.6 Connectivity between the scales
2 Spatio-temporal scales and levels in hydrological impact assessment

18
upscaling refers to transferring information from a given scale to a larger scale, whereas downscaling refers to transferring information to a smaller scale (Gupta et al. 1986: cited in Blöschl and Sivapalan, 1995). For example, upscaling is involved when estimating a 100 year flood from a 10 year period (Blöschl and Sivapalan 1995). A more general and widely accepted definition of scaling is the translation of information between or across spatial and temporal scales (Turner et al. 1989a; Blöschl and Sivapalan 1995; Wu and Li 2006a).
The scaling can be, however, extremely challenging. New patterns and processes may emerge when scale changes (Wu and Li 2006a). Furthermore, observations made at fine scale may miss important patterns and processes on a broader scale, and, respectively, observations at broader scale may not have enough details for fine scale dynamics (ibid). The spatial heterogeneity can further complicate the scaling process (ibid). Accordingly, errors are bound to occur in scaling, and therefore uncertainty analysis should form an integral part of the scaling (Heuvelink 1998; Wu et al. 2006b).
In spite of its importance and integral part of the environmental research, scaling is not within the domain of this thesis. Therefore, it is not analysed further within the HIA domain. It is, however, discussed in great detail in the literature related e.g. to impact assessment (Rotmans 2002; Rotmans and Rothman 2003), hydrology (Blöschl and Sivapalan 1995; Becker and Braun 1999; Blöschl 2001; Burger and Chen 2005) and ecology (Wiens 1989; Jones et al. 2006; Wu and Li 2006b; Wu and Li 2006a) .
Scaling is recognised to be an important part of research in ecology, hydrology and other similar disciplines (e.g. Blöschl and Sivapalan 1995; Rotmans 2002; Wu and Li 2006a). Scaling is inevitable in research and practice whenever predictions need to be made at a scale that is different from the scale where data are acquired (Wu and Li 2006a: 11).
Three principal terms are typically used when dealing with scaling issues: scaling-out, scaling-down and scaling-up. Scaling-out (also called regionalisation) is used to define spatial extrapolation of successful approaches to other sites with similar circumstances (Lovell et al. 2002). To scale literally means ‘to zoom’ or to reduce/increase in size. In a hydrological context,
2.1.7 Scaling
2.2 SPATIAL SCALE
The most studied scale26 is probably the geographical space or the spatial scale (Cash et al. 2006). Environmental, geophysical, and ecological phenomena occur over a continuous range of scales, although particular scales may be more important for particular processes (ibid).
scale or vice versa. When transferring information from one scale to another, for example discharge information from a basin-wide hydrological model to a sub-basin hydrodynamic model, it is important to take into account the different aspects of each scale, being either temporal or spatial ones. The boundary conditions between the scales, as used, for example, in dynamic models, need to be well addressed. One also needs to be aware that possible assumptions and simplifications from the source scale will be transmitted to the target scale through the boundary conditions.
Some examples of connectivity between the scales are presented below:
• Regional – basin/local/sub-basin: - Regional climate impacts on the basin - Possible water transfers • Basin – sub-basin/local: - Boundary conditions for hydrology, sediment, water quality, etc. - Direct impacts of changes• Local/tributary – sub-basin/basin: - Boundary conditions for hydrology, sediment, water quality, etc.
26 of spatial, temporal, jurisdictional, institutional, management, networks, and knowledge scales
Spatio-temporal scales of hydrological impact assessment in large river basins: the Mekong case

19
Large River Basins include a range of scales above and below the basin scale. Scales are usually determined by observer-dependent criteria (Allen and Starr 1982: cited by Turner et al., 1989a), and the scales must be appropriate for the phenomenon of interest (Turner et al. 1989a). Thus, in this work seven different spatial scales are recognised in the LRB context from local to global scale, as listed, defined, and summarised in Table 3, and illustrated in Figure 7.
Many of the scales overlap with each other, even within one river basin. This is natural as definitions of e.g. sub-basin28 and tributary29 vary greatly and thus spatial scales fall partly on the same area. It is difficult to give a precise description of the spatial scales and there is always variation on data and
2.2.1 Spatial scales: LRB context
27 A catchment cannot always be defined precisely, as many times e.g. the boundary for surface runoff is different from the one of groundwater 28 Sub-basin is defined here to be a part of the basin which can be easily defined based on the natural or administrative boundaries and still being an integral part of the whole basin. These are in the Mekong, for example, the Tonle Sap system (natural boundaries) and the Lower Mekong Basin (administrative boundaries – covering an area of the Mekong basin within Lao PDR, Thailand, Cambodia and Vietnam). This differs from the definition given by e.g. Water Words Dictionary (2008): “Sub-basin is (1) A portion of a subregion or basin drained by a single stream or group of minor streams. (2) The smallest unit into which the land surface is subdivided for hydrologic study purposes.”29 Tributary is defined here to be a stream or river, including its basin, which joins and contributes its water to another and larger stream or body of water
In this work the term spatial scale has two principal interrelated meanings pertaining to HIAs: scale as spatial extent of the assessment; and spatial resolution (amount of geographical detail). The two meanings are, however, related (João 2002). The spatial extent of the assessment will usually affect how detailed the assessment will be. That is, the assessment of the larger area, such as basin scale, cannot afford the same amount of details as a local scale (ibid).
Actions and consequences occur at various spatial scales. Therefore, it is important to define the spatial scales within the IA process. This is particularly important when defining the critical areas expected to be impacted and when selecting tools and methodologies to assess the possible consequences. Down- and/or upscaling of the results are frequently done in spatial space but it is argued by Blöschl (2001) that methods should be developed to identify dominant processes that control hydrological response in different environments and at different scales, that is, a multiscale approach should be used instead of scaling.
Spatial scales of IA can be defined on the basis of the natural or administrative boundaries. Spatial scales related to HIA, however, should not be based on administrative boundaries but rather on the natural ones. Those are, for example, basins, tributaries, sub-basins, etc. Regional and global scales are, however, often anchored in the combination of administrative and geographical boundaries as the basin is the largest scale that can usually be defined precisely based on the hydrological characteristics27.
The data and management, however, are often restricted to administrative boundaries by country or smaller borders. This is, fortunately, not the case in every LRB as various river basin organisations, such as the Nile River Basin Commission, Murray-Darling Basin Commission, Mekong River Commission, just to mention a few, are trying to bring together the data sets from the whole basin. Moreover, they are aiming to coordinate the management of the water resources over the whole basin, across administrative boundaries.
The following sections present the spatial scales from three different perspectives, naturally linked together: spatial scales in the LRB context, spatial scales in IA, and spatial scales in the Mekong case studies.
2 Spatio-temporal scales and levels in hydrological impact assessment

20
Scale classes Definition LRB context [×103 km2]
Mekong Basin [×103 km2]
Global Global scale is here defined to start from the largest continent being Asia (44,579×103 km2) reaching to area of the entire globe (510,072×103 km2).
44,579- 510,072 -
Continental Continental scale is here defined to start from the smallest continent of Australia + Oceania (7,687×103 km2) and reaching to area of the largest continent i.e. Asia (44,579×103 km2).
7,687 - 44,579 -
Regional Regional scale is more difficult to define precisely as the size of the LRB varies in one order of magnitude, and moreover the term regional can be defined in various ways. In this definition the area varies approximately from 1,000×103 km2 to 10,000×103 km2. In the Mekong case the area varies from Mainland Southeast Asia (1,940 km2) to the whole of Southeast Asia (4,523×103 km2) with Yunnan (China) (394×103 km2).
1,000 - 10,000 1,940 - 4,917
Basin Basin scale is defined to cover the LRBs (see Section 1.3.3)
500 - 6,121 816 a
Sub-basin Sub-basin scale again varies greatly depending on the LRB in question and, moreover, how sub-basin itself is defined. In this definition the area varies from approximately from 3×10³ km2 to 3,000×103 km2. In the Mekong (in this study) the sub-basin scale area varies from the Tonle Sap system (13.3×10³ km2) to the Lower Mekong Basin (LMB) (606×103 km2).
3 - 3,000 13.3 - 606
Tributary Tributary scale also has a very wide variation in its extent. The smallest area is here defined to be approximately 0.1×10³ km2 while the largest area is defined by Irtysh, tributary for the Ob River b, having an area of 1,673×103 km2. In the Mekong, the area varies from Phu Pa Huak (0.13×10³ km2) to Nam Mun (70.6×10³ km2), based on the MRC spatial database (Mekong River Commission 2006).
0.1 - 1,673 0.13 - 70.6
Local Local scale also varies depending on the definition. It is here defined to cover an area from nil to 1×10³ km2.
- 1 - 1 (0.6) c
a Area of the Mekong Basin varies depending on the source (Table 5). 816×103 km2 is based on the USGS (2001) data. b The Irtysh River (a tributary for Ob River) is the largest tributary of the world according to Wikipedia (2008a). For comparison, Amazon’s largest tributary, Madeira River, drains an area of 1,420×103 km2 (Bastos et al. 2006). c Area of the local scale case study (Vientiane-Nong Khai reach of the Mekong).
Table 3 Summary of the spatial scales in the LRB and Mekong River Basin context.
definitions. Thus, the definition presented here is just one attempt to organise the LRB related scales to one table and illustration. The description of the scales is partly based on the sizes of different water bodies based on different data sets, and partly on rational reasoning. Some of the scales have a very
wide range, particularly tributary and sub-basin scales which cover an area around three orders of magnitude. The spatial scales in the Mekong context are presented along with the more general LRB definitions in Table 3.
Spatio-temporal scales of hydrological impact assessment in large river basins: the Mekong case
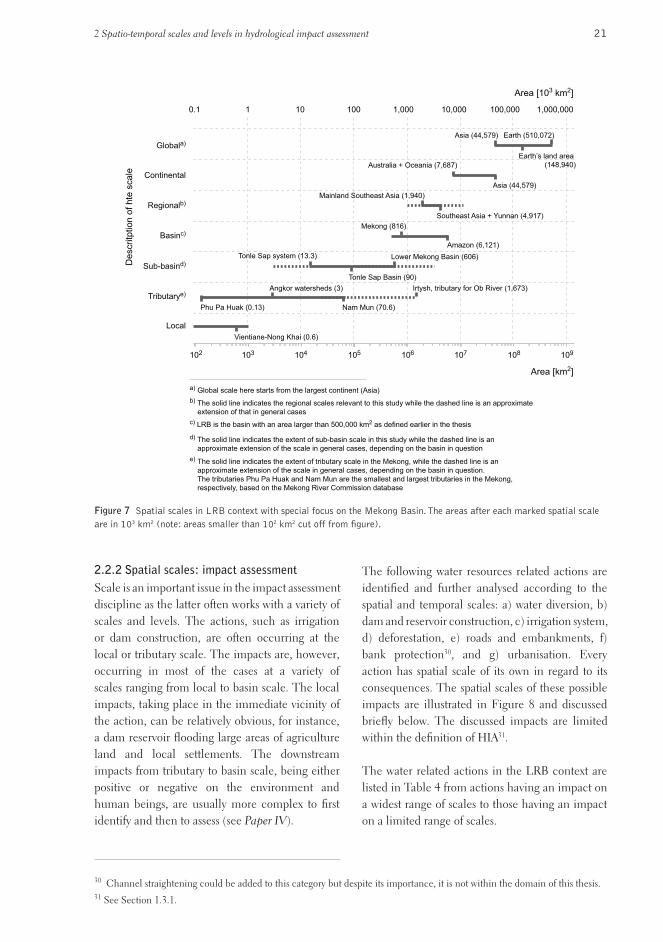
21
Figure 7 Spatial scales in LRB context with special focus on the Mekong Basin. The areas after each marked spatial scale are in 103 km2 (note: areas smaller than 102 km2 cut off from figure).
Scale is an important issue in the impact assessment discipline as the latter often works with a variety of scales and levels. The actions, such as irrigation or dam construction, are often occurring at the local or tributary scale. The impacts are, however, occurring in most of the cases at a variety of scales ranging from local to basin scale. The local impacts, taking place in the immediate vicinity of the action, can be relatively obvious, for instance, a dam reservoir flooding large areas of agriculture land and local settlements. The downstream impacts from tributary to basin scale, being either positive or negative on the environment and human beings, are usually more complex to first identify and then to assess (see Paper IV).
2.2.2 Spatial scales: impact assessment The following water resources related actions are identified and further analysed according to the spatial and temporal scales: a) water diversion, b) dam and reservoir construction, c) irrigation system, d) deforestation, e) roads and embankments, f) bank protection30, and g) urbanisation. Every action has spatial scale of its own in regard to its consequences. The spatial scales of these possible impacts are illustrated in Figure 8 and discussed briefly below. The discussed impacts are limited within the definition of HIA31.
The water related actions in the LRB context are listed in Table 4 from actions having an impact on a widest range of scales to those having an impact on a limited range of scales.
30 Channel straightening could be added to this category but despite its importance, it is not within the domain of this thesis.31 See Section 1.3.1.
10.1 10 100 1,000 10,000 100,000 1,000,000
Tributarye)
Local
Continental
Sub-basind)
Basinc)
Regionalb)
Area [km2]
Area [103 km2]
Des
critp
tion
of h
te s
cale
Amazon (6,121)
Southeast Asia + Yunnan (4,917)
Australia + Oceania (7,687)
Mekong (816)
Lower Mekong Basin (606) Tonle Sap system (13.3)
Angkor watersheds (3) Irtysh, tributary for Ob River (1,673)Tonle Sap Basin (90)
Nam Mun (70.6)Phu Pa Huak (0.13)
a) Global scale here starts from the largest continent (Asia)b) The solid line indicates the regional scales relevant to this study while the dashed line is an approximate
extension of that in general cases
e) The solid line indicates the extent of tributary scale in the Mekong, while the dashed line is an approximate extension of the scale in general cases, depending on the basin in question. The tributaries Phu Pa Huak and Nam Mun are the smallest and largest tributaries in the Mekong, respectively, based on the Mekong River Commission database
d) The solid line indicates the extent of sub-basin scale in this study while the dashed line is an approximate extension of the scale in general cases, depending on the basin in question
c) LRB is the basin with an area larger than 500,000 km2 as defined earlier in the thesis
Vientiane-Nong Khai (0.6)
Mainland Southeast Asia (1,940)Asia (44,579)
Globala)
Earth’s land area (148,940)
Earth (510,072)Asia (44,579)
102 103 104 105 106 107 108 109
2 Spatio-temporal scales and levels in hydrological impact assessment

22
Figure 9 Illustration of the spatial scales of the case studies.
Tributary
Local
Global
Sub-basin
Basin
Regional
Area [km2]
De
scritp
tio
n o
f h
te s
ca
le
102 1031 101 104 105 106 107
SUB-BASIN: TLS floodplain (13,300)
REGIONAL: Mainland Southeast Asia + main river basins (2,674,100)
BASIN: Mekong (816,000)
TRIBUTARY: Angkor watersheds (2,850)
LOCAL: Vientiane-Nong Khai (600)0)0)0))))0)0)))))0)
Figure 8 Spatial scales of the possible hydrological impacts due to variation of actions (note: areas smaller than 102 km2 cut off from the fi gure).
T r i b u t a r y
L o c a l Global
Water diversion
Dam and reservoir
Irrigation system
Deforestation
Roads and embankments
Bank protection
Urbanisation
S u b - b a s i n
B a s i n
R e g i o n a l
Area [km2]
102 103 104 105 106 107
The Mekong case studies cover altogether fi ve of the seven spatial scales presented above: regional, basin, sub-basin, tributary, and local scales. The impacts are assessed by using a variety of tools and methods as discussed in more detail in Chapter 4. The appended papers present the results of these case studies. The scales with a map and the approximate area of each case study are presented in Figure 9.
2.2.3 Spatial scales: Mekong case studies The spatial scales of the Mekong region study are presented in more detail below with detailed illustrations and location of each studied scale.
The extent of the regional scale case study is presented in Figure 10. The regional scale includes the Mainland Southeast Asian countries: Cambodia, Laos, Myanmar, Thailand and Vietnam; and the areas within the large and intermediate river basins in China (Irrawaddy, Salween, Chao
Spatio-temporal scales of hydrological impact assessment in large river basins: the Mekong case
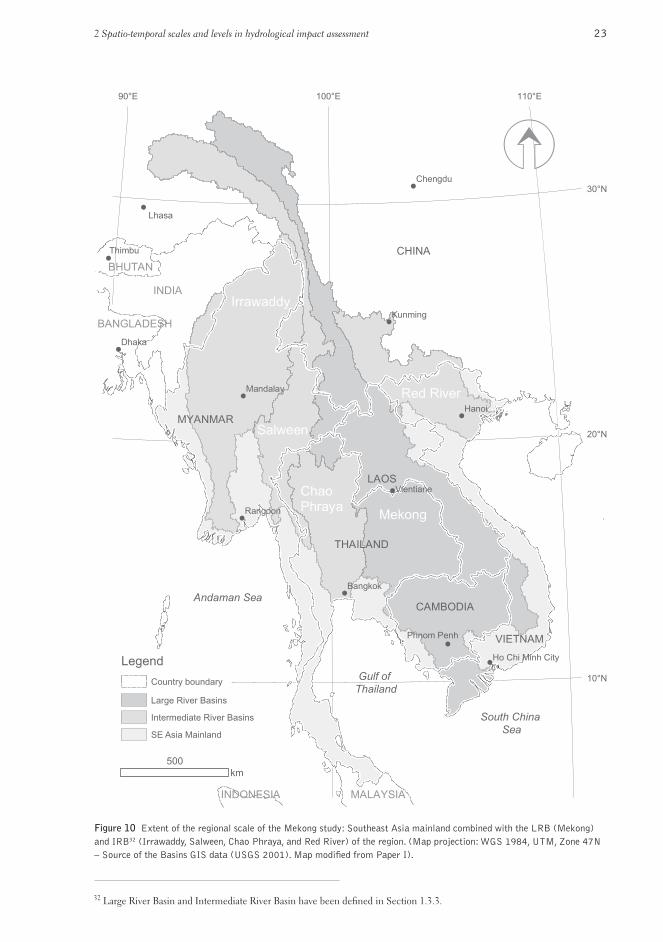
23
Figure 10 Extent of the regional scale of the Mekong study: Southeast Asia mainland combined with the LRB (Mekong) and IRB32 (Irrawaddy, Salween, Chao Phraya, and Red River) of the region. (Map projection: WGS 1984, UTM, Zone 47N – Source of the Basins GIS data (USGS 2001). Map modified from Paper I).
LegendCountry boundary
Large River Basins
Intermediate River Basins
SE Asia Mainland
THAILAND
INDIA
LAOS
VIETNAM
MYANMAR
CAMBODIA
BANGLADESH
BHUTAN
MALAYSIAINDONESIA
Hanoi
Dhaka
Bangkok
Rangoon
Kunming
Chengdu
Mandalay
Vientiane
Phnom Penh
Ho Chi Minh City
CHINAThimbu
Lhasa
110°E100°E90°E
30°N
20°N
10°N
500km
Salween
Chao Phraya Mekong
Red River
Irrawaddy
South China Sea
Gulf of Thailand
Andaman Sea
32 Large River Basin and Intermediate River Basin have been defined in Section 1.3.3.
2 Spatio-temporal scales and levels in hydrological impact assessment
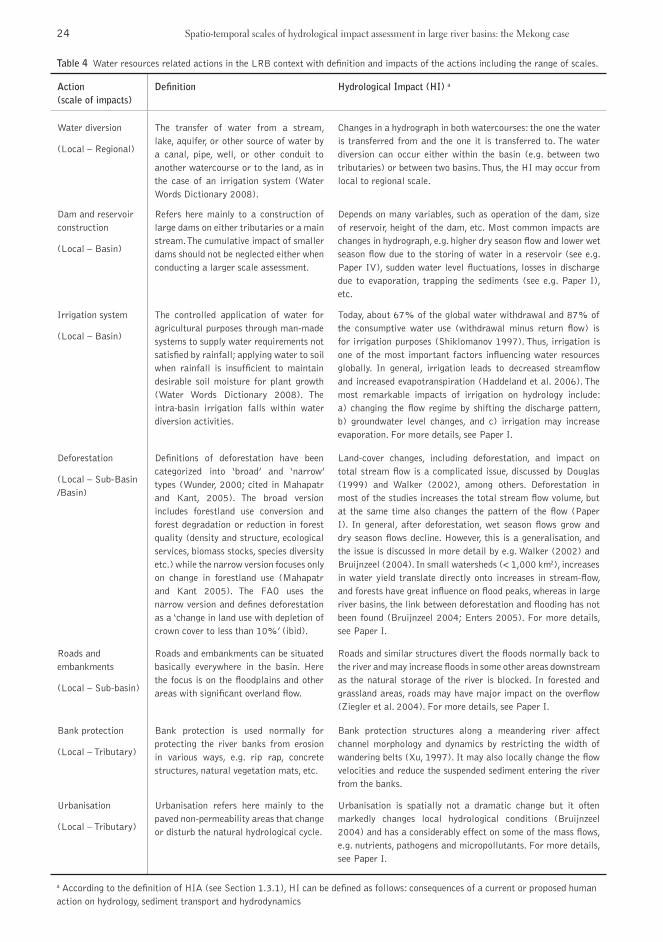
24
Action (scale of impacts)
Definition Hydrological Impact (HI) a
Water diversion
(Local – Regional)
The transfer of water from a stream, lake, aquifer, or other source of water by a canal, pipe, well, or other conduit to another watercourse or to the land, as in the case of an irrigation system (Water Words Dictionary 2008).
Changes in a hydrograph in both watercourses: the one the water is transferred from and the one it is transferred to. The water diversion can occur either within the basin (e.g. between two tributaries) or between two basins. Thus, the HI may occur from local to regional scale.
Dam and reservoir construction
(Local – Basin)
Refers here mainly to a construction of large dams on either tributaries or a main stream. The cumulative impact of smaller dams should not be neglected either when conducting a larger scale assessment.
Depends on many variables, such as operation of the dam, size of reservoir, height of the dam, etc. Most common impacts are changes in hydrograph, e.g. higher dry season flow and lower wet season flow due to the storing of water in a reservoir (see e.g. Paper IV), sudden water level fluctuations, losses in discharge due to evaporation, trapping the sediments (see e.g. Paper I), etc.
Irrigation system
(Local – Basin)
The controlled application of water for agricultural purposes through man-made systems to supply water requirements not satisfied by rainfall; applying water to soil when rainfall is insufficient to maintain desirable soil moisture for plant growth (Water Words Dictionary 2008). The intra-basin irrigation falls within water diversion activities.
Today, about 67% of the global water withdrawal and 87% of the consumptive water use (withdrawal minus return flow) is for irrigation purposes (Shiklomanov 1997). Thus, irrigation is one of the most important factors influencing water resources globally. In general, irrigation leads to decreased streamflow and increased evapotranspiration (Haddeland et al. 2006). The most remarkable impacts of irrigation on hydrology include: a) changing the flow regime by shifting the discharge pattern, b) groundwater level changes, and c) irrigation may increase evaporation. For more details, see Paper I.
Deforestation
(Local – Sub-Basin /Basin)
Definitions of deforestation have been categorized into ‘broad’ and ‘narrow’ types (Wunder, 2000; cited in Mahapatr and Kant, 2005). The broad version includes forestland use conversion and forest degradation or reduction in forest quality (density and structure, ecological services, biomass stocks, species diversity etc.) while the narrow version focuses only on change in forestland use (Mahapatr and Kant 2005). The FAO uses the narrow version and defines deforestation as a ‘change in land use with depletion of crown cover to less than 10%’ (ibid).
Land-cover changes, including deforestation, and impact on total stream flow is a complicated issue, discussed by Douglas (1999) and Walker (2002), among others. Deforestation in most of the studies increases the total stream flow volume, but at the same time also changes the pattern of the flow (Paper I). In general, after deforestation, wet season flows grow and dry season flows decline. However, this is a generalisation, and the issue is discussed in more detail by e.g. Walker (2002) and Bruijnzeel (2004). In small watersheds (< 1,000 km2), increases in water yield translate directly onto increases in stream-flow, and forests have great influence on flood peaks, whereas in large river basins, the link between deforestation and flooding has not been found (Bruijnzeel 2004; Enters 2005). For more details, see Paper I.
Roads and embankments
(Local – Sub-basin)
Roads and embankments can be situated basically everywhere in the basin. Here the focus is on the floodplains and other areas with significant overland flow.
Roads and similar structures divert the floods normally back to the river and may increase floods in some other areas downstream as the natural storage of the river is blocked. In forested and grassland areas, roads may have major impact on the overflow (Ziegler et al. 2004). For more details, see Paper I.
Bank protection
(Local – Tributary)
Bank protection is used normally for protecting the river banks from erosion in various ways, e.g. rip rap, concrete structures, natural vegetation mats, etc.
Bank protection structures along a meandering river affect channel morphology and dynamics by restricting the width of wandering belts (Xu, 1997). It may also locally change the flow velocities and reduce the suspended sediment entering the river from the banks.
Urbanisation
(Local – Tributary)
Urbanisation refers here mainly to the paved non-permeability areas that change or disturb the natural hydrological cycle.
Urbanisation is spatially not a dramatic change but it often markedly changes local hydrological conditions (Bruijnzeel 2004) and has a considerably effect on some of the mass flows, e.g. nutrients, pathogens and micropollutants. For more details, see Paper I.
Table 4 Water resources related actions in the LRB context with definition and impacts of the actions including the range of scales.
a According to the definition of HIA (see Section 1.3.1), HI can be defined as follows: consequences of a current or proposed human action on hydrology, sediment transport and hydrodynamics
Spatio-temporal scales of hydrological impact assessment in large river basins: the Mekong case
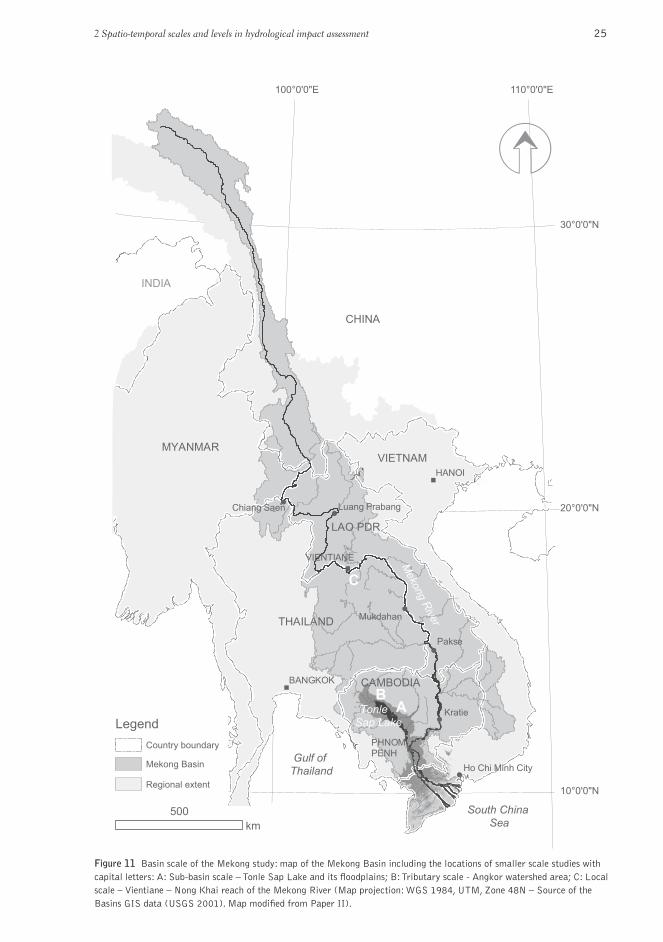
25
Figure 11 Basin scale of the Mekong study: map of the Mekong Basin including the locations of smaller scale studies with capital letters: A: Sub-basin scale – Tonle Sap Lake and its floodplains; B: Tributary scale - Angkor watershed area; C: Local scale – Vientiane – Nong Khai reach of the Mekong River (Map projection: WGS 1984, UTM, Zone 48N – Source of the Basins GIS data (USGS 2001). Map modified from Paper II).
LAO PDR
VIETNAMMYANMAR
CAMBODIA
HANOI
Pakse
Kratie
BANGKOK
Mukdahan
VIENTIANE
PHNOM PENH
Chiang Saen Luang Prabang
Ho Chi Minh City
Legend
Country boundary
Mekong Basin
Regional extent
110°0'0"E100°0'0"E
30°0'0"N
20°0'0"N
10°0'0"N
500
km
Tonle
Sap Lake
Meko
ng R
iver
South China
Sea
Gulf of
Thailand
CHINA
THAILAND
AB
C
INDIA
2 Spatio-temporal scales and levels in hydrological impact assessment

26
Source Basin area [km2]
Fekete et al. (1999) 773,728
Global Runoff Data Centre (2007) 787,256
Stahl (2007) 787,776
Mekong River Commission (2005) 795,000
World Resources Institute (2006) a 801,870
Water Resources eAtlas (2003) 805,604
Mekong River Commission (2006) b 809,681
Zhou and Guan (2001) 810,000
USGS (2001) – see Figure 11 812,576
a Calculated from the GIS polygon layers of the world river basinsb Calculated from the Mekong basin GIS polygon layer provided by MRC spatial databases
Table 5 List of the different sources and basin areas of the Mekong.
Phraya, Mekong and Red River). The total area of the region is 2,674,100 km2 while the area of the administrative area of the countries is 1,925,300 km2 (Paper I). The total area of the river basins is 1,811,000 km2. Thus, around 55% of the mainland area is within the basins. More detailed description of the area can be found in Paper I.
The basin scale extent is presented in Figure 11. That covers the entire Mekong Basin. The Mekong is the largest river in Southeast Asia and its basin is shared by six countries (from upstream): China, Myanmar, Lao PDR, Thailand, Cambodia and Vietnam. The area of the Mekong Basin varies depending on the source from 773,728 km2
to 815,771 km2 (Table 5). The large variation of the surface areas is probably down to the different datasets, definitions, and resolution used in each study. The length of the Mekong varies greatly depending on the source (Liu et al. 2007)33 . Based on the most recent research the length is 4,909 km (ibid). A more explicit description of the Mekong Basin can be found in Paper II.
The extent of the sub-basin scale case study is Tonle Sap Lake and its floodplains (Figure 12), referred to in this work as the Tonle Sap system. Tonle Sap Lake in Cambodia is the largest permanent freshwater body in Southeast Asia. With its associated floodplains and those of the Mekong mainstream located downstream of Kratie (for location see Figure 11), lies the most extensive wetland habitat in the Mekong basin. The area of Tonle Sap Lake, i.e. the permanent water body, is 2,300 km2 with a water level of 1.44 m AMSL (above mean sea level) in Hatien, Vietnam (Paper IV). The Tonle Sap floodplain covers on average 11,000 km2 (ibid). Thus the total area of the Tonle Sap system is, on average34, 13,300 km2. A more precise description of the area can be found in Papers III, IV and V.
The tributary scale covers the three tributaries named Puok, Siem Reap and Roluos forming the Angkor study area with a coverage of 2,849 km2 (Figure 13). Originally this area had only two watersheds, Puok and Roluos, but was divided
33 According to Liu et al. (2007) the length of the Mekong varied in the literature, before the work compiled by Liu et al. (2007), between 4,000 km and 4,880 km.34 The annual maximum water level varied from 6.86 m AMSL to 10.36 m AMSL during the hydrological years 1997-2005,
resulting in variation in the inundated area (with permanent lake area) between 9,637 km2 and 15,278 km2 (Paper IV).
Spatio-temporal scales of hydrological impact assessment in large river basins: the Mekong case

27
35 From the 9th to 15th century of the Common Era. 36 Kilometres from the mouth of the Mekong River in Vietnam.37 Process scale refers to the scale on which a process actually operates; it is defined in more detail in Section 3.1.
Figure 12 Sub-basin scale of the Mekong study: map of the Tonle Sap system, including the permanent lake, Tonle Sap River NNW from Prek Kdam and inundated area NW from the dashed line crossing the floodplain at Prek Kdam. (Map projection: WGS 1984, UTM, Zone 48N – Source of the GIS data: Mekong River Commission (2006). Map modified from Paper III).
Prek Kdam
Siem Reap
Battambang
Kampong Thom
Kampong Luong
Kampong Chhnang
PHNOM PENH
105°0'0"E104°0'0"E103°0'0"E
13°0'0"N
12°0'0"N
50
km
Rivers
Permanent water
Floodplain
Country boundary
Tonle Sap
Lake
Tonle
Sap R
iver
Mekong
Study area boundary
into three through the extensive human impact on natural hydrology during the Angkor era35. A portion of the study area falls under the floodplain of Tonle Sap Lake. A more detailed description of the area can be found in Paper VI.
The local scale case study area is located at the Vientiane – Nong Khai reach of the Mekong mainstream (Figure 14; see location in Figure 11). The river there forms the border between Thailand and Lao PDR. The total length of the studied river section is 49 km and is located between km 1544 and km 159336. The total area of the study area is approximately 600 km2. A more specific description of the area can be found in Paper VII.
2.3 TEMPORAL SCALES
Temporal scales are a focal part of the IA study together with spatial scales. This is particularly the case within the CIA study when the impact of various developments, occurring at different times,
is assessed (Keskinen 2008). The temporal scales also play a central role in data issues – both data collection and data analysis. The process scales37 do not, however, always follow the temporal scales based on the human-developed concept of time. The processes may be episodic (e.g. rainfall), cyclical (e.g. rainy season), stochastic with a certain recurrence interval (e.g. a 1-in-10 year flood occurrence), short-term (e.g. stream flow), or continual (e.g. groundwater movement) (Lovell et al. 2002). Thus, the observation scale and phenomena studied should match the scale at which the processes are taking place (ibid). One of the challenges related to temporal scales is that often the processes are observed and modelled at short-time scales, but estimates are needed for very long time-scales, such as the life time of a dam (Blöschl and Sivapalan 1995).
Over time, change within natural systems occurs at different rates (Holling 1993). Slow change is cumulative (e.g. accumulation of human
2 Spatio-temporal scales and levels in hydrological impact assessment

28
Figure 14 Local scale of the Mekong study: Map of the Vientiane – Nong Khai reach of the Mekong. (Map projection: WGS 1984, UTM, Zone 48N – Source of the GIS data: Mekong River Commission (1992; 2006). Map modified from Paper VII).
102°45'0"E102°40'0"E102°35'0"E102°30'0"E
18°0'0"N
17°55'0"N
17°50'0"N
Vientiane port
Water
Legend
Road
Mekong River
Nong Khai
Vientiane LAO PDR
THAILAND
10km
Figure 13 Tributary scale of the Mekong study: map of the Angkor study area, including the higher plane and floodplain. (Map projection: WGS 1984, UTM, Zone 48N – Source of the GIS data: Mekong River Commission (2006) and Evans et al. (2007). Map modified from Paper VI).
104°10'0"E104°0'0"E103°50'0"E103°40'0"E
13°40'0"N
13°30'0"N
13°20'0"N
Tonle Sap Lake
Kulen Hills
70 m AMSL
10
km
300 m AMSL
Puok Rive
r
Sie
m R
eap R
iver
Rolu
os R
iver
Constructed canals
Permanent water
Floodplain
Study area
Rivers
Spatio-temporal scales of hydrological impact assessment in large river basins: the Mekong case
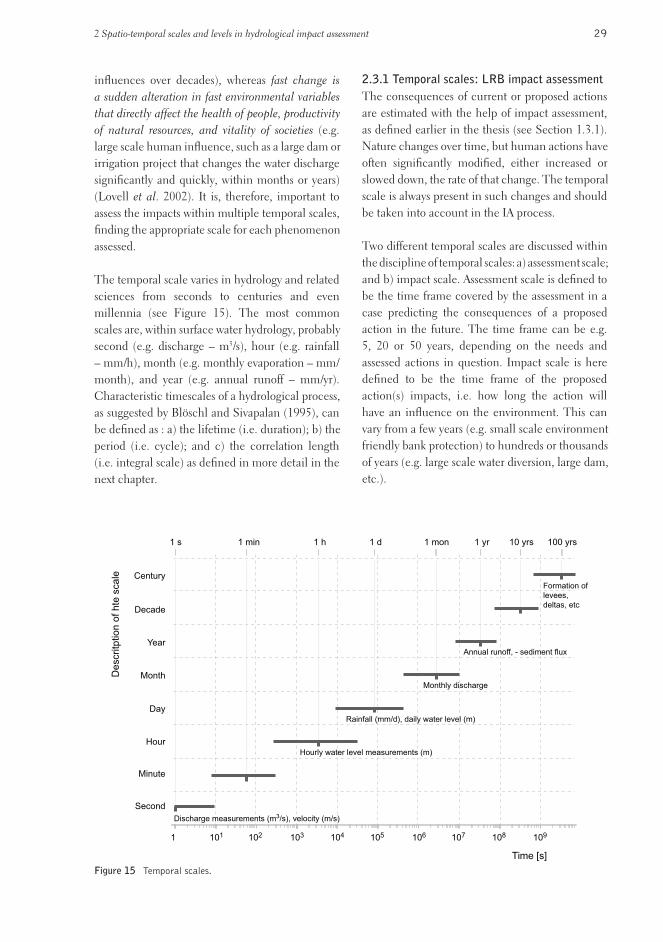
29
Figure 15 Temporal scales.
101 102 103 104 105 106 107 108 1091
1 min1 s 1 h 1 d 1 mon 1 yr 10 yrs 100 yrs
Hour
Minute
Second
Decade
Century
Day
Month
Year
Time [s]
Descritp
tion o
f hte
scale
Rainfall (mm/d), daily water level (m)
Monthly discharge
Annual runoff, - sediment flux
Formation of
levees,
deltas, etc
Hourly water level measurements (m)
Discharge measurements (m3/s), velocity (m/s)
influences over decades), whereas fast change is a sudden alteration in fast environmental variables that directly affect the health of people, productivity of natural resources, and vitality of societies (e.g. large scale human influence, such as a large dam or irrigation project that changes the water discharge significantly and quickly, within months or years) (Lovell et al. 2002). It is, therefore, important to assess the impacts within multiple temporal scales, finding the appropriate scale for each phenomenon assessed.
The temporal scale varies in hydrology and related sciences from seconds to centuries and even millennia (see Figure 15). The most common scales are, within surface water hydrology, probably second (e.g. discharge – m3/s), hour (e.g. rainfall – mm/h), month (e.g. monthly evaporation – mm/month), and year (e.g. annual runoff – mm/yr). Characteristic timescales of a hydrological process, as suggested by Blöschl and Sivapalan (1995), can be defined as : a) the lifetime (i.e. duration); b) the period (i.e. cycle); and c) the correlation length (i.e. integral scale) as defined in more detail in the next chapter.
The consequences of current or proposed actions are estimated with the help of impact assessment, as defined earlier in the thesis (see Section 1.3.1). Nature changes over time, but human actions have often significantly modified, either increased or slowed down, the rate of that change. The temporal scale is always present in such changes and should be taken into account in the IA process.
Two different temporal scales are discussed within the discipline of temporal scales: a) assessment scale; and b) impact scale. Assessment scale is defined to be the time frame covered by the assessment in a case predicting the consequences of a proposed action in the future. The time frame can be e.g. 5, 20 or 50 years, depending on the needs and assessed actions in question. Impact scale is here defined to be the time frame of the proposed action(s) impacts, i.e. how long the action will have an influence on the environment. This can vary from a few years (e.g. small scale environment friendly bank protection) to hundreds or thousands of years (e.g. large scale water diversion, large dam, etc.).
2.3.1 Temporal scales: LRB impact assessment
2 Spatio-temporal scales and levels in hydrological impact assessment

30
38 See Table 4 for a detailed definition of each group of actions.39 Despite the importance of the subject of restorable and non-restorable impacts it is not within the domain of the thesis and thus, it is not analysed neither discussed further.
Table 6 Water resources related actions in the LRB context with definition and impacts of these actions including the range of scales.
Action Temporal impact scale Remarks
Water diversion - centuries-millenniums Impacts of a large scale water diversion project can last for a very long time, from centuries to even millenniums. The temporal impact scale depends on the spatial scale, technology used for the diversion, and other factors. An example of a rather small scale water diversion project having a long term impact is given in Paper VI.
Dam and reservoir construction
- centuries Large dam project impacts have a very long life-span and may last for centuries or even more. There are, however, various dam removal projects particularly in Northern America and Europe. These kinds of projects will, naturally, shorten the timescale of the impacts. Silting up of a dam reservoir may also shorten the lifespan of a dam.
Irrigation system - decades Irrigation projects do not necessarily include large scale infrastructure, except the possible irrigation channels and irrigation reservoirs. Thus, depending on the type and life-time of the project, the impacts may last from a few to several decades or even centuries in a large scale project.
Deforestation - decades-centuries Deforestation may change the land cover for decades or centuries, depending on the new land use of the area and ecological zone.
Roads and embankments
- decades-centuries Roads, particularly major ones, are a result of long-term planning and thus, the impacts are there for several centuries. Smaller roads and paths may impact hydrology only for some decades.
Bank protection - decades-centuries Depending on the bank protection method used, the impacts may last from decades to even centuries.
Urbanisation - centuries Urban areas, as roads, are normally planned to be there for centuries, in one way or another. Thus, the duration of the impacts is counted in terms of centuries.
Each project within the group of actions38 (e.g. irrigation system) is unique and conducted in diverse ecosystems and environments. Therefore, it is nearly impossible to define the definite temporal impact scale for any of the group of actions. Additionally, even though an action would be cancelled (e.g. dam removed), only some of the impacts are restorable while others are non-restorable39. It is, nevertheless, necessary to illustrate the order of magnitude of each group’s impact scale (Figure 16). The temporal impact
scales of each group are then briefly discussed and commented in Table 6.
The temporal scales in the Mekong case studies vary from some millenniums into the past to some decades into the future. The temporal scales have, therefore, been divided into three categories:
a) Past: from hundreds to thousands of years before present
2.3.2 Temporal scales: Mekong case studies
Spatio-temporal scales of hydrological impact assessment in large river basins: the Mekong case

31
Figure 16 Temporal scales of the possible hydrological impacts due to variation of actions.
Water diversion
Dam and reservoir
Irrigation system
Deforestation
Roads and embankments
Bank protection
Urbanisation
Time [s]
106 107 108 109 1010 1011
1 mon 1 yr 10 yrs 1000 yrs100 yrs
Figure 17 Temporal scales of the Mekong case studies.
-103 -102 -101 Present
Present
Present
Present & future
Past, present & future
Past & present
101 102
Time [yr]
Angkor
Vientiane - Nong Khai
Tonle Sap Lake
Sediment trapping in China
Land cover changes
b) Present: from early 20th century to present; defined by the spatial and time series data typically available for e.g. hydrological analysis.
c) Future: 5-80 years; defined by the most commonly used time-frames in the Mekong-related impact assessments.
The temporal scales of each Mekong case study are illustrated in Figure 17, including the categories of each study. The Tonle Sap studies have the longest
40 Palaeontological studies have been conducted and presented by Penny et al. (2005), and summarised in Paper V.41 See Paper IV.
time frame including all the three categories from the past (palaeontological studies40), through the present (e.g. present flood characteristics of the lake) to the future (e.g. predictions of future flood characteristics based on CIA studies made for the basin41). Two case studies (Paper I and Paper VII) include only the present temporal scale, mostly analysing the phenomena and discussing them to some extent into the future. The basin-wide case study includes both present and future aspects, while within the Angkor study past and present scales are used.
2 Spatio-temporal scales and levels in hydrological impact assessment

32
2.4 SPATIO-TEMPORAL SCALES According to Sadler (1996), the cumulative impact assessment estimates the consequences of a number of projects and activities combined within a time and space framework. Therefore it is essential to discuss the two dimensions of scales, time and space, together as spatio-temporal scales. This is crucially important within the CIA domain and therefore also within the HIA discipline.
The spatial and temporal scales were briefly introduced and discussed separately in previous sections. In this section the scales will be presented together as they should be taken into account within an assessment process.
Figure 18 Spatio-temporal scales of the consequences of human actions in a LRB.
104 105 106 107 108 109
Time [s]
Tributary
LocalG
lobalS
ub-basinB
asin
Regional
102
103
104
105
106
107
108A
rea
[km
2 ]
1 d 1 mon 1 yr 10 yrs 100 yrs
Water diversion
DamIrrigation
Deforestation
Roads and embankments
Bank protectionUrbanisation
The spatial and temporal scales of the LRB impacts were presented in the previous sections (see Sections 2.2.2 and 2.3.1, accordingly). As mentioned above, each project within the same group of actions is unique and conducted in different ecosystems and environments. Therefore, it is impossible to define the exact spatio-temporal impact scale for the impacts. The indicative spatio-temporal scales of the action impacts are illustrated in Figure 18.
2.4.1 Spatio-temporal scales:
LRB impact assessment The spatial and temporal scales in the Mekong case studies are presented in the previous sections (see Sections 2.2.3 and 2.3.2, respectively). As for spatial scale, the case studies represent altogether five classes: regional, basin, sub-basin, tributary, and local. As for temporal scale, three classes are identified: past, present and future. The combination of these two scales is presented in Figure 19.
2.4.2 Spatio-temporal scales:
Mekong case studies
Each of the actions has a slightly different spatio-temporal scale form. There is, however, one unifying feature in all of them; over smaller spatial scales (local-tributary) the impacts may occur on shorter time scales (of the order of hours) while over larger spatial scales, they may occur over a longer period of time (of the order of days or weeks). One example is operation of a dam that may lead to sudden water level fluctuations close to the dam while the impacts further downstream are happening over a longer time-span. This can be compared with the characteristic velocity of the hydrological processes as presented by Blöschl and Sivapalan (1995).
Spatio-temporal scales of hydrological impact assessment in large river basins: the Mekong case

33
2.5 LEVELS IN THIS STUDY
The levels of this study are based on the IA sectors that are assessed within the domain of the thesis, being a) hydrology, b) hydrodynamics, and c) sediment transportation. The levels and their linkages are schematically illustrated in Figure 20. The levels are partly hierarchical as hydrodynamics is dependent on the hydrological conditions, and likewise hydrodynamics has an influence on the sediment transportation. There are, naturally, much more complex linkages between the levels and many more factors impact each of the scales and there is no intention to build a complete flow chart of the linkages but rather to give an idea of the possible linkages between the levels. In the following chapters these levels are used to categorise the data and tools used for the assessment.
2.6 CONNECTIVITY BETWEEN THE SCALES
IN THE MEKONG CASE STUDIESIn the Mekong case studies the connectivity between the scales has been an issue in some of them, particularly in the sub-basin case study in Tonle Sap Lake. The Tonle Sap model (see Paper III) is connected to the basin scale through the boundary conditions in the Tonle Sap River, derived from basin-wide hydrological information,
and to the tributary scale through the boundary conditions in the main tributaries of the lake. In Paper IV the basin scale hydrological impacts are connected to sub-basin scale impacts through time series and spatial GIS analysis. The Tonle Sap is, to some extent, also directly connected to the global scale as the foreseen sea level rise in the South China Sea may possibly have an impact on its water levels.
In the basin scale study (Paper II) the local impacts of sediment trapping are connected to basin-wide geomorphological consequences. The impacts of basin scale changes on bank erosion at local scale are briefly discussed in Paper VII.
Figure 19 Spatio-temporal scales of the Mekong case studies.
-103 -102 -101 Present 101 102
Time [yr]
Trib
uta
ry
Local
Glo
bal
Sub-b
asin
Ba
sin
Regio
nal
102
103
104
105
106
107
108
Are
a [km
2]
Angkor
Vientiane - Nong Khai
Tonle Sap Lake
Sediment trapping in China
Land cover changes
2 Spatio-temporal scales and levels in hydrological impact assessment

34
Figure 20 Schematic and simplified illustration of the levels of this study and possible relations with the next levels in the EIA process.
Hydrology
Hydrodynamics
Sediment transport
Flood pulse
Nutrients
Other factors
Aquatic ecosystems
Ecosystem productivity
Fisheries
Other factors
Other factors
Other factors
Livelihoods
Other factors
Other factors
Other factors
Other factors
LEVELS OF
THIS STUDY
Spatio-temporal scales of hydrological impact assessment in large river basins: the Mekong case

3 SCALE ISSUES RELATED TO DATA AND FIELD WORK
“Ideally, processes should be observed at the scale they occur.”
Blöschl and Sivapalan (1995: 256)
Hydrologic data are needed to measure fluxes and reservoirs in the hydrologic cycle and to monitor hydrologic change over a variety of temporal and spatial scales (Dozier 1992). Within data issues, scale can be viewed from two perspectives: process scale42 that is the scale that natural phenomena exhibit, and observation scale43 that depends upon how one measures the phenomena (Blöschl and Sivapalan 1995). To get a best result, processes should be observed at the scale they occur (ibid: 256). Therefore, effective scale detection requires that the scale of analysis is commensurate with the process scale of the phenomenon under study (Blöschl and Sivapalan 1995; Wu and Li 2006a).
Processes larger than the extent of observation appear as trends or constants in the measurements; and processes smaller than the grain size of observation become noise in the data (Figure 21) (Blöschl and Sivapalan 1995; Wu and Li 2006a). Therefore, the choice of a scale for measurements, analysis and modelling in terms of grain size and extent directly influences whether or not the intrinsic pattern and scale of a phenomenon can be revealed in the final analysis (ibid). In general, resolution (or grain size) of sampling should be smaller than the spatial or temporal dimension of structures of patterns of interest, whereas the sampling extent should be at least as large as the extent of the phenomenon under study (Dungan et al. 2002; Wu and Li 2006a). Because often the process scale is unknown, multiple observations at different scales are usually necessary (Wu and Li 2006a).
35
Blöschl (2001) argues that space-time arrangement of the sampling is a key limitation of process understanding in hydrology. Therefore, the characteristic scales of the sampling will also have to be considered and, in a similar vein, the scales at which the predictions are needed (i.e. model scale). For IA modelling, choices about scales, levels, extent, and resolution affect what kind of data are collected, how these data are calibrated, what data can be used for validation, and what are the basic units that can be used in a model of a process (Evans et al. 2002). It is, therefore, important to distinguish between how scale issues relate to data collection versus data representation and how scale-related terminology refers to both areas. This has been done, relating to HIA, in the following sections.
Changing the scale of data without first understanding the effects of such action can result in the representation of processes or patterns that are different from those intended (Lam et al. 1996). It is, thus, widely recognized that environmental measurements cannot be scaled up directly (Beven 1989). Scaling44 issues related to the data, however, are not within the domain of this work and thus, will not be discussed in detail as they have been discussed extensively in the literature (e.g. Blöschl and Sivapalan 1995; Blöschl 2001; Evans et al. 2002; Rotmans 2002; Jones et al. 2006; Wu and Li 2006b; 2006a).
42 Can be also called intrinsic scale, which is a broader concept (Wu and Li 2006a). 43 Also referred to as sampling scale or measurement scale (Wu and Li 2006a). 44 Scaling is defined in Section 2.1.7.
35

36
The spatial observation scales in the LRB context, within the above mentioned data categories, are illustrated in Figure 23. Below the three scales, named spatial extent, resolution and integration volume, are discussed in more detail on each data category.
Extent (Figure 23a): The spatial GIS data have the widest extent ranging normally from hundreds of meters to thousands of kilometres. The water level, although being a point data, also has a rather wide
3.1.1 Spatial scales in data issues
45 In space it ranges from 100 m to 107 m and in time from 101 s to 109 s.
Figure 21 Process scale versus observation scale (modified from Blöschl and Sivapalan 1995: 256).
proc
ess
scal
e
observation scale
trend
commmensurate
noise
exten
t
resolu
tion
(cycle) (for periodic processes); and c) integral scale or correlation length (for stochastic processes exhibiting some sort of correlation).
Observation scale is the scale at which sampling measurement is taken (Wu and Li 2006a). According to Blöschl and Sivapalan (1995), the definition of the observation scale is related to the necessity of a finite number of samples. Consequently, observation scale can be defined in space and time as (Figure 22): a) the spatial extent of a dataset; b) the spacing (i.e. resolution) between the samples; and c) the integration volume/time of a sample (Blöschl and Sivapalan 1995). The particular observation scale chosen dictates the type of instrumentation, from detailed sampling of a soil profile to global coverage by satellite images (Dozier 1992).
Data issues related to large river basin HIA are discussed within this section based on these three alternative definitions (Figure 22) including other relevant issues related to the scales of data, such as spatial resolution in GIS data and heterogeneity in time series data. The data issues are first discussed separately in relation to spatial and temporal scales, and then together in the spatio-temporal context. The following data categories are included in the analysis: a) spatial GIS data (various different datasets, such as land use, flood extent, digital elevation model, etc.); b) water level; c) precipitation and evaporation; d) discharge; e) suspended sediment concentration; and f) sedimentation and erosion.
3.1 SPATIAL, TEMPORAL AND SPATIO-
TEMPORAL SCALES IN DATA ISSUES
Hydrological processes occur over a wide range of scales, from unsaturated groundwater flow in one meter soil profile to floods in river systems of millions of square kilometres; and from flash floods of a few minutes to flow in aquifers over hundreds of years (Blöschl and Sivapalan 1995). According to Klemeš (1983), hydrological processes span about eight orders of magnitude in space and time45. The characteristic spatio-temporal scales of various hydrological processes are presented in Blöschl and Sivapalan (1995: 253). The ratio of characteristic length and time scales, i.e. characteristic velocity, is also given for various processes concluding that there is a slight increase in the characteristic velocity with scales (ibid).
Process scale (or intrinsic scale) refers to the scale on which a process actually operates (Wu and Li 2006a). Some argue that there is no process scale in nature (e.g. Allen and Starr, 1982; cited in Wu and Li, 2006a) while others believe that the observed scale of a given phenomenon is the result of the interaction between the observer and the inherent scale of the phenomenon (Wu and Li 2006a). Following Blöschl and Sivapalan (1995), among others, the process scale can be defined as: a) spatial extent / life time (=duration) (for intermittent processes such as flood); b) period
Spatio-temporal scales of hydrological impact assessment in large river basins: the Mekong case

37
Figure 22 Three alternatives definitions of observation scale in space or time: a) spatial/temporal extent; b) spacing (i.e. resolution); c) integration volume / time constant (modified from Blöschl and Sivapalan 1995: 256).
range of extent as it is usually assumed to represent e.g. the water level of the whole lake with a rather small error. Precipitation and evaporation can be estimated over large areas with multiple gauging stations although both phenomena are observed as point data46. The extent therefore varies a lot. Discharge is mostly measured over a river (or lake) cross-section with e.g. ADCP47, and thus the extent covers the width of the sampled area. The same applies to the SSC measurement, particularly if taken, for example, based on the ADCP back-scatter data. Sedimentation is normally observed over a certain area (lake, river reach) and the survey is done by e.g. an echo sounder or similar equipment. Coring and radiocarbon techniques can be used to measure sedimentation over several millennia (see Paper V).
Resolution (Figure 23b): The observation resolution of the spatial GIS data varies typically from the order of one meter (or even higher in some data sets) to several kilometres. Spacing of water level measurements depends on the area and may range from some meters in a small lake to tens of kilometres in a large lake48. The spacing between two precipitation stations may range from some meters to hundreds of kilometres, depending on the region. The spacing of discharge measurement
length [m]
1 10310-3 106
length [m]
1 10310-3 106
length [m]
1 10310-3 106
a) b) c)
spatial GIS
water level
prec. & evap.
discharge
SSC
sedimentation
46 Radar based precipitation observations belong to the spatial GIS data category. 47 Acoustic Doppler Current Profiler; equipment to measure discharges. For more information, see e.g. www.sontek.com/adcp.htm 48 In a large river the spacing between water level stations may vary greatly. The water level measurements in a river are, however, assumed to be separate systems. 49 For example evaporation is not strictly point-like a measurement: for class-A pan evaporation it has an integral length of about a meter, while the evaporation measurement based on humidity values has a length of a few hundred meters.
ranges from sub-meters to tens of meters, depending on the resolution of the measurement equipment (e.g. ADCP). SSC and sedimentation observation resolution may normally vary from some meters to hundreds of meters in a river and to tens of kilometres in a lake.
Integration volume (Figure 23c): For the spatial GIS data the integration volume is typically equal to the resolution (spacing), particularly in the case of raster data. For other data categories the integration volume varies from sub-meters to some tens of meters mainly depending on the measurement equipment used in the observations49.
In terms of data collection and cartographic representation, scale implies a representative fraction related to portraying data in the real world on a map (e.g., topographic maps showing village locations and road features) (Evans et al. 2002). The implications of map scale are common across disciplines and well documented.
The impact of spatial resolution, use of different types of data, and use of different methodologies in mapping the basin extent has been illustrated in Figure 24. The Mekong basin has been used as an example and four global basin extent datasets are
3 Scale issues related to data and field work
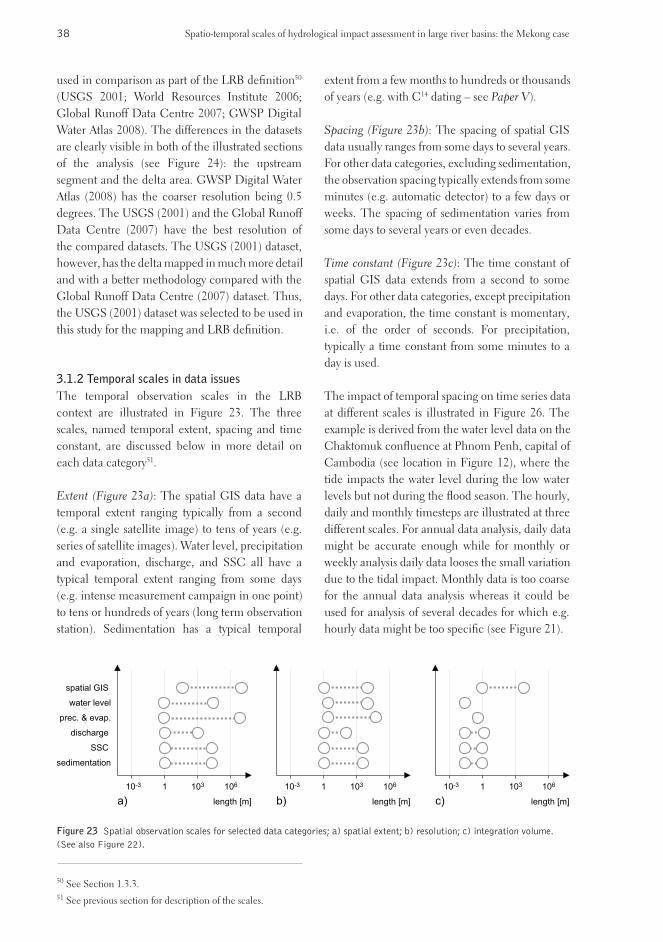
38
Figure 23 Spatial observation scales for selected data categories; a) spatial extent; b) resolution; c) integration volume. (See also Figure 22).
used in comparison as part of the LRB definition50 (USGS 2001; World Resources Institute 2006; Global Runoff Data Centre 2007; GWSP Digital Water Atlas 2008). The differences in the datasets are clearly visible in both of the illustrated sections of the analysis (see Figure 24): the upstream segment and the delta area. GWSP Digital Water Atlas (2008) has the coarser resolution being 0.5 degrees. The USGS (2001) and the Global Runoff Data Centre (2007) have the best resolution of the compared datasets. The USGS (2001) dataset, however, has the delta mapped in much more detail and with a better methodology compared with the Global Runoff Data Centre (2007) dataset. Thus, the USGS (2001) dataset was selected to be used in this study for the mapping and LRB definition.
The temporal observation scales in the LRB context are illustrated in Figure 23. The three scales, named temporal extent, spacing and time constant, are discussed below in more detail on each data category51.
Extent (Figure 23a): The spatial GIS data have a temporal extent ranging typically from a second (e.g. a single satellite image) to tens of years (e.g. series of satellite images). Water level, precipitation and evaporation, discharge, and SSC all have a typical temporal extent ranging from some days (e.g. intense measurement campaign in one point) to tens or hundreds of years (long term observation station). Sedimentation has a typical temporal
3.1.2 Temporal scales in data issues
length [m]
1 10310-3 106
length [m]
1 10310-3 106
length [m]
1 10310-3 106
a) b) c)
spatial GIS
water level
prec. & evap.
discharge
SSC
sedimentation
50 See Section 1.3.3.51 See previous section for description of the scales.
extent from a few months to hundreds or thousands of years (e.g. with C14 dating – see Paper V).
Spacing (Figure 23b): The spacing of spatial GIS data usually ranges from some days to several years. For other data categories, excluding sedimentation, the observation spacing typically extends from some minutes (e.g. automatic detector) to a few days or weeks. The spacing of sedimentation varies from some days to several years or even decades.
Time constant (Figure 23c): The time constant of spatial GIS data extends from a second to some days. For other data categories, except precipitation and evaporation, the time constant is momentary, i.e. of the order of seconds. For precipitation, typically a time constant from some minutes to a day is used.
The impact of temporal spacing on time series data at different scales is illustrated in Figure 26. The example is derived from the water level data on the Chaktomuk confluence at Phnom Penh, capital of Cambodia (see location in Figure 12), where the tide impacts the water level during the low water levels but not during the flood season. The hourly, daily and monthly timesteps are illustrated at three different scales. For annual data analysis, daily data might be accurate enough while for monthly or weekly analysis daily data looses the small variation due to the tidal impact. Monthly data is too coarse for the annual data analysis whereas it could be used for analysis of several decades for which e.g. hourly data might be too specific (see Figure 21).
Spatio-temporal scales of hydrological impact assessment in large river basins: the Mekong case

39
Figure 24 Example of the spatial resolution impacts on the mapping of the Mekong Basin. a) sample from the Upper Mekong Basin in China; and b) sample from the Mekong Delta. Locations are shown in the whole basin map on the left. [GWSP stands for GWSP Digital Water Atlas (2008); GRDC stands for Global Runoff Data Centre (2007); USGS stands for USGS (2001); and WRI stands for World Resources Institute (2006)].
50km
104°0'0"E 105°0'0"E 106°0'0"E 107°0'0"E
11°0'0"N
10°0'0"N
9°0'0"N
GWSP
WRIUSGS
GRDC
98°0'0"E
31°0'0"N
97°0'0"E
a)
a)
b)
b)
GWSP
WRI
USGS
GRDC
50km
500
km
Figure 25 Temporal observation scales for selected data categories; a) temporal extent; b) spacing; c) time constant. (See also Figure 22).
time
d yrs 100 yr d yrs 100 yr d yrs 100 yr
time timea) b) c)
spatial GIS
water level
prec. & evap.
discharge
SSC
sedimentation
3 Scale issues related to data and field work

40
Figure 27 Spatio-temporal observation scales for selected data categories; a) extent; b) resolution/spacing; c) integration volume/time constant (See also Figure 22, Figure 23 and Figure 25).
Figure 26 Scales and heterogeneity at the time scale of time series data: daily (left), monthly and annual scale with hourly, daily and monthly data [water level data from Chaktomuk confluence of the Mekong mainstream, at Phnom Penh, Cambodia; see Figure 12 for location – Source: MoWRaM (2006).]
1.0
2.0
3.0
5.0
8.5.2004 28.5.2004 17.6.2004
Hourly data Daily data Monhtly data
1.5
1.6
1.7
1.8
1.9
14.5.2004 15.5.2004
4.00
2.00
6.00
8.00
10.0
24.01.2004 23.05.2004 20.09.2004 18.01.2005
4.0
1
103
10-3
106
length
[m
]le
ngth
[m
]
1
103
10-3
106
1
103
10-3
106
time
d yrs 100 yr
d yrs 100 yr d yrs 100 yr
time time
a)
b) c)
A
A
B
B
B
C
B
C
B
C
C
D
A
D
D
F
E
F
E&F
E
A: Spatial GIS
B: Water level
C: Precipitation & evaporation
D: Discharge
E: SSC
F: Sedimentation and erosion
Spatio-temporal scales of hydrological impact assessment in large river basins: the Mekong case
41
3.2 DATA IN THE MEKONG CASE STUDIES
For the Mekong case studies both existing data from various sources (e.g. JICA 1999; Mekong River Commission 2006; FAO AQUASTAT Database 2007) and data collected through field work were used. The spatial and temporal scales of the data used in the case studies are briefly summarised and discussed in this section.
The existing data used in the Mekong case studies include GIS, water level, precipitation and evaporation, discharge, suspended sediment concentration, and sedimentation, and erosion data. The spatial and temporal scales of the data vary widely depending on the data category and dataset in question. The spatial and temporal observation scales for each principal dataset are presented in Table 7 and Table 8, respectively.
3.2.1 Existing data
The field work related work of the thesis was done mainly within the MRCS/WUP-FIN project52 (MRCS/WUP-FIN 2007), partly directly within the thesis work and partly with the Greater Angkor Project (GAP)53. Field work was conducted at various scales, mainly concentrating on the sub-basin scale in Tonle Sap Lake, tributary scale in
3.2.2 Field work
52 Lower Mekong Modelling Project WUP-FIN was a complementary project to the Mekong River Commission Water Utilization Programme. It was funded by the Development Cooperation Department, Ministry for Foreign Affairs, Finland. It was active from June 2002 to October 2007. WUP-FIN is an acronym in which the first part comes from the Water Utilization Programme and FIN comes from Finland. For more information, visit http://www.eia.fi/wup-fin53 The Greater Angkor Project is an international, multidisciplinary research programme interested in the decline of urbanism
at Angkor, in Cambodia. Specifically, the project is investigating the relationship between the vast extent of Angkor in the 12th
to 16th centuries AD, land clearance for rice production and regional ecological damage both then and now. The project is run by the University of Sydney. For more information, visit http://acl.arts.usyd.edu.au/angkor/gap/
The spatio-temporal observation scales (Figure 27) are derived from the spatial and temporal observation scales presented in the previous sections. The observation scales seem not to have the similar characteristic velocity as recognised from the hydrological process scales by e.g. Blöschl and Sivapalan (1995). The Spatial GIS data have the largest extent of each spatio-temporal scale while other data categories have a rather similar extent.
3.1.3 Spatio-temporal scales in data issues Angkor area, and local scale in Vientiane-Nong Khai reach of the Mekong River.
At the local scale the field work was done together with the Lao PDR and Thai authorities aiming to understand better the sediment fluxes on the Mekong mainstream to support the modelling activities and bank erosion study (MRCS/WUP-FIN 2007). ADCP and depth integrated sediment measurements were used for the work. In another part of the field work, the bank location was verified in various locations by using the GPS and then compared with the satellite image information (see Paper VII).
At the tributary scale the field work played an important role in understanding the historical water management in the Angkor area. The field work included ground truthing of the main water management features, measurements of the river bed elevation, and photographing the main parts of the channel network from the air.
Most of the Tonle Sap field work was conducted mainly during the WUP-FIN project and is not directly linked to this thesis. Some of the main findings are, however, summarised in Paper III. Portions of the field work done at Prek Kdam (see location in Figure 12) to measure the sediment fluxes and discharge were used for the flood characteristic analysis in Paper V.
In each of the field work modules attention was paid to the fact that the measurements were conducted at the same scale than the processes occur, as suggested by Blöschl and Sivapalan (1995). For example, in the discharge and sediment flux measurements, the spacing of the measurements was much shorter during the high flood, when most of the sediment flux and discharge occurs, than during the dry season.
3 Scale issues related to data and field work

42
Data Extent Resolution Integration volume
Appended paper
GIS data
River basins (polygon) Asia Approx. 1:100,000 (~50 m)
Approx. 1:100,000 (~50 m)
Paper I
Irrigated area (raster) Global 5 min (~10 km) 5 min (~10 km) Paper I
Land cover data (polygon) >30,000 km2 1:20,000 (~5 m) 1:20,000 (~5 m) Paper IV
Digital bathymetry model (raster)
>30,000 km2 Varies (5 m – 100 m)
Varies (5 m – 100 m)
Paper IV
Protected areas (polygon) ~15,000 km2 1:20,000 (~5 m) 1:20,000 (~5 m) Paper IV
Angkor GIS layers ~3,000 km2 Approx. 1:5,000 (~2 m)
Approx. 1:5,000 (~2 m)
Paper VI
Hydrographical atlas 1961 ~600 km2 1:20,000 (~5 m) 1:20,000 (~5 m) Paper VII
Hydrographical atlas 1992 ~600 km2 1:20,000 (~5 m) 1:20,000 (~5 m) Paper VII
SPOT5 satellite images ~600 km2 2.5 m 2.5 m Paper VII
Water level
Tonle Sap Lake water level 2,500 km2– 15,000 km2
- Point data Paper III
Tonle Sap Lake water level 2,500 km2– 15,000 km2
- Point data Papers IV & V
Precipitation & evaporation
Precipitation at Siem Reap 5 yrs Point data Point data Paper VI
Discharge
Principal stations along the LMB
Sub-basin (LMB) - Some 100 m – some km
Paper II
Tonle Sap River Local - Approx. 500 m Papers IV & V
SSC & TSS
TSSa data from 4 stations along the LMB
Sub-basin (LMB) - Point data Papers II & VII
SSC data from 6 stations along the LMB
Sub-basin (LMB) Integrated over the cross- section
Point data Papers II & VII
TSS at Tonle Sap River Local - Point data Papers III & V
Sedimentation and erosion
Tonle Sap Lake Lake proper; ~2,500 km2
Varies Point data Paper V
Global bank erosion rates - Varies Varies Paper VII
Table 7 Spatial scales (extent, resolution and integration volume) of the existing data used in the Mekong case studies. The source of the data is presented in the appended paper in question.
a TSS stands for Total Suspended Solids – see Paper II
Spatio-temporal scales of hydrological impact assessment in large river basins: the Mekong case

43
Table 8 Temporal scales (extent, spacing and time constant) of the existing data used in the Mekong case studies. The source of the data is presented in the appended paper in question.
Data Extent Spacing Time constant Appended paper
GIS data
River basins (polygon) - Momentary Momentary Paper I
Irrigated area (raster) Year 2000 Momentary Momentary Paper I
Land cover data (polygon) Year 1999 Momentary Momentary Paper IV
Digital bathymetry model (raster)
Year 1964 & 1999 Momentary Momentary Paper IV
Protected areas (polygon) Year 2006 Momentary Momentary Paper IV
Angkor GIS layers Year 2007 Momentary Momentary Paper VI
Hydrographical atlas 1961 Year 1961 Momentary Momentary Paper VII
Hydrographical atlas 1992 Year 1992 Momentary Momentary Paper VII
SPOT5 satellite images Years 2005 & 2004 Momentary Momentary Paper VII
Water level
Tonle Sap Lake water level 7 yrs Daily Momentary Paper III
Tonle Sap Lake water level 9 yrs Daily Momentary Papers IV & V
Precipitation & evaporation
Precipitation at Siem Reap 5 yrs Daily Daily Paper VI
Discharge
Principal stations along the LMB 40 yrs Daily Variesa Paper II
Tonle Sap River 10 yrs Varies Variesa Papers IV & V
SSC & TSS
TSS data from 4 stations along the LMB
5-15 yrs 1 month Momentary Papers II & VII
SSC data from 5 stations along the LMB
30-40 yrs (with gaps)
From weekly to monthly
Momentary Papers II & VII
TSS at Tonle Sap River 10 yrs Monthly Momentary Papers III & V
Sedimentation and erosion
Tonle Sap Lake 8,000 yrs. Varies (500-4,000 yrs.)
Momentary Paper V
Global bank erosion rates Global Varies Varies Paper VII
a Discharge measurements are close to momentary if done with ADCP or calculated from rating curve, while with traditional flow meters it may take several hours to finish the required measurements over a large cross-section in the Mekong mainstream or Tonle Sap River.
3 Scale issues related to data and field work

44

4 METHODS AND TOOLS TO ASSESS IMPACTS ON DIFFERENT SCALES
“[Environmental and natural resource management] problems, data,
and models are all scale-dependent”
Lilburne (2000: 1)
Various kinds of models, such as hydrological and hydrodynamic models, and spatial and statistical analyses are important tools in hydrological impact assessment. While process and observation scales were covered within the data issues (see previous chapter), analysis scale and model scale are discussed in this section. The analysis and model scales are defined by the resolution and extent, in space and time, of statistical analysis and dynamic models (Wu and Li 2006a).
Environmental and natural resource management issues are often resolved or studied by combining spatial and temporal data with models, such as hydrological and hydrodynamic models (Lilburne 2000). Such problems, data, and models are all scale-dependent (ibid). The scale is described by extent, resolution and precision. For example, models have an area or extent over which the assumptions on it are valid (ibid). According to Lilburne (2000), data resolution can alter model accuracy, and a problem may be solvable at one stage of spatial detail but not at another (ibid). Therefore, it is important that practitioners assess scale compatibility of data and model, or a statistical analysis tool, with a given problem to ensure the validity of this information for decision-making (ibid).
Remote sensing with spatial analyses has become another important tool for regional and international environmental assessment. It has the advantage of providing repeatable large-scale coverage of variables that are often correlated with environmental states and, with complementary groundwork, ecosystem functions (Lebel et al. 2005). The scale choices, resolution, and classes in maps, and other end products of spatial analysis, undoubtedly influence the information that is
45
actually communicated (Lebel 2006). Scale biases arise from the resolution of the instrumentation used, the density and spatial distribution of the observation network, the scope of mapping, the scales at which experimental manipulations are feasible and ethical, the choices of statistical methods, and the assumptions made in the models (ibid). Like maps, models and statistics can be used to both hide and reveal scale-dependent relations (ibid).
Scaling also introduces the scale biases (Lebel 2006) and increases the inaccuracy of the modelling or other analysis results. Blöschl (2001), therefore, argues that it might lead to a better result if instead of trying to capture everything when upscaling in physically based models, methods should be developed to identify dominant processes that control hydrological response in different environments and at different scales.
4.1 METHODS AND TOOLS IN THE IA FOR
LARGE RIVER BASIN
The following methods and tools, used within HIA, are discussed here: A) GIS analysis; B) hydrological modelling; C) hydrodynamic and sediment modelling; D) statistical (or time series) analysis; and E) secondary sources of information (literature). The tools are first briefly introduced and defined in the context of this work followed by the analysis of spatio-temporal scales related to the tools.
GIS analysis includes, in this context, all the possible remote sensing and spatial analysis tools
4.1.1 HIA Tools and methodologies:
introduction
45
46
and methodologies that can be applied within the HIA discipline in the LRB context. Remote sensing has become an important part of most of the impact analysis studies. It can be used to either analyse collected information (e.g. from satellite images) to better understand the present status of the environment, or to analyse the impacts of the predictions of consequences (by e.g. models) together with existing information.
Hydrological models have been used extensively during the last decades to simulate the hydrological consequences due to e.g. development projects or land cover changes. Typically the hydrological models can be divided into two main groups: lumped models and distributed models. In a lumped model, the watershed (or sub-water shed) is treated as one unit having the same values for each parameter. In a distributed model, the modelled area (watershed or sub-watershed) is divided into grid cells, each having its own parameters based on e.g. the land use or soil properties of the cell. Lumped models are normally used as operational tools and for quick assessments, as they are fast to run and relatively easy to calibrate. Distributed models, on the other hand, are slower to calibrate and run but are respectively more appropriate to simulate e.g. land cover changes as the land use patterns can be defined in great detail.
Hydrodynamic models are used in HIA to e.g. predict development impacts, such as flow alterations, on flood characteristics in the floodplain or delta areas. Hydrodynamic models can be grouped based on the dimension that is used to model the hydraulic processes. These can be modelled either in one, two or three dimensions (1D, 2D, or 3D). Again, different kinds of models are used for different purposes: 1D models are typically used for river hydrodynamics; 2D models for more complex river dynamics with e.g. floodplains and shallow lakes; while 3D models are used for complex river dynamics, floodplain processes and lakes. The sediment transport module is often linked to the hydrodynamic model.
The connectivity between different mathematical models, being either on distinct levels or scales, is normally compiled through various boundary conditions. The boundary conditions are critically important when using a diverse set of models and connecting the models to either observed data or results derived from other model(s). The boundary conditions should be carefully selected in order not to lose any information on the border.
4.1.2 Connectivity between the tools: boundary
conditions
The spatio-temporal model and analysis scales in the LRB context, within the four tool and methodology categories54, are illustrated in Figure 28. Below the three scales, named extent, resolution/spacing and integration volume/time constant, are discussed in more detail on each scale category.
Extent (Figure 28a):
A. The GIS analysis has the broadest extent, both spatially and temporally. The temporal extent varies from momentary data (e.g. single remote sensing image) to long term monitoring by using e.g. satellite images. The spatial scale varies from a few square kilometres (e.g. detailed bank erosion study) to the global level.
4.1.3 HIA Tools and methodologies: spatio-
temporal scales
54 The category is excluded from this analysis
Statistical analysis comprises, in this context, mainly hydrological (water level, discharge, precipitation, evaporation, etc.) and sediment (sediment concentration, sediment flux, etc.) analysis based on the measured data. The analyses based on the modelled data (i.e. simulations) are included in the model categories.
The category secondary sources of information includes various kinds of information drawn from the literature and other similar sources.
Spatio-temporal scales of hydrological impact assessment in large river basins: the Mekong case

47
B. Hydrological models may have a temporal extent ranging from a few months (or even less) to over hundred years, while the spatial extent typically varies from small sub-watershed scale (of the order of square kilometres) to basin scale. When modelling the present condition, the temporal extent is dependent on the available measurement data (e.g. precipitation, evaporation, discharge, etc) and if using the model to predict future changes, the temporal extent depends on the selected time-span, normally being in HIA studies between 5 and 50 years.
C. The temporal extent of hydrodynamic models is usually shorter than the one in hydrological models, and can be even momentary in static modelling, typically ranging from some days to several years. The spatial extent varies typically from local scale to sub-basin scale (see e.g. Paper III) and in some cases even to basin scale when using e.g. a 1D river model.
D. The temporal extent in the statistical analysis is dependent on the temporal extent of the available data. The extent differs significantly between river basins and might vary from some tens of years to over hundred years. The spatial extent of the statistical analysis varies from local scale to basin scale, depending on data availability and aims of the study.
Resolution / Spacing (Figure 28b):
A. The resolution of the available data defines the limit of accuracy for the spatial resolution of the GIS analysis. This varies from meters to some kilometres. The resolution used depends on the application and needs of the study. The temporal spacing is again dependent, to some extent, on the available data and, also, aims of the study; that might vary within the HIA context from some days to some tens of years.
Figure 28 Spatio-temporal model and analysis scales for the selected HIA tools; a) extent; b) resolution/spacing; c) integration volume/time constant [Note: different spatial scale (y-axis) in a) and b) & c)].
104
102
106
108
area
[km
2 ]
TributaryLocalG
lobalS
ub-basinB
asinR
egional
leng
th [m
]
1
103
10-3
106
1
103
10-3
106
A: GIS analysisB: Hydrological modelC: Hydrodynamic modelD: Statistical analysis
time
d yrs 100 yr
d yrs 100 yr d yrs 100 yr
time time
a)
b) c)
A
A
D
D
D
B
BB
A
C
C
C
4 Methods and tools to assess impacts on different scales
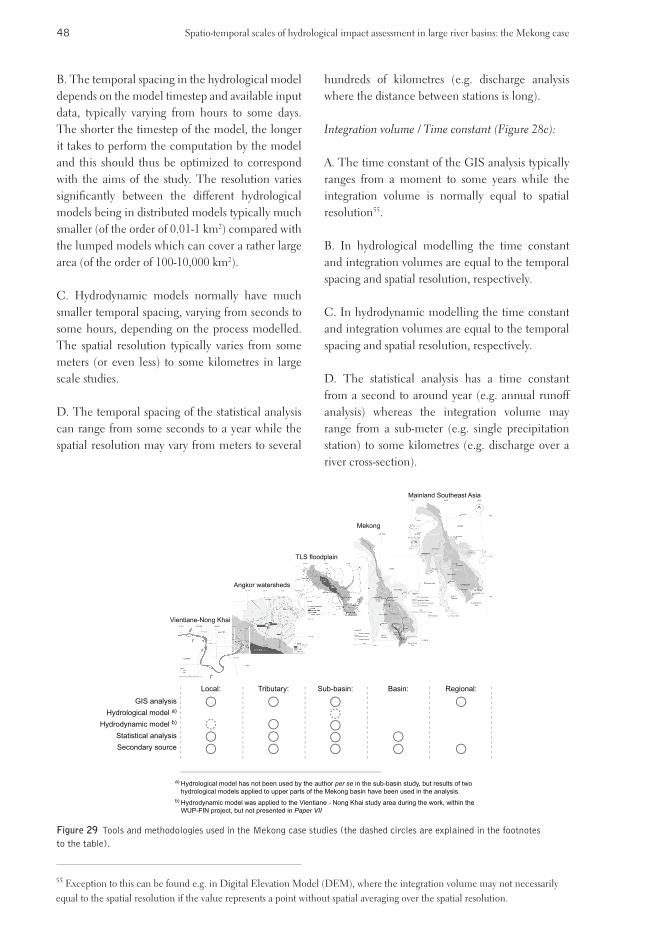
48
55 Exception to this can be found e.g. in Digital Elevation Model (DEM), where the integration volume may not necessarily equal to the spatial resolution if the value represents a point without spatial averaging over the spatial resolution.
Figure 29 Tools and methodologies used in the Mekong case studies (the dashed circles are explained in the footnotes to the table).
Mainland Southeast Asia
Mekong
Local:
GIS analysis
Hydrological model a)
Hydrodynamic model b)
Statistical analysis
Secondary source
a) Hydrological model has not been used by the author per se in the sub-basin study, but results of two
hydrological models applied to upper parts of the Mekong basin have been used in the analysis.
b) Hydrodynamic model was applied to the Vientiane - Nong Khai study area during the work, within the
WUP-FIN project, but not presented in Paper VII
Tributary: Sub-basin: Basin: Regional:
TLS floodplain
Angkor watersheds
Vientiane-Nong Khai
B. The temporal spacing in the hydrological model depends on the model timestep and available input data, typically varying from hours to some days. The shorter the timestep of the model, the longer it takes to perform the computation by the model and this should thus be optimized to correspond with the aims of the study. The resolution varies signifi cantly between the different hydrological models being in distributed models typically much smaller (of the order of 0.01-1 km2) compared with the lumped models which can cover a rather large area (of the order of 100-10,000 km2).
C. Hydrodynamic models normally have much smaller temporal spacing, varying from seconds to some hours, depending on the process modelled. The spatial resolution typically varies from some meters (or even less) to some kilometres in large scale studies.
D. The temporal spacing of the statistical analysis can range from some seconds to a year while the spatial resolution may vary from meters to several
hundreds of kilometres (e.g. discharge analysis where the distance between stations is long).
Integration volume / Time constant (Figure 28c):
A. The time constant of the GIS analysis typically ranges from a moment to some years while the integration volume is normally equal to spatial resolution55.
B. In hydrological modelling the time constant and integration volumes are equal to the temporal spacing and spatial resolution, respectively.
C. In hydrodynamic modelling the time constant and integration volumes are equal to the temporal spacing and spatial resolution, respectively.
D. The statistical analysis has a time constant from a second to around year (e.g. annual runoff analysis) whereas the integration volume may range from a sub-meter (e.g. single precipitation station) to some kilometres (e.g. discharge over a river cross-section).
Spatio-temporal scales of hydrological impact assessment in large river basins: the Mekong case

49
56 A hydrodynamic model was applied during the work but not presented in the appended paper. See MRCS/WUP-FIN (2007) for more information. The author of this thesis was part of the WUP-FIN team 2002-2006. 57 See Section 2.3.2 for definitions of past, present and future temporal scales. 58 The time series analysis of modelled results is assumed to belong to the modelling categories.
4.2 METHODS AND TOOLS IN THE MEKONG
CASE STUDIES
Various tools and methodologies are used in the Mekong case studies (Figure 29). Secondary sources of information have naturally been used in each of the case studies. The type of information used varies from one study to another. Statistical analyses, being either hydrological or sediment analysis, or both, have been used in every case study except the regional one. Hydrodynamic modelling has been used in local56, tributary and sub-basin scales. A hydrological model was not applied directly within the case studies but results from two hydrological models were used in Paper IV whereas GIS analysis has been applied in all of the case studies except the basin scale study.
The spatial and temporal scales of the Mekong case studies are presented above (see Sections 2.2.3
Within the tool selection process for the HIA, the scale(s) of the study should be taken into account by analysing the observation and analysis scales together and using this analysis to help identify the appropriate tools for the assessment.
and 2.3.2, accordingly). The analysis and model scales, from the spatial and temporal perspective, vary between the tools used in the case studies (Figure 30). Both past and future temporal scales are analysed here to maintain the comparability with the spatio-temporal scale analysis of the case studies presented in Figure 19.
Statistical analysis can be used only at the present temporal scale57, due to limitations in data availability58. In the Mekong case studies the data are available from 1960s or later (Table 8) while the spatial extent ranges from local to basin scale. GIS analyses have been used at the past and present temporal scales while the spatial scale varies from local to regional scale (Figure 30). Hydrological modelling is used for both present and future temporal scales. Over the spatial scale it can be used only up to the basin scale. Hydrodynamic modelling has the narrowest extent of scales, both temporally and spatially. It has been used spatially up to the sub-basin scale and temporally only for approximately 10 years into the past and some tens of years into the future. The secondary sources of information, naturally, cover the most extensive range of scale, in both space and time.
Figure 30 Spatio-temporal scales of the tools used in the Mekong case studies.
-103 -102 -101 Present 101 102
Time [yr]
Tributary
LocalG
lobalS
ub-basinB
asin
Regional
102
103
104
105
106
107
108
Are
a [k
m2 ]
Sec
onda
ry s
ourc
e of
info
rmat
ion
Sta
tistic
al a
naly
sis
GIS
ana
lysi
s
Hyd
rolo
gica
l mod
ellin
g
Hyd
rody
nam
icm
odel
ling
4 Methods and tools to assess impacts on different scales

50
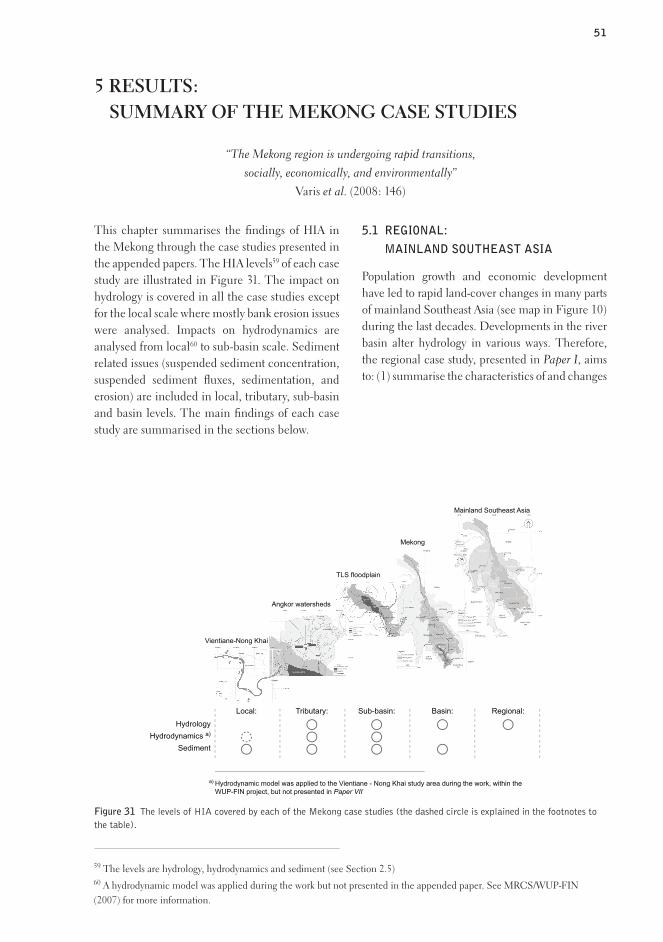
5 RESULTS: SUMMARY OF THE MEKONG CASE STUDIES
“The Mekong region is undergoing rapid transitions,
socially, economically, and environmentally”
Varis et al. (2008: 146)
This chapter summarises the fi ndings of HIA in the Mekong through the case studies presented in the appended papers. The HIA levels59 of each case study are illustrated in Figure 31. The impact on hydrology is covered in all the case studies except for the local scale where mostly bank erosion issues were analysed. Impacts on hydrodynamics are analysed from local60 to sub-basin scale. Sediment related issues (suspended sediment concentration, suspended sediment fl uxes, sedimentation, and erosion) are included in local, tributary, sub-basin and basin levels. The main fi ndings of each case study are summarised in the sections below.
51
5.1 REGIONAL:
MAINLAND SOUTHEAST ASIA
Figure 31 The levels of HIA covered by each of the Mekong case studies (the dashed circle is explained in the footnotes to the table).
Local:
Hydrology
Hydrodynamics a)
Sediment
a) Hydrodynamic model was applied to the Vientiane - Nong Khai study area during the work, within the
WUP-FIN project, but not presented in Paper VII
Tributary: Sub-basin: Basin: Regional:
Mainland Southeast Asia
Mekong
TLS floodplain
Angkor watersheds
Vientiane-Nong Khai
51
59 The levels are hydrology, hydrodynamics and sediment (see Section 2.5)60 A hydrodynamic model was applied during the work but not presented in the appended paper. See MRCS/WUP-FIN (2007) for more information.
Population growth and economic development have led to rapid land-cover changes in many parts of mainland Southeast Asia (see map in Figure 10) during the last decades. Developments in the river basin alter hydrology in various ways. Therefore, the regional case study, presented in Paper I, aims to: (1) summarise the characteristics of and changes

52
in land surface in mainland Southeast Asia; (2) give an overview of the current understanding of the impacts of land surface changes on hydrology in mainland Southeast Asia; (3) assess scientific approaches and tools for detecting land surface changes in the Mekong basin; and (4) identify priority research areas and gaps in the impact of land surface changes on hydrology in mainland Southeast Asia. The largest changes in land surface, i.e. land cover and land use, have been deforestation, increased agricultural practices with irrigation, dam and reservoir construction, and construction of embankments.
The annual deforestation rate in mainland Southeast Asia has been around 0.64% during the period 1963-1994, while it has been estimated that in the region of the five main river basins the original forest loss has been 69.5%. The impact of deforestation on hydrology is a controversial and complicated issue. It is discussed in more detail in Paper I and briefly summarised in Table 4.
Between 1961 and 2002 the irrigated area in mainland Southeast Asia has increased from 1.7% to 5.4% of the total land area or, in other words, leaving approximately 21.8% of agricultural land irrigated. The irrigation intensity, however, is rather low in the region compared with other parts of Asia (Barker and Molle 2004). Diversion of surface waters for irrigation results in increased evaporation and a net loss of water in the basin (Vörösmarty 2000). In the study region the annual water withdrawal for agricultural purposes is 82.1 km3/yr or 88% of the total water withdrawal being much higher than the global average ratio (67%). The impacts of irrigation practices are discussed in more detail in Paper I.
Embankments (including roads) are remarkable land surface changes in floodplains and wetlands. Embankments normally divert the floods back to the river and may increase floods in some other areas downstream as the natural storage of the river is blocked. In other areas than floodplains,
the roads and embankments reduce infiltration by compaction and thus, the overland flow increases.
Dams and reservoirs may heavily impact hydrology at various scales, from local to basin scale. The cumulative impact of small dams can also be notable on a basin scale, when local impacts on the immediate closure of the dam site in question might be more obvious. The impact on hydrology (and sediment budget), however, depends on many factors: reservoir size, operation rules, reservoir and dam characteristics, etc. The construction of dams is mushrooming in the area, particularly in Lao PDR, China and Vietnam (see e.g. King et al. 2007). The issue is presented in more detail in Paper I.
On the basis of the analysis presented in Paper I, supported by the working experience of the authors, particularly within the Mekong Basin, the most important sources of scientific uncertainty and entry points to scientific debate have been synthesized in the appended paper. Moreover, a concise set of priority research areas61, with the time perspective of one decade ahead in time have been identified.
5.2 BASIN: MEKONG
The Mekong Basin (see map in Figure 11) is the largest river basin in the region of mainland Southeast Asia, being the geographical focus of the case studies of this thesis. The basin-wide case study is presented in Paper II. It explores the potential and observed downstream changes, positive and negative, related to hydrology, sediment flux, and geomorphology in the Lower Mekong Basin (LMB) due to hydropower dam construction on the Upper Mekong, where China has completed three hydropower dams on the Mekong mainstream62 since 1993 and six more are either under construction or proposed. More than 50% of the annual sediment flux of the Mekong originates from China (Walling 2005; Walling 2008) and it is, therefore, important to understand the impacts
61 The research areas include hydrological cycle, ecosystems, water quality, dams, water transfers, and data sharing. 62 The dams are Manwan (closure 1993), Dachaosan (closure 2003), and Jinghong (first generating unit started in June 2008)
Spatio-temporal scales of hydrological impact assessment in large river basins: the Mekong case

53
of the reservoir construction on the these fluxes. Although the paper concentrates on the dams in Yunnan, the analysis was done with full awareness that the dams are just part of the overall process of development plans in the Mekong (see e.g. King et al. 2007).
The suspended sediment data from seven stations along the LMB were used to compare the suspended sediment fluxes before and after the Manwan Dam, the first mainstream dam on the Mekong. In Chiang Saen, 660 km downstream from the Manwan dam, the measured annual sediment flux, based on total suspended solids (TSS) data, has been more than halved from 70×109 kg to 31×109 kg after the closure of the dam in 1993. In other stations the sediment flux has also changed after the closure of the Manwan Dam but not statistically significantly. Walling (2005; 2008), however, concludes that the suspended sediment flux has not decreased in Chiang Saen after the closure of the Manwan Dam. His conclusion is based on an analysis made by using SSC data, thus differing from the dataset used in the analysis in Paper II.
The major hydrological impacts of the constructed and planned dams and reservoirs on the Lower Mekong would be (1) increasing average downstream dry-season flow, (2) decreasing wet-season flow (Adamson 2001; ADB 2004; World Bank 2004), and (3) increasing short-term water level fluctuations (Lu and Siew 2006). These hydrological changes may have a negative impact on the ecosystem (see Papers III and IV) but at the same time they may reduce saline intrusion in the delta, ease navigation, and increase opportunities for irrigation during the dry season due to the higher dry season discharge levels.
The theoretical trapping efficiency of the reservoirs has been calculated using Brune’s (1953) method. Theoretical trapping efficiency for the Manwan dam reservoir is 68%, which correlates rather well with the measured trapping efficiency of 60% (Fu et al. 2008). The reservoirs of the biggest dams Xiaowan and Nuozhadu, currently under construction, have theoretical trapping efficiencies
as high as 92%, basically having a potential to trap nearly all the sediment. The whole cascade of eight dams has a total theoretical trapping efficiency of 94%.
The possible downstream morphological changes due to dams on the Upper Mekong are predicted by using methodologies developed by Brandt (2000) and Grant et al. (2003). Based on the method developed by Brandt (2000), the possible impacts are a degrading bed level and cross sectional changes, depending on the local condition. The impact on floodplains is difficult to predict, but riffles and pools are likely to erode. The geomorphological impacts of the dams, derived from the method developed by Grant et al. (2003), include bed scour, armouring of channel, bar and island erosion, and channel degradation and narrowing, the intensity of change decreasing in the downstream direction.
The paper also calls for urgent unrestricted flow of information between the Mekong countries to enable more quantitative estimations of possible development-related impacts.
5.3 SUB-BASIN: TONLE SAP
Tonle Sap Lake (see Figure 12) is an integral part of the Mekong River being the largest freshwater lake in Southeast Asia. The importance of the lake is unquestioned for Cambodia and the lower Mekong Basin (e.g. Bonheur 2001; Sverdrup-Jensen 2002; Keskinen 2006; Lamberts 2006) and over one million people depend directly on the natural resources of the lake. The monsoon floods of the Mekong River are a key driver of productivity in the Tonle Sap Lake ecosystem (Lamberts 2006). This pulsing system (Junk 1997), with its large floodplain, rich biodiversity, and high annual sediment and nutrient fluxes from the Mekong River, is believed to be one of the most productive freshwater ecosystems in the world (Rainboth 1996). For many of the Mekong fish species, the floodplain of the lake, and particularly the flooded forest and shrublands, offers favourable conditions for fish to breed and grow (Poulsen et al. 2002). The lake also operates as a natural floodwater reservoir for
5 Results: summary of the Mekong case studies

54
the lower Mekong Basin, offering flood mitigation during the rising flood and assuring dry season flow to the Mekong Delta (Fuji et al. 2003).
The sub-basin scale case studies on Tonle Sap Lake are presented in three appended papers: Papers III, IV, & V. The first of these papers presents the current understanding of the lake’s ecosystem and the modelling tools that have been developed for the lake. Moreover, the paper discusses how the modelling tools have been used for IWRM and policy-making as an active tool for national and basin-wide planning. Paper IV presents the current knowledge of the sedimentation and sediment transport in the lake based on the results of recent palaeontological research (e.g. Penny et al. 2005) and modelling activities (Paper III). The impacts of the Mekong flow alteration on the Tonle Sap flood pulse, due to the foreseen upstream development, are analysed in Paper IV.
IWRM is an ambiguous concept to balance economic growth, poverty reduction and the conservation of ecosystem health and productivity through developing democratic governance practices and sound water resources development for poverty reduction, social equity, economic growth and environmental sustainability (GWP 2000). In this process a question often emerges: do we know enough about the consequences of the chosen water resources policies for the ecosystems and the people? Paper III attempts to summarise the current understanding of the Tonle Sap ecosystem functions, concentrating on the flooding and water quality regime. The paper also presents the integrated three-dimensional (3D) modelling system by the EIA Ltd63, supported with primary data collection and analysis, which has been developed for the Tonle Sap to assess the impacts of planned developments on the lake’s ecosystem and riparian communities during the WUP-FIN project.
5.3.1 An integrated modelling approach for
Tonle Sap Lake ecosystem management
The paper summarises the information of the lake’s hydrological regime concluding that the majority of the water originates from the Mekong mainstream. The flood pulse concept, developed by Junk (1997) in the Amazon, is one of the main characteristics of the lake’s ecosystem functions (Lamberts 2006). The flood pulse of the Mekong, and Tonle Sap, falls into the category of predictable monomodal flood pulse (Junk and Wantzen 2004). The flooded area and duration are analysed based on the EIA 3D modelling results showing great variance between the years, as also concluded in Paper IV.
The sediment dynamics analysis derives from the extensive field work, model results and recent palaeontological work (Tsukawaki et al. 1997; Penny et al. 2005), and is presented in more detail in Paper IV. Dissolved oxygen is one of the most important parameters for the life of the lake and its floodplain. The lake is typically well oxygenated from surface to bottom. By contrast, most parts of the floodplain are highly hypoxic or anoxic64 for the most of the flood period. The paper concludes that understanding the ecosystem processes and tools for predicting the development impacts are essential for Integrated Water Resources Management, sustainable basin-wide planning, and national and regional policy-making.
Recent cumulative impact assessment studies of the Mekong Basin (Adamson 2001; ADB 2004; World Bank 2004) are consistent in indicating that increased development activities, particularly construction of hydropower dams and reservoirs, large irrigation schemes, and rapid urban development, will result in higher dry-season water levels and lower flood peaks. The flow alterations in the Mekong mainstream would directly impact the flood pulse of Tonle Sap Lake. This is because around 60% of the Tonle Sap flood water originates
5.3.2 Impact of flow alteration on Tonle Sap
flood pulse
63 Environmental Impact Assessment Centre of Finland, EIA Ltd; more information at www.eia.fi 64 A system with low dissolved oxygen (DO) concentration—in the range between 1 and 30% DO saturation—is called hy-poxic, while anoxia is a condition of no oxygen available at all.
Spatio-temporal scales of hydrological impact assessment in large river basins: the Mekong case

55
from the Mekong, and the water level in the lake is controlled by the water level in the Mekong mainstream. Paper IV aims to assess the impacts of those possible flow alterations on the flood characteristics, gallery forest, and protected areas in Tonle Sap Lake by using statistical and spatial analyses.
The analysis of the present flood characteristics concludes that according to the statistical flood analysis, the timing of the flood peak is very regular in Tonle Sap Lake. However, the start and end dates of the flood vary significantly, depending on the timing of the flood on the mainstream Mekong and local rainfall in the Tonle Sap tributaries. The changes in the dry-season water levels, estimated to increase the water level in Tonle Sap Lake by 0.15–0.60 m, would increase the permanent lake area (2300 km2) between 400 and 1000 km2 (17%–40%). This would be harmful to the present ecosystem of the lake as it would permanently inundate disproportionately large areas of floodplain, rendering it inaccessible to floodplain vegetation. Together with lower flood levels the changes would erode the productivity basis of the ecosystem by reducing the inundated area and the duration and amplitude of flooding. The issue is addressed in more detail in Paper IV.
The bulk of the nutrients that fuel the food webs in Tonle Sap Lake are carried by the Mekong River floodwaters. The nutrients bound to suspended sediments are undoubtedly important for the Tonle Sap system, particularly to maintain its long-term sustainability (Paper III). The sediments, however, are a controversial issue in Tonle Sap Lake as it has been claimed that the lake is rapidly filling up with sediment as a result of increasing sediment yields from the catchment. Infilling of the lake basin would have serious implications for the magnitude of flooding in central Cambodia
5.3.3 Sedimentation and sediment transport in
Tonle Sap
and the Mekong Delta region and threaten the lake’s unique ecosystem. Paper V synthesises the current knowledge of sediment transportation and sedimentation in Tonle Sap Lake so as to assess claims that the lake is under immediate threat of filling with sediment.
The Tonle Sap system receives over 50% of its total inflow from the Mekong River system while in the case of TSS, the Mekong River has an even greater influence on the lake as 72% of the lake’s TSS originates in the Mekong, and only 28% comes from the lake’s own tributaries. Estimates of sedimentation rates based on radiocarbon dating of cores of sediment (Tsukawaki et al. 1997; Kolata and Cunningham 2005; Penny et al. 2005) are compared with simulated values derived from the EIA 3D model (Paper III). The average sedimentation rate, based on coring results, for the most recent sediments is 0.19 mm/yr in the lake proper.
The model results show that most of the sediment settles out onto the floodplain, and this correlates well with the field data and core results (Tsukawaki et al. 1997; Penny et al. 2005). The paper concludes that the rapid rates of infilling cited in the literature have not been proven. Therefore, there is no threat of the lake filling up with sediment in the short term. On the contrary, sediment is not a threat to the lake but an important part of its ecosystem, providing nutrients that fuel productivity.
5.4 TRIBUTARY:
WATER MANAGEMENT IN ANGKOR
The monsoon climate has challenged societies throughout the centuries. In Angkor65 (see location in Figure 13) this led to the development of a systematic and extensive water management network over hundreds of years. The network probably served multiple functions (e.g. a store for water for the dry seasons, or the mitigation of wet-season floods). Paper VI describes through
65 Angkor was the capital of the Khmer empire from the 9th to 15th century C.E. The city was, at its peak, the most extensive pre-industrial low-density urban complex in the world (Evans et al. 2007; Paper VI).
5 Results: summary of the Mekong case studies
56
spatial analysis and modelling activities how water management impacted the natural hydrology during the Angkorian era.
Due to the intensive human impact on natural waterways during the Angkorian era, it was found necessary to also divide the area into water management levels and zones. The three levels include: a) household level, b) village level and c) city level, based on the typical water management structures in the Angkor area. The zoning is based on elevation and the latest archaeological mapping, and is intended to simplify the cultural water management of the area and assist in understanding the large scale water management functions of Angkor. The zones can be divided into three principal types:
A. collector zoneB. aggregator and holding zone (temple zone)C. drainage and dispersal zone
The extensive water diversion from the natural rivers to the channels in the collector zone has had a major impact on the catchments, breaking the original Puok catchment into two: the Siem Reap and the new Puok catchments. This changed the natural hydrology significantly and led to problems with erosion and sedimentation in the channels. Over time, these problems may have challenged the functionality of the hydraulic network and caused possible problems in the overall water management scheme in Angkor.
The paper concludes that modern water management concerns, and particularly impacts of different types of human actions such as water diversions and reservoir constructions on hydrology and sediment transportation, should be examined with a much longer term perspective than is presently employed.
5.5 LOCAL: VIENTIANE – NONG KHAI
Morphological changes, such as bank erosion, downcutting and bank accretion, are natural processes for an alluvial river. Human actions, however, can have an impact on these natural processes either by accelerating or decelerating them. Bank erosion has endangered nearby settlements and infrastructures along the Mekong River. Erosion in the Vientiane–Nong Khai section of the river (see map in Figure 14) has been identified as a serious process area and a transboundary issue between Lao PDR and Thailand (Rutherfurd et al. 1996). The case-study presented in Paper VII assessed how much the shape of the river in Vientiane–Nong Khai area has changed over two time periods: 1961-1992 and 1992-2005. The possible causes of the bank erosion and accretion are also discussed in the paper.
The averaged bank erosion rate for two sides, Lao PDR and Thailand, along the studied section was one order of magnitude lower compared with other large rivers of similar sizes. The quantified rates were 0.8 and 1.0 m/yr for the first and second analysis period, respectively, while the global average for a river of that size is 12.1 m/yr (Van de Wiel, (2003). The observed bank accretion was 0.4 m/yr during 1961–1992 and 0.7 m/yr during 1992–2005. Both the bank erosion and accretion rates were significantly higher in the islands. Thus, the average annual erosion rate is 0.1% of the channel width, which is very low on a global scale. The bank erosion may, however, have significant consequences e.g. for the local infrastructure.
The paper concludes that the riverbanks had experienced a slow to moderate erosion rate. The rates could be further enhanced in the region with the increasing changes in hydrodynamics as a result of human activities like reservoirs construction, river channel improvement for navigation, riverbank controls, bridge construction, and sand mining, etc. Therefore, work is underway to further examine the hydrodynamic and in-bank processes.
Spatio-temporal scales of hydrological impact assessment in large river basins: the Mekong case

The Mekong case studies introduce the HIA in practice at five scales from local to regional scale. The case studies cover some of the most relevant issues in the HIA field in the Mekong, and more generally in the LRB context: sediment trapping by reservoirs, flow alteration impacts on flood pulse system due to upstream development, bank erosion, sedimentation dynamics and sediment transport. In this thesis the case studies have been examined from the scale approach perspective, particularly regarding the data and tools within the HIA process.
Although the case studies have been conducted within the rather narrow domain of HIA, including hydrology, hydrodynamics and sediment transport, this is seen as part of the broader field of IA including the ecosystem processes, social dimensions, economics, policies, etc., where HIA provides a good base for further studies.
6 DISCUSSION: SCALES AS PART OF THE HIA PROCESS
“In general, only when the scales of observation and analysis are properly chosen, may the characteristic
scale of the phenomenon of interest be detected correctly; only when the scales of experiments and
models are appropriate, may the results of experiments and models be relevant; only when the scale of
implementation of policies is commensurate with the intrinsic scale of the problem under consideration,
may the policies be effective”
Wu and Li (2006a: 7)
Scales are integral part of each step along the planning or impact assessment process within the environmental science discipline. The three-tiered conceptualisation of scale organising by Wu and Li (2006a) was used as a base for the scale approach of the thesis (see Figure 4). It is, however, useful also to discuss how the scales are included as a part of the HIA process itself. This is combined with a more general discussion of the scale issues analysed in the thesis. The chapter begins with a brief discussion of the Mekong case studies highlighting the importance of sound and objective cumulative impact assessment research in the future.
57
6.1 MEKONG CASE STUDIES
The knowledge base regarding the hydrology, sediments and ecosystem processes of the Mekong River has gradually expanded during the last years. The case studies appended to this thesis have contributed to this process. The case studies conclude with a number of important findings related to the HIA in the Mekong Basin summarised in the previous chapter and concluded in the next one. While recent studies have increased our understanding of ecosystem processes, the possible impacts of mushrooming development are not yet well understood. Therefore, they raise issues and concerns about urgent work that remains to be done in the basin. The Mekong is at the crossroads in many respects, as concluded by Varis et al. (2008). The various ongoing and planned large scale development projects, among other issues such as urbanisation and climate change, are challenging ecosystem health in the basin, and consequently the well-being of humans, and particularly the poorest ones.
There is, therefore, an urgent need for sound cumulative impact assessment regarding the fast-paced development, particularly hydropower construction, irrigation and water transfer plans, not to forget the foreseen impacts of climate change. Integrated, cross-boundary planning, involving both downstream and upstream countries, is also urgently required to minimize the impacts of the predicted flow alteration. One step towards this goal would be, as concluded in Paper III, to amplify and accelerate concerted and coordinated research efforts involving riparian institutions and researchers as well as international teams.
57

58
6.2 SCALES AS PART OF THE HIA PROCESS
Hydrological impact assessment can be seen as a cumulative impact assessment focusing on water. In this work the levels of the HIA were selected to be hydrology, hydrodynamics and sediments. On the other hand, HIA could be seen as a sectoral EIA covering only part of its disciplines. The HIA process itself can be divided into three main phases, applying the division proposed by MacDonald (2000: 302)66 for cumulative effect assessment: a) scoping phase; b) analysis phase; and c) management and implication phase. Each of the
phases has been further divided into interrelated steps (Figure 32). This part of the discussion intends to better link the spatio-temporal scales and the HIA process itself, and provide a broader framework for the issue.
The study is limited to contain the levels included in the HIA67, namely hydrology, hydrodynamic and sediment transport. All these levels are linked with each other and form a loose hierarchical system with some feedback processes. This limited domain naturally reduces the applicability of the work. On
Figure 32 Conceptual process for assessing hydrological impacts (adapted and modified from MacDonald 2000: 302).
66 MacDonald’s (2000) division is designed to serve as a process for assessing cumulative effects. It was selected to be used as a base for the HIA process as it should be done based on the CEA principles; i.e. taking into account the cumulative impacts of development projects. 67 According to the definition in Section 1.3.1
Identify issues and resources of
primary concern (inc. location)
Phase Interrelated steps Relations Scales
A. Scoping phase
Define temporal scale(s) of the
assessment
Define spatial scale(s) of the
assessment
Define the assessment levels for
each scale
Select appropriate tools and
methods for the assessment
Identify key cause-and-effect
mechanisms
Spatial Temporal
Notes
Estimate the range of natural
variability and relative condition for
the resource (s) in concern
Identify past, present and expected
future activities
Assess the HI of the actions at
each scale and level
Evaluate the validity and sensitivity
of the predicted HI
B. Analysis
phase
Identify possible mitigation ,
modification, planning , and
restoration
C. Manage-
ment &
implication phase
Depending on the
scale and level
Core ecosystem
functions and areas
In HIA: hydrology ,
hydrodynamics and
sediment transport
”Baseline scenario”
Spatio-temporal scales of hydrological impact assessment in large river basins: the Mekong case

59
Scale issues are present in various interrelated steps of the HIA process. Within the scoping phase (Figure 32), the scales, both temporal and spatial, are naturally essential when identifying the temporal and spatial scales for the assessment. Spatial scales are important for identifying the critical issues and resources for primary concern. Those can be located at various different scales, and also be interrelated with each other across the scales. Thus, multi- and cross-scale approaches should be applied to the HIA from the beginning of the process. Both dimensions of scale, spatial and temporal, should be taken into account when defining the assessment levels. The selection of tools and methods will be carried out depending on the assessment levels and scales, tailored for each HIA process separately. It is important to include connectivity between the tools and methods in the process from the outset, and particularly when selecting the tools.
The spatial scale classes are defined for LRBs (see Section 2.2.1), from smallest to largest scale, as: local, tributary, sub-basin, basin, regional, continental and global. The definition of the classes is based on the selected boundaries derived from the geographical areas, such as areas of LRBs. The exact definitions for the extent of the scale classes are, however, very difficult to make as the area of LRBs already varies within one order of magnitude. Therefore, the scale class boundaries for LRB should be taken as indicative only and applied to each of the basins separately, as is done here for the Mekong.
The temporal scales in the HIA are based mostly on the human-developed concept of time. Natural phenomena do not, however, normally follow this
6.2.1 SCOPING PHASE
concept and events may occur e.g. episodically or cyclically (Lovell et al. 2002). These natural time concepts should always be taken into account in the time scales of an assessment.
Although it is necessary to define the spatial and temporal scales separately for the processes and impacts, it is essential to analyse the impacts in both dimensions together. Therefore the use of spatio-temporal scales is important within the HIA discipline. The spatio-temporal scales of hydrological impacts, analysed in Section 2.4.1, are only suggestive, as they depend on the project location and size among many other factors. Therefore, the scales should always be defined in more detail for each case separately.
Hydrological processes happen slower in the large scale (Blöschl and Sivapalan 1995) and naturally the same phenomenon can be observed in the hydrological consequences of the actions (see Section 2.4.1). Moreover, the impacts may differ from scale to scale. For example, a reservoir operation may increase the short term water level fluctuation close to the dam whereas further downstream the flow alteration is not that rapid. The exact impacts and spatio-temporal scales of those vary significantly depending on the river and human action(s) in question.
The processes should ideally be observed at the scale at which they occur (Blöschl and Sivapalan 1995). Therefore, it is important to define and understand both process and observation scales of the phenomena in question. Both of the scales can be defined from three points of view: extent, spacing and integration volume. The process scale of hydrological phenomena has been discussed in the literature (e.g. Blöschl and Sivapalan 1995). In this thesis the spatial and temporal observation scales for the selected data categories of HIA (see Section 3.1) were defined. The observation scales are, however, difficult to define precisely as the measurement equipment varies significantly. Thus, the analysis offers only rough guidelines for the observation scales.
the other hand, the hydrological impacts are the natural base for broader impact assessment when examining the consequences of water resources related development actions in a basin. Therefore, the work presented here could be seen as a base for the impact assessments conducted in other disciplines.
6 Discussion: scales as part of the HIA process

60
Scales are equally part of various components within the analysis phase of the HIA process (Figure 32). Both scales should be included to some extent when identifying the key cause-and-effect mechanisms, as the causes and effects can be located at different spatial scales, while the temporal scale of the different actions affecting the causes is essential particularly within the cumulative effects. To estimate the baseline conditions and natural variability for the resources in concern, the temporal scales are especially important in data issues regarding the analysis. Temporal scales should also be taken into account when identifying past, present and future activities. These also have an effect on the temporal scales of the entire assessment process by defining the appropriate time span(s) for it. In the assessment step itself, the scales and levels naturally play a key role as defined in the previous steps.
Dynamic models and statistical analysis are the core tools of the HIA process. Data and models are, however, scale dependent and have a certain area or extent over which the model assumptions are valid (Lilburne 2000). Therefore the analysis and model scales were derived from the selected tools used in HIA (see Section 4.1). The tools analysed represent the principal variety of tools normally used within the HIA process. They do not cover all the tools available but presumably the most common ones. Also, there are numerous different hydrological and hydrodynamic models, and therefore it would not be possible to analyse in detail the scales for a specific model. The description of the analysis scales should be, for that reason, seen as a rough attempt to link the selected tools, as part of the HIA process, with the spatio-temporal scale. The connectivity across the scales and levels is a crucial part of the assessment and requires more attention in future research.
Scaling, either down- or upscaling, is often used in environmental studies. This is the case particularly when dealing with phenomena within and across various scales. Conduct scaling across
6.2.2 Analysis phase
This thesis has mainly addressed issues pertaining to the scoping and analysis phases with full awareness of the importance of the management and implication phase (Figure 32). Scales are, however, as important in this phase as in the first two ones but not discussed in further detail here.
6.2.3 Management and implication phase
heterogeneous ecosystems has, however, remained a great challenge (Wu and Li 2006b). Scaling does introduce new errors and, consequently, uncertainties into the process (e.g. Rotmans 2002)68. Moreover, scaling in hydrology in particular has had limited progress, and plenty of conceptual work remains still to be done in that field (Blöschl 2001). Consequently, a multiscale approach is often more suitable than down-or upscaling. Selecting the critical processes and areas for IA is crucial for an effective impact assessment. These processes and areas need to be addressed at the different scales, and thus, the tools selected for the assessment need to be suitable for the scale at which the assessment is being conducted. Also Heuvelink (1998), among others, suggests that set of alternatives models, one for each scale of application, should be applied in environmental modelling.
Connectivity between the scales in the multi- and cross-scale approach is an important issue to take into account. The connectivity between the different mathematical models, being either on distinct levels or scales, is normally compiled through various boundary conditions. Boundary conditions and their definitions are an extremely important issue in modelling and require careful attention. In this work the connectivity has been briefly discussed but a more detailed analysis and discussion would be needed in the future.
68 See also Section 2.1.7.
Spatio-temporal scales of hydrological impact assessment in large river basins: the Mekong case

7 CONCLUSIONS
“… scale is undoubtedly one of the most fundamental aspects of any research.”
(Goodchild and Quattrochi 1997: 1)
Although the importance of scale has been widely recognised, it has not, however, been discussed extensively within the impact assessment discipline. The scales have, nevertheless, been covered rather well in many of the disciplines related to IA, such as, and particularly, ecology, geography and hydrology. This thesis has aimed to discuss and analyse the spatio-temporal scales within the hydrological impact assessment field with a special focus on large river basins. The different scales of practical HIA work at the Mekong basin have been presented through seven case studies in appended papers. The scale of the case studies ranges from local to regional scale.
The spatial and temporal scale classes have been identified in a large river basin context to support the HIA process. Scales are particularly important when identifying the critical processes and areas of possible consequences, selecting the spatio-temporal scales of the assessment, identifying the data needed and available, selecting the methodologies and tools related to the process, and presenting the results of the assessment to the decision-makers and planners. Therefore, scale might serve as a tool for providing a common framework for the multi-disciplinary IA process.
The three-tiered conceptualisation69 of scale organising by Wu and Li (2006a) was used as a base for the scale approach of the thesis (see Figure 4). The dimensions of scale have built the framework for the work, containing spatial and temporal scales, and organisational levels. The levels of this work are hydrology, hydrodynamics and sediment transport, forming the sub-disciplines of the
61
HIA. The structure of the thesis was partly built on the second hierarchy level of the three-tiered concept (see Figure 4B): process and observation scales were analysed in Chapter 3 and analysis and modelling scales in Chapter 4. The elements of the third hierarchy level, i.e. components of scale70 (see Figure 4C), are present in every phase of the analyses being an integral part of the analysis process.
Scale issues are present in various interrelated steps of the HIA process. The HIA process itself can be divided into three main phases: a) scoping phase; b) analysis phase; and c) management and implication phase. Each of the phases has been further divided into interrelated steps. The spatio-temporal scales run through the whole process and should be included in most of the interrelated steps. The scales should be recognised as an integral part of any IA process and taken into account from the beginning of the assessment process.
Scaling is often part of environmental studies, especially when dealing with phenomena within and across various scales. Scaling does, however, introduce new errors and consequently, uncertainties into the process (e.g. Rotmans 2002). The literature (e.g. Blöschl 2001; Lebel 2006) suggests that, instead of down-/up-scaling, a multiscale approach might often be a more suitable solution. This seems to be the case also in the HIA field. The multiscale approach is needed in various steps of the HIA, e.g. when selecting the critical processes and areas likely to be impacted by the action(s), selecting the tools for the HIA process, and conducting the HIA itself. The
61
69 The three-tiered conceptualisation consists of dimensions, kinds, and components of scale. See Section 2.1.1. 70 Particularly extent, spacing and grain.

62
Mekong case-studies support the suggestion to use multiscale and cross-scale approaches instead of scaling, particularly in the HIA process. Multiscale and cross-scale approaches, on the other hand, highlight the importance of connectivity between the scales. The well selected and defined boundary conditions e.g. between models of different scales are an important component of the assessment. Particular attention should therefore be paid to the connectivity between the scales within the HIA process.
The Mekong case studies address some of the most important issues within the HIA field in the LRB context. Although the HIA covers only part of the IA field, it can be considered to form a good basis for further IA studies on ecosystem functions, people’s livelihoods, etc. This is the case particularly in the productive floodplain systems where the possible hydrological impacts first need to be well understood before further assessment of e.g. ecosystem or socio-economic processes. Development issues are only part of future water stress in large river basins as climate change may have a significant impact on many areas in the future. For the Mekong floodplains particularly the rising sea level will be a challenge and should be addressed in future cumulative impact assessments along with development issues. The temporal scale is therefore crucial when conducting CIA as each of the development and climate change scenarios has a time span of its own.
The sustainable development of the Mekong water resources, among many other LRBs, will be an extremely challenging task for the riparian countries in the future. Finding a balance between development and ecosystem well-being should be aimed for. Many of the Mekong case studies conclude that there is an urgent need for more profound, sound and independent research to assess cumulative impacts on multiple scales and across the levels (or sectors) of the mushrooming development projects within the basin. Equally important, however, would be the enhanced communication between researchers, planners and decisions-makers, included in the cross-boundary planning process. Transparent
and objective research results do not help towards sustainable development if this part of the chain is not well connected. Incorporating the scale issues more comprehensively into the impact assessment process might serve as part of the chain of connection.
In summary, this PhD thesis has resulted in the following principal new scientific findings:
a) Scale issues were analysed and discussed in the thesis in the large river basin context with a special focus on the data and methodologies used within hydrological impact assessment. The main findings and results include:
i. Large river basins were defined explicitly and listed based on the basin area. Various global GIS databases containing the largest river basins were compared to select the best quality dataset to be used for the definition.
ii. The spatio-temporal scale classes were identified and analysed within the LRB context
iii. The spatio-temporal observation scales were identified and analysed for selected data categories to support the data collection within the HIA process
iv. The spatio-temporal model and analysis scales were identified and analysed for the selected HIA tools to support the HIA process
v. The HIA process phases and their interrelated steps were identified and the interrelationships between the spatial and temporal scales and each of the process steps were discussed.
b) HIA in the Mekong Basin was conducted at various scales with new results supporting the understanding of the development consequences. The main findings and results include:
i. Regional review of the impacts of land surface changes on hydrology, identifying the main changes and their possible consequences
Spatio-temporal scales of hydrological impact assessment in large river basins: the Mekong case

63
during the last decades; synthesis of the most important sources of scientific uncertainty and entry points to scientific debate; and a concise set of priority fields for future research (Paper I)
ii. Analysis of sediment trapping in the planned cascade of dams in the Yunnan, China, with analysis of the possible consequences for geomorphology in the future, and specific analysis of the suspended sediment transport in the Lower Mekong Basin mainstream (Paper II)
iii. Detailed HIA for the Tonle Sap Lake, Cambodia, including the baseline paper of the ecosystem functions and description of the integrated modelling system for the lake; impact analysis of the Mekong flow alteration, due to the upstream development, on Tonle Sap Lake flood pulse characteristics; and elaborated analysis of sedimentation and sediment transport dynamics of the lake. The flood pulse is the key driver of the high productivity of the lake-floodplain system and therefore, it should be maintained in a natural condition to preserve the productive ecosystem (Papers III, IV, V).
iv. Historical analysis of the consequences of intensive water management on the local hydrology in Angkor and dividing the area into three water management zones to enhance the understanding of water management practices there (Paper VI). The paper concludes that impacts of different kinds of human actions should be examined with a much longer term perspective than is presently employed.
v. Bank erosion assessment in the Vientiane - Nong Khai section of the Mekong concluding that the bank erosion rates there are very low on a global scale – one magnitude lower that in other rivers with similar size of catchment – but may, however, result in significant consequences e.g. for the local infrastructure (Paper VII).
It should be noted that even though the thesis was delimited to analyse and discuss scale issues in a rather narrow sub-field of the broader IA discipline, this was done with full awareness that the issues presented here are part of the broader assessment field and should be studied using a multi- and interdisciplinary approach. On the other hand, although this thesis discusses hydrological impact assessment, i.e. limiting the view point to hydrology, hydrodynamics and sediment transport, many of the ideas presented here are not domain-specific and can be applied outside this domain.
7 Conclusions

64

65
REFERENCES
Adamson, P.T., 2001. Hydrological perspectives on the Lower Mekong Basin - the potential impacts of hydropower developments in Yunnan on the downstream flow regime. International Water Power and Dam Construction, March 2001: 16-21.
Adamson, P.T., 2008. Presentation in Regional Workshop on Discharge and Sediment Monitoring and Geomorphological Tools for the Lower-Mekong Basin, Mekong River Commission, Vientiane, Lao PDR. October 2008.
ADB, 2004. Cumulative impact analysis and Nam Theun 2 contributions, Final report. Prepared by NORPLAN and EcoLao for Asian Development Bank. 143 pp.
ADB, 2007. Asian water development outlook 2007: Achieving water security for Asia, Asian Development Bank (ADB), Singapore, xii+51 pp.
Allen, T.F.H. and Hoekstra, T.W., 1990. The Confusion between Scale-Defined Levels and Conventional Levels of Organization in Ecology. Journal of Vegetation Science, 1(1): 5-12.
Allen, T.F.H. and Starr, T.B., 1982. Hierarchy: perspectives for ecological complexity. The University of Chicago Press, Chicago, 328 pp.
Andréasson, J., Bergström, S., Carlsson, B., Graham, L.P. and Lindström, G., 2004. Hydrological Change – Climate Change Impact Simulations for Sweden. Ambio, 33(4): 228–234.
Barker, R. and Molle, F., 2004. Evolution of irrigation in South and Southeast Asia, Colombo, Sri Lanka: Comprehensive Assessment Secretariat. (Comprehensive Assessment Research Report 5), 55 pp.
Bastos, W.R., Gomes, J.P.O., Oliveira, R.C., Almeida, R., Nascimento, E.L., Bernardi, J.V.E., de Lacerda, L.D., da Silveira, E.G. and Pfeiffer, W.C., 2006. Mercury in the environment and riverside population in the Madeira River Basin, Amazon, Brazil. Science of The Total Environment, 368(1): 344-351.
Becker, A. and Braun, P., 1999. Disaggregation, aggregation and spatial scaling in hydrological modelling. Journal of Hydrology, 217(3-4): 239-252.
Berndtsson, R. and Niemczynowicz, J., 1988. Spatial and temporal scales in rainfall analysis - Some aspects and future perspectives. Journal of Hydrology, 100(1-3): 293-313.
Beven, K., 1989. Changing ideas in hydrology - The case of physically-based models. Journal of Hydrology, 105(1-2): 157-172.
Blöschl, G., 2001. Scaling in hydrology. Hydrological Processes, 15(4): 709-711.
Blöschl, G. and Sivapalan, M., 1995. Scale issues in hydrological modelling: A review. Hydrological Processes, 9(3-4): 251-290.
Blöschl, G. and Sivapalan, M., 1997. Process Controls on Regional Flood Frequency: Coefficient of Variation and Basin Scale. Water Resources Research, 33(12): 2967-2980.
Blöschl, G., Sivapalan, M., Gupta, V., Beven, K. and Lettenmaier, D., 1997. Preface to the Special Section on Scale Problems in Hydrology. Water Resources Research, 33(12): 2881.
Bonheur, N., 2001. Tonle Sap ecosystem and value, Technical Coordination Unit for Tonle Sap, Ministry of Environment, Phnom Penh, Cambodia, 21 pp.
Brandt, S.A., 2000. Classification of geomorphological effects downstream of dams. Catena, 40(4): 375-401.
Brouwer, R. and van Ek, R., 2004. Integrated ecological, economic and social impact assessment of alternative flood control policies in the Netherlands. Ecological Economics, 50(1-2): 1-21.
Bruijnzeel, L.A., 2004. Hydrological functions of tropical forests: not seeing the soil for the trees. Agriculture, Ecosystems & Environment, 104: 185-228.
Brune, G.M., 1953. Trapping Efficiency of Reservoirs. Transactions American Geophysical Union, 34(3): 407-418.
Burger, G. and Chen, Y., 2005. Regression-based downscaling of spatial variability for hydrologic applications. Journal of Hydrology, 311(1-4): 299-317.
Cash, D.W., Adger, W.N., Berkes, F., Garden, P., Lebel, L., Olsson, P., Pritchard, L. and Young, O., 2006. Scale and Cross-Scale Dynamics: Governance and Information in a Multilevel World. Ecology and Society, 11(2): 8. [online] URL: http://www.ecologyandsociety.org/vol11/iss2/art8/.
Church, M. and Mark, D.M., 1980. On size and scale in geomorphology. Progress in Physical Geography, 4: 342-390.
Cooper, L.M., 2004. Guidelines for Cumulative Effects Assessment in SEA of Plans, EPMG Occasional Paper 04/LMC/CEA, Imperial College London. 49 p.
de Boer, D.H., 1992. Hierarchies and spatial scale in process geomorphology: a review. Geomorphology, 4(5): 303-318.
Dooge, J.C.I. and Bruen, M., 1997. Scaling Effects on Moisture Fluxes at Unvegetated Land Surfaces. Water Resources Research, 33(12): 2923-2927.
References
66
Douglas, I., 1999. Hydrological investigations of forest disturbance and land cover impacts in South-East Asia: a review. Philosophical Transactions of the Royal Society of London, 354: 1725-1738.
Dozier, J., 1992. Opportunities to Improve Hydrologic Data. Reviews of Geophysics, 30(4): 315-331.
Dungan, J.L., Perry, J.N., Dale, M.R.T., Legendre, P., Citron-Pousty, S., Fortin, M.J., Jakomulska, A., Miriti, M. and Rosenberg, M.S., 2002. A balanced view of scale in spatial statistical analysis. 25(5): 626-640.
Dynesius, M. and Nilsson, C., 1994. Fragmentation and flow regulation of river systems in the northern third of the world. Science, 266: 753-762.
Enters, 2005. Forests and floods - Drowning in fiction or thriving on facts? RAP Publication 2005/03. Forest Perspectives 2. Center for International Forestry Research, Food and Agriculture Organization (FAO) of the United Nations, 40 pp.
Ettema, R., 2005. Rivers Viewed through Names and Epithets. Journal of Hydraulic Engineering, 131(7): 535-541.
European Commission, 2008. European Commission home page: Environmental Impact Assessment. On-line resource: http://ec.europa.eu/environment/archives/eia/eia-legalcontext.htm. Accessed on 12th of May 2008.
Evans, D., Pottier, C., Fletcher, R., Hensley, S., Tapley, I., Milne, A. and Barbetti, M., 2007. A comprehensive archaeological map of the world’s largest preindustrial settlement complex at Angkor, Cambodia. Proceedings of the National Academy of Sciences of the United States of America, 104(36): 14277-14282
Evans, T.P., Ostrom, E. and Gibson, C., 2002. Scaling Issues With Social Data in Integrated Assessment Modeling. Integrated Assessment, 3(2-3): 135-150.
FAO AQUASTAT Database, 2007. FAO’s Information System on Water and Agriculture. Food and Agriculture Organisation of the United Nations (FAO). Accessed on September 2007: http://www.fao.org/nr/water/aquastat/main/index.stm.
Fekete, B., Vörösmarty, C.J. and Grabs, W., 1999. Global, composite runoff fields based on observed river discharge and simulated water balance, World Meteorological Organization, Global Runoff Data Center, Report No. 22, Koblenz, Germany, 109 pp.
Finlayson, C.M. and Spiers, A.G., 1999. Global review of wetland resources and priorities for wetland inventory, Supervising Scientist Report 144 / Wetlands International Publication 53, Supervising Scientist, Canberra, Australia, 524 pp.
Fu, K.D., He, D.M. and Lu, X.X., 2008. Sedimentation in the Manwan reservoir in the Upper Mekong and its downstream impacts. Quaternary International, 186(1): 91-99.
Fuji, H., Garsdal, H., Ward, P., Ishii, M., Morishita, K. and Boivin, T., 2003. Hydrological roles of the Cambodian floodplain of the Mekong River. International Journal of River Basin Management, 1(3): 1–14.
Gibson, C.C., Ostrom, E. and Ahn, T.K., 2000. The concept of scale and the human dimensions of global change: a survey. Ecological Economics, 32(2): 217-239.
Global Runoff Data Centre, 2007. Major River Basins of the World. GRDC in the Bundesanstalt fuer Gewaesserkunde, 56068 Koblenz, Germany, http://grdc.bafg.de
Goodchild, M.F. and Quattrochi, D.A., 1997. Introduction: scale, multiscaling, remote sensing and GIS. In: D.A. Quattrochi and M.F. Goodchild (Editors), Scale in Remote Sensing and GIS. Lewis Publishers. Boca Raton. pp. 1-11.
Grant, G.E., Schmidt, J.C. and Lewis, S.L., 2003. A Geological Framework for Interpreting Downstream Effects of Dams on Rivers. In: J.E. O’Connor and G.E. Grant (Editors), A Peculiar River. Water Science and Application 7. American Geophysical Union, pp. 203-219.
Gupta, V.K., Rodríguez-Iturbe, I. and Wood, E.F. (Editors), 1986. Scale problems in hydrology. D. Reidel, Dordrecht. 246 pp.
GWP, 2000. Integrated Water Resources Management, 71 pp.
GWSP Digital Water Atlas, 2008. Map 2: Water Resources (Dataset) (V1.0). Global Water System Project (GWSP). Available online at http://atlas.gwsp.org.
Haddeland, I., Lettenmaier, D.P. and Skaugen, T., 2006. Effects of irrigation on the water and energy balances of the Colorado and Mekong river basins. Journal of Hydrology, 324(1-4): 210-223.
Harvey, D., 1969. Explanation in Geography. St. Martin’s Press, New York., xx+521 pp.
Hegmann, G., Cocklin, C., Creasey, R., Dupuis, S., Kennedy, A., Kingsley, L., Ross, W., Spaling, H. and Stalker, D., 1999. Cumulative Effects Assessment Practitioners Guide, Prepared for Canadian Environmental Assessment Agency by the Cumulative Effects Assessment Working Group AXYS Environmental Consulting Ltd and the CEA Working Group for the Canadian Environmental Assessment Agency, Hull, Quebec. 134 pp.
Spatio-temporal scales of hydrological impact assessment in large river basins: the Mekong case

67
Heuvelink, G.B.M., 1998. Uncertainty analysis in environmental modelling under a change of spatial scale. Nutrient Cycling in Agroecosystems, 50(1): 255-264.
Holling, C.S., 1993. Investing in Research for Sustainability. Ecological Applications, 3(4): 552-555.
IAIA, 1999. Principle of Environmental Impact Assessment Best Practice, International Association for Impact Assessment (IAIA), available online at http://www.iaia.org/modx/assets/files/Principles%20of%20IA_web.pdf. 4 pp.
IAIA, 2008. International Association for Impact Assessment (IAIA) home page. On-line resource, accessed on 7th of May 2008: http://www.iaia.org/.
Jackson, S. and Sleigh, A., 2000. Resettlement for China’s Three Gorges Dam: socio-economic impact and institutional tensions. Communist and Post-Communist Studies, 33(2): 223-241.
JICA, 1999. Cambodia reconnaissance survey digital data, Ministry of Public Works and Transportation (MPWT), Kingdom of Cambodia. Japan International Cooperation Agency (JICA), Japan, March 1999.
João, E., 2000. The Importance of Scale Issues in Environmental Impact Assessment and the Need for Scale Guidelines, Research Papers in Environmental and Spatial Analysis No. 62 (Department of Geography and Environment, London School of Economics).
João, E., 2002. How scale affects environmental impact assessment. Environmental Impact Assessment Review, 22(4): 289-310.
João, E., 2007a. The importance of data and scale issues for Strategic Environmental Assessment (SEA). Environmental Impact Assessment Review, 27(5): 361-364.
João, E., 2007b. A research agenda for data and scale issues in Strategic Environmental Assessment (SEA). Environmental Impact Assessment Review, 27(5): 479-491.
Jones, K.B., Li, H., Loucks, O.L. and Wu, J., 2006. Scaling and Uncertainty Analysis in Ecology: Methods and Applications, xviii+351 pp.
Junk, W.J., 1997. The Central Amazon Floodplain: Ecology of a pulsing system. Springer, Berlin, Ecological Studies 126, 525 pp.
Junk, W.J. and Wantzen, K.M., 2004. The Flood Pulse Concept: New Aspects, Approaches, and Applications - an Update. In: R.L. Welcomme and T. Petr (Editors), Proceedings of the Second International Symposium on the Management of Large Rivers for Fisheries, Volume 2. Food and Agriculture Organization & Mekong River Commission. FAO Regional Office for Asia and the Pacific, Bangkok. RAP Publication 2004/16, pp. 117-149. Available on-line at http://www.lars2.org.
Keskinen, M., 2006. The Lake with Floating Villages: A socio-economic analysis of the Tonle Sap Lake. International Journal of Water Resources Development, 22(3): 463-480.
Keskinen, M., 2008. Water Resources Development and Impact Assessment in the Mekong Basin: Which Way to Go? Ambio, 37(3): 193-198.
King, P., Bird, J. and Haas, L., 2007. The Current Status of Environmental Criteria for Hydropower Development in the Mekong Region: A Literature Compilation, Consultants Report to ADB (Asian Development Bank), MRCS (Mekong River Commission Secretariat) and WWF (World Wide Fund for Nature), Vientiane, Lao PDR, xv+155 pp.
Klemeš, V., 1983. Conceptualisation and scale in hydrology. Journal of Hydrology, 65(1): 1-23.
Kolata, A.L. and Cunningham, A.F., 2005. Human-ecology of the Tonle Sap lake. In Focus Magazine(2): 12-14.
Lam, N., Catts, D., Quattrochi, D., Brown, D. and McMaster, R., 1996. Scale. In: R. McMaster and E.L. Usery (Editors), A Research Agenda for Geographic Information Science. University Consortium for Geographic Information Science (UCGIS), pp. 1-36.
Lam, N.S.-N. and Quattrochi, D.A., 1992. On the issues of Scare, Resolution, and Fractal Analysis in the Mapping Sciences. Professional Geographer, 44(1): 88-98.
Lamberts, D., 2006. The Tonle Sap Lake as a productive ecosystem. International Journal of Water Resources Development, 22(3): 481–495.
Lamberts, D., 2008. Little impact, much damage: the consequences of Mekong River flow alterations for the Tonle Sap ecosystem. In: M. Kummu, M. Keskinen and O. Varis (Editors), Modern Myths of the Mekong - A Critical Review of Water and Development Concepts, Principles and Policies. Water & Development Publications - Helsinki University of Technology. Finland, pp. 3-18.
Lebel, L., 2006. The politics of scale in environmental assessment. In: W. Reid, F. Berkes, T. Wilbanks and D. Capistrano (Editors), Bridging scales and epistemologies: linking local knowledge and global science in environmental assessments. Island Press, Washington, D.C., USA, pp. 37-57.
Lebel, L., Garden, P. and Imamura, M., 2005. The politics of scale, position and place in the management of water resources in the Mekong region. Ecology and Society, 10(2): 18. Available online at http://www.ecologyandsociety.org/vol10/iss2/art18
Levin, S.A., 1992. The Problem of Pattern and Scale in Ecology: The Robert H. MacArthur Award Lecture. Ecology, 73(6): 1943-1967.
References

68
Lilburne, L., 2000. Characterising an Environmental Problem in Terms of its Scale Requirements, SIRC 2000 – The 12th Annual Colloquium of the Spatial Information Research Centre, University of Otago, Dunedin, New Zealand. December 10-13th 2000. 10 pp.
Liu, S., Lu, P., Liu, D. and Jin, P., 2007. Pinpointing source of Mekong and measuring its length through analysis of satellite imagery and field investigations. Geo-Spatial Information Science, 10(1): 51-56.
Lovell, C., Mandondo, A. and Moriarty, P., 2002. The question of scale in integrated natural resource management. Conservation Ecology, 5(2): 25. [online] URL: http://www.consecol.org/vol5/iss2/art25/
Lu, X.X. and Siew, R.Y., 2006. Water discharge and sediment flux changes over the past decades in the Lower Mekong River: possible impacts of the Chinese dams. Hydrology and Earth System Sciences, 10: 181-195.
MacDonald, L.H., 2000. Evaluating and Managing Cumulative Effects: Process and Constraints. Environmental Management, 26(3): 299-315.
Mahapatr, K. and Kant, S., 2005. Tropical deforestation: a multinomial logistic model and some country-specific policy prescriptions. Forest Policy and Economics, 7(1): 1-24.
McNeill, J.R. and McNeill, W.H., 2003. The Human Web: A Bird’s-Eye View of World History. W. W. Norton & Company, 368 pp.
Meentemeyer, V., 1989. Geographical perspectives of space, time and scale. Landscape Ecology, 3(3/4): 163-173.
Mekong River Commission, 1992. Hydrographical atlas for Mekong, Surveyed by Department of Energy Development and Promotion, Thailand; and Department of Communication, Lao PDR. Surveyed in 1989-1992, aerial photography in 1991/92.
Mekong River Commission, 2005. Overview of the hydrology of the Mekong Basin, Mekong River Commission, Vientiane, November 2005, 73 pp.
Mekong River Commission, 2006. Spatial databases of Mekong River Commission, Mekong River Commission (MRC), Vientiane, Lao PDR.
Merz, B. and Plate, E.J., 1997. An Analysis of the Effects of Spatial Variability of Soil and Soil Moisture on Runoff. Water Resources Research, 33(12): 2909-2922.
Merz, R., Blöschl, G. and Parajka, J., 2006. Spatio-temporal variability of event runoff coefficients. Journal of Hydrology, 331(3-4): 591-604.
Millennium Ecosystem Assessment, 2005. Ecosystems and human well-being: wetlands and water synthesis, World Resources Institute, Washington, DC, 74 pp.
MoWRaM, 2006. Hourly water level data from Chaktomuk confluence. Ministry of Water Resources and Meteorology (MoWRaM), Cambodia
MRCS/WUP-FIN, 2007. Final Report - Part 2: research findings and way forward, WUP-FIN Phase 2 - Hydrological, Environmental and Socio-Economic Modelling Tools for the Lower Mekong Basin Impact Assessment. Mekong River Commission and Finnish Environment Institute Consultancy Consortium, Vientiane, Lao PDR. 126 pp. Available on-line at http://www.eia.fi/wup-fin/wup-fin2/publications.htm.
Nilsson, C., Reidy, C.A., Dynesius, M. and Revenga, C., 2005. Fragmentation and flow regulation of the world’s large river systems. Science 308: 405-408.
O’Neill, R.V., Johnson, A.R. and King, A.W., 1989. A hierarchical framework for the analysis of scale. Landscape Ecology, 3(3/4): 193-205.
O’Neill, R.V., Turner, S.J., Cullinan, V.I., Coffin, D.P., Cook, T., Conley, W., Brunt, J., Thomas, J.M., Conley, M.R. and Gosz, J., 1991. Multiple landscape scales: an intersite comparison. Landscape Ecology, 5(3): 137-144.
Ortolano, L. and Shepherd, A., 1995. Environmental impact assessment: challenges and opportunities. Impact Assessment, 13(1): 3-30.
Penny, D., Cook, G. and Sok, S.I., 2005. Long-term rates of sediment accumulation in the Tonle Sap, Cambodia: a threat to ecosystem health. Journal of Paleolimnology, 33(1): 95-103.
Petts, J., 1999. Introduction to environmental impact assessment in practice: fulfilled potential or wasted opportunity? In: J. Petts (Editor), Handbook of Environmental Impact Assessment Vol II: Environmental impact assessment in practice: Impact and limitations. Blackwell Science, London, pp. 3-9.
Pickett, S.T.A. and Cadenasso, M.L., 1995. Landscape Ecology: Spatial Heterogeneity in Ecological Systems. Science, 269(5222): 331-334.
Poulsen, A.F., Poeu, O., Viravong, S., Suntornratana, U. and Thung, N.T., 2002. Fish migrations of the Lower Mekong River Basin: implications for development, planning and environmental management, MRC Technical Paper, Mekong River Commission, Phnom Penh, 62 pp.
Quinn, P., 2004. Scale appropriate modelling: representing cause-and-effect relationships in nitrate pollution at the catchment scale for the purpose of catchment scale planning. Journal of Hydrology, 291(3-4): 197-217.
Spatio-temporal scales of hydrological impact assessment in large river basins: the Mekong case

69
Quinn, P.F., Hewett, C.J.M. and Doyle, A., 2004. Scale appropriate modelling: from mechanism to management. In: I. Tchiguirinskaia, M. Bonell and P. Hubert (Editors), Scales in Hydrology and Water Management. IAHS Publication 287, joint IAHS/IHP-UNESCO publication, Wallingford, Oxfordshire, UK, pp. 17-38.
Rainboth, W.J., 1996. FAO species identification field guide for fishery purposes. Fishes of the Cambodian Mekong, FAO (Food and Agriculture Organization of the United Nations), Rome, 265 pp.
Revenga, C., Murray, S., Abramovitz, J. and Hammond, A., 1998. Watersheds of the World: Ecological Value and Vulnerability, World Resources Institute, Washington, DC. Available online at http://earthtrends.wri.org/text/water-resources/maps.html.
Robinson, J.S. and Sivapalan, M., 1997. Temporal Scales and Hydrological Regimes: Implications for Flood Frequency Scaling. Water Resources Research, 33(12): 2981-2999.
Rotmans, J., 2002. Scaling in Integrated Assessment: Problem or Challenge? Integrated Assessment, 3: 266-279.
Rotmans, J. and Rothman, D. (Editors), 2003. Scaling Issues in Integrated Assessment. Swets & Zeitlinger, Lisse, The Netherlands, 376 pp.
Rutherfurd, I., Bishop, P. and Walker, M., 1996. Historical changes in the channel of the Mekong River: Implications for the border between Thailand and Lao PDR, In: Stensholt (ed.), Workshop Proceedings of the Development Dilemmas in the Mekong Subregion. Melbourne, Australia, pp. 117-127.
Sadler, B., 1996. Environmental Assessment in a Changing World: Evaluating practice to Improve Performance, International Study of the Effectiveness of Environmental Assessment Final Report. International Association for Impact Assessment and Canadian Environment Assessment Agency, Canada, 263 pp.
Schreier, H. and Brown, S., 2004. Multiscale approaches to watershed management: land-use impacts on nutrient and sediment dynamics. In: I. Tchiguirinskaia, M. Bonell and P. Hubert (Editors), Scales in Hydrology and Water Management. IAHS Publication 287, joint IAHS/IHP-UNESCO publication, Wallingford, Oxfordshire, UK, pp. 61-75.
Shiklomanov, I.A., 1997. Assessment of the Freshwater Resources and Water Availability in the World, In: Comprehensive assessment of the freshwater resources of the world. Stockholm Environment Institute, Stockholm, Sweden. 88 pp.
Shiklomanov, I.A., 1999. World water resources and their use, Joint product of State Hydrological Institute (SHI), St. Petersburg and UNESCO International Hydrological Programme (IHP). Available online at http://webworld.unesco.org/water/ihp/db/shiklomanov/ (accessed November 4th 2008).
Sivapalan, M., 2003a. Prediction in ungauged basins: a grand challenge for theoretical hydrology. Hydrological Processes, 17(15): 3163-3170.
Sivapalan, M., 2003b. Process complexity at hillslope scale, process simplicity at the watershed scale: is there a connection? Hydrological Processes, 17(5): 1037-1041.
Stahl, K., 2007. Hydrology of the World’s International River Basins: Hydrological parameters for use in global studies of international water-relations, GRDC Report 37. Global Runoff Data Centre (GRDC) under World Meteorological Organisation (WMO), 56 pp.
Stein, J.K. and Linse, A.R. (Editors), 1993. Effects of scale on archaeological and geological perspectives. Special Paper 283; Geological Society of America, Boulder, CO. 91 pp.
Stewart-Oaten, A. and Bence, J.R., 2001. Temporal and spatial variation in environmental impact assessment. Ecological Monographs, 71(2): 305-339.
Sverdrup-Jensen, S., 2002. Fisheries in the Lower Mekong Basin: Status and perspectives, MRC Technical Paper No. 6, Mekong River Commission, Phnom Penh. 103 pp. ISSN: 1683-1489.
Szent-Gyorgyi, A., 1972. The living state with Observations on cancer. New York Academic Press
Tchiguirinskaia, I., Schertzer, D., Hubert, P., Bendjoudi, H. and Lovejoy, S., 2004. Multiscaling geophysics and sustainable development. In: I. Tchiguirinskaia, M. Bonell and P. Hubert (Editors), Scales in Hydrology and Water Management. IAHS Publication 287, joint IAHS/IHP-UNESCO publication, Wallingford, Oxfordshire, UK, pp. 113-136.
Therivel, R. and Ross, B., 2007. Cumulative effects assessment: Does scale matter? Environmental Impact Assessment Review, 27(5): 365-385.
Tsukawaki, S., Okuno, M. and Nakamura, T., 1997. Sedimentation rates in the northern part of lake Tonle Sap, Cambodia, during the last 6 000 years. Summaries of Researchers Using AMS at Nagoya University, 8: 125-133.
Turner, M.G., Dale, V.H. and Gardner, R.H., 1989a. Predicting across scales: theory development and testing. Landscape Ecology, 3(3/4): 245-252.
Turner, M.G., O’Neill, R.V., Gardner, R.H. and Milne, B.T., 1989b. Effects of changing spatial scale on the analysis of landscape pattern. Landscape Ecology, 3(3/4): 153-162.
References

70
UN/WWAP, 2006. United Nations World Water Development Report 2: Water a shared responsibility, World Water Assessment Programme (WWAP) of the United Nations Educational, Scientific and Cultural Organization (UNESCO), Paris, France, xv+584 pp.
UNEP, 2007. Global Environment Outlook: environment for development (GEO-4), United Nations Environment Programme (UNEP), Nairobi, Kenya, xxxi+540 pp.
USGS, 2001. Drainage Basins of the World. Part of Global GIS Database by U.S. Geological Survey (USGS), http://webgis.wr.usgs.gov/globalgis/.
Van De Wiel, M.J., 2003. Numerical Modelling of Channel Adjustment in Alluvial Meandering Rivers with Riparian Vegetation, PhD Thesis, Department of Geography, University of Southampton, Southampton, UK.
Vanclay, F., 2004. Impact assessment and the triple bottom line: Competing pathways to sustainability? In: H. Cheney, E. Katz and F. Solomon (Editors), Sustainability and social science: Round table proceedings. The Institute for Sustainable Futures, Sydney, Australia; and CSIRO Minerals, Melbourne, Australia. Available online at http://www.minerals.csiro.au/sd/pubs/Vanclay_Final.pdf, pp. 27-39.
Vanclay, F. and Bronstein, D., 1995. Editors’ Preface: The state of the art of Impact Assessment. In: F. Vanclay and D. Bronstein (Editors), Environmental and Social Impact Assessment. Wiley, Chichester, pp. xi-xiii.
Varis, O., Keskinen, M. and Kummu, M., 2008. Mekong at the Crossroads. Ambio, 37(3): 146-149.
Vörösmarty, C.J., 2000. Anthropogenic disturbance of the terrestrial water cycle. Bioscience, 50(9): 753-765.
Vörösmarty, C.J., Fekete, B.M. and Tucker, B.A., 1998. Global River Discharge, 1807-1991, V[ersion]. 1.1 (RivDIS). Data set. Available on-line [http://www.daac.ornl.gov] from Oak Ridge National Laboratory Distributed Active Archive Center, Oak Ridge, Tennessee, U.S.A. doi:10.3334/ORNLDAAC/199. .
Vörösmarty, C.J., Sharma, K.P., Fekete, B.M., Copeland, A.H., Holden, J., Marble, J. and Lough, J.A., 1997. The storage and aging of continental runoff in large reservoir systems of the world. Ambio, 26(4): 210-219.
Walker, A., 2002. Forests and water in northern Thailand, Resource Management in Asia-Pacific Program, Research School for Pacific and Asian Studies, The Australian National University, Canberra, 30 pp.
Walling, D.E., 2005. Evaluation and analysis of sediment data from the Lower Mekong River, Report prepared for the Mekong River Commission, 61 pp.
Walling, D.E., 2006. Human impact on land–ocean sediment transfer by the world’s rivers. Geomorphology, 79(3-4): 192-216.
Walling, D.E., 2008. The changing sediment load of the Mekong. Ambio, 37(3): 150-157.
Water Resources eAtlas, 2003. Watersheds of the World-CD. IUCN-The World Conservation Union, the International Water Management Institute (IWMI), the Ramsar Convention Bureau, and the World Resources Institute (WRI). Accessed through internet on July 2005: http://multimedia.wri.org/watersheds_2003/index.html.
Water Words Dictionary, 2008. A Compilation of Technical Water, Water Quality, Environmental, and Water-Related Terms. Nevada Division of Water Resources, Department of Conservation and Natural Resources. Available on-line at http://water.nv.gov/WaterPlanning/dict-1/ww-index.cfm, accessed on March 19th 2008.
Wattenbach, M., Zebisch, M., Hattermann, F., Gottschalk, P., Goemann, H., Kreins, P., Badeck, F., Lasch, P., Suckow, F. and Wechsung, F., 2007. Hydrological impact assessment of afforestation and change in tree-species composition - A regional case study for the Federal State of Brandenburg (Germany). Journal of Hydrology, 346(1-2): 1-17.
WCD, 2000. Dams and development - a new framework for decision-making, World Commission on Dams (WCD), Earthscan Publications Ltd., London, xxxvii + 404 pp.
Western, A.W. and Blöschl, G., 1999. On the spatial scaling of soil moisture. Journal of Hydrology, 217(3-4): 203-224.
Wiens, J.A., 1989. Spatial Scaling in Ecology. Functional Ecology, 3(4): 385-397.
Wikipedia, 2008a. List of drainage basins by area. Available at: http://en.wikipedia.org/wiki/List_of_drainage_basins_by_area. Accessed on 1
st of April 2008.
Wikipedia, 2008b. Wikipedia, the free encyclopedia. www.wikipedia.org (accessed November 4
th 2008).
Woods, R.A., 2004. The impact of spatial scale on spatial variability in hydrologic response: experiments and ideas. In: I. Tchiguirinskaia, M. Bonell and P. Hubert (Editors), Scales in Hydrology and Water Management. IAHS Publication 287, joint IAHS/IHP-UNESCO publication, Wallingford, Oxfordshire, UK, pp. 153-167.
World Bank, 2004. Modelled Observations on Development Scenarios in the Lower Mekong Basin, Prepared for the World Bank with Mekong River Commission cooperation. 142 p.
World Resources Institute, 2006. WRI Major Watersheds of the World Delineation. Published by World Resources Institute (WRI). Available on-line at FAO GeoNetwork: http://www.fao.org/geonetwork. Accessed on March 18
th
2008.
Spatio-temporal scales of hydrological impact assessment in large river basins: the Mekong case

71
Wu, J., Jones, K.B., Li, H. and Loucks, O.L., 2006a. Preface. In: J. Wu, K.B. Jones, H. Li and O.L. Loucks (Editors), Scaling and Uncertainty Analysis in Ecology: Methods and Applications. Springer, pp. xi-xiii.
Wu, J. and Li, H., 2006a. Concept of scale and scaling. In: J. Wu, K.B. Jones, H. Li and O.L. Loucks (Editors), Scaling and Uncertainty Analysis in Ecology: Methods and Applications. Springer, pp. 3-15.
Wu, J. and Li, H., 2006b. Perspectives and methods of scaling. In: J. Wu, K.B. Jones, H. Li and O.L. Loucks (Editors), Scaling and Uncertainty Analysis in Ecology: Methods and Applications. Springer, pp. 17-44.
Wu, J., Li, H., Jones, K.B. and Loucks, O.L., 2006b. Scaling with known uncertainty: A synthesis. In: J. Wu, K.B. Jones, H. Li and O.L. Loucks (Editors), Scaling and Uncertainty Analysis in Ecology: Methods and Applications. Springer, pp. 329-346.
Wunder, S., 2000. The Economics of Deforestation: The Example of Ecuador. St. Martin Press Inc, New York.
Zhou, C. and Guan, Z., 2001. Reconfirmation on Identification of True Source and Headwater of Lancang Jiang (Mekong River). Geographical Research, 20(2): (In Chinese; Translation: Chinese to Japanese by Shiro Kawase, Japanese to English by Tamotsu Nakamura - English translation available on-line at: http://www.shangri-la-river-expeditions.com/1stdes/mekong/mekongsource/IGSNRR2001.html).
Ziegler, A.D., Giambelluca, T.W., Sutherland, R.A., Nullet, M.A., Yarnasarn, S., Pinthong, J., Preechapanya, P. and Jaiaree, S., 2004. Toward understanding the cumulative impacts of roads in upland agricultural watersheds of northern Thailand. Agriculture, Ecosystems & Environment, 104(1): 145-158.
Xu, J.X., 1997. Evolution of mid-channel bars in a braided river and complex response to reservoir construction: an example from the middle Hanjiang River, China. Earth Surface Processes and Landforms, 22(10): 953-965.
References

72
The following abbreviations have been used in the text:
ADCP Acoustic Doubler Current Profiler
AMSL Above Mean Sea Level
CEA Cumulative Effect Assessment
CIA Cumulative Impact Assessment
DEM Digital Elevation Model
DO Dissolved oxygen
EIA Environmental Impact Assessment
EIA Ltd. Environmental Impact Assessment Centre of Finland Ltd.
FAO Food and Agriculture Organisation of the United Nations
GAP Greater Angkor Project
GPS Geographical Positioning System
GRDC Global Runoff Data Centre
GWSP Global Water System Project
HI Hydrological Impact
HIA Hydrological Impact Assessment
IA Impact Assessment
IAIA International Association for Impact Assessment
IRB Intermediate River Basin
IWRM Integrated Water Resources Management
JICA Japan International Cooperation Agency
LMB Lower Mekong Basin
LRB Large River Basin
LRS Large River System
MRC Mekong River Commission
MRCS Mekong River Commission Secretariat
Q Discharge
PDR People’s Democratic Republic
SEA Strategic Environmental Assessment
SPOT Satellite Pour l’Observation de la Terre (Earth observation satellite)
SSC Suspended sediment concentration
TLS Tonle Sap
TSS Total Suspended Solids
USGS United States Geological Survey
WL Water level
WRI World Resources Institute
WUP-FIN Finnish component of the Water Utilisation Programme of MRC; Environmental and Socio-Economic Modelling Tools for the Lower Mekong Basin Impact Assessment Project
ANNEX I: LIST OF ABBREVIATIONS
Spatio-temporal scales of hydrological impact assessment in large river basins: the Mekong case
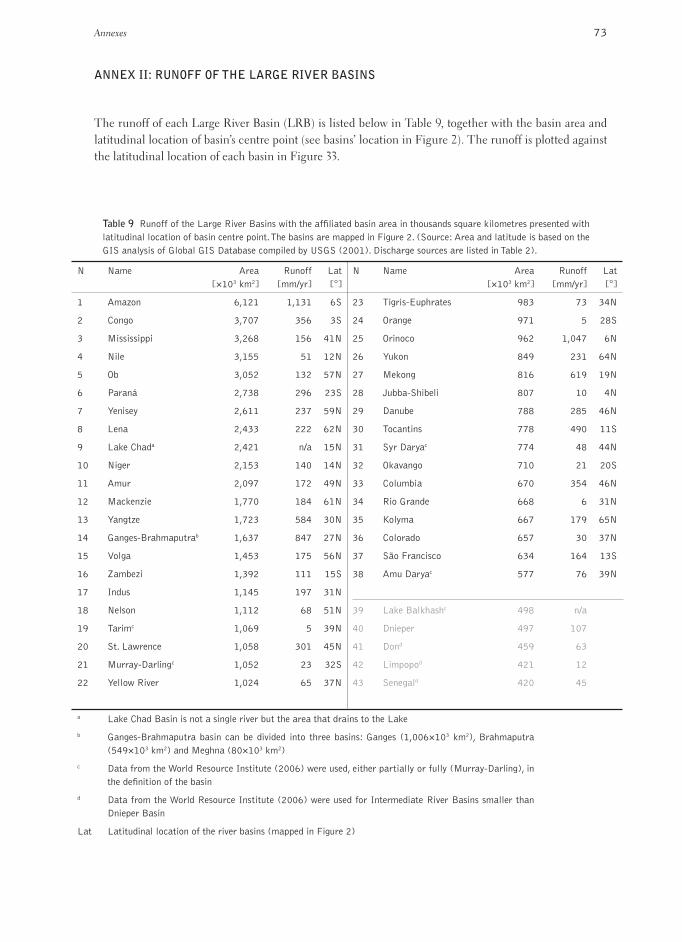
The runoff of each Large River Basin (LRB) is listed below in Table 9, together with the basin area and latitudinal location of basin’s centre point (see basins’ location in Figure 2). The runoff is plotted against the latitudinal location of each basin in Figure 33.
ANNEX II: RUNOFF OF THE LARGE RIVER BASINS
Table 9 Runoff of the Large River Basins with the affi liated basin area in thousands square kilometres presented with latitudinal location of basin centre point. The basins are mapped in Figure 2. (Source: Area and latitude is based on the GIS analysis of Global GIS Database compiled by USGS (2001). Discharge sources are listed in Table 2).
N Name Area [×103 km2]
Runoff [mm/yr]
Lat[°]
N Name Area [×103 km2]
Runoff [mm/yr]
Lat[°]
1 Amazon 6,121 1,131 6S 23 Tigris-Euphrates 983 73 34N
2 Congo 3,707 356 3S 24 Orange 971 5 28S
3 Mississippi 3,268 156 41N 25 Orinoco 962 1,047 6N
4 Nile 3,155 51 12N 26 Yukon 849 231 64N
5 Ob 3,052 132 57N 27 Mekong 816 619 19N
6 Paraná 2,738 296 23S 28 Jubba-Shibeli 807 10 4N
7 Yenisey 2,611 237 59N 29 Danube 788 285 46N
8 Lena 2,433 222 62N 30 Tocantins 778 490 11S
9 Lake Chada 2,421 n/a 15N 31 Syr Daryac 774 48 44N
10 Niger 2,153 140 14N 32 Okavango 710 21 20S
11 Amur 2,097 172 49N 33 Columbia 670 354 46N
12 Mackenzie 1,770 184 61N 34 Rio Grande 668 6 31N
13 Yangtze 1,723 584 30N 35 Kolyma 667 179 65N
14 Ganges-Brahmaputrab 1,637 847 27N 36 Colorado 657 30 37N
15 Volga 1,453 175 56N 37 São Francisco 634 164 13S
16 Zambezi 1,392 111 15S 38 Amu Daryac 577 76 39N
17 Indus 1,145 197 31N
18 Nelson 1,112 68 51N 39 Lake Balkhashc 498 n/a
19 Tarimc 1,069 5 39N 40 Dnieper 497 107
20 St. Lawrence 1,058 301 45N 41 Dond 459 63
21 Murray-Darlingc 1,052 23 32S 42 Limpopod 421 12
22 Yellow River 1,024 65 37N 43 Senegald 420 45
a Lake Chad Basin is not a single river but the area that drains to the Lake
b Ganges-Brahmaputra basin can be divided into three basins: Ganges (1,006×103 km2), Brahmaputra (549×103 km2) and Meghna (80×103 km2)
c Data from the World Resource Institute (2006) were used, either partially or fully (Murray-Darling), in the defi nition of the basin
d Data from the World Resource Institute (2006) were used for Intermediate River Basins smaller than Dnieper Basin
Lat Latitudinal location of the river basins (mapped in Figure 2)
73Annexes

7474
Figure 33 Runoff vs. latitudinal centre point of LRBs (see also Table 9) (adapted from Adamson 2008).
40S
20S
0
20N
40N
60N
80N
0 200 400 600 800 1000 1200
equato
Latitu
de
[º]
Runoff [mm/yr]
Amazon
Orinoco
Ganges-Brahmaputra
Mekong
Congo
St. Lawrence
Paraná
Murray-Darling
Columbia
Kolyma
Yangtze
River basins > 1,000×103 km2
River basins > 500×103 km2
Tocantins
Spatio-temporal scales of hydrological impact assessment in large river basins: the Mekong case

100
200
300
400
500
500
400
300
200
100
Water & Development Publications - Helsinki University of Technology
TKK-WD-04
SPATIO-TEMPORAL SCALES OF HYDROLOGICAL IMPACT
ASSESSMENT IN LARGE RIVER BASINS: THE MEKONG CASE
Dissertation for the degree of Doctor of Science in Technology
Water & DevelopmentResearch Group
SPAT
IO-T
EM
PO
RA
L S
CA
LE
S O
F H
YD
RO
LO
GIC
AL
IMPA
CT
AS
SE
SS
ME
NT
IN L
AR
GE
RIV
ER
BA
SIN
S: T
HE
ME
KO
NG
CA
SE
Matti Kummu
River alterations, being either natural or anthropogenic, have impacted the environment and riverine communities, and nature, throughout human history. During the last two centuries, the scale of the anthropogenic impacts has expanded significantly as a result of larger water resources related projects. Numerous human activities have consequences for the environment measured along multiple scales and levels. The multiscale/-level nature of the problems related to the impact assessment discipline requires that researchers address key issues of scales and levels in their analyses.
The thesis aims to present the spatio-temporal scales of the hydrological impact assessment (HIA) process in a large river basin context and analyse how the scales should be taken into account when conducting the assessment. A special focus is on the data and methodologies used within the HIA. The levels of this work are hydrology, hydrodynamics and sediment transport, forming the sub-disciplines of the HIA. The geographical focus is the Mekong River Basin in Southeast Asia where HIA is presented at different scales through seven case studies, based on the appended papers. The Mekong is facing rapid development activities and in this work their consequences on the above-mentioned levels have been analysed and discussed at different scales.
Scales are particularly important when a) identifying the critical processes and areas of possible consequences, b) selecting the spatio-temporal scales of the assessment, c) identifying the data needed and available, d) selecting the methodologies and tools related to the process, and e) presenting the results of the assessment to the decision-makers and planners. The thesis concludes that, instead of down-/up-scaling, a multiscale approach often appears to be a more preferable solution. A more extensive inclusion of scale issues in the impact assessment process is believed to contribute to building a more profound connection between researchers and decisions makers.
SPATIO-TEMPORAL SCALES OF HYDROLOGICAL IMPACT ASSESSMENT IN LARGE
RIVER BASINS: THE MEKONG CASE
Matti Kummu
Dissertation for the degree of Doctor of Science in Technology
TK
K-W
D-04
Water & Development Publications - Helsinki University of Technologywww.water.tkk.fi/global
ISSN 1797-254X
ISBN 978-951-22-9665-1 AB HELSINKI UNIVERSITY OF TECHNOLOGY