spatio-temporal features of visual exploration in ... rabuffetti.pdf · citation: rabuffetti m,...
TRANSCRIPT

Spatio-Temporal Features of Visual Exploration inUnilaterally Brain-Damaged Subjects with or withoutNeglect: Results from a Touchscreen TestMarco Rabuffetti1*, Elisabetta Farina1, Margherita Alberoni1, Daniele Pellegatta1, Ildebrando
Appollonio2,3, Paola Affanni1, Marco Forni1, Maurizio Ferrarin1
1 Fondazione Don Carlo Gnocchi ONLUS, Falconara Marittima, Ancona, Italy, 2 Clinica Neurologica, Ospedale San Gerardo, Monza, Italy, 3 Dipartimento di Neuroscienze,
Universita di Milano Bicocca, Milan, Italy
Abstract
Cognitive assessment in a clinical setting is generally made by pencil-and-paper tests, while computer-based tests enablethe measurement and the extraction of additional performance indexes. Previous studies have demonstrated that in aresearch context exploration deficits occur also in patients without evidence of unilateral neglect at pencil-and-paper tests.The objective of this study is to apply a touchscreen-based cancellation test, feasible also in a clinical context, to largegroups of control subjects and unilaterally brain-damaged patients, with and without unilateral spatial neglect (USN), inorder to assess disturbances of the exploratory skills. A computerized cancellation test on a touchscreen interface was usedfor assessing the performance of 119 neurologically unimpaired control subjects and 193 patients with unilateral right orleft hemispheric brain damage, either with or without USN. A set of performance indexes were defined including Latency,Proximity, Crossings and their spatial lateral gradients, and Preferred Search Direction. Classic outcome scores werecomputed as well. Results show statistically significant differences among groups (assumed p,0.05). Right-brain-damagedpatients with USN were significantly slower (median latency per detected item was 1.18 s) and less efficient (about 13search-path crossings) in the search than controls (median latency 0.64 s; about 3 crossings). Their preferred searchdirection (53.6% downward, 36.7% leftward) was different from the one in control patients (88.2% downward, 2.1%leftward). Right-brain-damaged patients without USN showed a significantly abnormal behavior (median latency 0.84 s,about 5 crossings, 83.3% downward and 9.1% leftward direction) situated half way between controls and right-brain-damaged patients with USN. Left-brain-damaged patients without USN were significantly slower and less efficient thancontrols (latency 1.19 s, about 7 crossings), preserving a normal preferred search direction (93.7% downward). Therefore,the proposed touchscreen-based assessment had evidenced disorders in spatial exploration also in patients withoutclinically diagnosed USN.
Citation: Rabuffetti M, Farina E, Alberoni M, Pellegatta D, Appollonio I, et al. (2012) Spatio-Temporal Features of Visual Exploration in Unilaterally Brain-DamagedSubjects with or without Neglect: Results from a Touchscreen Test. PLoS ONE 7(2): e31511. doi:10.1371/journal.pone.0031511
Editor: Andrea Serino, University of Bologna, Italy
Received June 16, 2011; Accepted January 10, 2012; Published February , 2012
Copyright: � 2012 Rabuffetti et al. This is an open-access article distributed under the terms of the Creative Commons Attribution License, which permitsunrestricted use, distribution, and reproduction in any medium, provided the original author and source are credited.
Funding: The study was partially funded by Governative Agencies (‘‘Ricerca Finalizzata-2001-146’’ and Ricerca Corrente funds by Italian Ministery of Health). Thefunders had no role in study design, data collection and analysis, decision to publish, or preparation of the manuscript. No additional external funding wasreceived for this study.
Competing Interests: The authors have declared that no competing interests exist.
* E-mail: mrabuffetti @ dongnocchi.it
Introduction
Unilateral spatial neglect (USN) is a neuropsychological disorder
whereby brain-damaged patients fail to report events occurring on
the space side that is usually contralateral to the side of a unilateral
lesion. These patients also fail to explore that space side. The deficit
is more frequent and severe after damage to the right hemisphere,
typically involving the left-hand side of space [1–3].
Some of the most used tests for the diagnosis of USN are
cancellation tests where patients are asked to cancel out targets
arranged in a display located in front of the participant, with the
centre of the display being usually aligned with the mid-sagittal
plane of the participant’s body. Targets may or may not be
interspersed with distracters. These tests include line [4], circle [5],
letter [6], star [7], bell [8] and symbol [9] cancellation.
These pencil-and-paper tests readily provide scores such as the
number of crossed out/omitted targets in the left- and right half-
space of the test display, the total exploration time, and allow the
computation of the average time per target. These scores are
computed after the participants terminate the task. The on-line
recording of exploration strategies requires a close monitoring of
the patients, possibly by more than one examiner.
According to these approaches, the patient classification on an
on-off basis is determined by the comparison of the actual score,
generally computed as the difference between omitted targets on
the left and omitted targets on the right half-space with cut-off
values. This threshold-based criterion is congruent with the simple
assumption of neglect as a ‘‘failure’’ and therefore works when a
patient ‘‘fails’’. Nonetheless, it has been observed that pencil-and-
paper test classification may be inadequate to detect mild USN
when an individual fulfils a neglect test by obtaining a normal
score. This observation is valid even though the way in which the
task is accomplished is different than that of a normal performance
[10]. Moreover, it has been observed that the behavioral
PLoS ONE | www.plosone.org 1 February 2012 | Volume 7 | Issue 2 | e31511
8

assessment of USN in daily life is often more sensitive than pencil-
and-paper tests [11].
The complexity of a USN deficit, even when not detected by
standard clinical tests, has been nonetheless taken into consider-
ation [12]. Specific ad-hoc tests and protocols, providing not only
scores but also indexes related to the temporal and spatial aspects
of the performance, have been proposed in order to assess the
manifold aspects of neglect and particularly the interplay with
cognitive domains such as memory [13–14], attention [15], motor
control and intention [16–17], and sensory system [18–19].
A survey on chronometrical approaches [20] shows that an
increasing search time possibly occurs in any decay of searching
performance. Chronometrical studies generally involved patient-
operated switches or keys [21–27] however other technical
solutions have been adopted, including touchscreen [28].
Other works focused on the spatial features of search tasks. It is
relevant to note that this approach can be partly supported by the
classic testing: pencil-and-paper cancellation tests allow for an off-
line analysis evidencing for instance the lateral position of omitted
targets. Indeed, several papers reported counting of omissions per
vertical strip sectors, computing local scores about omission/
detection ratios [18,29–31] and evidencing that, at least in some
right-hemisphere-damaged patients, the more leftward the posi-
tion of the stimulus is, the worse the local score will be.
These latter approaches, which only look at omission/detection
scores, require that the patients show a USN (namely, he/she
omits targets) but do not directly show ‘‘how’’ the space is
explored. Without adopting specific technologies, Samuelsson
recorded the search patterns verbally reported by patients [32]. A
research team from the University of Kent proposed a setup based
on a digitizing tablet [33–35]. Mapstone [36], adopting a setup
with eye-trackers, studied the spatial distribution of eye fixation in
a visual search paradigm finding that even in the absence of
clinically observable USN, subjects with right unilateral brain
lesions show altered behavior on the contralesional hemi-space.
Similar findings have been reported by studies performed using an
eye tracking device in USN patients [37–38]. Karnath analyzed
exploration of a large space by eye and head movements adopting
magnetic transducers placed on the eye and on the head [39].
Parton proposed an exploration task on a touchscreen for studying
the re-exploration of already touched items which may be
alternatively simply tagged, cancelled or enhanced [40].
Mark and Woods adopted a video recording of a cancellation
test in order to identify the searching path. Therefore, they
quantified distances between the successively detected stimuli and
the occurrence of crossings along the search path. They computed
an index based on the largest correlation coefficient between
stimuli coordinates and sequential order, evidencing the presence
of an organized search modality [41–42]. They studied the
strategies of spatial exploration in patients with mild or
undetectable USN. Based on their observations, they concluded
that USN and the patterns of organization of visual exploration
are not strictly related, even though an association is often
observed. Such results were substantially confirmed by Manly
[43]. He proposed a detailed analysis of the performance of
control subjects and right-brain-damaged patients with USN in a
Star cancellation test whose measure is obtained from an a-
posteriori analysis of video recordings of the tests. They focused on
indexes either referred to temporal and/or spatial features,
observing significant slowing when cancelling targets towards left
and significant decrease of search organization, while observing
that those aspects do not correlate with classic neglect scores.
In conclusion, despite the fact that clinical diagnosis of USN in
exploratory tasks mainly relies on the omission of contralesional
targets, the latter studies reported, that are just a sample from the
literature, evidence of altered spatial and temporal features of the
search patterns in both USN patients and in patients without
apparent clinical evidence of the disorder; i.e. subjects who do not
show target omission in conventional tests. These patients may be
considered to suffer from a milder impairment of visual-
explorative and attentive cognitive functions and are still of
interest in the clinical management in order to pursue a full
functional recovery. This represents a strong rationale in the
development of testing methods capable of evidencing such mild
disturbances and, at the same time, compatible with a clinical
context.
The present paper is based on a methodological innovation
concerning the implementation of a computerized cancellation test
adopting a touchscreen interface [44–45] that functions as the so-
called tablet. This approach, which is characterized by an
extremely user-friendly interface, allows defining numerical
indexes related to ‘‘how’’ the exploration task has been carried
out. Particularly it has been shown how it is possible to assess a
relation between performance indexes and laterality (where
unilateral spatial neglect can be considered the extreme deficit in
task involving exploration along a lateral direction), making it
possible to explore even mild disturbances when moving attention
towards the affected side. The objectives of the present paper are
to further improve the analysis of task performance as measured
by the touchscreen apparatus by adding some new indexes, and to
report the results obtained from large groups of patients with
unilateral brain damage, either with or without clinical evidence of
unilateral spatial neglect, and control normal subjects.
Materials and Methods
All experimental activities have been approved by the Health
Research Agency of the Italian Ministry of Health and by authors’
institutional review board (Ethics Committee of the Fondazione
Don Carlo Gnocchi ONLUS). Informed consent has been
obtained from all the participants about the investigation
conducted according to the principles expressed in the Declaration
of Helsinki.
ParticipantsThe participants included in this multi-centre study were 119
neurologically unimpaired controls recruited among the staff (not
directly related to this research) and visitors of the Don Gnocchi
hospitals and among those attending recreational centers for
elderly of the city of Milan. One-hundred-ninety-eight with
unilateral hemispheric damage to the left or the right hemisphere
were recruited for the study group from the rehabilitation hospitals
of the Don Carlo Gnocchi Foundation in Milano, Parma and
Sarzana, and in the San Gerardo Hospital, Monza, Italy. Inclusion
criteria were a neurological diagnosis of focal unilateral brain
damage, due to a vascular accident, a neoplastic disease or a head
injury, an educational level of five or more years of schooling, and
a normal or corrected-to normal vision. Exclusion criteria were
clinical evidence and/or history of alcohol/drug abuse, psychiatric
disorders, non-cooperative behavior, and inability to perform a
run-in test (at least one target detected among 4 targets and 4
distracters). All patients included (in particular, no patient failed
the run-in test) were given a preliminary screening using the Mini
Mental State Examination [46–47] and a pencil-and-paper
neuropsychological battery for USN, including a line cancellation
test [4], a letter cancellation test [6,48], the Wundt-Jastrow area
illusion test [49], a sentence reading test [50] and a line bisection
test [7]. Using this screening battery, patients with right or left
Touchscreen Test for Patients with/without Neglect
PLoS ONE | www.plosone.org 2 February 2012 | Volume 7 | Issue 2 | e31511
hemispheric damage were subdivided into two groups: patients
without USN (USN2, namely patients whose performance was
within the normal range in all tasks), and patients with USN
(USN+, namely patients who showed USN in one or more of the
pencil-and-paper tests included in the screening battery). Finally,
subjects not able to detect at least 10 out of 40 targets were
excluded from the study because the indexes computation
produces unreliable values when a limited number of cancellations
is available. This final exclusion step was applied to only 5 patients
with right brain damage and severe neglect at the clinical
assessment. Table 1 summarizes the demographic and neurolog-
ical features of control subjects (CONTROL) and patients.
Apparently, no patient with left brain lesion evidenced USN,
consequently only three groups of patients were identified and
coded RUSN2 for right lesion and no neglect, RUSN+ for right
lesion and neglect, LUSN2 for left lesion and no neglect. Lesions
were localized by CT or MRI Scan; Table 1 also reports the
number of patients showing a lesion in a cerebral lobe or a
subcortical damage with lesions involving more than one lobe in
some patients. Patients’ groups resulted balanced (as evidenced by
ANOVA analyses) according to education and time elapsed since
brain lesion, while age and performances in MMSE test evidenced
differences among groups despite the large overlap of those
indexes’ values.
Experimental setup and globalThe detailed hardware and software features of the experi-
mental setup have previously been described [44] and are
summarized here. A 190 touchscreen monitor displayed a
uniform distribution of 120 stimuli, either letters or shapes,
including 40 targets and 80 distracters. Each participant was
seated in front of the screen with the mid-sagittal plane of the
trunk aligned with the centre of the screen. The task consisted of
touching with the index finger all the targets that the subject was
able to detect. The real-time testing software excluded any sliding
behavior and only allowed a touch-and-go behavior for touching
an item. No effect or recording was associated with a finger touch
on the blank space among the stimuli. Once the target touched, it
would be circled (see Figure 1). Each participant performed two
tests in random order, one on the letter distribution and one on
the shapes distribution. Control subjects used their dominant
hand, while patients used hands of the ipsilesional unaffected side.
Once the participant declared having completed the task, the test
software stored the performance’s raw outcome on files. No time
limit was imposed but if the participant had not declared the test
conclusion after 10 minutes, he/she was asked whether the test
was finished.
Global scoresThe experimental raw outcome consisted of a time series
including, for each touched item (including perseverated touches),
the time T of occurrence of the event and the X (rightward axis)
and Y (downward axis) screen coordinates of each touched item.
The following global scores were computed
& NS, unilateral Neglect Score, defined as the difference between
the number of targets cancelled on the left and on the right
sides of the screen, expressed as a percentage of the total
number of targets (for brain-damaged patients, it is considered
the difference between the targets cancelled on the contrale-
sional side and on the ipsilesional side);
& NT, Number of touched Targets;
& ND, Number of touched Distracters;
& NP, Number of Perseverations, i.e., number of repeated aware
touches on targets which have been already touched once.
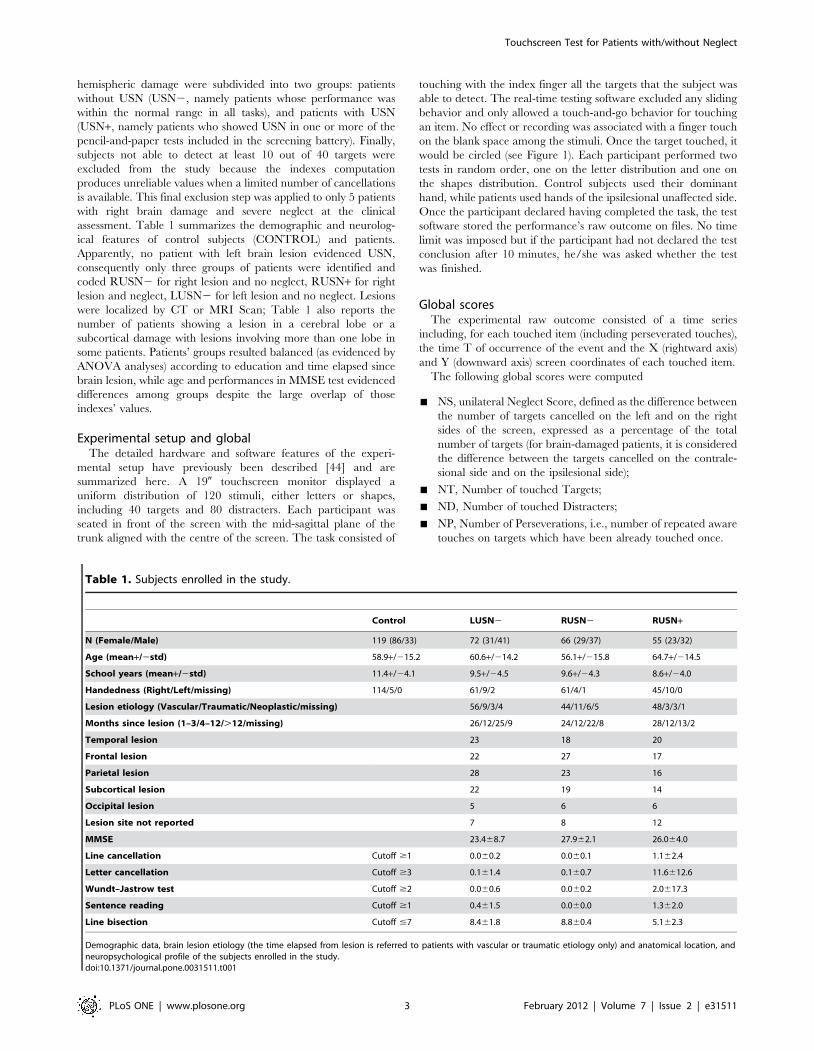
Table 1. Subjects enrolled in the study.
Control LUSN2 RUSN2 RUSN+
N (Female/Male) 119 (86/33) 72 (31/41) 66 (29/37) 55 (23/32)
Age (mean+/2std) 58.9+/215.2 60.6+/214.2 56.1+/215.8 64.7+/214.5
School years (mean+/2std) 11.4+/24.1 9.5+/24.5 9.6+/24.3 8.6+/24.0
Handedness (Right/Left/missing) 114/5/0 61/9/2 61/4/1 45/10/0
Lesion etiology (Vascular/Traumatic/Neoplastic/missing) 56/9/3/4 44/11/6/5 48/3/3/1
Months since lesion (1–3/4–12/.12/missing) 26/12/25/9 24/12/22/8 28/12/13/2
Temporal lesion 23 18 20
Frontal lesion 22 27 17
Parietal lesion 28 23 16
Subcortical lesion 22 19 14
Occipital lesion 5 6 6
Lesion site not reported 7 8 12
MMSE 23.468.7 27.962.1 26.064.0
Line cancellation Cutoff $1 0.060.2 0.060.1 1.162.4
Letter cancellation Cutoff $3 0.161.4 0.160.7 11.6612.6
Wundt–Jastrow test Cutoff $2 0.060.6 0.060.2 2.0617.3
Sentence reading Cutoff $1 0.461.5 0.060.0 1.362.0
Line bisection Cutoff #7 8.461.8 8.860.4 5.162.3
Demographic data, brain lesion etiology (the time elapsed from lesion is referred to patients with vascular or traumatic etiology only) and anatomical location, andneuropsychological profile of the subjects enrolled in the study.doi:10.1371/journal.pone.0031511.t001
Touchscreen Test for Patients with/without Neglect
PLoS ONE | www.plosone.org 3 February 2012 | Volume 7 | Issue 2 | e31511

Mathematical models and indexes of test performanceGiven the time series Ti, Xi, Yi where i = 1: n, n being the total
number of touched items, a set of variables were defined:
& latency, array of real numbers, being the time in seconds
between each target detection and the previous detection,
defined as Li = Ti2Ti21;
& distance, array of real numbers, being the distance between the
currently detected target and the previous one, expressed in
fractions of screen width, defined as Di = |([Xi Yi]2[Xi21
Yi21])|
& search speed, array of real numbers, defined as Si = Di/Li;
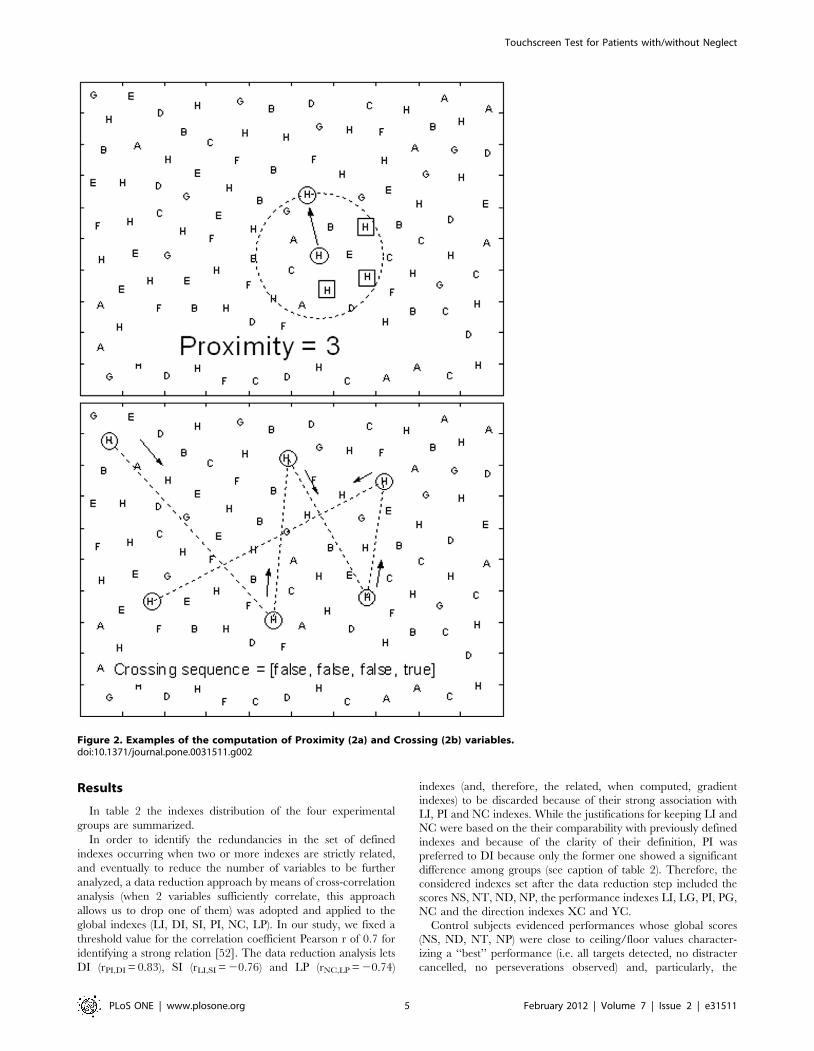
& proximity, a vector of integer numbers, defining Pi as the number
of not yet cancelled targets that were closer to the previously
touched item (i21) than the actual i-th one (see figure 2a);
& crossing, array of Boolean variables, defined as true if any
crossing of previous search path occurred, otherwise false (see
figure 2b).
Those variables allow for the definition of an extended set of
numerical indexes which are related to global aspects of the test
performance.
The participant’s performance is described by the following
global indexes:
& LI, Latency Index, defined as the median value of the Latency
variable;
& DI, Distance Index, defined as the median value of the Distance
variable;
& SI, Search Speed Index, defined as the median value of the
SearchSpeed variable;
& PI, Proximity Index, defined as the mean value of the Proximity
variable;
& NC, Crossing Index, defined as the number of occurred crossings
divided by the total number of touched items;
& LP, Longest Path, defined as the maximum number of
consecutive touches without crossing (max length sequence
of false crossing).
A second set of indexes was defined in order to quantify a
relation between any performance index and the lateral
coordinate. This was relevant to check whether a more leftward
position was related to some significant changes in target
detection.
The elective mathematical tool was the regression analysis of a
generic variable vs. the X lateral coordinate, assumed as the
independent factor [44]. The numerical value of the identified
gradient, which is the slope of the fitting line, can also be assumed
as the difference of the values that the index displayed on the
extreme right and on the extreme left (e.g., a latency gradient of
21.2 seconds means that an item took 1.2 seconds longer in order
to be detected if it was located on the extreme left instead of the
extreme right of the testing display). In order to relate the gradient
to the side of the brain lesion, for the brain-damaged groups the
gradient was referred to the contralesional/ipsilesional sides (in
simple words, this required a sign change of the X-gradient for left
brain-damaged patients only).
The following gradient indexes were considered:
& LG, Latency Lateral Gradient
& DG, Distance Lateral Gradient
& SG, SearchSpeed Lateral Gradient
& PG, Proximity Lateral Gradient.
A graphical example of the computation of a gradient index is
reported in figure 3.
A third set of indexes defined explores the hypothesis of a linear
relation between time and one other variable; i.e. if an index
increases (or decreases) constantly with time, the cross correlation
analysis is the mathematical tool which provides the correlation
coefficient r. The values of r that can be obtained range from 1.0, a
perfect direct linear relation, to 21.0, a perfect inverse linear
relation; the r null value, or close to zero, marks the relative
independency of the two variables.
Given the time (t) and any variable (v), as N-long series of
numbers, the formula to compute the r correlation coefficient r is
r~
XN
i~1
vi{�vvð Þ: ti{�ttð ÞffiffiffiffiffiffiffiffiffiffiffiffiffiffiffiffiffiffiffiffiffiffiffiffiffiffiffiffiffiffiffiffiffiffiffiffiffiffiffiffiffiffiffiffiffiffiffiffiffiXN
i~1
vi{�vvð Þ2:XN
i~1
ti{�ttð Þ2vuut
In the present study, considering the series of X, Y and T values,
large absolute values of r may identify search patterns left-to-right
or reverse, and top-down or reverse. The following direction
indexes were used:
& XC, Lateral Direction Index (positive for rightward direction)
& YC, Vertical Direction Index (positive for downward direction).
A sample test is presented in figure 4 reporting the search path
and timings which allow for the plotting of X and Y coordinates
of the touches versus the timing of their occurrences. The best fit
regression lines are superimposed and the correlation coefficients
are reported as legends. The example shows an apparent upward
strategy identified by the strong linear relation between Y
and T.
Differences among groups were analyzed by Kruskall-Wallis
non-parametric analyses of variance, with multiple comparisons
when appropriate [51].
All mathematical computations and statistics were performed by
Matlab (The Mathworks, USA) and Statistica (Statsoft, USA).
Figure 1. Experimental setup with subject touching targetdisplayed by a touchscreen monitor.doi:10.1371/journal.pone.0031511.g001
Touchscreen Test for Patients with/without Neglect
PLoS ONE | www.plosone.org 4 February 2012 | Volume 7 | Issue 2 | e31511
Results
In table 2 the indexes distribution of the four experimental
groups are summarized.
In order to identify the redundancies in the set of defined
indexes occurring when two or more indexes are strictly related,
and eventually to reduce the number of variables to be further
analyzed, a data reduction approach by means of cross-correlation
analysis (when 2 variables sufficiently correlate, this approach
allows us to drop one of them) was adopted and applied to the
global indexes (LI, DI, SI, PI, NC, LP). In our study, we fixed a
threshold value for the correlation coefficient Pearson r of 0.7 for
identifying a strong relation [52]. The data reduction analysis lets
DI (rPI,DI = 0.83), SI (rLI,SI = 20.76) and LP (rNC,LP = 20.74)
indexes (and, therefore, the related, when computed, gradient
indexes) to be discarded because of their strong association with
LI, PI and NC indexes. While the justifications for keeping LI and
NC were based on the their comparability with previously defined
indexes and because of the clarity of their definition, PI was
preferred to DI because only the former one showed a significant
difference among groups (see caption of table 2). Therefore, the
considered indexes set after the data reduction step included the
scores NS, NT, ND, NP, the performance indexes LI, LG, PI, PG,
NC and the direction indexes XC and YC.
Control subjects evidenced performances whose global scores
(NS, ND, NT, NP) were close to ceiling/floor values character-
izing a ‘‘best’’ performance (i.e. all targets detected, no distracter
cancelled, no perseverations observed) and, particularly, the
Figure 2. Examples of the computation of Proximity (2a) and Crossing (2b) variables.doi:10.1371/journal.pone.0031511.g002
Touchscreen Test for Patients with/without Neglect
PLoS ONE | www.plosone.org 5 February 2012 | Volume 7 | Issue 2 | e31511
neglect score NS was substantially null (see figure 5). The
performance indexes (LI, LG, PI, PG, NC) expressed the following
normal pattern (figure 6): generally, it took less than one second for
each target detection (median LI was 0.64 s), between 2
subsequentially touched targets there was at least one closer target
to the initial touched one that was undetected (median PI was 1.8,
95th percentile was about 5) and rarely search path crossings were
observed (median NC accounted for 2 to 3 crossing in the search
for 40 targets with a maximum of 15 crossings). As no USN was
shown by neurologically unimpaired subjects, even gradient
indexes concerning latencies (LG) and proximities (PG) did not
show any unbalance between right and left, and their values
included the null value as a central one.
LUSN2 patients compared to controls showed, as a group, a
significant, though very small, neglect score (NS, it is worth noting
that its median value was null) with an overall normal rate of target
detection (NT) and significantly larger numbers of touched
distracters (ND, median is 1 and may rise up to more than 10)
and perseverations (NP, though median value is 0). These patients
were slower (median LI is 1.19) and less efficient in search strategy
(median PI is 2.53, NC is more than 7) than controls, occasionally
showing laterally related effect (median PG is 1.1 with an overall
bias for positive values). In general all the reported differences
were due to outlier performances, while the differences between
the median values of the global scores were either null (NS, NT,
NP) or very small (ND).
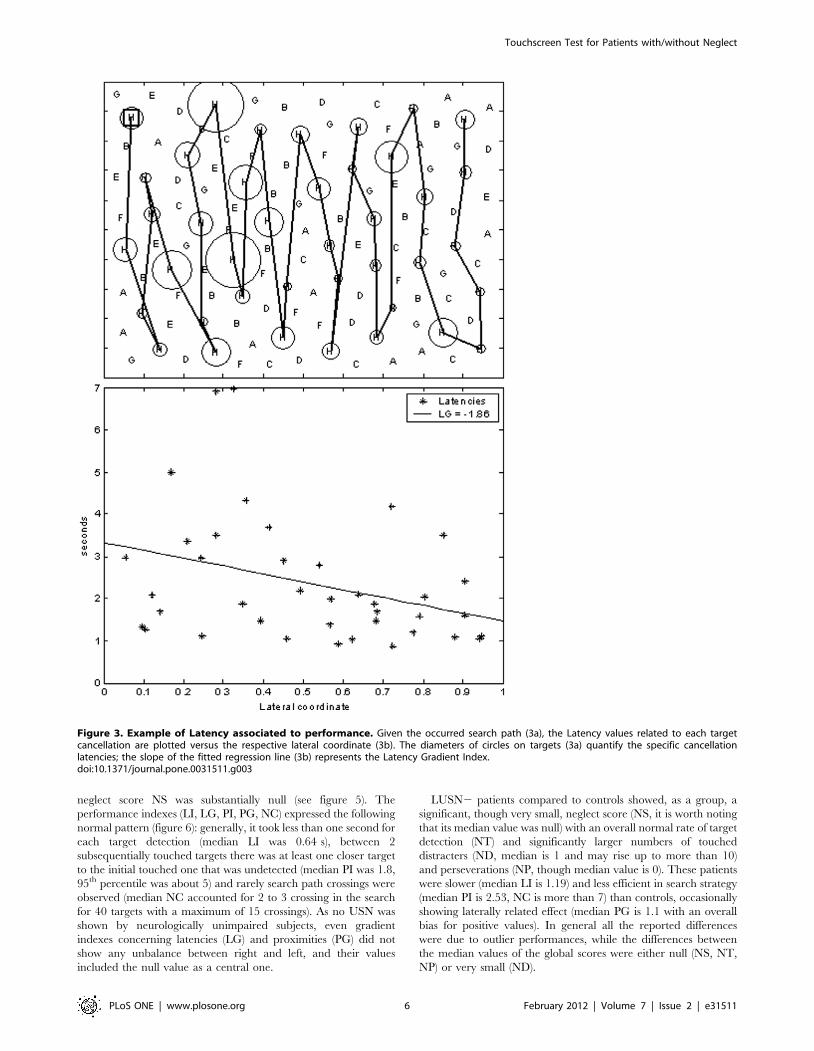
Figure 3. Example of Latency associated to performance. Given the occurred search path (3a), the Latency values related to each targetcancellation are plotted versus the respective lateral coordinate (3b). The diameters of circles on targets (3a) quantify the specific cancellationlatencies; the slope of the fitted regression line (3b) represents the Latency Gradient Index.doi:10.1371/journal.pone.0031511.g003
Touchscreen Test for Patients with/without Neglect
PLoS ONE | www.plosone.org 6 February 2012 | Volume 7 | Issue 2 | e31511

RUSN2 patients compared to controls showed a significant
USN score (positive bias for NS, though median value is 0)
particularly due to occurring extreme values; the other scores (NT,
ND, NP) showed normal values and only few individuals presented
themselves with abnormal values. Apparently, equal median
values of the four global scores were observed in controls and
RUSN2 groups. The RUSN2 group was slower (median LI is
0.84 seconds), with increasing slowness in the contralesional side of
space (median LG is 20.13) and less efficient in the search strategy
(median NC is more than 5 and can rise up to about 20) than
controls.
RUSN+ patients compared to controls exhibited abnormal
scores (NS, NT, ND, NP): they were slower (median LI is
1.21 seconds), with increasing slowness towards the left (median
LG is 20.4, and may range down to 27) and they were less
efficient in their search strategy (PI is 2.5; NC is 15) while
proximity tends to decrease in the contralesional hemifield
(median PG is 0.7, ranging from 27 to 11).
Figure 4. Example of XC and YC associated to performance. Given the occurred search path (4a), the horizontal (4b, top) and vertical (4b,bottom) coordinates of cancelled target are plotted vs. the time of their cancellation. The correlation coefficients XC and YC, respectively, provideevidence of the possible occurrence of a strong linear dependency between cancelled target locations and time: in the example shown the largepositive YC coefficient evidences a downward search path.doi:10.1371/journal.pone.0031511.g004
Table 2. Summary of experimental results.
Score/Index Control (N trials = 238) LUSN2 (N trials = 144) RUSN2 (N trials = 132) RUSN+ (N trials = 110)
NS (Neglect Score) 0.00 (25.00, = .2.50) 0.00 (22.50, = .5.00) 0.00 (22.50, = .10.00) 7.50 (22.50, = .37.50)
NT (N Targets) 40 (38, = .40) 40 (36, = .40) 40 (34, = .40) 34.50 (13, = .40)
ND (N Distracters) 0 (0, = .2) 1 (0, = .14) 0 (0, = .3) 1 (0, = .12)
NP (N Perseverations) 0 (0, = .1) 0 (0, = .4) 0 (0, = .2) 0 (0, = .5)
LI (Latency Index) 0.64 (0.44, = .1.15) 1.19 (0.61, = .2.37) 0.84 (0.49, = .1.87) 1.18 (0.61, = .3.07)
LG (Latency Gradient) 20.02 (20.64, = .0.55) 0.05 (21.43, = .1.47) 20.13 (21.93, = .0.83) 20.40 (27.18, = .1.33)
DI (Distance Index) 0.15 (0.13, = .0.23 0.15 (0.13, = .0.25) 0.15 (0.13, = .0.19) 0.15 (0.13, = .0.23)
DG (Distance Gradient) 0.00 (20.21, = .0.12 0.03 (20.09, = .0.42) 20.01 (20.28, = .0.11) 0.00 (20.22, = .0.16)
SI (Speed Index) 0.25 (0.15, = .0.35) 0.15 (0.08, = .0.25) 0.18 (0.09, = .0.31) 0.14 (0.07, = .0.24)
SG (Speed Gradient) 20.01 (20.15, = .0.09 0.02 (20.16, = .0.18) 0.00 (20.12, = .0.12) 0.02 (20.19, = .0.23)
PI (Proximity Index) 1.82 (0.82, = .5.18) 2.53 (0.95, = .6.00) 2.14 (0.85, = .4.03) 2.42 (0.81, = .5.69)
PG (Proximity Gradient) 20.51 (27.51, = .3.62) 1.08 (22.59, = .11.54) 20.50 (27.12, = .3.26) 0.69 (27.52, = .11.85)
NC (N Crossings) 2.56 (0.00, = .16.22) 7.06 (0.00, = .30.88) 5.20 (0.00, = .20.51) 13.48 (0.00, = .42.86)
LP (Longest path) 30 (14, = .39) 23 (10, = .40) 26 (11, = .39) 16 (6, = .37)
A summary of the median values and, in brackets, the 5th and 95th percentiles of the defined indexes in the experimental trials (two for each participant) of the foursubjects’ groups. The across-group Kruskall-Wallis analysis of variance was significant (p,0.01) for all listed indexes except for the Distance Index DI (p = 0.41).doi:10.1371/journal.pone.0031511.t002
Touchscreen Test for Patients with/without Neglect
PLoS ONE | www.plosone.org 7 February 2012 | Volume 7 | Issue 2 | e31511

When comparing right brain-damaged patients, RUSN2
exhibited a statistically significant intermediate behavior between
RUSN+ and controls concerning neglect score (NS), latency (LI)
and search efficiency (NC), while the extreme values of latency
gradient in RUSN2 were less severe than the ones showed by
RUSN+.
If we compare left to right brain-damaged patients, LUSN2
group showed lower values concerning distracters (ND), greater
values concerning proximity (PI) and values in between RUSN2
and RUSN+ for both latency and search efficiency (LI and
NC).
As for the searching path descriptors, the couple composed by
the direction indexes XC and YC quantifies the search strategy.
The vector connecting the origin of a XY reference frame to the
point with coordinates (XC,YC) provides an immediate represen-
tation of a preferred search direction (the direction of the vector)
and the strength of this search direction (the module of the vector).
Examples about some paradigmatic search strategies are shown in
figure 7, while a presentation of all the observed direction indexes
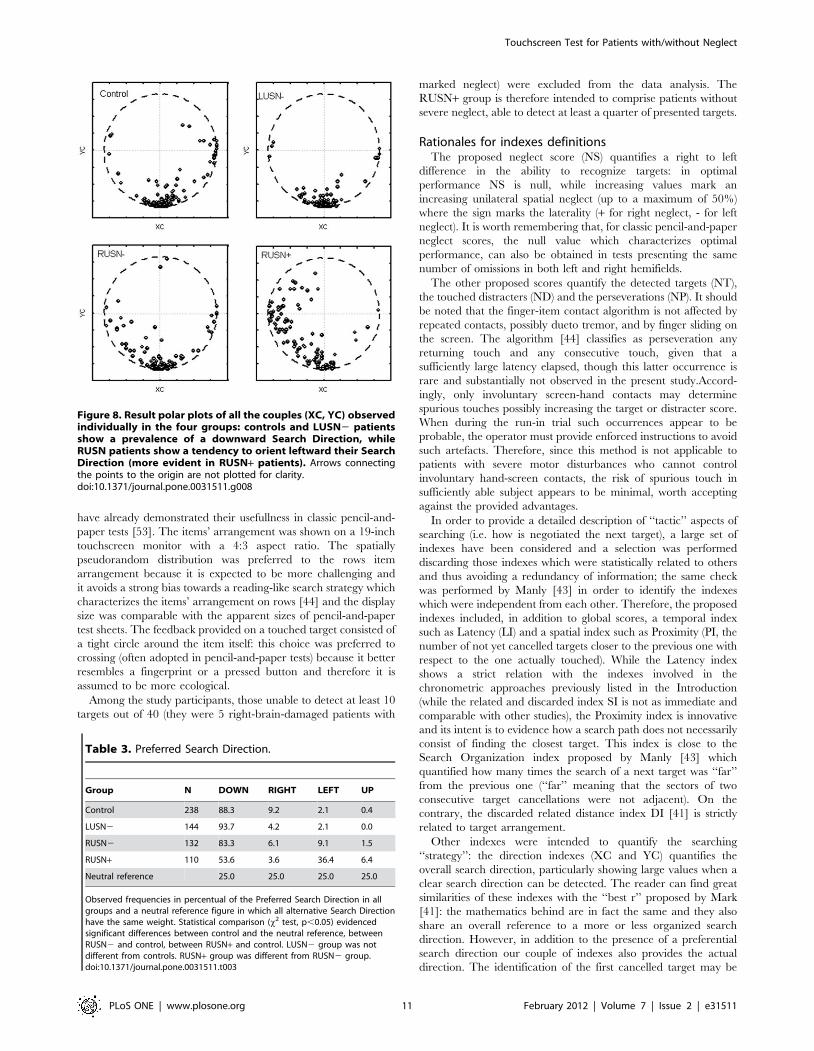
for each group is presented in figure 8. When counting the
preferred search direction according to 4 classes (UP/RIGHT/
DOWN/LEFT according to the corresponding four 90u circular
sectors), the results are summarized in table 3. A Chi-square test
evidenced that the preferred search direction of control subjects is
statistically different from a neutral figure characterized by a 25%
of occurrence for each search direction, with a prevalence of a
downward exploration organized in horizontal rasters. Moreover,
the LUSN2 group was not statistically different from the control
group, while RUSN2 showed a significant shift from the
downward normal search strategy towards a left-oriented strategy
organized in vertical rasters. Finally the RUSN+ subjects showed
an even more apparent shift towards leftward oriented explora-
tion, significantly more relevant with respect to control and
RUSN2 groups.
Given the observed differences among patients’ groups, a
further analysis has been carried out in order to verify whether
those differences may be related to other factors, and particularly
to those factors which showed significant differences among
groups, namely age and MMSE outcome. The data from the three
groups of patients was pooled and a correlation analysis between
the two potential confounding factors and the test Performance
Indexes was performed. The resulting correlation coefficients
(previously considered in the data reduction stage when above
0.70) never exceeded 0.30 in the module (the largest coefficient
being 20.27 for correlation between MMSE and ND, number of
touched distracters) and generally was below 0.10, thus excluding
an effect of the two potentially confounding factors on any of the
touchscreen test outcomes.
Figure 5. Result box plots (reporting median, quartiles and extreme values) of scores NS (5a, neglect score), NT (5b, targetcancelled), ND (5c, distracters cancelled), and NP (5d, perseverations). Kruskall-Wallis ANOVA test is always positive, across-groupstatistically significant differences (post-hoc analysis, p,0.05) are marked by horizontal segments.doi:10.1371/journal.pone.0031511.g005
Touchscreen Test for Patients with/without Neglect
PLoS ONE | www.plosone.org 8 February 2012 | Volume 7 | Issue 2 | e31511

Finally, as for the comparison of the pencil-and-paper letter
cancellation test and the corresponding touchscreen-based test in
the group of cases with right hemispheric damage, the following
figure was obtained: both tests were negative in 66 subjects,
positive in 32 subjects and 23 subjects showed discrepancy
between the two testings. Among the latter group, there were 7
positive outcomes only in the pencil-and-paper test battery and 16
only in the touchscreen test. Though the result indicated a slightly
better sensitivity of the touchscreen-based test, such difference was
classified as not significant (p = 0.22; x2 test).
Figure 6. Result box plots (reporting median, quartiles and extreme values) of indexes LI (6a, Latency), LG (6b, Latency Gradient), PI(6c, Proximity), PG (6d, Proximity Gradient), and NC (6e, Crossings). Kruskall-Wallis ANOVA test is always positive, across-group statisticallysignificant differences (post-hoc analysis, p,0.05) are marked by horizontal segments.doi:10.1371/journal.pone.0031511.g006
Touchscreen Test for Patients with/without Neglect
PLoS ONE | www.plosone.org 9 February 2012 | Volume 7 | Issue 2 | e31511
Discussion
The computerized approach to a cancellation test implemented
on a touchscreen and previously described in a pilot study [44]
proved to be usefully applicable to a large population of control
subjects and patients with unilateral brain lesions.
The observational study was performed on a population of adult
subjects; 119 normal subjects as controls and 198 subjects with
unilateral brain damage who were screened according a neglect
testing battery. Apparently no subject with left brain lesion and
neglect was identified.
The chosen task consisted of a visual searching involving
cancellation of targets interspersed with distractors. This task is a
widely adopted paradigm in clinical pencil-and-paper tests [4,6–7]
and, compared to other classical approaches such as line bisection
or figures copying, is particularly fit for a quantitative instrument-
ed approach. The proposed touchscreen approach allowed to
analyze the spatial and temporal evolution of the searching
performance, providing a set of indexes related to ‘‘how’’ the task
has been fulfilled, in addition to the classic global score of ‘‘what’’
was the final result of the performance. Such additional indexes
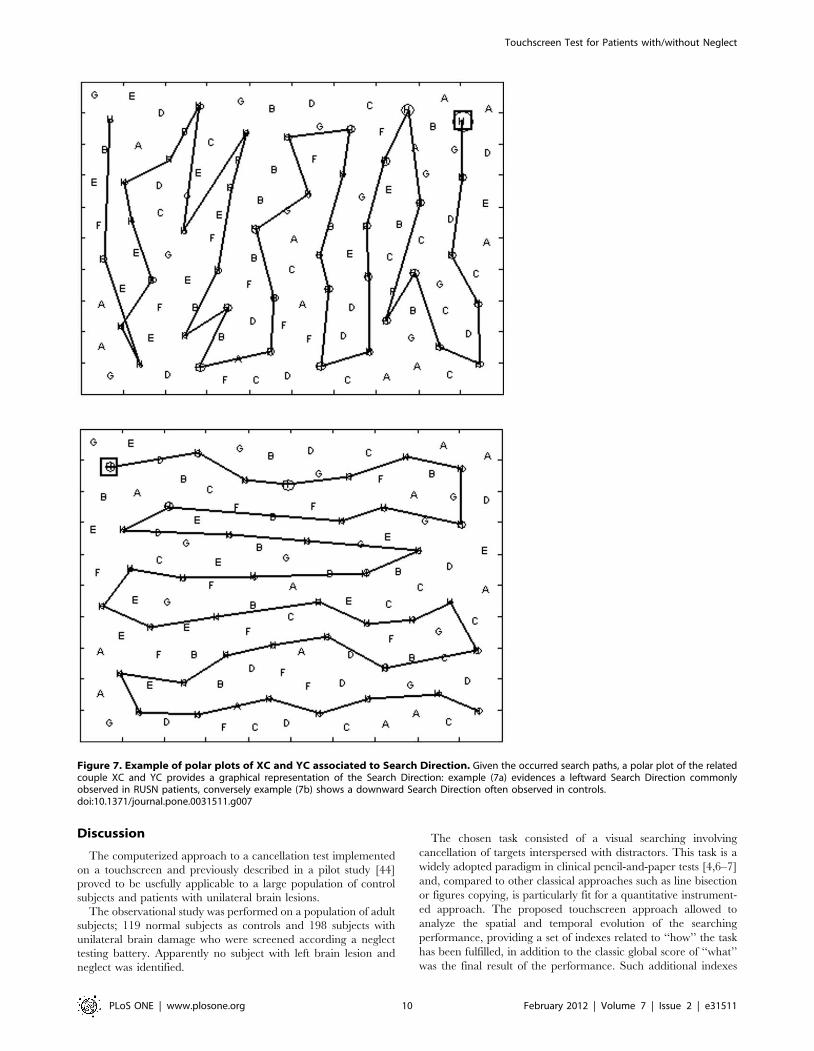
Figure 7. Example of polar plots of XC and YC associated to Search Direction. Given the occurred search paths, a polar plot of the relatedcouple XC and YC provides a graphical representation of the Search Direction: example (7a) evidences a leftward Search Direction commonlyobserved in RUSN patients, conversely example (7b) shows a downward Search Direction often observed in controls.doi:10.1371/journal.pone.0031511.g007
Touchscreen Test for Patients with/without Neglect
PLoS ONE | www.plosone.org 10 February 2012 | Volume 7 | Issue 2 | e31511
have already demonstrated their usefullness in classic pencil-and-
paper tests [53]. The items’ arrangement was shown on a 19-inch
touchscreen monitor with a 4:3 aspect ratio. The spatially
pseudorandom distribution was preferred to the rows item
arrangement because it is expected to be more challenging and
it avoids a strong bias towards a reading-like search strategy which
characterizes the items’ arrangement on rows [44] and the display
size was comparable with the apparent sizes of pencil-and-paper
test sheets. The feedback provided on a touched target consisted of
a tight circle around the item itself: this choice was preferred to
crossing (often adopted in pencil-and-paper tests) because it better
resembles a fingerprint or a pressed button and therefore it is
assumed to be more ecological.
Among the study participants, those unable to detect at least 10
targets out of 40 (they were 5 right-brain-damaged patients with
marked neglect) were excluded from the data analysis. The
RUSN+ group is therefore intended to comprise patients without
severe neglect, able to detect at least a quarter of presented targets.
Rationales for indexes definitionsThe proposed neglect score (NS) quantifies a right to left
difference in the ability to recognize targets: in optimal
performance NS is null, while increasing values mark an
increasing unilateral spatial neglect (up to a maximum of 50%)
where the sign marks the laterality (+ for right neglect, - for left
neglect). It is worth remembering that, for classic pencil-and-paper
neglect scores, the null value which characterizes optimal
performance, can also be obtained in tests presenting the same
number of omissions in both left and right hemifields.
The other proposed scores quantify the detected targets (NT),
the touched distracters (ND) and the perseverations (NP). It should
be noted that the finger-item contact algorithm is not affected by
repeated contacts, possibly dueto tremor, and by finger sliding on
the screen. The algorithm [44] classifies as perseveration any
returning touch and any consecutive touch, given that a
sufficiently large latency elapsed, though this latter occurrence is
rare and substantially not observed in the present study.Accord-
ingly, only involuntary screen-hand contacts may determine
spurious touches possibly increasing the target or distracter score.
When during the run-in trial such occurrences appear to be
probable, the operator must provide enforced instructions to avoid
such artefacts. Therefore, since this method is not applicable to
patients with severe motor disturbances who cannot control
involuntary hand-screen contacts, the risk of spurious touch in
sufficiently able subject appears to be minimal, worth accepting
against the provided advantages.
In order to provide a detailed description of ‘‘tactic’’ aspects of
searching (i.e. how is negotiated the next target), a large set of
indexes have been considered and a selection was performed
discarding those indexes which were statistically related to others
and thus avoiding a redundancy of information; the same check
was performed by Manly [43] in order to identify the indexes
which were independent from each other. Therefore, the proposed
indexes included, in addition to global scores, a temporal index
such as Latency (LI) and a spatial index such as Proximity (PI, the
number of not yet cancelled targets closer to the previous one with
respect to the one actually touched). While the Latency index
shows a strict relation with the indexes involved in the
chronometric approaches previously listed in the Introduction
(while the related and discarded index SI is not as immediate and
comparable with other studies), the Proximity index is innovative
and its intent is to evidence how a search path does not necessarily
consist of finding the closest target. This index is close to the
Search Organization index proposed by Manly [43] which
quantified how many times the search of a next target was ‘‘far’’
from the previous one (‘‘far’’ meaning that the sectors of two
consecutive target cancellations were not adjacent). On the
contrary, the discarded related distance index DI [41] is strictly
related to target arrangement.
Other indexes were intended to quantify the searching
‘‘strategy’’: the direction indexes (XC and YC) quantifies the
overall search direction, particularly showing large values when a
clear search direction can be detected. The reader can find great
similarities of these indexes with the ‘‘best r’’ proposed by Mark
[41]: the mathematics behind are in fact the same and they also
share an overall reference to a more or less organized search
direction. However, in addition to the presence of a preferential
search direction our couple of indexes also provides the actual
direction. The identification of the first cancelled target may be
Figure 8. Result polar plots of all the couples (XC, YC) observedindividually in the four groups: controls and LUSN2 patientsshow a prevalence of a downward Search Direction, whileRUSN patients show a tendency to orient leftward their SearchDirection (more evident in RUSN+ patients). Arrows connectingthe points to the origin are not plotted for clarity.doi:10.1371/journal.pone.0031511.g008
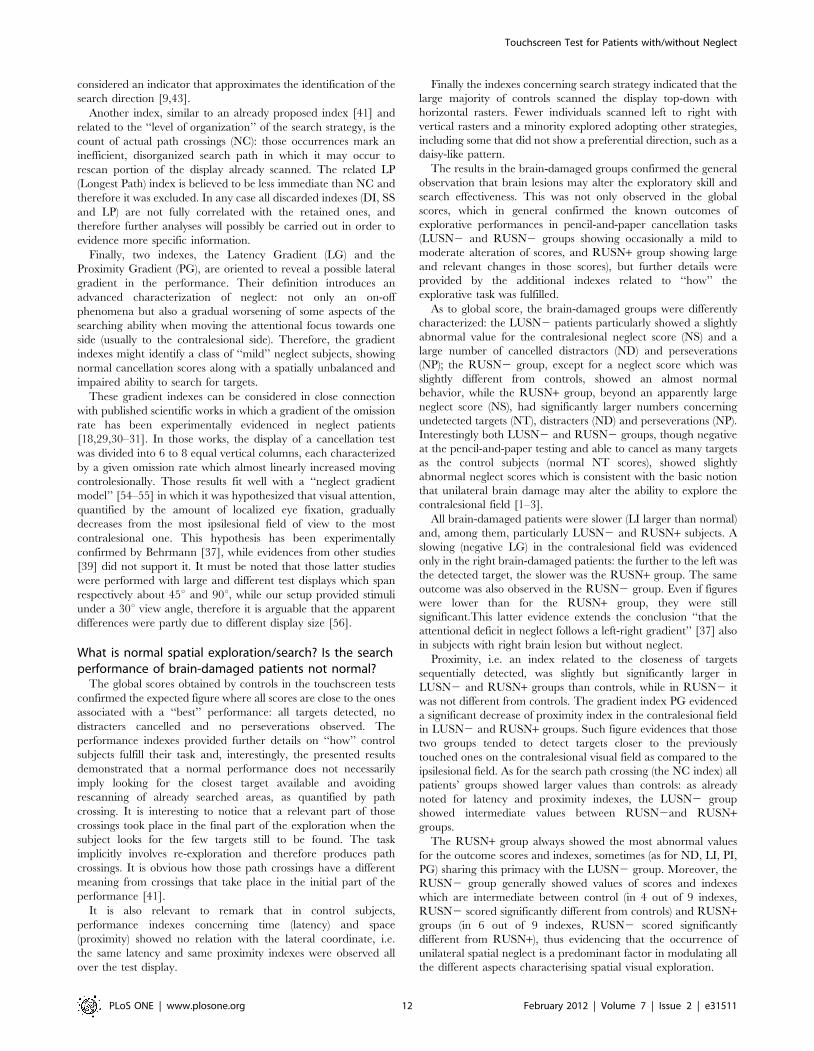
Table 3. Preferred Search Direction.
Group N DOWN RIGHT LEFT UP
Control 238 88.3 9.2 2.1 0.4
LUSN2 144 93.7 4.2 2.1 0.0
RUSN2 132 83.3 6.1 9.1 1.5
RUSN+ 110 53.6 3.6 36.4 6.4
Neutral reference 25.0 25.0 25.0 25.0
Observed frequencies in percentual of the Preferred Search Direction in allgroups and a neutral reference figure in which all alternative Search Directionhave the same weight. Statistical comparison (x2 test, p,0.05) evidencedsignificant differences between control and the neutral reference, betweenRUSN2 and control, between RUSN+ and control. LUSN2 group was notdifferent from controls. RUSN+ group was different from RUSN2 group.doi:10.1371/journal.pone.0031511.t003
Touchscreen Test for Patients with/without Neglect
PLoS ONE | www.plosone.org 11 February 2012 | Volume 7 | Issue 2 | e31511
considered an indicator that approximates the identification of the
search direction [9,43].
Another index, similar to an already proposed index [41] and
related to the ‘‘level of organization’’ of the search strategy, is the
count of actual path crossings (NC): those occurrences mark an
inefficient, disorganized search path in which it may occur to
rescan portion of the display already scanned. The related LP
(Longest Path) index is believed to be less immediate than NC and
therefore it was excluded. In any case all discarded indexes (DI, SS
and LP) are not fully correlated with the retained ones, and
therefore further analyses will possibly be carried out in order to
evidence more specific information.
Finally, two indexes, the Latency Gradient (LG) and the
Proximity Gradient (PG), are oriented to reveal a possible lateral
gradient in the performance. Their definition introduces an
advanced characterization of neglect: not only an on-off
phenomena but also a gradual worsening of some aspects of the
searching ability when moving the attentional focus towards one
side (usually to the contralesional side). Therefore, the gradient
indexes might identify a class of ‘‘mild’’ neglect subjects, showing
normal cancellation scores along with a spatially unbalanced and
impaired ability to search for targets.
These gradient indexes can be considered in close connection
with published scientific works in which a gradient of the omission
rate has been experimentally evidenced in neglect patients
[18,29,30–31]. In those works, the display of a cancellation test
was divided into 6 to 8 equal vertical columns, each characterized
by a given omission rate which almost linearly increased moving
controlesionally. Those results fit well with a ‘‘neglect gradient
model’’ [54–55] in which it was hypothesized that visual attention,
quantified by the amount of localized eye fixation, gradually
decreases from the most ipsilesional field of view to the most
contralesional one. This hypothesis has been experimentally
confirmed by Behrmann [37], while evidences from other studies
[39] did not support it. It must be noted that those latter studies
were performed with large and different test displays which span
respectively about 45u and 90u, while our setup provided stimuli
under a 30u view angle, therefore it is arguable that the apparent
differences were partly due to different display size [56].
What is normal spatial exploration/search? Is the searchperformance of brain-damaged patients not normal?
The global scores obtained by controls in the touchscreen tests
confirmed the expected figure where all scores are close to the ones
associated with a ‘‘best’’ performance: all targets detected, no
distracters cancelled and no perseverations observed. The
performance indexes provided further details on ‘‘how’’ control
subjects fulfill their task and, interestingly, the presented results
demonstrated that a normal performance does not necessarily
imply looking for the closest target available and avoiding
rescanning of already searched areas, as quantified by path
crossing. It is interesting to notice that a relevant part of those
crossings took place in the final part of the exploration when the
subject looks for the few targets still to be found. The task
implicitly involves re-exploration and therefore produces path
crossings. It is obvious how those path crossings have a different
meaning from crossings that take place in the initial part of the
performance [41].
It is also relevant to remark that in control subjects,
performance indexes concerning time (latency) and space
(proximity) showed no relation with the lateral coordinate, i.e.
the same latency and same proximity indexes were observed all
over the test display.
Finally the indexes concerning search strategy indicated that the
large majority of controls scanned the display top-down with
horizontal rasters. Fewer individuals scanned left to right with
vertical rasters and a minority explored adopting other strategies,
including some that did not show a preferential direction, such as a
daisy-like pattern.
The results in the brain-damaged groups confirmed the general
observation that brain lesions may alter the exploratory skill and
search effectiveness. This was not only observed in the global
scores, which in general confirmed the known outcomes of
explorative performances in pencil-and-paper cancellation tasks
(LUSN2 and RUSN2 groups showing occasionally a mild to
moderate alteration of scores, and RUSN+ group showing large
and relevant changes in those scores), but further details were
provided by the additional indexes related to ‘‘how’’ the
explorative task was fulfilled.
As to global score, the brain-damaged groups were differently
characterized: the LUSN2 patients particularly showed a slightly
abnormal value for the contralesional neglect score (NS) and a
large number of cancelled distractors (ND) and perseverations
(NP); the RUSN2 group, except for a neglect score which was
slightly different from controls, showed an almost normal
behavior, while the RUSN+ group, beyond an apparently large
neglect score (NS), had significantly larger numbers concerning
undetected targets (NT), distracters (ND) and perseverations (NP).
Interestingly both LUSN2 and RUSN2 groups, though negative
at the pencil-and-paper testing and able to cancel as many targets
as the control subjects (normal NT scores), showed slightly
abnormal neglect scores which is consistent with the basic notion
that unilateral brain damage may alter the ability to explore the
contralesional field [1–3].
All brain-damaged patients were slower (LI larger than normal)
and, among them, particularly LUSN2 and RUSN+ subjects. A
slowing (negative LG) in the contralesional field was evidenced
only in the right brain-damaged patients: the further to the left was
the detected target, the slower was the RUSN+ group. The same
outcome was also observed in the RUSN2 group. Even if figures
were lower than for the RUSN+ group, they were still
significant.This latter evidence extends the conclusion ‘‘that the
attentional deficit in neglect follows a left-right gradient’’ [37] also
in subjects with right brain lesion but without neglect.
Proximity, i.e. an index related to the closeness of targets
sequentially detected, was slightly but significantly larger in
LUSN2 and RUSN+ groups than controls, while in RUSN2 it
was not different from controls. The gradient index PG evidenced
a significant decrease of proximity index in the contralesional field
in LUSN2 and RUSN+ groups. Such figure evidences that those
two groups tended to detect targets closer to the previously
touched ones on the contralesional visual field as compared to the
ipsilesional field. As for the search path crossing (the NC index) all
patients’ groups showed larger values than controls: as already
noted for latency and proximity indexes, the LUSN2 group
showed intermediate values between RUSN2and RUSN+groups.
The RUSN+ group always showed the most abnormal values
for the outcome scores and indexes, sometimes (as for ND, LI, PI,
PG) sharing this primacy with the LUSN2 group. Moreover, the
RUSN2 group generally showed values of scores and indexes
which are intermediate between control (in 4 out of 9 indexes,
RUSN2 scored significantly different from controls) and RUSN+groups (in 6 out of 9 indexes, RUSN2 scored significantly
different from RUSN+), thus evidencing that the occurrence of
unilateral spatial neglect is a predominant factor in modulating all
the different aspects characterising spatial visual exploration.
Touchscreen Test for Patients with/without Neglect
PLoS ONE | www.plosone.org 12 February 2012 | Volume 7 | Issue 2 | e31511

Nonetheless, other cognitive, visuoperceptual and motor factors
may contribute to the abnormal scores of the brain-damaged
groups: among others dexterity deficits [57], limited reliance on
the able ipsilesional nondominant hand, disturbances related to
language and reading such as alexia [58], misguided hand
movement due to optic ataxia [59]. The specific balance of those
factors certainly influences the individual performance and, when
the association between a factor and the side of the brain lesion is
known, some evidences can be interpreted accordingly: the worst
ND and LI scores in LUSN2 group may be related to their
prevalent problems in the linguistic domain [58], particularly
affecting the letter-based test, and/or to persisting long-term
dexterity deficits in the ipsilesional upper limb after left
hemisphere damage [57]. On the contrary, we are oriented in
considering the PI differences across patient groups observed in
the present study as a random effect: in fact, the index distribution
is apparently very similar across groups and, after checking that no
difference was observed between RUSN+ and RUSN2 groups, a
t-test comparison between pooled right brain-damaged groups and
left brain-damaged group did not detect any difference. Further
studies will be necessary to understand if abnormal PI is a
nonspecific outcome of a brain damage or if it can be related to
specific typology of patients.
This research indicates that the performance in a search test
cannot be globally classified as normal or abnormal only on the
basis of the final outcome, in this case a neglect score quantifying
the unbalance between the number of omissions in the two
hemifields, but other performance-related aspects concerning
organization, velocity, efficiency should be taken into account.
Accordingly an abnormal behaviour could be ultimately char-
acterised by a normal neglect score associated with abnormal
performance indexes: the differences in the search ability between
the control group and the RUSN2 group, which the touchscreen
method had evidenced, demonstrates that an analytical approach,
such as the touchscreen one, has a higher sensitivity, when
compared to synthetic approaches such as the traditional pencil-
and-paper tests, to factors potentially affecting the cognitive
performance.
Conversely, the fact that 7 (out of 55) patients from the RUSN+group had a normal neglect score NS at the touchscreen test does
not contradict the stated higher sensitivity of the touchscreen
method. First of all, it should be noted that even the comparison of
scores of the five pencil-and-paper tests in the RUSN+ group
(available in 50 out of 55 RUSN+ subjects) evidenced noticeable
incongruencies: the majority (29 out 50) was neglect-positive just in
one or two pencil-and-paper tests and only few individuals (2 out
of 50) were neglect-positive in all five pencil-and-paper tests.
Secondly, those 7 RUSN+ patients, who were positive at the
pencil-and-paper battery and had a normal neglect score in the
touchscreen test, had abnormal values in the other Performance
Indexes measured by the touchscreen test.
Search strategies and search tacticsIt is useful to adopt the concepts of strategy and tactic in the
analysis of a search task: tactic, literally the way a fighter negotiates
a close encounter with an enemy, is in the present context how a
subject negotiates the search for the next target, just after having
cancelled one out. Strategy is an overall organized and
recognizable evolution of the searching performance.
It is worth to note that strategy is a characteristic of a high level
of intelligence, while the searching task could be fulfilled even in
absence of a strategy and just adopting a working tactic (for
example, always look for the closest available target). Typically, an
exclusive tactical approach does not produce an efficient search
performance (such as good soldiers cannot win without a good
chief officer).
The XC/YC couple seems to represent well the search strategy:
in this sense search strategy consists of a predefined project which
stands throughout the entire task. As for the results, the most
common search strategy among controls is to scan top-down
horizontally the display. Along with a worsening of the search
ability and neglect onset (higher NS) a search strategy in which
patients scan leftward vertically the display is increasingly
observed. This finding is in accordance to the one reported by
Manly [43]: control subjects started in the upper left sector, while
neglect patients started exploring on the extreme right sectors.
The presented results, which show values of indexes related to
search strategic aspects NC, PI, XC and YC in the patients’
groups that partially overlap the values observed in the control
group, support the conclusions of previous studies in which a strict
relation between neglect and chaotic search strategy was not
always observed. Neglect patients can still perform an organized
search [41] and, accordingly, a strong association was not found in
RUSN+ patients between neglect score NS and organization-
related index NC (rNS,NC = 0.47).
Other indexes, such as Latency (LI) and Proximity (PI), seem
more related to tactical aspects. It is possible to hypothesize a set of
alternative target tracking tactics: a Closer target tactic character-
ized by extremely low PI values (for null PI values, it becomes a
Closest target tactic in which the next searched target is the closest
one); a Miner tactic when it is preferred to maintain a search
direction approximately in front of the current direction; a
Climber tactic (in which the subject explores following an
imaginary winding lane); a Chaotic motion (the perfectly
disorganized approach in which any target tracking restarts from
a full display analysis and produces a search path that jumps from
any target couple). Every single one of these tactics is compatible
with any organized search strategy (with the exclusion of the
chaotic one). It is worth noting that Proximity tended to decrease
in the contralesional visual field in RUSN+ and LUSN2 groups:
such evidence could be interpreted as resulting from a more
tactical (or, alternatively, a less strategical) approach in the
contralesional field.
ConclusionsThe proposed testing setup is able to provide detailed insight in
the human visual exploratory skill.
Normal control subjects show variability of indexes displaying
how it is not possible to identify one single normal modality. This
evidence may be related to the redundancy of the cognitive
resources in normal subjects.
Despite controls’ variability, groups of homogeneous patients
with unilateral brain lesion (right or left) and possible cognitive
disturbances (neglect absent or present) show a statistically
significant difference in almost any index considered. Also,
differences are evidenced within each group.
The results demonstrate that right brain-damaged patients not
showing neglect at pencil-and-paper tests (RUSN2) are positioned
between controls and neglect patients. They seem to belong to a
‘‘gray’’ area where neglect, as it is commonly defined, is not
present but nonetheless the exploratory skills cannot be assumed as
‘‘normal’’.
Particularly the gradient indexes have showed how this mild
exploratory disorder is strictly connected to neglect: while neglect
is the inability to identify targets in some part of the visual field
(typically left), these subjects show increasing difficulties and
worsening performances when searching target towards the left
Touchscreen Test for Patients with/without Neglect
PLoS ONE | www.plosone.org 13 February 2012 | Volume 7 | Issue 2 | e31511
visual field. The gradient of search performance indexes is
nonetheless often present in the ipsilesional side of the display.
Confirming previous remarks from the literature [41] it has also
been observed that neglect does not necessarily imply a
disorganized search: normal subjects tend to prefer a top down
search strategy alternating horizontal rasters from left to right and
right to left. Neglect patients and also a part of right brain-
damaged patients without clinical neglect tend to prefer, when
able to perform an organized search, a right to left search strategy
alternating vertical rasters. While a discussion of the reasons about
the normal preference for a reading-like strategy is beyond the
scope of this paper, the right brain-damaged patients preferred
strategies in line with the gradient concept. If we consider that the
subject is aware of his difficulty of exploring towards left, we can
imagine his exploratory task such as tracking mushrooms on a
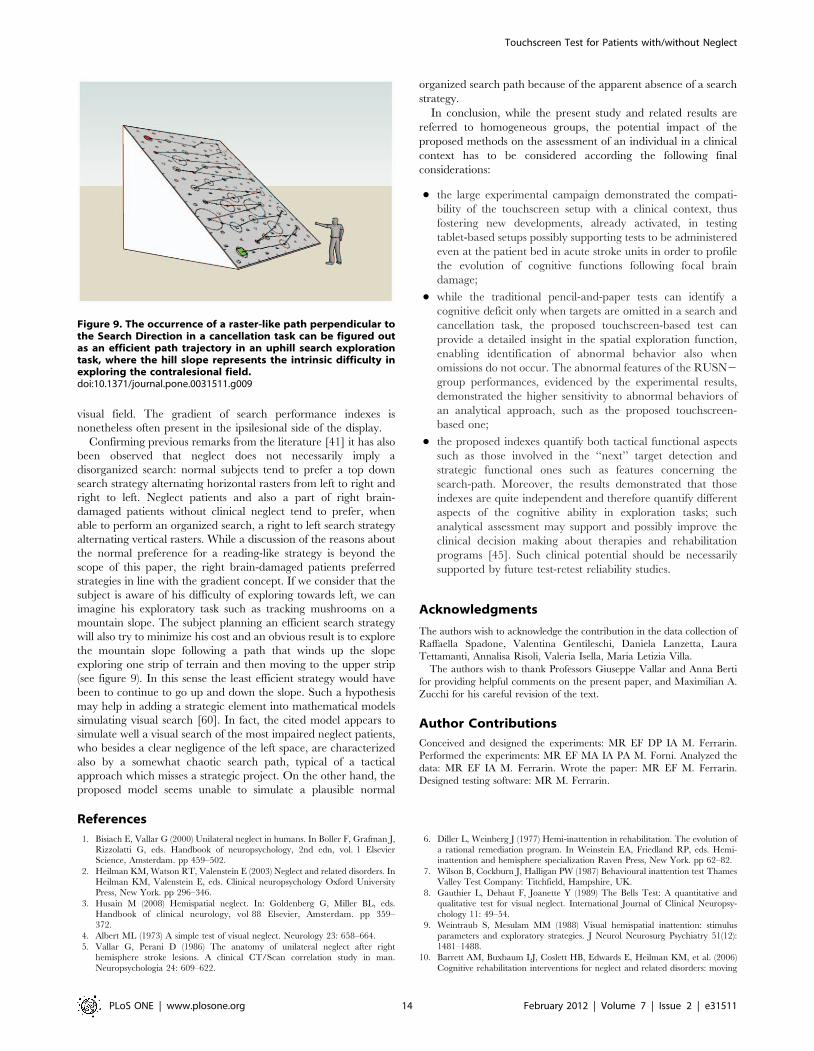
mountain slope. The subject planning an efficient search strategy
will also try to minimize his cost and an obvious result is to explore
the mountain slope following a path that winds up the slope
exploring one strip of terrain and then moving to the upper strip
(see figure 9). In this sense the least efficient strategy would have
been to continue to go up and down the slope. Such a hypothesis
may help in adding a strategic element into mathematical models
simulating visual search [60]. In fact, the cited model appears to
simulate well a visual search of the most impaired neglect patients,
who besides a clear negligence of the left space, are characterized
also by a somewhat chaotic search path, typical of a tactical
approach which misses a strategic project. On the other hand, the
proposed model seems unable to simulate a plausible normal
organized search path because of the apparent absence of a search
strategy.
In conclusion, while the present study and related results are
referred to homogeneous groups, the potential impact of the
proposed methods on the assessment of an individual in a clinical
context has to be considered according the following final
considerations:
N the large experimental campaign demonstrated the compati-
bility of the touchscreen setup with a clinical context, thus
fostering new developments, already activated, in testing
tablet-based setups possibly supporting tests to be administered
even at the patient bed in acute stroke units in order to profile
the evolution of cognitive functions following focal brain
damage;
N while the traditional pencil-and-paper tests can identify a
cognitive deficit only when targets are omitted in a search and
cancellation task, the proposed touchscreen-based test can
provide a detailed insight in the spatial exploration function,
enabling identification of abnormal behavior also when
omissions do not occur. The abnormal features of the RUSN2
group performances, evidenced by the experimental results,
demonstrated the higher sensitivity to abnormal behaviors of
an analytical approach, such as the proposed touchscreen-
based one;
N the proposed indexes quantify both tactical functional aspects
such as those involved in the ‘‘next’’ target detection and
strategic functional ones such as features concerning the
search-path. Moreover, the results demonstrated that those
indexes are quite independent and therefore quantify different
aspects of the cognitive ability in exploration tasks; such
analytical assessment may support and possibly improve the
clinical decision making about therapies and rehabilitation
programs [45]. Such clinical potential should be necessarily
supported by future test-retest reliability studies.
Acknowledgments
The authors wish to acknowledge the contribution in the data collection of
Raffaella Spadone, Valentina Gentileschi, Daniela Lanzetta, Laura
Tettamanti, Annalisa Risoli, Valeria Isella, Maria Letizia Villa.
The authors wish to thank Professors Giuseppe Vallar and Anna Berti
for providing helpful comments on the present paper, and Maximilian A.
Zucchi for his careful revision of the text.
Author Contributions
Conceived and designed the experiments: MR EF DP IA M. Ferrarin.
Performed the experiments: MR EF MA IA PA M. Forni. Analyzed the
data: MR EF IA M. Ferrarin. Wrote the paper: MR EF M. Ferrarin.
Designed testing software: MR M. Ferrarin.
References
1. Bisiach E, Vallar G (2000) Unilateral neglect in humans. In Boller F, Grafman J,
Rizzolatti G, eds. Handbook of neuropsychology, 2nd edn, vol. 1 ElsevierScience, Amsterdam. pp 459–502.
2. Heilman KM, Watson RT, Valenstein E (2003) Neglect and related disorders. InHeilman KM, Valenstein E, eds. Clinical neuropsychology Oxford University
Press, New York. pp 296–346.
3. Husain M (2008) Hemispatial neglect. In: Goldenberg G, Miller BL, eds.
Handbook of clinical neurology, vol 88 Elsevier, Amsterdam. pp 359–
372.
4. Albert ML (1973) A simple test of visual neglect. Neurology 23: 658–664.
5. Vallar G, Perani D (1986) The anatomy of unilateral neglect after right
hemisphere stroke lesions. A clinical CT/Scan correlation study in man.
Neuropsychologia 24: 609–622.
6. Diller L, Weinberg J (1977) Hemi-inattention in rehabilitation. The evolution of
a rational remediation program. In Weinstein EA, Friedland RP, eds. Hemi-inattention and hemisphere specialization Raven Press, New York. pp 62–82.
7. Wilson B, Cockburn J, Halligan PW (1987) Behavioural inattention test ThamesValley Test Company: Titchfield, Hampshire, UK.
8. Gauthier L, Dehaut F, Joanette Y (1989) The Bells Test: A quantitative andqualitative test for visual neglect. International Journal of Clinical Neuropsy-
chology 11: 49–54.
9. Weintraub S, Mesulam MM (1988) Visual hemispatial inattention: stimulus
parameters and exploratory strategies. J Neurol Neurosurg Psychiatry 51(12):
1481–1488.
10. Barrett AM, Buxbaum LJ, Coslett HB, Edwards E, Heilman KM, et al. (2006)
Cognitive rehabilitation interventions for neglect and related disorders: moving
Figure 9. The occurrence of a raster-like path perpendicular tothe Search Direction in a cancellation task can be figured outas an efficient path trajectory in an uphill search explorationtask, where the hill slope represents the intrinsic difficulty inexploring the contralesional field.doi:10.1371/journal.pone.0031511.g009
Touchscreen Test for Patients with/without Neglect
PLoS ONE | www.plosone.org 14 February 2012 | Volume 7 | Issue 2 | e31511
from bench to bedside in stroke patients. Journal of Cognitive Neuroscience 18,
7: 1223–1236.11. Azouvi P, Samuel C, Dreyfus AL, Bernati T, Bartolomeo P, et al. (2002)
Sensitivity of clinical and behavioural tests of spatial neglect after right
hemisphere stroke. Journal of Neurology, Neurosurgery and Psychiatry 73:160–166.
12. Adair JC, Barrett AM (2008) Spatial neglect: clinical and neuroscience review.Annals of the New York Academy of Science 1142: 21–43.
13. Husain M, Mannan S, Hodgson T, Wojciulik E, Driver J, et al. (2001) Impaired
spatial working memory across saccades contributes to abnormal search inparietal neglect. Brain 124(5): 941–952.
14. Malhotra P, Jager HR, Parton A, Greenwood R, Playford ED, et al. (2005)Spatial working memory capacity in unilateral neglect. Brain 128(2): 424–435.
15. Hillstrom AP, Husain M, Shapiro KL, Rorden C (2004) Spatiotemporaldynamics of attention in visual neglect: a case study. Cortex 40(3): 433–440.
16. Konczak J, Himmelbach M, Perenin MT, Karnath HO (1999) Do patients with
neglect show abnormal hand velocity profiles during tactile exploration ofperipersonal space? Experimental Brain Research 128(1–2): 219–23.
17. Berti A, Smania N, Rabuffetti M, Ferrarin M, Spinazzola L, et al. (2002) Codingof far and near space during walking in neglect patients. Neuropsychology 16(3):
390–399.
18. Mattingley JB, Bradshaw JL, Bradshaw JA, Nettleton NC (1994) Residualrightward attentional bias after apparent recovery from right hemisphere
damage: implications for a multicomponent model of neglect. Journal ofNeurology, Neurosurgery and Psychiatry 57(5): 597–604.
19. Lafosse C, Kerckhofs E, Troch M, Vandenbussche E (2003) Upper limbexteroceptive somatosensory and proprioceptive sensory afferent modulation of
hemispatial neglect. Journal of Clinical and Experimental Neuropsychology
25(3): 308–323.20. Schendel KL, Robertson LC (2002) Using reaction time to assess patients with
unilateral neglect and extinction. Journal of Clinical and ExperimentalNeuropsychology 24(7): 941–950.
21. Ladavas E, Petronio A, Umilta C (1990) The deployment of visual attention in
the intact field of hemineglect patients. Cortex 26(3): 307–317.22. Behrmann M, Meegan DV (1998) Visuomotor processing in unilateral neglect.
Consciousness and Cognition 7: 381–409.23. Husain M, Mattingley JB, Rorden C, Kennard C, Driver J (2000) Distinguishing
sensory and motor biases in parietal and frontal neglect. Brain 123(8):1643–1659.
24. Deouell LY, Sacher Y, Soroker N (2005) Assessment of spatial attention after
brain damage with a dynamic reaction time test. Journal Of The InternationalNeuropsychological Society 11: 697–707.
25. Ptak R, Golay L (2006) Temporal dynamics of attentional control settings inpatients with spatial neglect. Brain Research 1092: 190–197.
26. Eramudugolla R, Mattingley JB (2008) Spatial gradient for unique-feature
detection in patients with unilateral neglect: evidence from auditory and visualsearch. Neurocase 15(1): 24–31.
27. Erez ABH, Katz N, Ring H, Soroker N (2009) Assessment of spatial neglectusing computerised feature and conjunction visual search tasks. Neuropsycho-
logical Rehabilitation 19, 5: 677–695.28. Shimodozono M, Matsumoto S, Miyata R, Etoh S, Tsujio S, Kawahira K (2006)
Perceptual, premotor and motor factors in the performance of a delayed-
reaching task by subjects with unilateral spatial neglect. Neuropsychologia44(10): 1752–1764.
29. Halligan PW, Burn JP, Marshall JC, Wade DT (1992) Visuo-spatial neglect:qualitative differences and laterality of cerebral lesion. Journal of Neurology,
Neurosurgery and Psychiatry 55: 1060–1068.
30. Butler BC, Eskes GA, Vandorpe RA (2004) Gradients of detection in neglect:comparison of peripersonal and extrapersonal space. Neuropsychologia 42(3):
346–358.31. Sarri M, Greenwood R, Kalra L, Driver J (2009) Task-related modulation of
visual neglect in cancellation tasks. Neuropsychologia 47(1): 91–103.
32. Samuelsson H, Hjelmquist EK, Jensen C, Blomstrand C (2002) Search patternin a verbally reported visual scanning test in patients showing spatial neglect.
Journal of the International Neuropsycholical Society 8(3): 382–394.33. Donnelly N, Guest R, Fairhurst M, Potter J, Deighton A, et al. (1999)
Developing algorithms to enhance the sensitivity of cancellation tests ofvisuospatial neglect. Behavior Research Methods, Instruments, & Computers
31: 668–673.
34. Guest RM, Fairhurst MC, Potter JM (2002) Diagnosis of visuo-spatial neglectusing dynamic sequence features from a cancellation task. Pattern Analysis And
Applications 5(3): 261–270.
35. Liang Y, Guest RM, Fairhurst MC, Potter JM (2007) Feature-based assessment
of visuo-spatial neglect patients using hand-drawing tasks. Pattern Analysis andApplications 10(4): 361–374.
36. Mapstone M, Weintraub S, Nowinski C, Kaptanoglu G, Gitelman DR,
Mesulam MM (2003) Cerebral hemispheric specialization for spatial attention:spatial distribution of search-related eye fixations in the absence of neglect.
Neuropsychologia 41(10): 1396–1409.
37. Behrmann M, Watt S, Black SE, Barton JJS (1997) Impaired visual search in
patients with unilateral neglect: an oculographic analysis. Neuropsvchologia 35,11: 1445–1458.
38. Muri RM, Cazzoli D, Nyffeler T, Pfugshaupt T (2009) Visual exploration
pattern in hemineglect. Psychological Research 73: 147–157.
39. Karnath HO, Niemeier M, Dichgans J (1998) Space exploration in neglect.
Brain 121(12): 2357–2367.
40. Parton A, Malhotra P, Nachev P, Ames D, Ball J, et al. (2006) Space re-exploration in hemispatial neglect. Neuroreport 17(8): 833–836.
41. Mark VW, Woods AJ, Ball KK, Roth DL, Mennemeier M (2004) Disorganized
search on cancellation is not a consequence of neglect. Neurology 63(1): 78–84.
42. Woods AJ, Mark VW (2007) Convergent validity of executive organization
measures on cancellation. Journal of Clinical and Experimental Neuropsychol-ogy 29(7): 719–723.
43. Manly T, Dove A, Blows S, George M, Noonan MP, et al. (2009) Assessment of
unilateral spatial neglect: scoring star cancellation performance from video
recordings–method, reliability, benefits, and normative data. Neuropsychology23(4): 519–528.
44. Rabuffetti M, Ferrarin M, Spadone R, Pellegatta D, Gentileschi V, et al. (2002)
Touch-screen system for assessing visuo-motor exploratory skills in neuropsy-chological disorders of spatial cognition. Medical and Biological Engineering
and Computing 40(6): 675–686.
45. Pignatti R, Rabuffetti M, Imbornone E, Mantovani F, Alberoni M, et al. (2005)
Specific impairments of selective attention in mild Alzheimer’s disease. Journalof Clinical and Experimental Neuropsychology 27(4): 436–448.
46. Folstein MF, Folstein SE, Mchugh PR (1975) Mini-mental state. A practical
method for grading the cognitive state of patients for the clinician. Journal of
Psychiatric. Research 12: 189–198.
47. Measso G, Cavarzeran F, Zappala G, Lebowitz BD, Crook TH, et al. (1993)The mini-mental state examination: normative study of an Italian random
sample. Developmental Neuropsychology 9: 77–85.
48. Vallar G, Rusconi ML, Fontana S, Musicco M (1994) Tre test di esplorazionevisuo-spaziale: taratura su 212 soggetti normali. Archivio di Psicologia,
Neurologia e Psichiatria 55: 827–841.
49. Massironi M, Antonucci G, Pizzamiglio L, Vitale MV, Zoccolotti PL (1988) The
Wundt-Jastrow illusion in the study of spatial hemi-inattention, Neuropsycho-logia 26: 161–166.
50. Zoccolotti P, Antonucci G, Judica A, Montenero P, Pizzamiglio L, et al. (1989)
Incidence and evolution of the hemi-neglect disorder in chronic patients with
unilateral right brain-damage. International Journal of Neuroscience 47:209–216.
51. Siegel S, Castellan NJ (1988) ‘‘Nonparametric Statistics for the Behavioral
Sciences’’ (second edition). New York: McGraw–Hill.
52. Larose DT (2006) Data mining methods and models John Wiley & Sons Inc.
53. Potter J, Deighton T, Patel M, Fairhurst M, Guest R, et al. (2000) Computer
recording of standard tests of visual neglect in stroke patients. ClinicalRehabilitation 14: 441–446.
54. Kinsbourne M (1987) Mechanisms of unilateral neglect. In Jeannerod M, ed.
Neurophysiological and neuropsychological aspects of spatial neglect Elsevier,Amsterdam. pp 69–86.
55. Kinsbourne M (1993) Orientational bias model of unilateral neglect: evidencefrom attentional gradients within hemi-space. In Robertson IH, Marshall JC,
eds. Unilateral neglect: clinical and experimental studies Lawrence Erlbaum,Hillsdale, NJ. pp 63–86.
56. Eglin M, Robertson LC, Knight RT, Brugger P (1994) Search deficits in neglect
patients are dependent on size of the visual scene. Neuropsychology 4: 451–463.
57. Sunderland A (2000) Recovery of ipsilateral dexterity after stroke. Stroke 31(2):
430–3.
58. Cherney LR (2004) Aphasia, alexia, and oral reading. Topics Stroke Rehabil11(1): 22–36. Review.
59. Blangero A, Ota H, Rossetti Y, Fujii T, Ohtake H, et al. (2010) Systematic
retinotopic reaching error vectors in unilateral optic ataxia. Cortex 46(1): 77–93.
60. Lanyon LJ, Denham SL (2010) Modelling Visual Neglect: Computational
Insights into Conscious Perception. PLoS ONE 5(6): e11128.
Touchscreen Test for Patients with/without Neglect
PLoS ONE | www.plosone.org 15 February 2012 | Volume 7 | Issue 2 | e31511