spatial variability of arsenic in 6000 tube wells in a...
TRANSCRIPT

Spatial variability of arsenic in 6000 tube wells in a 25 km2 area
of Bangladesh
A. van Geen,1 Y. Zheng,1,2 R. Versteeg,1,3 M. Stute,1,4 A. Horneman,1,5 R. Dhar,2
M. Steckler,1 A. Gelman,6 C. Small,1 H. Ahsan,7 J. H. Graziano,8 I. Hussain,9
and K. M. Ahmed10
Received 30 July 2002; revised 13 December 2002; accepted 7 March 2003; published 31 May 2003.
[1] Arsenic concentrations measured by graphite furnace atomic absorption range from< 5 to 900 mg/L in groundwater pumped from 6000 wells within a 25 km2 area ofBangladesh. The proportion of wells that exceed the Bangladesh standard for drinkingwater of 50 mg/L arsenic increases with depth from 25% between 8 and 10 m to 75%between 15 and 30 m, then declines gradually to less than 10% at 90 m. Some villageswithin the study area do not have a single well that meets the standard, while others havewells that are nearly all acceptable. In contrast to the distribution of arsenic in the 8–30 mdepth range which does not follow any obvious geological feature, the arsenic content ofgroundwater associated with relatively oxic Pleistocene sand deposits appears to beconsistently low. The depth of drilling necessary to reach these low-As aquifers ranges from30 to 120 m depth within the study area. INDEX TERMS: 1030 Geochemistry: Geochemical cycles
(0330); 1045 Geochemistry: Low-temperature geochemistry; 1806 Hydrology: Chemistry of fresh water; 1831
Hydrology: Groundwater quality; 1884 Hydrology: Water supply; KEYWORDS: arsenic, groundwater,
Bangladesh, tube well
Citation: van Geen, A., et al., Spatial variability of arsenic in 6000 tube wells in a 25 km2 area of Bangladesh, Water Resour. Res.,
39(5), 1140, doi:10.1029/2002WR001617, 2003.
1. Introduction
[2] Untreated groundwater is the principal source ofpotable water for the significant fraction of the world’spopulation that is not connected to a centralized watersupply system, regardless of a country’s wealth. In theUnited States, for instance, an estimated 42 million people(16% of the population) rely on their own private well fordrinking water [Solley et al., 1998]. In Bangladesh alone,about 130 million people (97% of the population) obtaintheir water from an estimated 10 million tube wells thathave been installed across this predominantly rural countryat an accelerating rate over the past 30 years [Department ofPublic Health Engineering (DPHE) et al., 1999; British
Geological Survey and Department of Public Health Engi-neering, 2001] (hereinafter referred to as BGS-DPHE).Although international organizations such as UNICEF inthe 1970s and nongovernmental organization (NGOs) ini-tially set the example by installing and promoting the use oftube wells, the vast majority of existing tube wells inBangladesh were paid for privately by individual house-holds [van Geen et al., 2002]. A comparison of the cost ofinstalling such a well (�US$50 for a typical 50-ft well) withthe per capita GNP of Bangladesh of US$1400, afteradjusting for purchasing power [World Bank, 1999], is anindication of the popularity of groundwater as a source ofpathogen-free drinking water. While the density of wells inBangladesh may be particularly high, it probably accountsfor only a fraction of the wells installed throughout SouthAsia, a region where accessible aquifers are widely dis-tributed in sandy floodplain and delta deposits.[3] Surveys of Bangladesh that followed the initial dis-
covery of cases of arsenicosis attributable to elevatedgroundwater arsenic in the mid-1980s in West Bengal,India [Chakraborty and Saha, 1987], indicate that aboutone third of the existing wells yield groundwater that doesnot meet the local standard of 50 mg/L for arsenic indrinking water [Dhar et al., 1997; DPHE et al., 1999;BGS-DPHE; McArthur et al., 2001]. Two thirds of thewells tested exceed the guideline value of 10 mg/L of theWorld Health Organization for arsenic in drinking water setin 1993 [World Health Organization, 1996]. There aretroubling signs that other South Asian countries such asVietnam, Cambodia, Pakistan, Myanmar, and Nepal arealso significantly affected [BGS-DPHE, 2001; Berg et al.,2001]. Even if the entire population of Bangladesh could beswitched to low-arsenic water overnight, past exposure is
1Lamont-Doherty Earth Observatory, Columbia University, Palisades,New York, USA.
2Queens College, City University of New York, Flushing, New York,USA.
3Also at Idaho National Environmental and Engineering Laboratory,Idaho Falls, Idaho, USA.
4Also at Barnard College, New York, New York, USA.5Also at Department of Earth and Environmental Engineering, Columbia
University, New York, New York, USA.6Statistics Department, Columbia University, New York, New York,
USA.7Department of Epidemiology, Mailman School of Public Health,
Columbia University, New York, New York, USA.8Department of Environmental Health Sciences, Mailman School of
Public Health, Columbia University, New York, New York, USA.9National Institute of Preventive and Social Medicine, Dhaka,
Bangladesh.10Geology Department, Dhaka University, Dhaka, Bangladesh.
Copyright 2003 by the American Geophysical Union.0043-1397/03/2002WR001617$09.00
HWC 3 - 1
WATER RESOURCES RESEARCH, VOL. 39, NO. 5, 1140, doi:10.1029/2002WR001617, 2003

predicted to result in many thousands of additional deathsfrom various cancers each year, and this for the next severaldecades [Smith et al., 2000; Chen and Ahsan, 2003; Yu etal., 2003].[4] A compilation of 51,000 field tests for arsenic
conducted in Bangladesh by the Department for PublicHealth Engineering and UNICEF (Figure 1) shows thatapproximately one third of the country is essentiallyunaffected while over 60% of tube wells tested positivewith a field kit (i.e., >100 mg/L [Bangladesh RuralAdvance Commission (BRAC), 2000]). One of the vexingaspects of the mounting arsenic crisis in Bangladesh andelsewhere in South Asia is the bewildering degree ofspatial variability of groundwater arsenic concentrations.Such sharp contrasts have convincingly been linked byvarious recent studies to the redox state of the underlyingsediment with, broadly speaking, an association of lowgroundwater arsenic with relatively oxic, uplifted Pleisto-cene aquifers, and high groundwater arsenic concentrations
in reducing Holocene aquifers [DPHE et al., 1999; BGS-DPHE; Nickson et al., 1998, 2000].[5] In this paper, we document the spatial scale of arsenic
variability for a transitional region in Araihazar upazilla,one of 460 similar administrative units in Bangladesh(Figure 1). DPHE/UNICEF field tests previously identified75 high-As wells out of a total of 129 sampled within the190 km2 area of the upazilla. Araihazar is located 30 kmeast of Dhaka and marks the boundary between the upliftedPleistocene Madhupur Terrace to the west that is unaffectedby arsenic (no high-As tube wells out of 9 sampled byDPHE/UNICEF in neighboring Rupgang upazilla) and alarge region to the south that is particularly affected (49high-As wells out of 50 sampled in neighboring Homnaupazilla). Additional sampling conducted in January 2000guided us in the selection of a study area that contained tubewells spanning a wide range in As concentrations [Zheng etal., 2003]. With 6000 tube wells covering an area of 25 km2,the resolution of our geo-referenced data set is particularly
Figure 1. Proportion of tube wells that tested positive for As in upazillas of Bangladesh. Map preparedby J. W. Rozenboom (UNICEF-Dhaka) on the basis of 51,000 field tests (i.e., >100 mg/L) conductedacross the country by DPHE/UNICEF in 1997–1999, substituted by with field tests for all wells inSonargoan, Jhikargacha, Bera, Kachua, and Manikganj Sadar upazillas, and augmented with laboratoryanalyses (>50 mg/L) from the national survey of BGS-DPHE. Surrounding topography based on theGTOPO30 digital elevation model of the USGS EROS Data Center. Study area in Araihazar upazilla isindicated by a small white rectangle.
HWC 3 - 2 VAN GEEN ET AL.: SPATIAL VARIABILITY OF GROUNDWATER ARSENIC
high. Every well within our study area was sampled andanalyzed to set the stage for a coupled long-term study ofthe health effects of arsenic, as well as potential remedies(http://superfund.ciesin.columbia.edu). Although limited incomparison to the millions of wells distributed over theentire country, our data set is unique in the sense thatongoing nation-wide testing campaigns typically use asemi-quantitative field kit for arsenic. In addition, thesecampaigns generally do not take advantage of the GlobalPositioning System (GPS) to locate each well. Our samplingdensity in Araihazar is also considerably higher than in threespecial study areas (1 tube well per 7 km2) examined as partof the highly informative country-wide work of DPHE et al.[1999] and BGS-DPHE. A few previous studies comecloser to the level of detail of the Araihazar survey but theywere limited to a single village [Biswas et al., 1998; BGS-DPHE].[6] The paper starts with a fairly detailed section on
methods and quality control to demonstrate the integrityof this large data set of groundwater As concentrations. Wethen examine the spatial distribution of tube wells inrelation to the subsurface geology of Araihazar and comparebroad patterns in tube well arsenic to the previous nation-wide surveys. This is followed by a more detailed analysisof the arsenic distribution as a function of depth for theentire sampling area. We also examine more closely the Asdistribution in two 0.5 km2 areas studied in detail in papersby Zheng et al. (manuscript in preparation, 2003) andVersteeg et al. (manuscript in preparation, 2003). Thesecomplementary studies allow us to extend the association ofsome key geological features with variations in groundwaterAs concentrations. The paper concludes with some sugges-tions for mitigation.
2. Methods
2.1. Sampling
[7] Water samples numbered 1–5000 were collectedfrom 4999 contiguous tube wells in Araihazar upazila bysix teams of Bangladeshi university graduates betweenMarch and June 2000. An additional set of 972 samplesnumbered 7001–8000 was collected by the same teamsin November–December 2001. While one member ofeach team collected a water sample from a particularwell, measured its position with a handheld GPS receiver,and identified it by affixing a numbered stainless steelplate, the other asked a household member a series ofquestions, including the date of installation, how the wellwas paid for, and the depth of the well. A householdtypically remembers the depth of its well because it hadto pay for each 15-ft section of 1.5’’ ID PVC pipe thatwent into its construction. The accuracy of well positionsdetermined before 1 May 2000 is estimated to be ±30 m,and ±10 m thereafter when the GPS signal was no longerdegraded. Such a large and complex data set inevitablycontains some gaps: GPS data are missing or obviouslyerroneous for 9 of the total of 5971 tube well samplesthat were collected; depth information is missing for 136samples.[8] After continuous hand-pumping at a rate of 20–35 L/
min for at least five minutes, i.e., for long enough to flushseveral times the 16L internal volume of a typical 15-m (50 ft)
well, a polyethylene graduated cylinder cut off to contain60 ± 2 mL when overflowing was rinsed several times withwell water and then used to fill a high-density polyethyleneNalgene bottle that had been acid-cleaned and rinsed severaltimes with Milli-Q water. The samples were not filteredbased on our experience that in most cases the screeninstalled at the bottom of each well effectively excludesparticles of aquifer material [Zheng et al., 2003]. To the setof 20 sample bottles taken to the field by each team everyday, 1 mL of 7 N Optima HCl was added in advance in ourlocal laboratory for sample preservation. An extra threebottles prepared with the same acid were added to eachdaily set of 20 samples for quality control, one of which wasin addition spiked with 0.6 mL of a 50 mg/L As standardsolution to determine recovery. The purpose of these addi-tions was to identify potential artifacts in the data set causedby poor sample preservation or analysis. One of the extrabottles taken to the field for quality control was filled with60 mL of distilled water from Dhaka University as a blank.[9] In the field, sets of adhesive labels with preprinted ID
numbers were attached to each sample bottle and question-naire at the time of collection. To reduce the chance oftranscription errors from the questionnaire, well ID, GPSposition, and well depth were also marked directly on thebottle. Three sample bottles were filled with water from thefirst tube well sampled by each of the six teams on anygiven day: the first two of these bottles were replicatesamples; the third bottle contained the As spike. A totalof 353 sets of replicates, consistency standards, and blanksdistributed fairly evenly across the 5971 well samples werecollected by the six teams.
2.2. Analytical Methods
[10] All samples were analyzed for As by graphite furnaceatomic absorption (GFAA). The majority of well samples(4,821) and associated quality control samples were ana-lyzed at Lamont-Doherty Earth Observatory (LDEO) with aHitachi Z8200 instrument by diluting each sample 1:5 in amatrix modifier solution containing 50 mg/L Ni and 2% byvolume Optima HNO3. Instrument response was linear up toan absorbance of 0.3, corresponding to a concentration of150 mg/L As (750 mg/L in the undiluted sample). A total of35 well samples containing over 750 mg/L (most of thesewere samples spiked with As) were analyzed again at a 1:10dilution. Instrument drift in sensitivity was corrected bylinear interpolation between sets of standards prepared inpure (i.e., without sample) matrix modifier solution includedat the beginning and at the end of each set of �50 samples.We conservatively estimate a detection limit of 1 mg/L bythis method (5 mg/L in the undiluted sample) taking intoaccount day-to-day variations in the reproducibility of ablank determination for a pure Ni/HNO3 matrix modifiersolution as a function of graphite tube and lamp condition.The arsenic concentration of blanks of distilled water fromBangladesh was always below the detection limit, with theexception of one bottle that had been spiked and another thatcontained a replicate groundwater sample rather than dis-tilled water.[11] The remaining 1,150 well and quality control sam-
ples were analyzed at the Mailman School of Public Health(MSPH) on a Perkin Elmer AAnalyst 600 instrument by1:5 dilution in a 0.2% HNO3 matrix modifier solution with
VAN GEEN ET AL.: SPATIAL VARIABILITY OF GROUNDWATER ARSENIC HWC 3 - 3

Pd and Mg(NO3)2 added as matrix modifiers. No samplefrom this set exceeded the linear range of the instrument(250 mg/L at 0.3 absorbance). Analysis of Standard Refer-ence Material 1643d (Trace elements in Water) from theNational Institute of Standards and Technology certified tocontain 56 mg/L As included with these runs averaged avalue of 61 ± 1 mg/L (n = 6). Intercalibration between thetwo laboratories with a subset of 24 samples covering the<5 to 800 mg/L range showed no systematic differencebetween the two procedures. The intercalibration showedagreement within 50 mg/L for all but two samples, for whichdifferences of 66 and 80 mg/L corresponded to 12 and 14%of the total As concentration, respectively. The two data setswere therefore combined.
2.3. Data Quality Control
[12] Sets of replicate and standard addition samples, aswell as blanks, were typically included in the same run;occasional outliers were analyzed a second time. Overall,the quality control data show the expected trends: replicate
samples generally follow the expected 1 to 1 relation; the Asconcentration of samples with standard additions is offsetfrom this relation by the expected amount (492 mg/L),although with significantly more scatter (Figure 2). Exclud-ing one outlier apparently due to a sampling artifact, thestandard deviation for the difference between replicates is10 mg/L (n = 353), with no apparent dependence on theabsolute As concentration (Figure 3). This standard devia-tion reflects the error from two measurements; we thereforeestimate the standard deviation for an individual measure-ments to be smeas = 10/
p2 = 7 mg/L. Reproducibility was
somewhat better for the method/instrument combinationused at MSPH (±4 mg/L) than at LDEO (±11 mg/L). Thegood match for all but one of the sets of replicates isconsistent with the presence of As in tube well water inthe dissolved (or perhaps colloidal) state. This confirms thatthe slotted screen and the gravel pack installed at the bottomof each well effectively remove aquifer particles whose Ascontribution to a sample upon acidification would have beenhighly variable.[13] To calculate the increase in arsenic concentration
from standard additions in the field, the concentration of thespiked sample was first multiplied by a factor of 61 mL/61.6mL to account for dilution by the As spike itself. From thisvalue, the mean of the two replicates from each well wasthen subtracted. Excluding the 12 sets of quality controlsamples where the As spike was clearly not added, thisdifference averages 498 mg/L, with a standard deviation of56 mg/L (n = 341), i.e., a relative standard deviation of0.112, or 11% (Figure 2). The difference is just within two
Figure 2. Compilation of arsenic analyses for all qualitycontrol samples. Arsenic measurements for well samplescollected as replicates (open circles) and for standardadditions in the field (solid circles) and blanks (shadedtriangles) are shown as function of the As concentrationmeasured in the first sample from each set of quality controlsamples. The expected trends are indicated by two solidlines with a slope of 1, the first passing through the originfor replicates and the other with an intercept of 492 mg/L Ascorresponding to the standard addition. There are a limitednumber of obvious discrepancies relative to these trends.The concentration of one replicate sample increased from<5 mg/L to 200 mg/L over the course of a year, while thearsenic content of the first sample from the same well wasbelow the detection limit. This suggests the replicatecontained a particle of sediment that gradually releasedarsenic after it was acidified. In addition, an As spike wasmistakenly added to a blank instead of a replicate sample;one blank bottle was filled with a replicate sample; andarsenic spikes were not added to 12 out of the 265 sets ofquality control samples.
Figure 3. Variability of replicate determinations andstandard additions. (top) Differences in As concentrationbetween replicate measurements as a function of the meanof the replicates. (bottom) Difference in concentrationsbetween the spiked sample and the mean of the tworeplicate determinations for the unspiked sample, again as afunction of the mean of the replicates. Clear outliersidentified in Figure 2 are excluded in Figure 3.
HWC 3 - 4 VAN GEEN ET AL.: SPATIAL VARIABILITY OF GROUNDWATER ARSENIC

standard deviations of the error of the mean (56 mg/L/p341 = 3 mg/L) from the expected value of 492 mg/L
calculated from the concentration of the spike. This indi-cates that, on average, the analytical procedures that werefollowed eliminated any systematic bias in instrumentresponse for standards prepared in pure matrix modifierrelative to groundwater samples diluted in matrix modifier.For these measurements too, reproducibility of the differ-ence in As concentration between spiked and unspikedsamples was somewhat better at MSPH (±37 mg/L) than atLDEO (±62 mg/L for quality control analyses associatedwith samples 1–5000 and ±43 mg/L for samples 7001–8000, excluding one outlier).[14] The variability of the increase in concentration due
to standard addition reflects several sources of error:imperfect control of sample and/or spike volume in thefield, day-to-day differences in instrument calibration, aswell as potential matrix effects that could be related to thecomposition of a specific groundwater sample (e.g., ionicstrength, other groundwater constituents). To test for matrixeffects, a subset of 8 samples for which the effect of Asadditions in the field deviated significantly from theexpected value were reanalyzed at LDEO, with individualcalibration for each sample by the method of standardadditions to the sample cup. The slopes of these calibra-tions, constrained by As addition of 150, 300, and 500 mg/L,varied around the mean with a standard deviation of 7%while the uncertainty of the individual slopes rangedbetween 0.5 and 2.5%. This suggests that a significantportion of the 11% relative standard deviation for Asrecovery from additions in the field is probably due to arelatively small but detectable matrix dependence of theresponse of the instruments.[15] A simple model described in Appendix A quantifies
the impact of this effect on the uncertainty of the well Asdata, obtained in the majority of cases with a single measure-ment and without standard additions in the field or in thelaboratory. According to this model, an absolute uncertaintyin measured As concentration of 7 mg/L dominates below70 mg/L. Above this concentration, an additional relativeerror of �10% due to differences in sample matrix becomesthe larger source of uncertainty. Although greater accuracycould have been achieved with multiple-point standardadditions performed in the laboratory for each sample, wefelt the marginal improvement would not have justified theadditional effort required, considering the two orders ofmagnitude dynamic range in measured As concentrations.
3. Results
[16] An IKONOS satellite image of our study area inAraihazar was purchased from Space Imaging Inc. to mapthe tube well As data. This image, taken in November 2000,provides reflectance data in four wave bands at 4-m spatialresolution and panchromatic data at 1-m resolution (http://www.spaceimaging.com). The data were processed toemphasize in purple the presence of water in streams, ponds,and irrigated fields without vegetation (Figure 4). Contrast-ing bright areas of the IKONOS image indicate dry, pre-sumably uncultivated fields. Green areas show thevegetation of the fields that are cultivated as well the treecover that identifies the villages. Overlay of the GPS data on
the satellite image indicates that most tube wells are clus-tered in villages. The largest stream meandering in a south-erly direction through our study area is the so-called OldBrahmaputra River. The name underlines the fact that themuch larger Brahmaputra River used to flow through theregion until a major shift in its course in the 1800s[Ferguson, 1863], possibly triggered by a major earthquake.A 10-km long series of villages follows the inner bank of themain meander of the Old Brahmaputra River; the shape ofsome other series of villages further inland suggest theirpossible association with the location of natural levees in thepast. Villages and fields share the available land in roughlyequal proportion in our study area, where the populationdensity of 2600/km2 is nearly three times higher than thenational average. Significantly, responses to a questionnairecollected with the well samples indicate that the vast majorityof these wells were paid for by individual households andtherefore are privately owned [van Geen et al., 2002]. Thesurvey data also indicate that half the existing wells in thestudy area were installed between 1995 and 2000, i.e., afterthe discovery of the epidemic of arsenicosis in Bangladesh.[17] The wide range of As concentrations spanned by
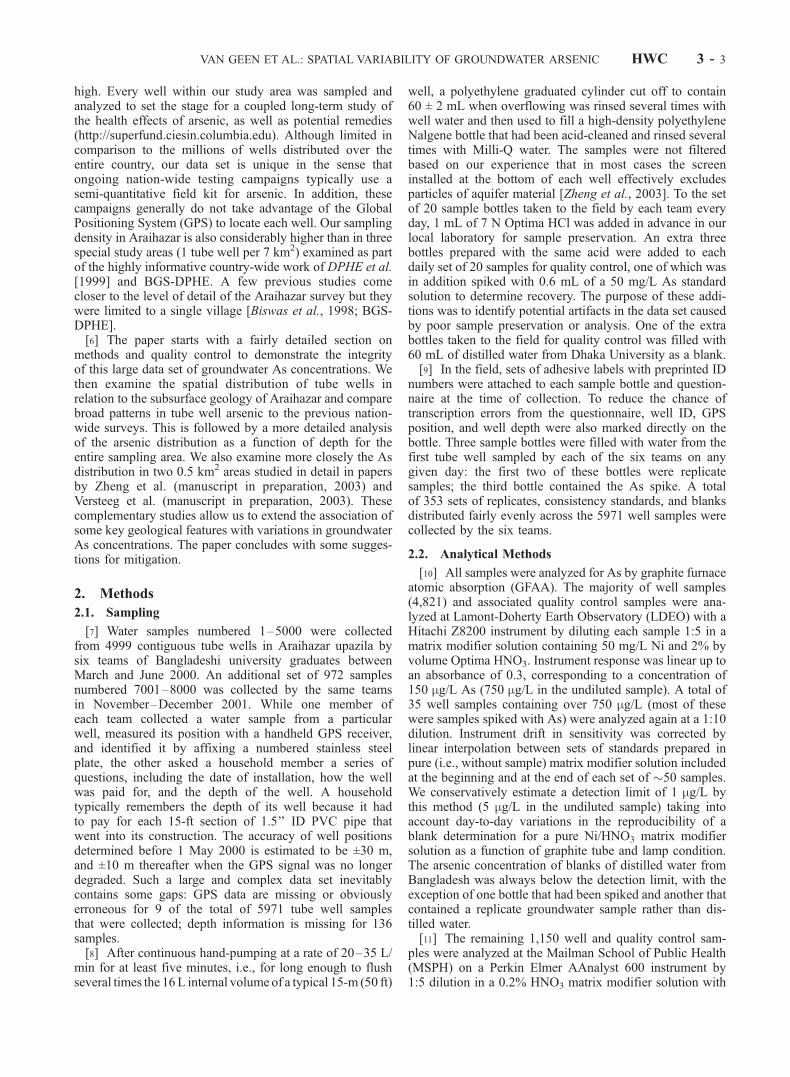
tube wells sampled within Araihazar (<5–860 mg/L) issimilar to that reported for laboratory analyses of waterfrom 3534 tube wells distributed across the entire country[DPHE et al., 1999; BGS-DPHE, 2001]. Of the nearly 6000samples of tube well water from Araihazar that wereanalyzed, 25% contain �10 mg/L As, the WHO guidelinevalue for As in drinking water (Figure 5). Most of the wellswith the lowest As concentrations are located in the north-western portion of the study area (Figure 4). The Asconcentration of another 22% of the samples with higherconcentrations still meets the standard for drinking water inBangladesh of 50 mg/L, which was until recently also thestandard set by the U.S. Environmental Protection Agency.Wells in this secondary category are more widely distributedthroughout the study area. The number of wells with Asconcentrations in the 51–100, 101–200, and 201–900 mg/Lranges is comparable and accounts for 18, 19, and 15% ofthe data set, respectively (Figure 5). Unlike the centralregion of the study area where arsenic concentrations arehighly variable, there are very few wells supplying waterthat meet the Bangladesh standard for As to inhabitants ofthe western and easternmost areas (Figure 4).[18] The overall depth distribution of As within Araihazar
is also remarkably similar to that reported by BGS-DPHEfor the entire country. In this paper, depths are listed in bothmeters and feet because the data were collected, and arelocally referred to, in feet. Although there is considerablescatter in As over the entire 8 to 90 m (25–300 ft) depthrange of wells in Araihazar, concentrations greater than400 mg/L are largely restricted to the 12–24 m (40–80 ft)depth range (Figure 6). Unfortunately, this is also the depthrange for two thirds of all tube wells in the study area.While the correspondence is disturbing, it does not neces-sarily indicate a causal relation between groundwater Aslevels and the density of wells. The average As concen-tration increases steadily from 40 mg/L in the 8–12 m (24–36) ft interval to 160 mg/L in the 20–30 m (65–100 ft)interval (Figure 6). Across the same depth intervals, theproportion of wells that yield water containing over 50 mg/LAs rises from 25 to 80%. Between 30 and 90 m (100 and
VAN GEEN ET AL.: SPATIAL VARIABILITY OF GROUNDWATER ARSENIC HWC 3 - 5

Figure
4.
Distribution
ofAsin
6000
tubewells
ofAraihazar.TheIK
ONOS
SpaceIm
aging
Inc.
satelliteim
age
emphasizes
thepresence
ofwater
atthesurfacein
purple
anddry
landin
white.
Thetworectangularareasareshownas
close-upsin
Figures9and10arediscussed
inmore
detailbyZhengetal.(m
anuscriptin
preparation,2003)andVersteeget
al.(m
anuscriptin
preparation,2003).Thelocationsofthetwosedim
entcorescollectedwithin
thesetwoareasareindicated
byawhitecircle.
HWC 3 - 6 VAN GEEN ET AL.: SPATIAL VARIABILITY OF GROUNDWATER ARSENIC
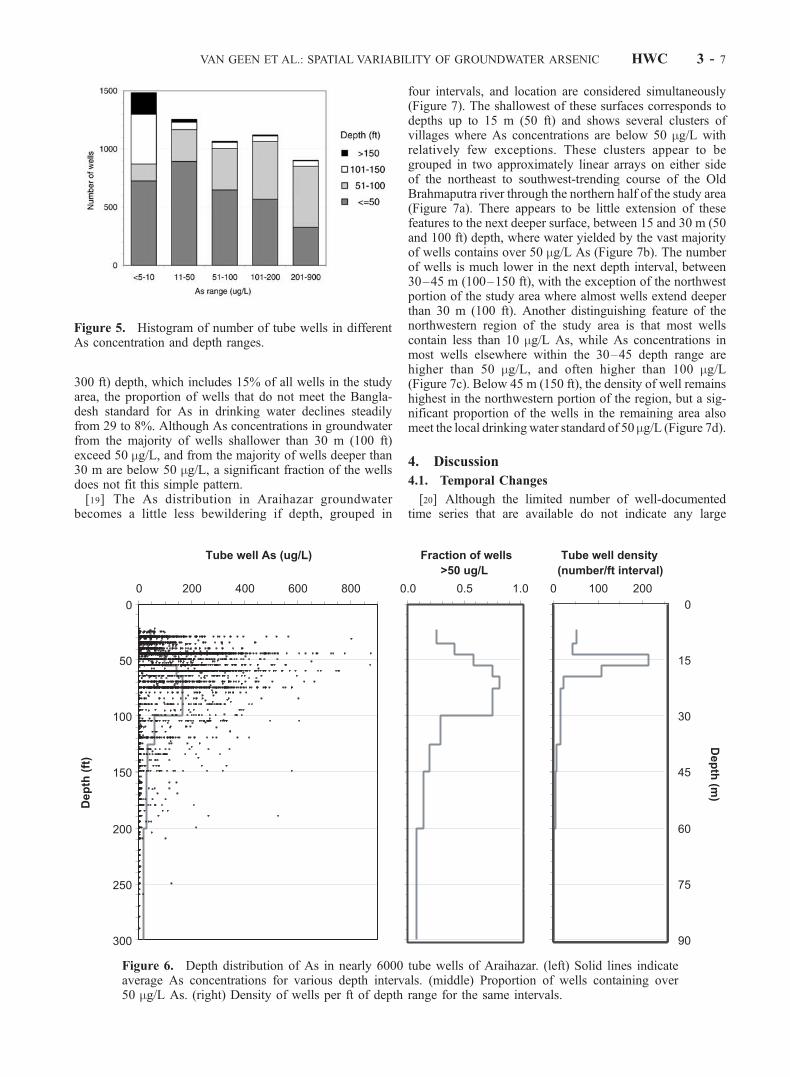
300 ft) depth, which includes 15% of all wells in the studyarea, the proportion of wells that do not meet the Bangla-desh standard for As in drinking water declines steadilyfrom 29 to 8%. Although As concentrations in groundwaterfrom the majority of wells shallower than 30 m (100 ft)exceed 50 mg/L, and from the majority of wells deeper than30 m are below 50 mg/L, a significant fraction of the wellsdoes not fit this simple pattern.[19] The As distribution in Araihazar groundwater
becomes a little less bewildering if depth, grouped in
four intervals, and location are considered simultaneously(Figure 7). The shallowest of these surfaces corresponds todepths up to 15 m (50 ft) and shows several clusters ofvillages where As concentrations are below 50 mg/L withrelatively few exceptions. These clusters appear to begrouped in two approximately linear arrays on either sideof the northeast to southwest-trending course of the OldBrahmaputra river through the northern half of the study area(Figure 7a). There appears to be little extension of thesefeatures to the next deeper surface, between 15 and 30 m (50and 100 ft) depth, where water yielded by the vast majorityof wells contains over 50 mg/L As (Figure 7b). The numberof wells is much lower in the next depth interval, between30–45 m (100–150 ft), with the exception of the northwestportion of the study area where almost wells extend deeperthan 30 m (100 ft). Another distinguishing feature of thenorthwestern region of the study area is that most wellscontain less than 10 mg/L As, while As concentrations inmost wells elsewhere within the 30–45 depth range arehigher than 50 mg/L, and often higher than 100 mg/L(Figure 7c). Below 45 m (150 ft), the density of well remainshighest in the northwestern portion of the region, but a sig-nificant proportion of the wells in the remaining area alsomeet the local drinkingwater standard of 50 mg/L (Figure 7d).
4. Discussion
4.1. Temporal Changes
[20] Although the limited number of well-documentedtime series that are available do not indicate any large
Figure 5. Histogram of number of tube wells in differentAs concentration and depth ranges.
Figure 6. Depth distribution of As in nearly 6000 tube wells of Araihazar. (left) Solid lines indicateaverage As concentrations for various depth intervals. (middle) Proportion of wells containing over50 mg/L As. (right) Density of wells per ft of depth range for the same intervals.
VAN GEEN ET AL.: SPATIAL VARIABILITY OF GROUNDWATER ARSENIC HWC 3 - 7

temporal trends for groundwater As in Bangladesh [BGS-DPHE; van Geen et al., 2002], there is a worrisome trend inour results from Araihazar that suggests that As concen-trations may slowly increase as a tube well ages. Regres-sions of As concentration as a function of year of
installation indicate small but statistically significantdecreases in the mean concentration in several depth inter-vals (Figure 8). This corresponds to an equivalent increasein As concentration with well age. Since the individualslopes were statistically not different from each other, a
Figure 7. Distribution of tube well As in Araihazar for four depth intervals. The color scale of the dotsis the same as in Figure 4. Grey dots indicate the position of all wells. Distorted boxes correspond to theclose-up areas identified in Figure 4 that are enlarged in Figures 9 and 10; black circles indicate thelocation of sediment cores discussed by Zheng et al. (manuscript in preparation, 2003). The location ofcommunity wells is indicated by crosses, together with their corresponding depths (in feet). Greencontours mark areas where wells consistently meet the Bangladesh standard at depths of 30 m (100 ft)and depths >45 m (150 ft), respectively.
HWC 3 - 8 VAN GEEN ET AL.: SPATIAL VARIABILITY OF GROUNDWATER ARSENIC

pooled estimate of an increase of 16 ± 2 mg/L in well As perdecade of well age was calculated by imposing a commonslope on the different depth intervals, while allowing fordifferent means. Essentially the same result is obtained forregressions on the log of the As concentrations. The pooledslope estimate of the slope indicates an increase of 0.019 ±0.003 in log As concentration per year. This suggests that,on average, As levels may have increased by about 2% peryear when comparing wells from the same depth intervalwithin our study area. Such a small increase is not incon-sistent with several time series of groundwater As fromAraihazar that do not show a detectable change becausethese span only a single year at this point [van Geen et al.,2002]. Burgess et al. [2000, 2002] also noted increases ingroundwater As as a function of well age on the basis of theBGS-DPHE data, but without taking depth into account orthe possibility that the mean depth of installation of wellshas changed over time. The explanation proposed byBurgess et al. [2000] is that, given a patchy As distributionat depth, the likelihood of drawing high As water from a
particular well increases as the integrated amount of waterpumped from a given well increases. Potential changes ingroundwater As concentration over longer timescales there-fore cannot be excluded at this point. Invoking a differentscenario linking As mobilization to the penetration of labiledissolved organic matter in shallow aquifers, Harvey et al.[2002] recently suggested that groundwater As concentra-tions may have increased as a result of increased waterwithdrawal for irrigation. The ensuing controversy regard-ing this important issue [van Geen et al., 2003b] underlinesthe need for establishing As baseline levels in potentiallysensitive areas and continued monitoring of such sites.
4.2. Groundwater As and Local Stratigraphy
[21] A closer examination of two contrasting 0.5 km2
regions within the study area illustrates the relation betweenthe main features of the As distribution and local geology.The first of these areas covers the transition from thenorthwest, where wells are almost all deeper than 30 m(100 ft) and low in As, to a more complex regime to the
Figure 8. Regressions of As concentration as a function of year of installation in nine different depthintervals. The same intervals shown in Figure 6 were used, with the exception of the two deepest intervalswhich were combined into one (150–300 ft) in this analysis. The depth range, the mean arsenicconcentration within that range, and the slope of the regression are listed for each panel.
VAN GEEN ET AL.: SPATIAL VARIABILITY OF GROUNDWATER ARSENIC HWC 3 - 9

south (Figure 9). In this southern portion of the close-up area,wells extending below 30 m (100 ft) depth are low in As inthe vast majority of cases. Tube wells from the same region atshallower depths, however, are highly variable in As and donot exhibit any clear spatial pattern. There is no such contrastbetween As concentration in shallow and deep wells in thesecond close-up area where elevated As concentrationsextend to 60 m (200 ft) depth (Figure 10). Most wells containover 100 mg/L As in this village and only a handful meet thelocal standard for As drinking water of 50 mg/L.[22] The north–south section of groundwater As in the
first of the close-up areas shows that there are few wells withreported depths between 21 and 30 m (70 and 100 ft)throughout this region (Figure 9). Zheng et al. (manuscriptin preparation, 2003) describe a sediment core collectedinside the village near the small stream that flows through
the area. This core contains a thick impermeable clay layerbetween 15 and 30 m (50–100 ft), with sandy material aboveand below. Resistivity measurements mapping the subsur-face in the same area, described by Versteeg et al. (manu-script in preparation, 2003), are consistent with the presenceof a thick clay layer that extends largely uninterruptedthroughout the village and the surrounding fields. Additionalresistivity sections (Versteeg et al., manuscript in prepara-tion, 2003) indicate that the same clay layer gradually shoalstoward the north and outcrops in the region where there areno shallow wells. Combining this information with the welldata indicates that an impermeable and tilted layer separatesshallow aquifers with variable As levels from a deep aquifercontaining in most cases <10 mg/L As in this particularregion. An attempt to radiocarbon date organic matterextracted from a peat layer within the clay layer at the site
Figure 9. (right) Geographic distribution of As and (left) depth section of As in first close-up area inFigure 4. Black circles indicated samples with more detailed information discussed by Zheng et al.(manuscript in preparation, 2003). White dot (right) and gray bar (left) indicate the location of thesediment core.
HWC 3 - 10 VAN GEEN ET AL.: SPATIAL VARIABILITY OF GROUNDWATER ARSENIC

of the core yielded an age greater than 40,000 years (Zhenget al., manuscript in preparation, 2003).[23] A sediment core was also recovered from the second
close-up area with mostly high-As wells (Figure 10).Although it is located only 3 km east of the first core, noclay layer of comparable thickness was recovered. Instead,three 5 m (15 ft) thick clay layers evenly spaced between 30and 60 m depth were observed (Zheng et al., manuscript inpreparation, 2003). A pair of overlapping resistivity sectionscollected from the same area suggests that, in addition tobeing thinner, these layers do not extend north or southbeyond the village (Versteeg et al., manuscript in prepara-tion, 2003). In contrast to the first close-up area, radio-carbon dating of organic carbon in the village with mostlyhigh-As wells indicates that the entire sediment sectionrecovered from this location was deposited after the lastglaciation ended about 20,000 years ago and sea levelstarted to rise (Zheng et al., manuscript in preparation,2003). Low groundwater As concentrations in water from
a 90-m (300 ft) deep community well at this site [van Geenet al., 2003a] indicates that deep aquifers do not have to beover 40,000 years old to yield safe water, at least inAraihazar. The wide range of As concentrations in shallowaquifers of the first close-up area and low-As levels in thedeepest sampled aquifer in the second area suggest factorsother than the age of a sandy deposit, possibly related to thenature of the solid phase, play a role in controlling ground-water As concentrations.
4.3. Groundwater As and Characteristics of theSolid Phase
[24] Iron oxyhydroxides that coat aquifer particles appearto be the solid phase that, in most cases, controls the Asconcentration in Bangladesh groundwater. Because As has avery strong affinity for Fe oxyhydroxides, the presence ofsuch coatings under oxic conditions keeps groundwaterarsenic levels low [Bhattacharya et al., 2001; Nickson etal., 1998, 2000; Cummings et al., 1999; McArthur et al.,
Figure 10. (top) Distribution of As and (bottom) depth section of As in second close-up area shown inFigure 4. Black circles indicate samples with more detailed information discussed by Zheng et al.(manuscript in preparation, 2003). Location of sediment core collected in this area indicated by a whitecircle (top) and a gray bar (bottom).
VAN GEEN ET AL.: SPATIAL VARIABILITY OF GROUNDWATER ARSENIC HWC 3 - 11

2001; Harvey et al., 2002; Zheng et al., 2003]. Under thereducing conditions that are often attained in river flood-plain and delta sediments, however, microbially-mediateddissolution of such oxyhydroxides can result in largeincreases in the concentration of dissolved As. In thiscontext, it is worth noting that enriching groundwater bye.g., 200 mg/L in As corresponds to a loss of only �0.1 mg/gfrom the solid phase, a loss that would be hard to detectrelative to the average As concentration in the continentalcrust of 2 mg/g. While the As content of sediment suppliedby the Ganges, Brahmaputra, and Meghna rivers is notparticularly high, 1–6 mg/g according to Datta and Sub-ramanian [1998], a small labile fraction associated with Feoxyhydroxides would clearly be sufficient to considerablyelevate groundwater As concentrations. Indeed, unexcep-tional As concentrations in the solid phase were observed inthe BGS-DPHE special study areas and our two cores fromAraihazar (Zheng et al., manuscript in preparation, 2003).The underlying assumption of this discussion is thereforethat As is present in aquifer material throughout the studyarea in sufficient amounts to potentially cause a largeincrease in groundwater As upon transfer to the dissolvedphase. Rather than conducting an elusive search for As-enriched sediment to explain the distribution of ground-water As in Araihazar, we therefore interpret the Asdistribution as primarily a reflection of the variability ofredox conditions in the host aquifer.[25] How do redox conditions vary in the sediment cores
collected in the two close-up areas? A useful albeit qual-itative indicator of the redox state of a sandy aquifer iscolor. This has been noted on the basis of boreholesdistributed throughout of Bangladesh where shallow graysediment deposited since the last glaciation contrast withdeeper Pleistocene sands that are bright orange/brown incolor (BGS-DPHE). Within the first of the close-up areas inAraihazar, for instance, undetectable radiocarbon in thedividing clay layer and the orange color of the sandsunderneath are both consistent with an association of thelow-As groundwater with Pleistocene sands, most likely theDupi Tila Sand formation of Pleistocene age (BGS-DPHE;Zheng et al., manuscript in preparation, 2003). The stratig-raphy of the first close-up area is not unlike that of thespecial study area in Lakshmipur located further south anddescribed by BGS-DPHE, including the presence in thatarea of a peat layer without detectable radiocarbon. Takinginto consideration the geologic context of the study area, weinfer that the thick clay layer underlies floodplain anddeltaic sediment deposited across the Ganges-Brahmapu-tra-Meghna delta since sea level returned to its present stateduring the Holocene, about 10,000 years ago [Umitsu,1993; Goodbred and Kuehl, 1999, 2000; Goodbred et al.,2003].[26] Although the origin of the color contrast between
Pleistocene and more recently deposited sediment has notbeen fully investigated, it is probably related to the propor-tion of pure Fe(III) oxyhdroxides and mixed Fe(III)/Fe(II)oxyhydroxides and other Fe(II) phases. Mixed Fe(II)/(III)oxyhydroxides such as magnetite [Lovley, 1990], forinstance, are typically black while the color of pure Fe(III)oxyhydroxides such as goethite or hematite ranges fromyellow to red [Cornell and Schwertmann, 1996]. OtherFe(II) phases such as siderite or vivianite may also be
present, but these are typically not black. Overall, theassociation of high groundwater As with gray sedimentmay therefore reflect a relation between sediment color, i.e.,the redox state of Fe in the particulate phase, and the extentof dissolution of Fe hydroxides naturally enriched in As.This would be consistent with groundwater data withinAraihazar [Zheng et al., 2003, manuscript in preparation,2003] and throughout Bangladesh (BGS-DPHE) showing ageneral, yet scattered, relation between elevated dissolvedAs and Fe concentrations in groundwater. It is worth notingin this context that even the groundwater pumped from theDupi Tila Sand formation is anoxic, at least in our studyarea (Zheng et al., manuscript in preparation, 2003). Refer-ence to this aquifer as an oxic Pleistocene deposit shouldtherefore be related to the oxidation state of Fe on the solidphase rather than the oxygen content of groundwater.[27] Further analysis of the core from our second close-up
area indicates that the relation between groundwater As andsediment color may be more complicated. Sediment fromthe entire 90 m (300 ft) section at this location rangesbetween different shades of gray. This is consistent with theassociation of gray color with deposition over the past�10,000 years of the Holocene documented elsewhere inBangladesh (BGS-DPHE). But As in concentrations ingroundwater from a set of monitoring wells installed aroundthis core range widely from 10- to 500 mg/L. Althoughorange or brown sediment are rather consistently associatedwith groundwater low in As, a gray color therefore does notnecessarily indicate elevated dissolved As concentrations.
4.4. Groundwater As and Regional Geology
[28] The origin of the sharp contrast in both stratigraphyand groundwater As levels between the two close-up areaswhere sediment cores were collected is not entirely clear atthis point. A statistical analysis of the entire data set ofgroundwater As into a series spatial clusters of about 60wells each shows that the contrast is representative of aregional boundary that runs diagonally through the studyarea from the southwest to the northeast (A. Gelman et al.,submitted manuscript, 2002). Northwest of this division, a‘‘safe depth’’ below which groundwater As levels aretypically low can be calculated for most of the clusters ofwells, together with a measure of the uncertainty of thisestimate. Southeast of the same division, existing wells donot indicate a deep aquifer that is consistently low in As inmost clusters. The explanation for the contrast between thetwo regions could be that relatively oxic Pleistocene aqui-fers were uplifted in the northwest portion of the study areatogether with the Madhupur Terrace that extends over aconsiderable area toward Dhaka [Goodbred and Kuehl,2000; BGS-DPHE]. Another possibility, which does notexclude the first, is that the thicker Holocene layer in theeastern portion of the study area reflects infill of a majorriver channel formed during the previous glacial low-standin sea level about 22,000 years ago. Similar pronouncedgradients in the depth to relatively oxic and low-As aquifersof the Dupi Tila formation over a distance of a fewkilometers have also been documented in the ChapaiNawabgnaj special study area located northwest of Dhaka(BGS-DPHE).[29] When examined more closely on the basis of the
distribution of groundwater As, the separation between tube
HWC 3 - 12 VAN GEEN ET AL.: SPATIAL VARIABILITY OF GROUNDWATER ARSENIC

wells constrained to reach Pleistocene sands below theMadhupur clay and tube wells tapping into Holoceneaquifers does not seem to run uninterrupted even withinthe northwestern half of the study. Hand-drawn contours ofwells that yield water with up to 50 mg/L As (Figure 7)outline a gap corresponding to two dozen higher-As tubewells within the 30–45 m (100–150 ft) depth interval andbelow 45 m (150 ft). Probably not by coincidence, the samearea contains a large number of shallower wells in the 15–30 m (50–100 ft) range, a majority of which yield watercontaining over 50 mg/L As. This suggests a differentdepositional history than the low-As area immediately tothe southwest with hardly any wells shallower than 30 m(100 ft). The stream running today through the part of thegap demarked by the contours of low-As wells suggests thata larger stream may have cut through the Madhupur Clay inthe past and that this channel was subsequently filled withHolocene sediment, which resulted in higher groundwaterAs concentrations extending to greater depth (Figure 7).
4.5. Implications for Mitigation
[30] Even if imperfectly understood at this point, thespatial patterns in groundwater As documented for a portionof Araihazar at an unprecedented combination of coverageand resolution have a number of implications for mitigation.Within the village with a highly mixed As distribution,households with a well high in As more often than not livewithin walking distance of a neighboring well that is low inAs (Figure 9). This sort of patchiness could clearly beexploited to reduce As exposure, at least in the short term, ifsocial barriers to sharing the subset of safe but privately-owned wells could be overcome [van Geen et al., 2002;Gelman et al., submitted manuscript, 2002]. Temporalchanges are a source of concern, however, especially forthe shallow wells that meet the local drinking water stand-ard but are surrounded by wells that do not. We have so farmonitored a half dozen such wells in Araihazar, both deepand shallow, over a year and observed no significantchanges in response to the monsoon-driven changes inwater table [van Geen et al., 2002]. Relatively constantgroundwater As concentrations have also been reported fora limited number of other well-documented time series(BGS-DPHE).[31] Sharing existing wells is not a viable mitigation
option in the second close-up area where most of thehouseholds live several hundred meters from the closestsafe wells (Figure 10). We therefore chose this particularlyaffected region to install several community wells, guidedby a nest of monitoring wells installed in the same villagenext to the coring site (Zheng et al., manuscript in prepa-ration, 2003). The water supplied by three of the newcommunity wells that were installed at 60 m (200 ft) depth,which we continue to monitor, also meets the Bangladeshstandard for drinking water [van Geen et al., 2003a].However, only 1 km to the north and 1 km to the southof this region, two wells initially installed to a depth of 60 m(200 ft) produced water containing 115 and 94 mg/L As,respectively (Figure 7). The separation of deep aquifers lowin As from shallower aquifers therefore appears to bepoorly defined in terms of both the depth and the extentof the relatively thin clay layers in the second close-up area.By drilling deeper at the same two locations, using a
hydraulic pump that is currently not available to the localdrillers, another drilling team was eventually able to reachgroundwater containing <5 mg/L at 120 m (400 ft) and138 m (460 ft), respectively. The six community wellsinstalled in the eastern portion of our study area havebecome remarkably popular. Many villagers walk hundredsof meters each day to fetch safe drinking water from thenew community wells. A study of well usage has shownthat, on average, 2200 L/day is hand-pumped from such awell regardless of the season, and that a single communitywell can meet the needs of about 500 people [van Geen etal., 2003a]. To build on these encouraging results, optimallocations for the installation of additional community wellswere recently determined from a spatial analysis of the Asdata for existing wells in our study area (Gelman et al.,submitted manuscript, 2002).[32] The local drillers with whom we have worked know
that orange-brown sediment is associated with low-Asgroundwater. One of the drillers in the area appears toalready have some spatial sense of how the depth to theorange-brown sediment varies from one village to the other.Systematic mapping of the depth of transition to thesedeposits every time a well is installed, based on cuttings,would clearly be beneficial for more systematic targetinglow-As aquifers. Our failure to predict the depth to safewater in two out of a half-dozen community wells despiteour mapping capabilities indicates that the task is likely toremain difficult, however. Even though the Dupi Tila sandformation appears to be accessible with local drillingtechnology based on the ‘‘hand flapper’’ method (maximumpenetration of 90 m (300 ft)) at most locations within ourstudy area, this method is not adequate in areas further southsuch as Lakshmipur where a penetration greater than 300 m(900 ft) is required (BGS-DPHE). Households might bewilling to pay for the additional expense of hydraulic pumpsto drill deeper wells in such areas, if the local drillers couldprovide that service.[33] In contrast to the conclusions drawn by the BGS-
DPHE team, we are not convinced that installation of tubewells within Holocene aquifers should be entirely banned.The distribution of As in tube wells less than 16 m (50 ft)deep in Araihazar indicates that at least in some villages, thelikelihood of encountering shallow low-As groundwater isquite high. Again, mapping such characteristics and convey-ing this information to local drillers could be very benefi-cial. There are some other groundwater constituents whoseconcentration can exceed WHO guidelines values in shal-low wells, however (BGS-DPHE). Although we have notyet conducted a full assessment, elevated Mn concentrationsin shallow wells throughout Araihazar are a source ofconcern [van Geen et al., 2003a].[34] An alternative approach to the difficult task of map-
ping low-As aquifers is to determine during the drillingprocess itself whether an aquifer is likely to be elevated in Asbefore a well is installed. This is a direction worth pursuingbecause it might allow local drillers to more effectivelytarget low-As aquifers while reducing the cost of theinstallation to the household. This is because the sectionsof PVC pipe and other supplies used in the construction of awell account for approximately half the total cost in Ban-gladesh. Once a well has been installed and the As content ofthe groundwater is found to be too high, most of these
VAN GEEN ET AL.: SPATIAL VARIABILITY OF GROUNDWATER ARSENIC HWC 3 - 13

materials cannot be used again. As a potential aid topredicting groundwater As ahead of installation, we success-fully tested an inexpensive sediment reflectance meter con-structed by modifying a flashlight to determine theproportion of Fe III and Fe II oxyhydroxides in the sedimentwith two light-emitting diodes and a detector [Kostel, 2002].We recently also demonstrated that a simple needle-baseddevice mounted at the end of the drill rig used by the localteams can be used to sample representative groundwaterahead of the drill hole (A. van Geen, manuscript in prepa-ration, 2003). Because the relation between sediment reflec-tance and groundwater As can be ambiguous (A. Hornemanet al., manuscript in preparation, 2003), we envision that thereflectance meter could be used as a rapid screening toolduring drilling and that the needle-sampler could be used forcollecting and testing groundwater before the final installa-tion of a well. Because of continuing concerns about thereliability of existing field kits for arsenic [Rahman et al.,2002], any approach that takes advantage of the patchinessof the groundwater As to reinstall safe wells would greatlybenefit from an improved field kit for As and its availabilityon demand at the local scale.
5. Conclusions
[35] About half the nearly 6000 tube wells sampled inAraihazar supply water with less than 50 mg/L As, while theother half do not meet the Bangladesh standard for drinkingwater. For reasons that are unclear at this point, the greatestnumber of wells in Araihazar extend to aquifers in the12–24 m (40–80 ft) depth range where As concentrationsmost frequently exceed 50 mg/L. The spatial distribution oftube well As is consistent with the location of the study areaat a geologic boundary. The oxic low-As aquifers accessibleby drilling with local technology appear to be of Pleistoceneage; the shallower reducing aquifers often containingelevated but variable As concentrations were depositedsince the Last Glacial Maximum �20,000 years ago.[36] The various patterns of As distributions that we have
documented for Araihazar appear to be representative of thedifferent modes of variability that prevail in other parts ofBangladesh. There is considerable potential for exploitingthese patterns to tackle the arsenic crisis in Araihazar andbeyond. The high degree of patchiness of As in shallowHolocene aquifers of many villages indicates that, followinga blanket survey, a short-term mitigation option is toencourage sharing of the wells that yield water containingless than 50 mg/L [van Geen et al., 2002]. Although resultsfrom monitoring a half-dozen shallow low-As tube wells inAraihazar have been encouraging so far, a subset of suchwells should be regularly monitored in an area with spatiallyhighly-variable As levels in groundwater.[37] Well-switching is not an option for a significant
number of villages in Araihazar where essentially all exist-ing wells tap into aquifers with over 50 mg/L As. In suchareas, recently installed community wells that reach low-AsPleistocene aquifers have been remarkably popular. Thedepth of such aquifers varies from 30 m (90 ft) to over130 m (390 ft) within a distance of a few kilometers withinour study area, however. This does not appear to be the caseonly because Araihazar is geologically a transitional area.Pronounced differences of the depth of relatively oxicPleistocene aquifers underline the value of combining As
and depth information at the village-scale to facilitatetargeting of low-As groundwater. The spatial variability ofthe depth of Pleistocene aquifers also indicates the futility ofestablishing a ‘‘safe’’ depth at the upazilla level, let alonethe national level. Instead, government and NGOs should beurged to provide hand-held GPS receivers to the numerousvillage workers currently testing tube wells throughout thecountry. Combined with depth information that can beobtained from the owners of each well, such data obtainedat little additional cost could be used to map the distributionof As and the associated geologic formations from thenational to the village level.
Appendix A
[38] A simple model is needed to quantify the impact ofthe various sources of error on the As data. In this model, Xi
is the estimate of the As concentration obtained from asingle measurement relative to a calibration curve obtainedfrom standards diluted in pure matrix modifier solution. Xi
is assumed to be a linear function of the actual As concen-tration q, some error eXi,, and the ratio of the instrumentresponse for samples diluted in matrix modifier solutionrelative to the response for a pure matrix, expressed by afactor (1 + ecal). This factor has a mean of 1 and a standarddeviation scal that needs to determined; eXi are independenterrors for each measurements with a mean of zero and astandard deviation of smeas.
Xi ¼ 1þ ecalð Þqi þ eXi
[39] Three measurements enter into the measurement ofthe concentration increase that followed the addition of anAs spike in the field. X1 and X2 are replicate measurements;X3 is the measurement for the spiked sample. Although theconcentration of this spike is known, there is some uncer-tainty in the resulting concentration increase in the samplebecause of some error edil in control of both the samplevolume and the spike volume.
X1 ¼ 1þ ecalð Þqþ eX1
X2 ¼ 1þ ecalð Þqþ eX2
X3 ¼ 1þ ecalð Þ qþ 499ð Þ 1þ edilð Þ þ eX3
[40] After rearranging, the difference Y in concentrationbetween the spiked sample and the average of the tworeplicates becomes:
Y ¼ X3 � X1 þ X2ð Þ=2
¼ 1þ ecalð Þ 499þ qþ 499ð Þedilð Þ þ eX3� eX1
þ eX2ð Þ=2
The mean of Y is 499 mg/L; the standard deviation of Y canbe approximated with Taylor series by rearranging andsumming the squares of the relative standard deviations forerrors due to variations in the sensitivity of the instrument tothe sample matrix scal, variations in dilutions sdil, and thereproducibility of sampling and analysis smeas.
sY ’ 499p
s2cal þ 1þ q=499ð Þð Þ2s2dil þ 3=2 smeas=499ð Þ2� �
HWC 3 - 14 VAN GEEN ET AL.: SPATIAL VARIABILITY OF GROUNDWATER ARSENIC

The single measurement error smeas = 7 mg/L is estimatedin the quality control section from replicate analyses; therelative error corresponding to the spike of 499 mg/L is0.014. Two factors need to be considered to determinesdil: the volume of sample added to the spike in the fieldthat could not be controlled with the overflowinggraduated cylinder to better than 60 ± 2 mL (a relativeuncertainty of 0.033), and a smaller relative uncertainty of0.01 in the 0.6 mL volume delivered by the two pipettesused for the As spikes. These errors in volume control adda total relative uncertainty to the expected increase inconcentration sdil = 0.034. Since sY = 56 mg/L is knownfrom the 341 sets of replicates and spiked samples, wecan estimate scal from the expression above by substitut-ing the mean As concentration for the (unspiked)replicates of 95 mg/L for q. Solving yields scal = 0.103,which confirms that the dependence of the instrumentresponse on the sample matrix is probably the main factorthat determines the total relative standard deviation forconcentration differences between spiked and unspikedsamples (0.112).[41] From the values obtained for scal and smeas, we can
now estimate the absolute uncertainty of a single Asmeasurement based on an instrument calibration with stand-ards in pure matrix modifier solution:
ssing ¼p
q2scal þ s2meas
� �
According to this expression, the absolute uncertainty of7 mg/L of obtained from replicate analyses dominates below70 mg/L. Above this concentration, the relative error of�10% due to differences in sample matrix becomes thelarger source of uncertainty.
[42] Acknowledgments. This work was supported by grantP42ES10349 of the US NIEHS/Superfund Basic Research Program,following pilot-studies supported by the Columbia Earth Institute. Wethank the six pairs of samplers/interviewers who tirelessly went into thefield and conscientiously collected the material needed to launch this study:Md. Shohel, Kakuli Begum, Md. Mozibar, Bithi Begum, Md. AnwarulHaque, Alaya Begum Jharna, Tazul Islam Patwary, Ruma Yasmin, Md.Abul Kalam Sumsuddin, Kazi Hamida Akhter Himu, and Khorshed Alam.We also thank M. F. Parvez, V. Slavkovich, N. J. Lolacono, Z. Cheng, H.Momotaj, and M. Shahnewaz for their contributions to the field andlaboratory work and to the processing of the interview data. This is LDEOpublication 6442.
ReferencesBangladesh Rural Advance Commission (BRAC), Combatting a deadlymenace: Early experiences with a community-based arsenic mitigationproject in Bangladesh, Res. Monogr. Ser. 16, Dhaka, Bangladesh,2000.
Berg, M., H. C. Tran, T. C. Nguyen, H. V. Pham, R. Schertenleib, andW. Giger, Arsenic contamination of groundwater and drinking water inVietnam: A human health threat, Environ. Sci. Technol., 35, 2621–2626, 2001.
Bhattacharya, P., G. Jacks, J. Jana, A. Sracek, J. P. Gustafsson, andD. Chatterjee, Geochemistry of the Holocene alluvial sediments of BengalDelta Plain from West Bengal, India: Implications on arsenic contamina-tion in groundwater, in Groundwater Arsenic Contamination in the Ben-gal Delta Plain of Bangladesh, edited by G. Jacks, P. Bhattacharya, andA. A. Khan, TRITA-AMI Rep. 3084, pp. 21–40, Kungl Tekniska Hogs-kolan, Stockholm, 2001.
Biswas, B. K., R. K. Dhar, G. Samantha, B. K. Mandal, D. Chakraborti,I. Faruk, K. S. Islam, M. Chowdury, A. Islam, and S. Roy, Detailedstudy report of Samta, one of the arsenic-affected villages of JessoreDistrict, Bangladesh, Curr. Sci., 74, 134–145, 1998.
British Geological Survey and Department of Public Health Engineering,Arsenic Contamination of Groundwater in Bangladesh, vol. 2, FinalReport, BGS Tech. Rep. WC/00/19, edited by D. G. Kinniburgh andP. L. Smedley, Br. Geol. Surv., Keyworth, UK, 2001.
Burgess, W. G., M. Burren, J. Perrin, and K. M. Ahmed, Constraints onsustainable development of arsenic-bearing aquifers in southern Bangla-desh. part 1: A conceptual model of arsenic in the aquifer, in Sustain-able Groundwater Development, edited by K. M. Hiscock, M. O. Rivett,and R M. Davidson, Geol. Soc. London Spec. Publ., 193, 145–163,2000.
Burgess, W. G., K. M. Ahmed, J. Cobbing, M. Cuthbert, S. Mather,E. McCarthy, and D. Chaterjee, Anticipating changes in arsenic concen-tration at tubewells in alluvial aquifers of the Bengal Basin, paper pre-sented at Natural arsenic in sedimentary aquifers, XXXII IAH Congresson Groundwater and Human Development, Int. Assoc. for Hydrogeol.,Mar del Plata, Argentina, 2002.
Chakarborty, A. K., and K. C. Saha, Arsenic dermatosis from tubewellwater in west Bengal, Indian J. Medical Res., 85, 326–334, 1987.
Chen, Y., and H. Ahsan, Cancer burden due to arsenic exposurefrom drinking water in Bangladesh, Am. J. Public Health, in press,2003.
Cornell, R. M., and U. Schwertmann, The iron oxides: Structure, properties,reactions, occurrences, and uses, VCH Verlagsgesellshaft, Weinheim,Germany, 1996.
Cummings, D. E., F. Caccavo, S. Fendorf, and R. F. Rosenzweig, Arsenicmobilization by the dissimilatory Fe(III)-reducing bacterium Shewanellaalga BrY, Environ. Sci. Technol., 33, 723–729, 1999.
Datta, D. K., and V. Subramanian, Distribution and fractionation ofheavy metals in the surface sediments of the Ganges-Brahmaputra-Meghna river system in the Bengal Basin, Environ. Geol., 36, 93–101,1998.
Department of Public Health Engineering, Mott MacDonald Ltd, andBritish Geological Survey, Groundwater studies for arsenic contamina-tion in Bangladesh, main report, Br. Geol. Surv., Keyworth, UK,1999.
Dhar, R. K., et al., Groundwater arsenic calamity in Bangladesh, Curr. Sci.,73, 48–59, 1997.
Ferguson, J., On recent changes in the delta of the Ganges, Q. J. Geol. Soc.London, 19, 321–354, 1863.
Goodbred, S. L., Jr., and S. A. Kuehl, Holocene and modern sedimentbudgets for the Ganges-Brahmaputra river system: Evidence for high-stand dispersal to floodplain, shelf, and deep-sea depocenters, Geology,27, 559–562, 1999.
Goodbred, S. L., Jr., and S. A. Kuehl, The significance of large sedimentsupply, active tectonism, and eustasy on margin sequence development:Late Quaternary stratigraphy and evolution of the Ganges-Brahmaputradelta, Sediment. Geol., 133, 227–248, 2000.
Goodbred, S. L., Jr., S. A. Kuehl, M. S. Steckler, and M. H. Sarker, Con-trols on facies distribution and stratigraphic preservation in the Ganges-Brahmaputra delta sequence, Sediment. Geol., 155, 301–316, 2003.
Harvey, C. F., et al., Arsenic mobility and groundwater extraction in Ban-gladesh, Science, 298, 1602–1606, 2002.
Kostel, K., A simple sediment-color meter to target low-arsenic aquifers inBangladesh, M.S. thesis, Columbia Univ., New York, 2002.
Lovley, D. R., Magnetite formation during microbial dissimilatory ironreduction, in Iron Biominerals, edited by R. B. Frankel and R. P. Blake-more, pp. 151–166, Plenum, New York, 1990.
McArthur, J. M., P. Ravenscroft, S. Safiullah, and M. F. Thirlwall, Arsenicin groundwater: Testing pollution mechanisms for sedimentary aquifer inBangladesh, Water Resour. Res., 37, 109–117, 2001.
Nickson, R., J. McArthur, W. Burgess, K. M. Ahmed, P. Ravenscroft, andM. Rahman, Arsenic poisoning of Bangladesh groundwater, Nature, 395,338, 1998.
Nickson, R. T., J. M. McArthur, P. Ravenscroft, W. G. Burgess, and K. M.Ahmed, Mechanism of arsenic release to groundwater, Bangladesh andwest Bengal, Appl. Geochem., 15, 403–413, 2000.
Rahman, M. M., et al., Effectiveness and reliability of arsenic field testingkits: Are the million dollar screening projects effective or not?, Environ.Sci. Technol., 36, 5385–5394, 2002.
Smith, A. H., E. O. Lingas, and M. Rahman, Contamination of drinking-water by arsenic in Bangladesh: A public health emergency, Bull. WorldHealth Organ., 78, 1093–1103, 2000.
Solley, W. B., R. R. Pierce, and H. A. Perlman, Estimated use of water inthe United States in 1995, U.S. Geol. Surv., 1200, 1998.
Umitsu, M., Late Quaternary sedimentary environments and landforms inthe Ganges Delta, Sediment. Geol., 83, 177–186, 1993.
VAN GEEN ET AL.: SPATIAL VARIABILITY OF GROUNDWATER ARSENIC HWC 3 - 15

van Geen, A., et al., Promotion of well-switching to mitigate the currentarsenic crisis in Bangladesh, Bull. World Health Organ., 80, 732–737,2002.
van Geen, A., K. M. Ahmed, A. A. Seddique, and M. Shamsudduha,Community wells to mitigate the current arsenic crisis in Bangladesh,Bull. World Health Organ., in press, 2003a.
van Geen, A., Y. Zheng, M. Stute, and K. M. Ahmed, Comment on‘‘Groundwater arsenic and irrigation in Bangladesh’’ (II), Science, 300,584, 2003b.
World Bank,World Development Report 1998/99, Oxford Univ. Press, NewYork, 1999.
World Health Organization, Guidelines for Drinking-Water Quality, vol. 2,Health Criteria and other Supporting Information, 2nd ed., pp. 940–949, Geneva, Switzerland, 1996.
Yu, W. H., C. M. Harvey, and C. F. Harvey, Arsenic in groundwater inBangladesh: A geostatistical and epidemiological framework for evalu-ating health effects and potential remedies, Water Resour. Res., 39,doi:10.1029/2002WR001327, in press, 2003.
Zheng, Y., M. Stute, A. van Geen, I. Gavrieli, R. Dhar, H. J. Simpson, P.Schlosser, and K. M. Ahmed, Redox control of arsenic mobilization inBangladesh groundwater, Appl. Geochem., in press, 2003.
����������������������������K. M. Ahmed, Geology Department, Dhaka University, Dhaka-1000,
Bangladesh.H. Ahsan and J. H. Graziano, Mailman School of Public Health,
Columbia University, NY 10032, USA.
R. Dhar, Queens College, City University of New York, Flushing, NY11367, USA.
A. Gelman, Statistics Department, Columbia University, NY 10027,USA.
A. Horneman, C. Small, M. Steckler, M. Stute, A. van Geen,R. Versteeg, and Y. Zheng, Lamont-Doherty Earth Observatory, ColumbiaUniversity, Palisades, NY 10964, USA. ([email protected])
I. Hussain, National Institute of Preventive and Social Medicine, Dhaka-1212, Bangladesh.
HWC 3 - 16 VAN GEEN ET AL.: SPATIAL VARIABILITY OF GROUNDWATER ARSENIC