spatial scenarios 1 - 3 - south west england documents/technical... · greater bristol strategic...
TRANSCRIPT

Greater Bristol Strategic Transport Study
Spatial Scenarios 1 - 3
JOB NUMBER: 5019474 DOCUMENT REF: Spatial Scenario Tests 1-3 v4
4 Final Report with S3 PWH/LW RJ RT RT 17/04/07
3 Scenario 3 added PWH/LW RJ RT RT Mar 07
2 Final Report PWH/LW LW RT RT 21/02/07
1 Draft report PWH/LW LW RT RT 05/02/07
Originated Checked Reviewed Authorised Date
Revision Purpose Description

GREATER BRISTOL STRATEGIC TRANSPORT STUDY Spatial Scenarios 1, 2 and 3
5019474 i Spatial Scenario Tests 1-3 v4
Contents
Section Page
Executive Summary iv
1. Introduction 1-1
Background 1-1
The Current Work 1-1
2. Scenario Descriptions 2-1
Introduction 2-1
Population 2-1
Employment 2-11
3. Key Network Statistics – Peak Period 3-1
Introduction 3-1
Scenario 1 3-1
Scenario 2 3-14
Scenario 3 3-27
4. Key Network Statistics – Inter-Peak Period 4-1
Introduction 4-1
Scenario 1 4-1
Scenario 2 4-7
Scenario 3 4-14
5. Summary and Conclusions 5-1
Introduction 5-1
Scenario 1 5-1
Scenario 2 5-2
Scenario 3 5-3
List of Tables
Table 2.1 – Changes in Dwellings (from 2001 base) 2-1
Table 2.2 – Changes in Population 2-2
Table 2.3 – Changes in Employment 2-12
Table 3.1 – Person Trips by Mode and Mode Share (morning peak) 3-2
Table 3.2 – Highway Vehicle Statistics, Capacity Utilisation and Network Speeds (morning
peak) 3-4
Table 3.3 – Highway Cordon Flows (morning peak) 3-5
Table 3.4 – Selected Journey Times (morning peak) 3-10

GREATER BRISTOL STRATEGIC TRANSPORT STUDY Spatial Scenarios 1, 2 and 3
5019474 ii Spatial Scenario Tests 1-3 v4
Table 3.5 – Public Transport Network Statistics (morning peak) 3-13
Table 3.6 – Person Trips by Mode and Mode Share (morning peak) 3-15
Table 3.7 – Highway Vehicle Statistics, Capacity Utilisation and Network Speeds (morning
peak) 3-17
Table 3.8 – Highway Cordon Flows (morning peak) 3-18
Table 3.9 – Selected Journey Times (morning peak) 3-23
Table 3.10 – Public Transport Network Statistics (morning peak) 3-26
Table 3.11 – Person Trips by Mode and Mode Share (morning peak) 3-28
Table 3.12 – Highway Vehicle Statistics, Capacity Utilisation and Network Speeds (morning
peak) 3-30
Table 3.13 – Highway Cordon Flows (morning peak) 3-31
Table 3.14 – Selected Journey Times (morning peak) 3-36
Table 3.15 – Public Transport Network Statistics (morning peak) 3-39
Table 4.1 – Person Trips by Mode and Mode Share (inter peak) 4-2
Table 4.2 – Highway Vehicle Statistics (inter peak) 4-3
Table 4.3 – Public Transport Passenger-kilometres (inter peak) 4-8
Table 4.4 – Person Trips by Mode and Mode Share (inter peak) 4-9
Table 4.5 – Highway Vehicle Statistics (inter peak) 4-10
Table 4.6 – Public Transport Passenger-kilometres (inter peak) 4-15
Table 4.7 – Person Trips by Mode and Mode Share (inter peak) 4-16
Table 4.8 – Highway Vehicle Statistics (inter peak) 4-17
Table 4.9 – Public Transport Passenger-kilometres (inter peak) 4-21
List of Figures
Figure 2.1 – Population Change in Scenario 1 Compared with 2003 Base 2-3
Figure 2.2 – Sector Level Population Change in Scenario 1 Compared with Scenario F 2-4
Figure 2.3 – Zone Level Population Change in Scenario 1 Compared with Scenario F 2-5
Figure 2.4 – Population Change in Scenario 2 Compared with Scenario 2003 Base 2-6
Figure 2.5 – Sector Level Population Change in Scenario 2 Compared with Scenario F 2-7
Figure 2.6 – Zone Level Population Change in Scenario 2 Compared with Scenario F 2-8
Figure 2.7 – Population Change in Scenario 3 Compared with 2003 Base 2-9
Figure 2.8 – Sector Level Population Change in Scenario 3 Compared with Scenario F 2-10
Figure 2.9 – Zone Level Population Change in Scenario 3 Compared with Scenario F 2-11
Figure 2.10 – Change in Employment – Scenario 1 Compared with 2003 Base 2-13
Figure 2.11 – Sector Level Employment Change in Scenario 1 Compared with Scenario F2-14
Figure 2.12 – Zone Level Change in Employment – Scenario 1 Compared with Scenario F2-15
Figure 2.13 – Change in Employment – Scenario 2 Compared with 2003 Base 2-16
Figure 2.14 – Sector Level Change in Employment – Scenario 2 Compared with Scenario F2-17
Figure 2.15 – Zone Level Change in Employment – Scenario 2 Compared with Scenario F2-18
Figure 2.16 – Change in Employment – Scenario 3 Compared with 2003 Base 2-19
Figure 2.17 – Sector Level Change in Employment – Scenario 3 Compared with Scenario F2-20
Figure 2.18 – Zone Level Change in Employment – Scenario 3 Compared with Scenario F2-21
Figure 3.1 – Change in Traffic Flow between Scenario F and Scenario 1 (morning peak) 3-7

GREATER BRISTOL STRATEGIC TRANSPORT STUDY Spatial Scenarios 1, 2 and 3
5019474 iii Spatial Scenario Tests 1-3 v4
Figure 3.2 – Change in Capacity Utilisation between Scenario F and Scenario 1 (morning
peak) 3-9
Figure 3.3 – Percentage Change in Selected Journey Times between Scenario F and
Scenario 1 3-11
Figure 3.4 – Change in Flow between Scenario F and Scenario 2 (morning peak) 3-20
Figure 3.5 – Change in Capacity Utilisation between Scenario F and Scenario 2 (morning
peak) 3-22
Figure 3.6 – Percentage Change in Selected Journey Times between Scenario F and
Scenario 2 3-24
Figure 3.7 – Percentage Change in Selected Journey Times between Scenario 2 and
Scenario 1 3-25
Figure 3.8 – Change in Flow between Scenario F and Scenario 3 (morning peak) 3-33
Figure 3.9 – Change in Capacity Utilisation between Scenario F and Scenario 3 (morning
peak) 3-35
Figure 3.10 – Percentage Change in Selected Journey Times between Scenario F and
Scenario 3 3-37
Figure 4.1 – Change in Flow between Scenario F and Scenario 1 (inter peak) 4-5
Figure 4.2 – Change in Capacity Utilisation between Scenario F and Scenario 1 (inter peak)4-6
Figure 4.3 – Change in Flow between Scenario F and Scenario 2 (inter peak) 4-12
Figure 4.4 – Change in Capacity Utilisation between Scenario F and Scenario 2 (inter peak)4-13
Figure 4.5 – Change in Flow between Scenario F and Scenario 3 (inter peak) 4-19
Figure 4.6 – Change in Capacity Utilisation between Scenario F and Scenario 3 (inter peak)4-20
Appendix A Development of Dwelling and Employment Scenarios Appendix B Summary of Dwelling and Employment Scenarios

GREATER BRISTOL STRATEGIC TRANSPORT STUDY Spatial Scenarios 1, 2 and 3
5019474 iv Spatial Scenario Tests 1-3 v4
Executive Summary
The Greater Bristol Strategic Transport Study (GBSTS) used a single spatial development scenario, prepared by the West of England Partnership (WoEP) as the basis for the development of the transport strategy through to 2031.
Subsequently, the four unitary authorities within Greater Bristol revised the forecasts of the growth and distribution of population and workplaces in the preparation of their ‘First Detailed Proposals’ to the SWRA which were incorporated into the draft Regional Spatial Strategy (RSS). To assess the impact of the revised projections on the GBSTS transport strategy, a series of three tests were undertaken using the GBSTS forecasting model.
Scenario 1 reflected the ‘First Detailed Proposals’ which contained a similar number of additional dwellings (134,800) compared with the earlier GBSTS projections (138,700), but a lower population rise (160,300 against 221,500), reflecting changing assumptions about dwelling and household sizes. On the other hand, the recent forecasts in Scenario 1 show significant employment growth of 159,300 compared with 87,900 previously. The distribution of population and employment in the recent forecasts shows an increased concentration in existing urban areas, particularly Bristol (centre and North Fringe) and Bath.
The GBSTS transport strategy still performs well against the changed travel patterns resulting from the revised spatial distribution, although in some areas there would be a need to fine tune the details in the strategy, particularly in relation to the public transport network in the urban areas of Bristol and Bath, which show an increase in the overall volume of travel.
Overall with Scenario 1 there is a 3.4% growth in the number of person trips in 2031 with the number of car and bus based trips being broadly in line with the trend while rail shows a much higher level of growth. Through the growth in the volume of travel, the growth in car trips produces a 6.7% rise in delays, with the main increase in congestion occurring on local rather than strategic roads, particularly in south and east Bristol, highlighting the need to further enhance the public transport options in these areas.
The increased employment in central Bristol with Scenario 1 reduces the need for residents in the sub-region to travel further afield and hence there are noticeable falls on the motorway network in the morning peak in the outbound direction. On the other hand, there is a moderate rise in the numbers travelling into Bristol (including the North Fringe) and Bath on the motorways from Weston-super-Mare and the South West and from the Swindon direction.
Although the number of trips by rail was shown to rise by 6.4% with Scenario 1, the overall growth in rail passenger-kms is just 3.7% suggesting a shortening of journeys by rail and its use for local commuting journeys into Bristol and Bath, while at the same time the level of crowding on rail increases by 13%.
With Scenario 2, there was an increase in the number of dwellings (159,800) compared with the previous forecast used in GBSTS (138,700) although with the revised assumptions about dwelling and household sizes, the population growth in Scenario 2 of 212,600 is slightly below the original projection of 221,500. With Scenario 2, the growth in population is

GREATER BRISTOL STRATEGIC TRANSPORT STUDY Spatial Scenarios 1, 2 and 3
5019474 v Spatial Scenario Tests 1-3 v4
concentrated within the existing urban areas and in extensions to these areas. There is considerable employment growth in Scenario 2, with 189,200 extra jobs by 2031 compared with the earlier forecasts of 87,900, with the additional places concentrated in the Bristol and Bath urban areas and in the North Fringe.
Despite increases in the future employment levels, the overall growth in traffic is comparable with Scenario 1; this reflects the increased level of containment in Weston-super-Mare, Bristol and Bath, with residents being more likely to work locally due the increased opportunities that are available. This is also reflected in the lower growth in demand for travel by rail and park and ride. At the same time, although there is a growth in the volume of car traffic, there is also a reduction in the average journey length and negligible changes in delay, implying that the growth in traffic would occur on relatively uncongested local roads. At the same time, the reduced out-commuting from Bristol results in lower traffic levels on sections of the motorway network (eastbound on the M4 and southbound on the M5) in the morning peak period.
Scenario 3 is based on the housing projections used in Scenario 2 and the employment totals assumed in Scenario 1. The spatial distribution of employment is identical to Scenario 1 while housing is generally similar to Scenario 2, though some development has been reallocated from Weston-super-Mare to the urban extensions planned for Bristol and Bath.
The overall growth in trips over the earlier GBSTS Scenario (1.6%) is less than that in Scenarios 1 and 2 with a large (7.8%) reduction in P&R trips. Demand for public transport is reduced compared to the earlier GBSTS Scenario – passenger kilometres by bus fall by 5.5% and rapid transit by 5.5%. Rail passenger crowding also falls by around 30%.
Many of the highway impacts relative to the earlier GBSTS Scenario are similar to those under Scenarios 1 and 2 with some additional journeys on the M4 westbound (between junctions 20 and 17) but reduced flows eastbound. Scenario 3 does not result in the same increase in vehicles around Weston-super-Mare as reported in Scenario 2, or the M5 northbound increases seen in both Scenarios 1 and 2.
The analysis of the impact of the changes in Scenarios 1, 2 or 3 highlights the general robustness of the measures in the GBSTS transport strategy. Any alterations to the population and employment projections may have an impact on the detail and timing of individual measures but not to the overall content of the strategy. The refinement in the details of individual schemes would be reflected in the development of the measures which would take into account the latest population and employment forecasts at the time.

GREATER BRISTOL STRATEGIC TRANSPORT STUDY Spatial Scenarios 1, 2 and 3
5019474 1-1 Spatial Scenario Tests 1-3 v4
1. Introduction
BACKGROUND
1.1 The Greater Bristol Strategic Transport Study (GBSTS) used a single spatial development scenario, prepared by the West of England Partnership (WoEP). When the GBSTS study programme required the input of the spatial development scenario, the joint study area work, being undertaken by the WoEP, was still subject to variation. So that the transport strategy development process within GBSTS could progress, a single spatial scenario (Scenario F) was identified, in advance of the WoEP completing its joint study area work.
1.2 The four unitary authorities in Greater Bristol then continued to develop the joint study area work and eventually submitted ‘First Detailed Proposals’ to the South West Regional Assembly (SWRA) that were at variance with Scenario F in terms of the level of growth of population and workplaces and their distribution. This advice was incorporated by the SWRA into the draft Regional Spatial Strategy (RSS).
1.3 With the Examination in Public due in April 2007, there is a need to understand the ability of the GBSTS transport strategy to accommodate the level of growth envisaged in the draft RSS. At the same time, the impact of a higher level of growth on the GBSTS transport strategy is also sought.
THE CURRENT WORK
1.4 This note (Spatial Scenario Tests 1-3 v4.doc) updates the previous interim report (Final Report on Spatial Scenario Tests.doc) through the addition of a third land use development Scenario – Scenario 3.
1.5 A series of tests have been identified using the GBSTS model to establish the robustness of the GBSTS conclusions to changes in the dwelling and employment assumptions. This report summarises the output and conclusions from the tests of the following three spatial scenarios:
♦ Scenario 1 (Draft RSS);
♦ Scenario 2 (an additional 5,000 dwellings per annum, distributed on a pro-rata basis to all Local Planning Authorities (LPAs) in the South West); and
♦ Scenario 3 (dwellings as Scenario 2 but with some spatial variation and employment totals as Scenario 1, again, with some spatial variation).
1.6 Chapter 2 summarises the population and employment forecasts for Scenarios 1 to 3, and highlights the variations from the earlier Scenario F. Chapter 3 compares the network performance statistics for the three new scenarios in 2031 peak period, while Chapter 4 analyses the inter-peak period. Finally, Chapter 5 summarises the main conclusions from the assessment. Appendix A contains an outline of the development of the dwelling and employment forecasts.


GREATER BRISTOL STRATEGIC TRANSPORT STUDY Spatial Scenarios 1, 2 and 3
5019474 2-1 Spatial Scenario Tests 1-3 v4
2. Scenario Descriptions
INTRODUCTION
2.1 Three scenarios have been produced based on different assumed changes in the population and employment volumes and their distribution across the Greater Bristol sub-region. All scenarios relate to the forecast year 2031 and, in this analysis, have been compared with the GBSTS base year of 2003 and the 2031 Scenario F used in the earlier GBSTS work.
POPULATION
2.2 Scenario 1 projects an additional 135,000 new dwellings in the Greater Bristol area, similar to the number (139,000) assumed within Scenario F (Table 2.1). Scenario 1 represents a 32 percent increase in dwellings over a 2001 base. Scenarios 2 and 3 project 160,000 new dwellings – a 38 percent increase in provision over a 2001 base.
2.3 The scenarios 1 to 3 have used revised household size assumptions from those used in the main GBSTS study. The data for Household size was provided by the ONS and uses projections based on a base year of 2003. This data was only released in March 2006 and was, therefore, unavailable to the main GBSTS project. While Scenarios’ 2 and 3 household projections are greater than that in Scenario F, the population projections (~1,221,000) are slightly less than that used in Scenario F (1,230,000) – see Table 2.2. With fewer households than Scenario F and a lower population per household factor, Scenario 1’s projected population is significantly less than that in Scenario F. However, it still represents a 16 percent growth over the 2003 base.
Table 2.1 – Changes in Dwellings (from 2001 base)
Change from base (2031 – 2001)
Sectors Base (2001) Scenario
F Scenario
1 Scenario
2 Scenario
3
Bristol City Centre 5,800 6,700 1,400 1,700 1,700
NW Bristol (incl Avonmouth) 60,000 10,100 14,800 17,600 17,400
NE Bristol 43,500 9,800 10,800 12,800 12,600
South Bristol 57,600 5,700 14,200 16,900 16,700
North Fringe 22,700 14,400 9,200 10,900 12,500
East Fringe 39,600 7,200 15,600 18,500 20,200
Bristol Urban Extension - north 8,900 12,600 4,600 5,400 7,000
Rest of South Gloucestershire 30,800 2,300 3,200 3,700 3,600
Bath 38,000 5,800 8,200 9,800 9,800
Bath Urban Extensions 1,000 100 1,900 2,300 3,800

GREATER BRISTOL STRATEGIC TRANSPORT STUDY Spatial Scenarios 1, 2 and 3
5019474 2-2 Spatial Scenario Tests 1-3 v4
Change from base (2031 – 2001)
Sectors Base (2001) Scenario
F Scenario
1 Scenario
2 Scenario
3
Bristol Urban Extension – south east
7,200 13,500 8,100 9,600 12,900
Rest of Bath & NE Somerset 27,100 2,800 2,500 3,000 2,900
Weston-super-Mare 32,700 11,300 11,600 13,800 6,800
Weston-super-Mare Extension 7,700 8,500 6,800 8,100 1,400
Portishead Extension 600 3,200 100 200 100
Bristol Urban Extension - South West
2,400 12,100 13,600 16,100 21,100
Rest of North Somerset 39,100 12,600 7,900 9,400 9,100
Study Area Total 424,800 138,700 134,800 159,800 159,600
Table 2.2 – Changes in Population
Change from base (2031 – 2003) Sectors
Base (2003)
Scenario F
Scenario 1
Scenario 2
Scenario 3
Bristol City Centre 12,900 9,800 200 700 700
NW Bristol (incl Avonmouth) 140,800 4,200 11,600 17,200 16,900
NE Bristol 100,800 15,400 15,800 20,100 19,800
South Bristol 135,000 -800 15,800 21,300 21,000
North Fringe 55,200 34,100 15,800 19,400 22,000
East Fringe 96,300 6,700 12,000 17,800 21,500
Bristol Urban Extension - north 21,800 24,500 3,500 5,200 8,700
Rest of South Gloucestershire 77,300 200 -6,300 -5,100 -5,300
Bath 85,200 7,100 12,900 16,100 15,800
Bath Urban Extensions 3,100 0 5,600 6,700 11,500
Bristol Urban Extension - south east
16,800 26,300 14,300 17,500 24,100
Rest of Bath & NE Somerset 65,700 500 300 1,300 900
Weston-super-Mare 74,500 24,400 16,800 21,200 7,100
Weston-super-Mare Extension 19,300 16,800 10,300 12,900 -1,000
Portishead Extension 1,500 3,900 -300 -300 -300
Bristol Urban Extension - South West
5,300 28,800 28,200 33,500 43,600

GREATER BRISTOL STRATEGIC TRANSPORT STUDY Spatial Scenarios 1, 2 and 3
5019474 2-3 Spatial Scenario Tests 1-3 v4
Change from base (2031 – 2003) Sectors
Base (2003)
Scenario F
Scenario 1
Scenario 2
Scenario 3
Rest of North Somerset 96,900 19,600 3,800 7,100 5,900
Study Area Total 1,008,400 221,500 160,300 212,600 212,900
Scenario 1
2.4 As shown in Figure 2.1, the urban areas of Bristol, Bath and Weston-super-Mare receive the majority of the Scenario 1 population growth, with urban extensions to all three centres also showing increases. As the number of people per household changes over the period 2003 to 2031 some areas record a drop in population – for example, the rest of South Gloucestershire and the ‘Portishead extension’.
Figure 2.1 – Population Change in Scenario 1 Compared with 2003 Base

GREATER BRISTOL STRATEGIC TRANSPORT STUDY Spatial Scenarios 1, 2 and 3
5019474 2-4 Spatial Scenario Tests 1-3 v4
2.5 Relative to the earlier Scenario F, Scenario 1 represents a concentration of development within existing urban areas of Bristol and Bath (see Figure 2.2) with:
♦ an increase in urban area development – especially in south Bristol, north west Bristol, the East Fringe, Bath and the Bath urban extension;
♦ reduced development in the Bristol urban extension north and North Fringe areas and in rural areas between Bristol and Weston-super-Mare, and in the Bristol urban extension to the south east;
♦ a moderate but significant reduction in the Portishead area and
♦ little change in development levels in the rural areas surrounding Bath (‘Rest of Bath & NE Somerset’).
Figure 2.2 – Sector Level Population Change in Scenario 1 Compared with Scenario F

GREATER BRISTOL STRATEGIC TRANSPORT STUDY Spatial Scenarios 1, 2 and 3
5019474 2-5 Spatial Scenario Tests 1-3 v4
2.6 A more detailed – zonal – level analysis of the changes in Figure 2.3, shows that it is Bathavon West zone (part of the Bath urban extension) and Bath North zone that receive some of the greatest changes in population between Scenarios F and 1. In Bristol the Siston zone has a much higher population allocation under Scenario 1, but Pucklechurch immediately to the north is lower. Also, within Bristol extra development over that in Scenario F is shown occurring in Hicks Gate and Ashton Vale (west of the Bedminster zone).
Figure 2.3 – Zone Level Population Change in Scenario 1 Compared with Scenario F

GREATER BRISTOL STRATEGIC TRANSPORT STUDY Spatial Scenarios 1, 2 and 3
5019474 2-6 Spatial Scenario Tests 1-3 v4
Scenario 2
2.7 The growth in population from the 2003 base forecast under Scenario 2 shows, in Figure 2.4, the same spatial pattern as described for Scenario 1 – highest growth within the existing urban areas of Bristol, Bath and Weston-super-Mare, and in extensions to them. However, overall population growth from the 2003 base is 33 percent higher than in Scenario 1, at 212,600.
Figure 2.4 – Population Change in Scenario 2 Compared with Scenario 2003 Base

GREATER BRISTOL STRATEGIC TRANSPORT STUDY Spatial Scenarios 1, 2 and 3
5019474 2-7 Spatial Scenario Tests 1-3 v4
2.8 As shown in Figure 2.5, Scenario 2 also represents a concentration of development within existing urban areas, relative to Scenario F with:
♦ an increase in urban area development – especially in south Bristol, north west Bristol and in the East Fringe as well as in Bath and the Bath urban extension;
♦ reduced development in the Bristol urban extension to the north and the North Fringe as well as less development in rural areas between Bristol and Weston-super-Mare, and in South Gloucestershire; and
♦ little change in the Weston-super-Mare area and in Bath & North East Somerset (other than in Bath).
Figure 2.5 – Sector Level Population Change in Scenario 2 Compared with Scenario F

GREATER BRISTOL STRATEGIC TRANSPORT STUDY Spatial Scenarios 1, 2 and 3
5019474 2-8 Spatial Scenario Tests 1-3 v4
2.9 Analysis at the zonal level shown in Figure 2.6 enables differences in population changes between Scenario 2 and Scenario F, and those reported between Scenarios 1 and F, to be noted:
♦ in addition to the Bathavon West and Bath North growth, extra growth is shown around Bath, particularly north of the existing urban area; and
♦ extra growth occurs in Clevedon and Weston-super-Mare.
Figure 2.6 – Zone Level Population Change in Scenario 2 Compared with Scenario F

GREATER BRISTOL STRATEGIC TRANSPORT STUDY Spatial Scenarios 1, 2 and 3
5019474 2-9 Spatial Scenario Tests 1-3 v4
Scenario 3
2.10 As with Scenarios 1 and 2, the growth in population from the 2003 base forecast under Scenario 3 shows the same spatial pattern of highest growth within and around the existing urban areas of Bristol and Bath (Figure 2.7). However, whereas Scenarios 1 and 2 also show high growth in Weston-super-Mare, Scenario 3 displays a much lower growth within Weston-super-Mare, and a slight reduction in population (1,000 people) in the Weston Extension. At 212,900, overall population growth from the 2003 base is similar to Scenario 2 (the method by which population is estimated for projected numbers of dwellings means that there is some variation from Scenario 2) with the reduced growth in and around Weston-super-Mare largely reallocated to the Bath and Bristol urban extensions.
Figure 2.7 – Population Change in Scenario 3 Compared with 2003 Base

GREATER BRISTOL STRATEGIC TRANSPORT STUDY Spatial Scenarios 1, 2 and 3
5019474 2-10 Spatial Scenario Tests 1-3 v4
2.11 As shown in Figure 2.8, Scenario 3 also represents a concentration of development within existing urban areas, relative to Scenario F, with:
♦ an increase in urban area development – especially in south Bristol, north west Bristol and the East Fringe, as well as in Bath and the Bath urban extension;
♦ reduced development in the Bristol urban extension to the north and the North Fringe as well as less development in Weston-super-Mare; and
♦ less development in the rural areas between Bristol and Weston-super-Mare, and in South Gloucestershire.
Figure 2.8 – Sector Level Population Change in Scenario 3 Compared with Scenario F

GREATER BRISTOL STRATEGIC TRANSPORT STUDY Spatial Scenarios 1, 2 and 3
5019474 2-11 Spatial Scenario Tests 1-3 v4
2.12 Analysis at the zonal level (Figure 2.9) enables differences in population changes between Scenario 3 and Scenario F, and those reported between Scenarios 1 & 2 and Scenario F, to be noted:
♦ in addition to the growth in Bathavon and Bath described for Scenarios 1 and 2, extra growth is shown in Bath South; and
♦ the extra growth within Clevedon and Weston-super-Mare area, included in Scenario 2, is omitted from Scenario 3 – the population in and around Weston-super-Mare actually falls compared with Scenario F.
Figure 2.9 – Zone Level Population Change in Scenario 3 Compared with Scenario F
EMPLOYMENT
2.13 While Scenario F contained employment projections that represented a 17 percent increase in jobs over the 2003 base, the employment projection for Scenario 1 represents a 32 percent increase over the 2003 base (Table 2.3). Scenario 2 contains further employment – 189,000 new jobs representing a 38 percent increase in employment over the 2003 base. Scenario 3’s 159,400 additional jobs over base are identical to that in Scenario 1.

GREATER BRISTOL STRATEGIC TRANSPORT STUDY Spatial Scenarios 1, 2 and 3
5019474 2-12 Spatial Scenario Tests 1-3 v4
Table 2.3 – Changes in Employment
Change from base (2031 – 2003)
Sectors Base (2003)
Scenario F
Scenario 1
Scenario 2
Scenario 3
Bristol City Centre 71,000 12,500 19,600 21,000 19,600
NW Bristol (incl Avonmouth) 54,000 3,600 15,500 16,600 15,500
NE Bristol 43,800 1,300 12,600 13,500 12,600
South Bristol 47,900 800 14,100 15,100 14,100
North Fringe 65,200 16,900 20,100 25,400 20,100
East Fringe 27,900 5,100 7,700 10,200 7,700
Bristol Urban Extension - north 8,500 2,500 3,300 5,400 3,300
Rest of South Gloucestershire 29,600 100 8,500 8,500 8,500
Bath 52,400 9,200 15,000 15,000 15,000
Bath Urban Extensions 1,500 -200 500 500 500
Bristol Urban Extension - south east
7,200 7,200 5,500 9,200 5,500
Rest of Bath & NE Somerset 20,600 200 6,000 6,000 6,000
Weston-super-Mare 28,800 10,700 8,300 11,900 8,300
Weston-super-Mare Extension 4,300 1,200 4,300 7,900 4,300
Portishead Extension 2,400 3,900 700 700 700
Bristol Urban Extension - South West
1,900 6,600 4,000 8,700 4,000
Rest of North Somerset 36,800 6,300 13,600 13,600 13,600
Study Area Total 503,800 87,900 159,300 189,200 159,300

GREATER BRISTOL STRATEGIC TRANSPORT STUDY Spatial Scenarios 1, 2 and 3
5019474 2-13 Spatial Scenario Tests 1-3 v4
Scenario 1
2.14 The growth in employment in Scenario 1 is distributed across the Greater Bristol area, though the North Fringe, central Bristol and north west Bristol (including Avonmouth) plus Bath receive the greatest concentrations of growth (Figure 2.10).
Figure 2.10 – Change in Employment – Scenario 1 Compared with 2003 Base
GREATER BRISTOL STRATEGIC TRANSPORT STUDY Spatial Scenarios 1, 2 and 3
5019474 2-14 Spatial Scenario Tests 1-3 v4
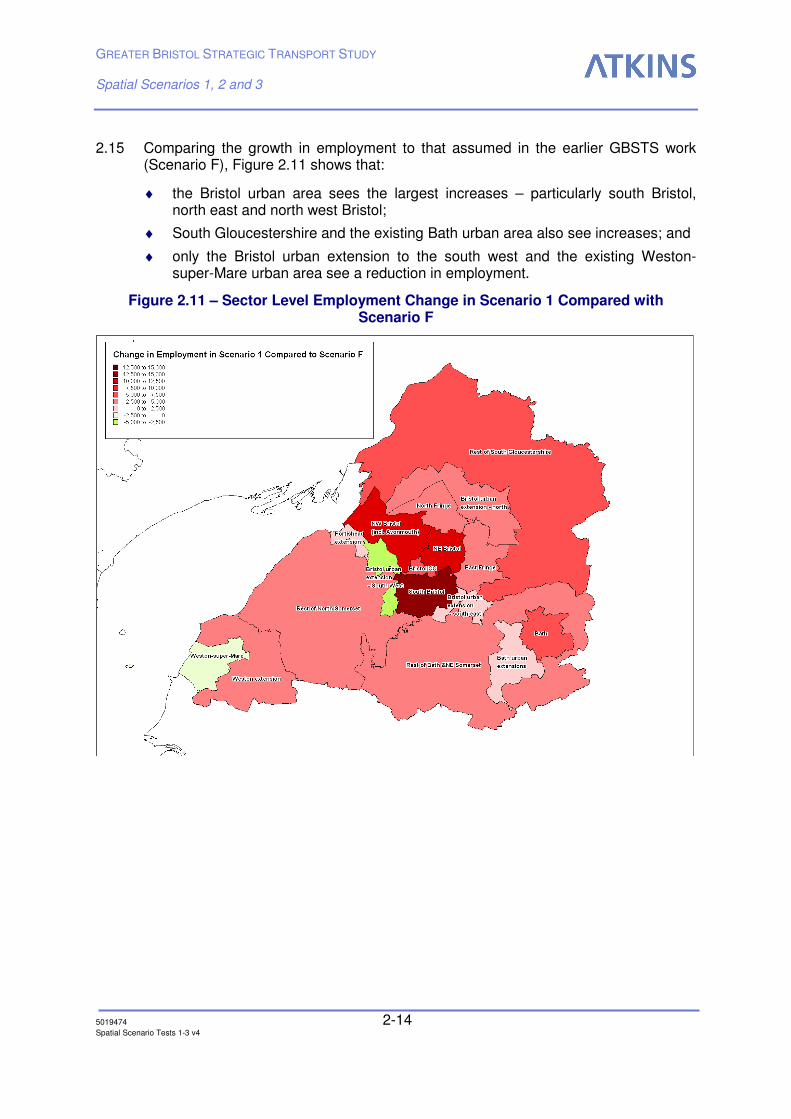
2.15 Comparing the growth in employment to that assumed in the earlier GBSTS work (Scenario F), Figure 2.11 shows that:
♦ the Bristol urban area sees the largest increases – particularly south Bristol, north east and north west Bristol;
♦ South Gloucestershire and the existing Bath urban area also see increases; and
♦ only the Bristol urban extension to the south west and the existing Weston-super-Mare urban area see a reduction in employment.
Figure 2.11 – Sector Level Employment Change in Scenario 1 Compared with Scenario F

GREATER BRISTOL STRATEGIC TRANSPORT STUDY Spatial Scenarios 1, 2 and 3
5019474 2-15 Spatial Scenario Tests 1-3 v4
2.16 Comparison at the zonal level reveals more detail on the variation in employment projections between Scenarios F and 1 (see Figure 2.12):
♦ the greatest variations relate to additional employment in the Bedminster, Ashton Vale and Cabot areas of Bristol;
♦ there is also substantial additional growth to the east of the Bristol urban area;
♦ Bath’s additional employment development is primarily within the urban area, with some growth occurring in the surrounding areas;
♦ South Gloucestershire’s additional employment is concentrated in the west; and
♦ Clevedon and Pucklechurch both have lower employment projections under Scenario 1.
Figure 2.12 – Zone Level Change in Employment – Scenario 1 Compared with Scenario F

GREATER BRISTOL STRATEGIC TRANSPORT STUDY Spatial Scenarios 1, 2 and 3
5019474 2-16 Spatial Scenario Tests 1-3 v4
Scenario 2
2.17 At 189,200, the employment growth in Scenario 2 compared with the 2003 base is higher than that reported under Scenario 1. The highest growth concentrations are again in the North Fringe, north west and central Bristol; although under this Scenario there is a slight redistribution of the extra employment between the sectors (Figure 2.13).
Figure 2.13 – Change in Employment – Scenario 2 Compared with 2003 Base

GREATER BRISTOL STRATEGIC TRANSPORT STUDY Spatial Scenarios 1, 2 and 3
5019474 2-17 Spatial Scenario Tests 1-3 v4
2.18 Comparing the growth forecast in Scenario 2 to that within Scenario F (Figure 2.14) reveals that:
♦ all sectors see an increase in employment relative to Scenario F;
♦ south and north west Bristol see the greatest increases in employment with significant growth in Bristol city centre, north east Bristol and the North Fringe; and
♦ other areas where employment increases substantially are the north east ring – East Fringe, Bristol urban extension north and the rest of South Gloucestershire – as well as Bath and the Weston-super-Mare extension.
2.19 The pattern of employment increases is similar to that in Scenario 1, although with a higher net growth which results in all sectors growing more than in Scenario F.
Figure 2.14 – Sector Level Change in Employment – Scenario 2 Compared with Scenario F

GREATER BRISTOL STRATEGIC TRANSPORT STUDY Spatial Scenarios 1, 2 and 3
5019474 2-18 Spatial Scenario Tests 1-3 v4
2.20 At the zonal level (Figure 2.15) the comparison between Scenarios 2 and F reveals:
♦ substantial additional development in Frenchay, eastern parts of Weston-super-Mare and Hutton;
♦ Ashton Vale, Bedminster and Cabot in Bristol are also allocated additional employment over that in Scenario F;
♦ Siston, on the eastern fringe of Bristol, also receives significant additional employment.
♦ the central part of Weston-super-Mare, Worle, Clevedon and Avonmouth, each have lower employment allocations under Scenario 2.
Figure 2.15 – Zone Level Change in Employment – Scenario 2 Compared with Scenario F

GREATER BRISTOL STRATEGIC TRANSPORT STUDY Spatial Scenarios 1, 2 and 3
5019474 2-19 Spatial Scenario Tests 1-3 v4
Scenario 3
2.21 At 159,400, the employment growth in Scenario 3 compared with the 2003 base is lower than that in Scenario 2 and identical to that reported for Scenario 1. As reported for Scenario 1 the highest growth concentrations are distributed across the Greater Bristol area, though the North Fringe, central Bristol and north west Bristol (including Avonmouth) plus Bath receive the greatest concentrations of growth (Figure 2.16).
Figure 2.16 – Change in Employment – Scenario 3 Compared with 2003 Base

GREATER BRISTOL STRATEGIC TRANSPORT STUDY Spatial Scenarios 1, 2 and 3
5019474 2-20 Spatial Scenario Tests 1-3 v4
2.22 Comparing the growth in employment to that in Scenario F (Figure 2.17) shows that:
♦ the Bristol urban area sees the largest increases – particularly south Bristol, north east and north west Bristol;
♦ South Gloucestershire and the existing Bath urban area also see increases; and
♦ only the Bristol urban extension to the south west and the existing Weston-super-Mare urban area see a reduction in employment..
Figure 2.17 – Sector Level Change in Employment – Scenario 3 Compared with Scenario F

GREATER BRISTOL STRATEGIC TRANSPORT STUDY Spatial Scenarios 1, 2 and 3
5019474 2-21 Spatial Scenario Tests 1-3 v4
2.23 Comparison at the zonal level reveals more detail on the variation in employment projections between Scenarios F and 3 (see Figure 2.18):
♦ the greatest increases relate to additional employment in the Bedminster, Ashton Vale and Cabot areas of Bristol, along with central Weston-super-Mare (East);
♦ there is also substantial additional growth to the east of the Bristol urban area;
♦ Bath’s additional employment development is primarily within the urban area, with some growth occurring in the surrounding areas;
♦ South Gloucestershire’s additional employment is concentrated in the west; and
♦ South Worle and Pucklechurch both have lower employment projections under Scenario 3.
Figure 2.18 – Zone Level Change in Employment – Scenario 3 Compared with Scenario F


GREATER BRISTOL STRATEGIC TRANSPORT STUDY Spatial Scenarios 1, 2 and 3
5019474 3-1 Spatial Scenario Tests 1-3 v4
3. Key Network Statistics – Peak Period
INTRODUCTION
3.1 Within GBSTS, the Greater Bristol Model (GBM) formed the basis for the assessment of current and future problems and for the development and appraisal of the transport strategy prepared by the study.
3.2 The GBM represents a wide range of potential responses of travellers to changes in transport provision, including mode choice, redistribution (changed destination) and reassignment (changed route). An important feature of the model is the representation of capacity constraints on the transport network (highway and public transport) which may restrict the volume of travel and influence the mode used. Hence, congestion on the road network and overcrowding on public transport services could suppress the demand for travel.
3.3 Key inputs into the model were the forecasts for zonal population and employment changes represented by Scenario F. The assessment of the impacts of the three different projections formed by Scenarios 1 to 3 was produced by running the GBM with the new sets of planning data to create revised forecasts of travel patterns across the Greater Bristol study area on both the highway and public transport networks.
3.4 The GBM was used to test the impact of the changes in population and employment projections within Scenarios 1 to 3 on the performance of the transport strategy developed by GBSTS. This analysis is presented in the following sections, showing the changes in key indicators on the performance of the transport network between Scenario F and Scenarios 1, 2 and 3.
3.5 The analysis below concentrates on the conditions in the peak period. Chapter 4 contains the corresponding analysis for the inter-peak period.
SCENARIO 1
3.6 As shown in Table 3.1, Scenario 1 results in an increase in car person trips of 21 percent compared with the base. Implementation of the transport strategy results in a lower increase of 7 percent, although this is 3.6 percent greater than under Scenario F.
3.7 Scenario 1 causes an increase in rail trips of 21 percent compared with the base – implementation of the transport strategy results in a 90 percent increase compared with the base. This increase is moderately (6.4 percent) greater than with Scenario F.
3.8 Without the transport strategy, bus trips are forecast to decrease by 13 percent compared with the base under Scenario 1. With the transport strategy, the decrease is less at 3 percent; this is less than the decrease forecast with Scenario F.

GREATER BRISTOL STRATEGIC TRANSPORT STUDY Spatial Scenarios 1, 2 and 3
5019474 3-2 Spatial Scenario Tests 1-3 v4
Table 3.1 – Person Trips by Mode and Mode Share (morning peak)
Mode Base Scenario F
Do Min
Scenario F Final
Strategy
Scenario 1 Do Min
Scenario 1 Final
Strategy
Scenario 1 Do Min vs
Base
Scenario 1 Final Strategy
vs Base
Scenario 1 Final Strategy vs Scenario F
Final Strategy
2003 2031 2031 2031 2031 2031 v 2003 2031 v 2003 2031 v 2031
Person Trips by Mode
Car 154,731 187,289 159,595 187,979 165,284 21% 7% 3.6%
Bus 13,607 11,659 12,797 11,830 13,251 -13% -3% 3.5%
Rail 4,424 5,566 7,851 5,352 8,353 21% 89% 6.4%
Rapid Transit 0 0 20,185 0 20,716 N/A N/A 2.6%
Park & Ride 1,552 1,767 8,980 1,545 8,822 0% 468% -1.8%
Total 174,314 206,281 209,408 206,707 216,426 19% 24% 3.4%
Mode Share
Car 88.8% 90.8% 76.2% 90.9% 76.4% 2% -14% 0.2%
Bus 7.8% 5.7% 6.1% 5.7% 6.1% -27% -22% 0.2%
Rail 2.5% 2.7% 3.7% 2.6% 3.9% 2% 52% 2.9%
Rapid Transit 0.0% 0.0% 9.6% 0.0% 9.6% N/A N/A -0.7%
Park & Ride 0.9% 0.9% 4.3% 0.7% 4.1% -16% 358% -4.9%

GREATER BRISTOL STRATEGIC TRANSPORT STUDY Spatial Scenarios 1, 2 and 3
5019474 3-3 Spatial Scenario Tests 1-3 v4
3.9 Without the transport strategy, car and rail mode shares are both forecast to grow by 2 percent under Scenario 1. With the transport strategy, car mode share decreases by 14 percent and rail’s share increases by 52 percent. While bus mode share decreases to around 6 percent even with the transport strategy, the implementation of a rapid transit network means that the combined bus and rapid transit mode share increases to almost 16 percent.
3.10 Compared with Scenario F, mode shares are only slightly changed under Scenario 1. The biggest change relates to the Park and Ride mode where, despite strong growth under Scenario 1 compared with the base, the mode share is slightly lower than under Scenario F.
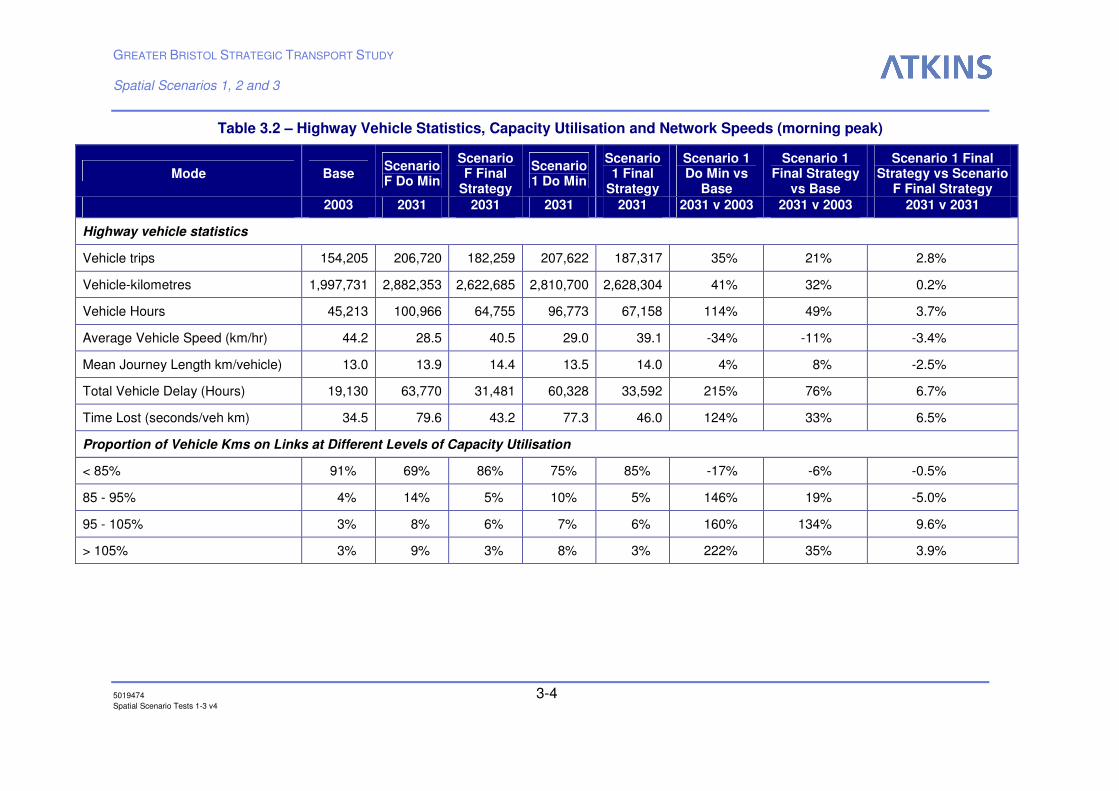
3.11 Table 3.2 summarises the changes in key indicators for the highway network with Scenarios F and 1 in 2031.
3.12 While the transport strategy reduces the rate of growth in the number of vehicle trips on the highway network, by 2031 there are still forecast to be 21 percent more trips than in the base – around 3 percent greater than under Scenario F. However, while mean journey length also increases between the base and 2031 (by 8 percent) with Scenario 1, this is 2.5 percent less than under Scenario F demonstrating the more self contained pattern of development in Scenario 1, particularly in the Bristol area..
3.13 The net result of the rising number of highway trips and trip lengths results in a 76 percent increase in total vehicle delay and a near 50 percent increase in vehicle hours with Scenario 1. Compared with Scenario F, Scenario 1 results in greater (6 to 7 percent) total and per vehicle delays.
3.14 The transport strategy is only partially able to slow the increase in the proportion of trips on roads operating at or above capacity. For example, without the transport strategy the proportion of roads at between 95 and 105 percent capacity rises by 160 percent whereas with the strategy the increase is 134 percent. Compared with Scenario F, Scenario 1 results in a small increase in the proportion of trips on roads operating at 95 percent of capacity.
3.15 In the base case, 40 percent of the local strategic network is operating below its threshold speed (60km/hr) with only 8 percent of the national strategic network below its threshold speed (90km/hr). Even with the transport strategy, the statistics show the strain placed on the network with the proportion of the national strategic network below threshold speed rising to 36 percent. However, there is only a slight change in the results between the two scenarios.
3.16 Investigation of the cordon crossing flows (Table 3.3) provides an indication of where the forecast changes in vehicle trips occur. The Bristol Outer cordon experiences the greatest number of trips in the base year and under both Scenarios; without the transport strategy, growth is also substantial at 35 percent inbound and 44 percent outbound. The transport strategy reduces these cordon flows although the increase over the base for the outbound flow is still 23 percent.
3.17 Bath experiences substantial growth in both directions across the cordon – in the order of 40 to 50 percent without the transport strategy, lowered by 43 percent outbound and 29 percent inbound with the strategy.
GREATER BRISTOL STRATEGIC TRANSPORT STUDY Spatial Scenarios 1, 2 and 3
5019474 3-4 Spatial Scenario Tests 1-3 v4
Table 3.2 – Highway Vehicle Statistics, Capacity Utilisation and Network Speeds (morning peak)
Mode Base Scenario F Do Min
Scenario F Final
Strategy
Scenario 1 Do Min
Scenario 1 Final
Strategy
Scenario 1 Do Min vs
Base
Scenario 1 Final Strategy
vs Base
Scenario 1 Final Strategy vs Scenario
F Final Strategy
2003 2031 2031 2031 2031 2031 v 2003 2031 v 2003 2031 v 2031
Highway vehicle statistics
Vehicle trips 154,205 206,720 182,259 207,622 187,317 35% 21% 2.8%
Vehicle-kilometres 1,997,731 2,882,353 2,622,685 2,810,700 2,628,304 41% 32% 0.2%
Vehicle Hours 45,213 100,966 64,755 96,773 67,158 114% 49% 3.7%
Average Vehicle Speed (km/hr) 44.2 28.5 40.5 29.0 39.1 -34% -11% -3.4%
Mean Journey Length km/vehicle) 13.0 13.9 14.4 13.5 14.0 4% 8% -2.5%
Total Vehicle Delay (Hours) 19,130 63,770 31,481 60,328 33,592 215% 76% 6.7%
Time Lost (seconds/veh km) 34.5 79.6 43.2 77.3 46.0 124% 33% 6.5%
Proportion of Vehicle Kms on Links at Different Levels of Capacity Utilisation
< 85% 91% 69% 86% 75% 85% -17% -6% -0.5%
85 - 95% 4% 14% 5% 10% 5% 146% 19% -5.0%
95 - 105% 3% 8% 6% 7% 6% 160% 134% 9.6%
> 105% 3% 9% 3% 8% 3% 222% 35% 3.9%

GREATER BRISTOL STRATEGIC TRANSPORT STUDY Spatial Scenarios 1, 2 and 3
5019474 3-5 Spatial Scenario Tests 1-3 v4
Mode Base Scenario F Do Min
Scenario F Final
Strategy
Scenario 1 Do Min
Scenario 1 Final
Strategy
Scenario 1 Do Min vs
Base
Scenario 1 Final Strategy
vs Base
Scenario 1 Final Strategy vs Scenario
F Final Strategy
2003 2031 2031 2031 2031 2031 v 2003 2031 v 2003 2031 v 2031
Percent of Network Below Threshold Speed
National Strategic Network [90km/hr]
8% 47% 36% 48% 36% 522% 363% -0.3%
Local Strategic Network [60km/hr] 40% 54% 46% 50% 47% 26% 18% 1.0%
Other Roads [35km/hr] 16% 24% 18% 23% 19% 41% 18% 4.8%
Table 3.3 – Highway Cordon Flows (morning peak)
Cordon Base Scenario F
Do Min
Scenario F Final
Strategy
Scenario 1 Do Min
Scenario 1 Final
Strategy
Scenario 1 Do Min vs
Base
Scenario 1 Final Strategy
vs Base
Scenario 1 Final Strategy vs Scenario
F Final Strategy
2003 2031 2031 2031 2031 2031 v 2003 2031 v 2003 2031 v 2031
Weston-super-Mare Outbound 3,282 4,774 5,815 4,682 5,753 43% 75% -1.1%
Weston-super-Mare Inbound 2,797 3,502 4,646 3,478 4,680 24% 67% 0.7%
Bath Outer Outbound 5,387 7,775 7,860 8,039 7,684 49% 43% -2.2%
Bath Outer Inbound 7,608 10,607 10,115 10,546 9,816 39% 29% -3.0%
Bristol Inner Inbound 15,928 20,124 15,724 20,871 16,239 31% 2% 3.3%
Bristol Inner Outbound 12,486 16,842 13,928 16,217 13,724 30% 10% -1.5%
Bristol Outer Inbound 28,011 38,221 32,002 37,724 31,716 35% 13% -0.9%
Bristol Outer Outbound 20,702 31,515 26,832 29,890 25,387 44% 23% -5.4%

GREATER BRISTOL STRATEGIC TRANSPORT STUDY Spatial Scenarios 1, 2 and 3
5019474 3-6 Spatial Scenario Tests 1-3 v4
3.18 The Weston-super-Mare cordon is the only one to experience higher growth with the transport strategy than in a ‘Do Minimum’ case.
3.19 Cordon crossing flows under Scenario 1 are broadly similar to those under Scenario F – the Bristol Outer cordon shows the greatest variation with a 5.4 percent reduction under Scenario 1 compared with Scenario F highlighting the increased self containment within Bristol associated with the higher employment levels.
3.20 Figure 3.1 demonstrates the variation in 2031 traffic levels in the morning peak period between Scenarios 1 and F; an increase in flows with Scenario 1 is shown in green while a decrease is shown in blue.
3.21 The most significant flow reductions between Scenarios F and 1 occur:
♦ eastbound on the M4, between Junction 20 and Junction 17;
♦ southbound on the M5 from Junction 17 to Junction 22;
♦ northbound on the M5 from Junction 17 to Junction 14;
♦ clockwise on the A4174 Ring Road east of Bristol from Filton round to the A37 at Whitchurch;
♦ on the M32 in both directions;
♦ southbound on the A46, from the M4 junction 18 to Bath; and
♦ on local roads in Avonmouth, Filton and Cribbs Causeway.
3.22 The reduced flows on the motorways in the outbound direction from Bristol in the morning peak emphasise the increased self containment within Bristol and hence the lower levels of out-commuting.
3.23 Higher flows with Scenario 1 are evident on:
♦ the M4 westbound between Junction 19 and Junction 22;
♦ the M5 northbound from Junction 22 to Junction 19;
♦ northbound on the A38 from Bristol International Airport to Barrow Gurney, and north on the A370 through Long Ashton;
♦ northbound on the A46, from Bath to the M4 junction 18; and
♦ various local roads in south and east Bristol areas.

GREATER BRISTOL STRATEGIC TRANSPORT STUDY Spatial Scenarios 1, 2 and 3
5019474 3-7 Spatial Scenario Tests 1-3 v4
Figure 3.1 – Change in Traffic Flow between Scenario F and Scenario 1 (morning peak)

GREATER BRISTOL STRATEGIC TRANSPORT STUDY Spatial Scenarios 1, 2 and 3
5019474 3-8 Spatial Scenario Tests 1-3 v4
3.24 Figure 3.2 shows the highway links above 85% capacity in Scenarios 1 and F.
3.25 In the majority of cases, links that are above the 85 percent capacity threshold under Scenario F, remain that way under Scenario 1 (shown in red). However, links shown in green are within the capacity threshold under Scenario 1 but not under Scenario F and hence the position has improved. These include:
♦ the eastbound A420 between Wick and its junction with the A46;
♦ southbound on the unclassified road between Lansdown and Bath;
♦ the unclassified road between the B4427 and the A38 at Patchway; and
♦ the southbound A38 approaching the junction with the B3130 at Barrow Gurney.
3.26 Conversely, links that exceed the capacity threshold under Scenario 1 but do not under Scenario F are shown in blue and include:
♦ the eastbound A36 from Bath to the proposed A36/A46 link;
♦ the southbound A36/A46 link;
♦ the westbound A420 approach to the A4174 Bristol Ring Road;
♦ westbound on the B4057 from Stoke Gifford to the junction with the A38;
♦ various additional local roads in Bristol city centre; plus
♦ the queue on the eastbound A4 through Saltford is longer; and
♦ the queue to the M5 Junction 19 from Portishead extends further back – to Weston in Gordano.

GREATER BRISTOL STRATEGIC TRANSPORT STUDY Spatial Scenarios 1, 2 and 3
5019474 3-9 Spatial Scenario Tests 1-3 v4
Figure 3.2 – Change in Capacity Utilisation between Scenario F and Scenario 1 (morning peak)
GREATER BRISTOL STRATEGIC TRANSPORT STUDY Spatial Scenarios 1, 2 and 3
5019474 3-10 Spatial Scenario Tests 1-3 v4
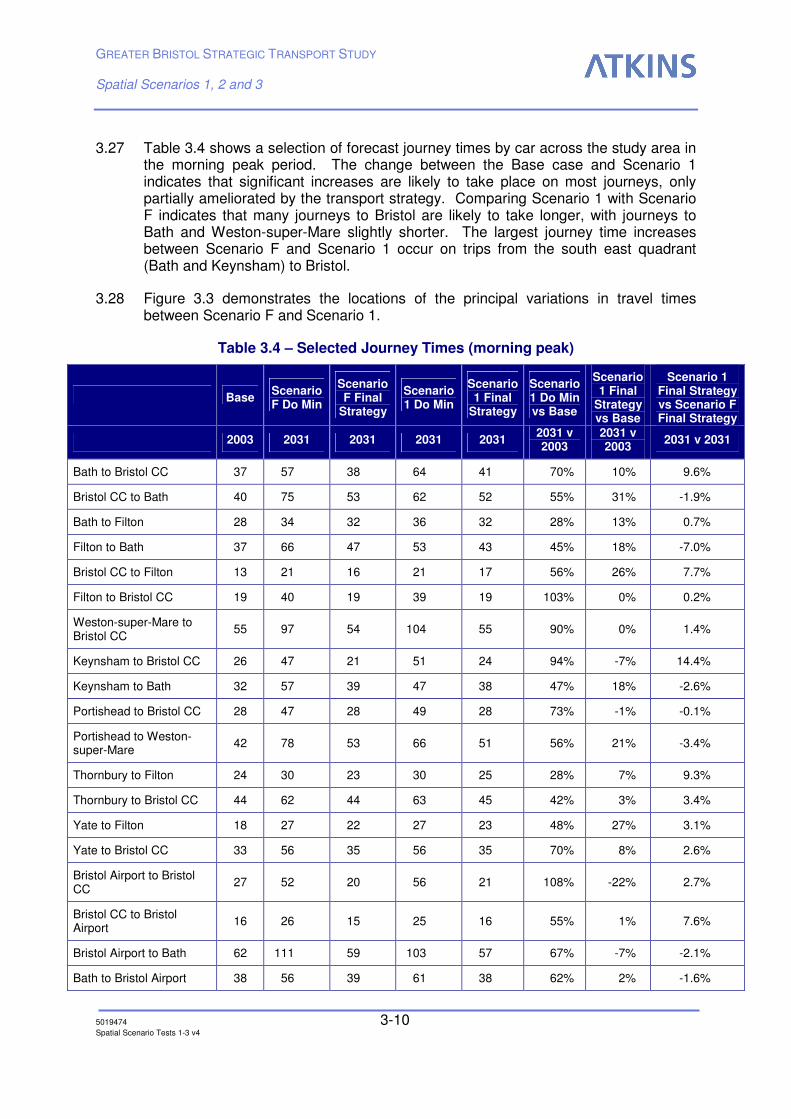
3.27 Table 3.4 shows a selection of forecast journey times by car across the study area in the morning peak period. The change between the Base case and Scenario 1 indicates that significant increases are likely to take place on most journeys, only partially ameliorated by the transport strategy. Comparing Scenario 1 with Scenario F indicates that many journeys to Bristol are likely to take longer, with journeys to Bath and Weston-super-Mare slightly shorter. The largest journey time increases between Scenario F and Scenario 1 occur on trips from the south east quadrant (Bath and Keynsham) to Bristol.
3.28 Figure 3.3 demonstrates the locations of the principal variations in travel times between Scenario F and Scenario 1.
Table 3.4 – Selected Journey Times (morning peak)
Base Scenario F Do Min
Scenario F Final
Strategy
Scenario 1 Do Min
Scenario 1 Final
Strategy
Scenario 1 Do Min vs Base
Scenario 1 Final
Strategy vs Base
Scenario 1 Final Strategy vs Scenario F Final Strategy
2003 2031 2031 2031 2031 2031 v 2003
2031 v 2003
2031 v 2031
Bath to Bristol CC 37 57 38 64 41 70% 10% 9.6%
Bristol CC to Bath 40 75 53 62 52 55% 31% -1.9%
Bath to Filton 28 34 32 36 32 28% 13% 0.7%
Filton to Bath 37 66 47 53 43 45% 18% -7.0%
Bristol CC to Filton 13 21 16 21 17 56% 26% 7.7%
Filton to Bristol CC 19 40 19 39 19 103% 0% 0.2%
Weston-super-Mare to Bristol CC
55 97 54 104 55 90% 0% 1.4%
Keynsham to Bristol CC 26 47 21 51 24 94% -7% 14.4%
Keynsham to Bath 32 57 39 47 38 47% 18% -2.6%
Portishead to Bristol CC 28 47 28 49 28 73% -1% -0.1%
Portishead to Weston-super-Mare
42 78 53 66 51 56% 21% -3.4%
Thornbury to Filton 24 30 23 30 25 28% 7% 9.3%
Thornbury to Bristol CC 44 62 44 63 45 42% 3% 3.4%
Yate to Filton 18 27 22 27 23 48% 27% 3.1%
Yate to Bristol CC 33 56 35 56 35 70% 8% 2.6%
Bristol Airport to Bristol CC
27 52 20 56 21 108% -22% 2.7%
Bristol CC to Bristol Airport
16 26 15 25 16 55% 1% 7.6%
Bristol Airport to Bath 62 111 59 103 57 67% -7% -2.1%
Bath to Bristol Airport 38 56 39 61 38 62% 2% -1.6%

GREATER BRISTOL STRATEGIC TRANSPORT STUDY Spatial Scenarios 1, 2 and 3
5019474 3-11 Spatial Scenario Tests 1-3 v4
Base Scenario F Do Min
Scenario F Final
Strategy
Scenario 1 Do Min
Scenario 1 Final
Strategy
Scenario 1 Do Min vs Base
Scenario 1 Final
Strategy vs Base
Scenario 1 Final Strategy vs Scenario F Final Strategy
2003 2031 2031 2031 2031 2031 v 2003
2031 v 2003
2031 v 2031
Weston-super-Mare to Bristol Airport
29 50 35 52 35 77% 20% 0.5%
Bristol Airport to Weston-super-Mare
30 57 39 48 36 59% 20% -6.0%
Bristol Airport to Filton 30 55 26 56 28 86% -6% 7.6%
Filton to Bristol Airport 25 44 24 42 24 68% -5% 0.7%
Figure 3.3 – Percentage Change in Selected Journey Times between Scenario F and Scenario 1
3.29 Table 3.5 examines the changes in public transport characteristics between Scenario F and Scenario 1.
3.30 The transport strategy is successful in greatly increasing the number of public transport passenger-kilometres – without the strategy, a 32 percent reduction in bus passenger-kilometres is forecast by 2031 while with the strategy a 30 percent increase is forecast. With the transport strategy, rail passenger-kilometres are higher under Scenario 1 than Scenario F (by 3.7 percent) and, although there are less bus and rapid transit passenger-kilometres with Scenario 1 compared with Scenario F, there is a net increase in total public transport passenger-kilometres.
GREATER BRISTOL STRATEGIC TRANSPORT STUDY Spatial Scenarios 1, 2 and 3
5019474 3-12 Spatial Scenario Tests 1-3 v4
3.31 Compared with the base case, there is only a 7 percent increase in bus passenger-hours with the transport strategy, despite the 30 percent increase in passenger-kilometres reported above. This follows from the higher frequencies on the bus network (and hence shorter waiting times) and the effects of bus priority measures in the GBSTS strategy. However, the increase in rail passenger-hours (46 percent) is more in line with the growth in passenger-kilometres.
3.32 Although there is a 24 percent reduction in the number of bus passenger-kilometres on links approaching capacity (85 percent to 95 percent capacity utilisation) between Scenario 1 with the transport strategy and the base case, there is a 46 percent increase in the proportion of passenger-kilometres on links at or over capacity (95 percent to 105 percent capacity utilisation). These results are similar to the equivalent values under Scenario F, though the proportion of bus trips on links above 105 percent capacity utilisation is 37 percent higher under Scenario 1. It should be noted that the public transport network in Scenario 1 is the same as that for Scenario F; it has not been revised to cater for the specific population and employment patterns in Scenario 1.

GREATER BRISTOL STRATEGIC TRANSPORT STUDY Spatial Scenarios 1, 2 and 3
5019474 3-13 Spatial Scenario Tests 1-3 v4
Table 3.5 – Public Transport Network Statistics (morning peak)
Base Scenario F Do Min
Scenario F Final
Strategy
Scenario 1 Do Min
Scenario 1 Final
Strategy
Scenario 1 Do Min vs
Base
Scenario 1 Final Strategy
vs Base
Scenario 1 Final Strategy vs Scenario
F Final Strategy
2003 2031 2031 2031 2031 2031 v 2003 2031 v 2003 2031 v 2031
Passenger-kilometres
Bus 104,019 81,368 138,229 70,574 135,296 -32% 30% -2.1%
Rail 601,350 639,245 816,342 635,994 846,822 6% 41% 3.7%
Rapid Transit 0 0 187,778 0 179,403 N/A N/A -4.5%
Passenger-hours (including walk & wait time)
Bus 12,473 11,850 12,909 12,005 13,297 -4% 7% 3.0%
Rail 32,901 35,639 46,201 35,213 47,976 7% 46% 3.8%
Rapid Transit 0 0 18,528 0 18,710 N/A N/A 1.0%
Crowded Time (Passenger-hours)
Rail 298 974 812 783 917 163% 208% 13.0%
Proportion of BUS passenger-kilometres on links at different levels of capacity utilisation
< 85% 79% 63% 79% 59% 77% -25% -2% -2.1%
85 - 95% 9% 7% 7% 8% 6% -1% -24% -1.5%
95 - 105% 7% 13% 10% 16% 10% 135% 46% 1.5%
> 105% 5% 16% 4% 16% 6% 189% 9% 36.7%

GREATER BRISTOL STRATEGIC TRANSPORT STUDY Spatial Scenarios 1, 2 and 3
5019474 3-14 Spatial Scenario Tests 1-3 v4
SCENARIO 2
3.33 The analysis for Scenario 2 follows a similar format to the earlier examination of Scenario 1, including the series of tables and figures.
3.34 As shown in Table 3.6, under Scenario 2 there is a 25 percent rise in car person trips compared with the base, reduced to 7 percent under the transport strategy. A similar percentage rise – 25 percent – in rail trips is also forecast though with the transport strategy there would be a 77 percent increase in rail trips.
3.35 Comparing Scenario 2 with Scenario F (both with the transport strategy) reveals only small differences – car person trips are 3.6 percent greater and overall there are 2.8 percent more trips.
3.36 The results for Scenario 2 are not dissimilar to Scenario 1 (reported above) – the percentage changes in person trips by mode are comparable although the increase in rail trips under Scenario 2 is lower than that in Scenario 1 (89 percent).
3.37 In terms of mode share, it is the public transport modes that see the greatest changes as a result of implementing the transport strategy under Scenario 2 – rail mode share increases from 2.5 percent in the base case to 3.6 percent under Scenario 2. While bus mode share falls from 7.8 percent to 6 percent, the addition of the rapid transit mode means the combined bus and rapid transit mode share becomes 15.5 percent.
3.38 Mode shares under Scenario 2 with the transport strategy are generally similar to those for Scenario F – the park and ride mode displays the greatest variation with a 5.4 percent reduction with Scenario 2. Car mode share varies by only 0.8 percent.
3.39 The mode shares forecast under Scenario 2 are almost identical to Scenario 1.

GREATER BRISTOL STRATEGIC TRANSPORT STUDY Spatial Scenarios 1, 2 and 3
5019474 3-15 Spatial Scenario Tests 1-3 v4
Table 3.6 – Person Trips by Mode and Mode Share (morning peak)
Mode Base Scenario F
Do Min
Scenario F Final
Strategy
Scenario 2 Do Min
Scenario 2 Final
Strategy
Scenario 2 Do Min vs
Base
Scenario 2 Final Strategy
vs Base
Scenario 2 Final Strategy vs Scenario F
Final Strategy
2003 2031 2031 2031 2031 2031 v 2003 2031 v 2003 2031 v 2031
Person Trips by Mode
Car 154,731 187,289 159,595 193,896 165,408 25% 7% 3.6%
Bus 13,607 11,659 12,797 12,043 13,004 -11% -4% 1.6%
Rail 4,424 5,566 7,851 5,538 7,827 25% 77% -0.3%
Rapid Transit 0 0 20,185 0 20,257 N/A N/A 0.4%
Park & Ride 1,552 1,767 8,980 1,539 8,730 -1% 462% -2.8%
Total 174,314 206,281 209,408 213,016 215,226 22% 23% 2.8%
Mode Share
Car 88.8% 90.8% 76.2% 91.0% 76.9% 3% -13% 0.8%
Bus 7.8% 5.7% 6.1% 5.7% 6.0% -28% -23% -1.1%
Rail 2.5% 2.7% 3.7% 2.6% 3.6% 2% 43% -3.0%
Rapid Transit 0.0% 0.0% 9.6% 0.0% 9.4% N/A N/A -2.4%
Park & Ride 0.9% 0.9% 4.3% 0.7% 4.1% -19% 356% -5.4%

GREATER BRISTOL STRATEGIC TRANSPORT STUDY Spatial Scenarios 1, 2 and 3
5019474 3-16 Spatial Scenario Tests 1-3 v4
3.40 As shown in Table 3.7, despite the implementation of the transport strategy, the additional population and employment set out in Scenario 2 means that the number of vehicle trips and vehicle kilometres are still forecast to increase by 22 percent and 30 percent respectively between the base and 2031. This results in a 9 percent reduction in vehicle speed and a 66 percent increase in total hours of vehicle delay.
3.41 Compared with Scenario F, Scenario 2 results in slightly reduced mean journey lengths and vehicle-kilometres, although total vehicle trips and delays are increased.
3.42 The forecast changes in key vehicle statistics under Scenario 2 are slightly more favourable than those described for Scenario 1 – the increases in vehicle trips, kilometres and hours are all slightly less while journey lengths and delays are reduced.
3.43 The increased number of trips and journey length by 2031, even with the transport strategy, results in a 5 percent reduction in the proportion of vehicle-kilometres below 85 percent capacity utilisation. The proportion of vehicle-kilometres on roads at capacity, (95 percent to 105 percent capacity utilisation) is forecast to more than double – to 7 percent.
3.44 The national strategic network appears to be main road system to suffer from the higher trip volumes and delays – while in the base case only 8 percent is below a threshold speed of 90km/hr, by 2031 this is forecast to have risen to 48 percent without the transport strategy and still 36 percent with it. However, the local strategic network and other roads are less adversely affected and the results are similar to those forecast under Scenario F.
3.45 Comparisons of the proportion of vehicle-kilometres at different levels of capacity utilisation, and the percentage of the networks below threshold speeds, between Scenarios 1 and 2 show only very small variations.
3.46 Cordon crossing flows show significant variation in the period 2003 to 2031 (Table 3.8) – without the transport strategy growth of between 34 and 53 percent is forecast. The transport strategy results in substantially less growth across the Bath and Bristol cordons – growth inbound across the Bristol Inner cordon is only 4 percent, though growth on the Weston-super-Mare cordon is almost doubled by the strategy.
3.47 Compared with Scenario F, Scenario 2 results in 4.9 percent more inbound growth across the Bristol Inner cordon, but 3.5 percent less outbound growth across the Bristol Outer cordon. There is also 9.5 percent more inbound growth across the Weston-super-Mare cordon under Scenario 2 compared with Scenario F.
3.48 Comparing the Scenario 2 and Scenario 1 with strategy results indicates that cordon crossing flows are generally similar, though at 5,087 vehicles, flows on the Weston-super-Mare inbound cordon under Scenario 2 are around 9 percent greater than under Scenario 1.

GREATER BRISTOL STRATEGIC TRANSPORT STUDY Spatial Scenarios 1, 2 and 3
5019474 3-17 Spatial Scenario Tests 1-3 v4
Table 3.7 – Highway Vehicle Statistics, Capacity Utilisation and Network Speeds (morning peak)
Mode Base Scenario F Do Min
Scenario F Final
Strategy
Scenario 2 Do Min
Scenario 2 Final
Strategy
Scenario 2 Do Min vs
Base
Scenario 2 Final Strategy
vs Base
Scenario 2 Final Strategy vs Scenario
F Final Strategy
2003 2031 2031 2031 2031 2031 v 2003 2031 v 2003 2031 v 2031
Highway vehicle statistics
Vehicle trips 154,205 206,720 182,259 212,652 187,490 38% 22% 2.9%
Vehicle-kilometres 1,997,731 2,882,353 2,622,685 2,856,651 2,605,690 43% 30% -0.6%
Vehicle Hours 45,213 100,966 64,755 101,635 65,100 125% 44% 0.5%
Average Vehicle Speed (km/hr) 44.2 28.5 40.5 28.1 40.0 -36% -9% -1.2%
Mean Journey Length km/vehicle) 13.0 13.9 14.4 13.4 13.9 4% 7% -3.4%
Total Vehicle Delay (Hours) 19,130 63,770 31,481 64,538 31,833 237% 66% 1.1%
Time Lost (seconds/veh km) 34.5 79.6 43.2 81.3 44.0 136% 28% 1.8%
Proportion of Vehicle Kms on Links at Different Levels of Capacity Utilisation
< 85% 91% 69% 86% 73% 86% -20% -5% 0.4%
85 - 95% 4% 14% 5% 11% 4% 190% 4% -16.8%
95 - 105% 3% 8% 6% 7% 6% 154% 127% 6.3%
> 105% 3% 9% 3% 9% 3% 245% 34% 3.2%

GREATER BRISTOL STRATEGIC TRANSPORT STUDY Spatial Scenarios 1, 2 and 3
5019474 3-18 Spatial Scenario Tests 1-3 v4
Mode Base Scenario F Do Min
Scenario F Final
Strategy
Scenario 2 Do Min
Scenario 2 Final
Strategy
Scenario 2 Do Min vs
Base
Scenario 2 Final Strategy
vs Base
Scenario 2 Final Strategy vs Scenario
F Final Strategy
2003 2031 2031 2031 2031 2031 v 2003 2031 v 2003 2031 v 2031
Percent of Network Below Threshold Speed
National Strategic Network [90km/hr] 8% 47% 36% 48% 36% 525% 366% 0.5%
Local Strategic Network [60km/hr] 40% 54% 46% 51% 46% 27% 16% -0.6%
Other Roads [35km/hr] 16% 24% 18% 24% 19% 48% 18% 3.9%
Table 3.8 – Highway Cordon Flows (morning peak)
Cordon Base Scenario F
Do Min
Scenario F Final
Strategy
Scenario 2 Do Min
Scenario 2 Final
Strategy
Scenario 2 Do Min vs
Base
Scenario 2 Final Strategy
vs Base
Scenario 2 Final Strategy vs Scenario
F Final Strategy
2003 2031 2031 2031 2031 2031 v 2003 2031 v 2003 2031 v 2031
Weston-super-Mare Outbound 3,282 4,774 5,815 4,781 5,879 46% 79% 1.1%
Weston-super-Mare Inbound 2,797 3,502 4,646 3,969 5,087 42% 82% 9.5%
Bath Outer Outbound 5,387 7,775 7,860 8,231 7,814 53% 45% -0.6%
Bath Outer Inbound 7,608 10,607 10,115 10,536 9,810 38% 29% -3.0%
Bristol Inner Inbound 15,928 20,124 15,724 21,291 16,502 34% 4% 4.9%
Bristol Inner Outbound 12,486 16,842 13,928 16,779 14,079 34% 13% 1.1%
Bristol Outer Inbound 28,011 38,221 32,002 38,214 32,132 36% 15% 0.4%
Bristol Outer Outbound 20,702 31,515 26,832 30,615 25,895 48% 25% -3.5%

GREATER BRISTOL STRATEGIC TRANSPORT STUDY Spatial Scenarios 1, 2 and 3
5019474 3-19 Spatial Scenario Tests 1-3 v4
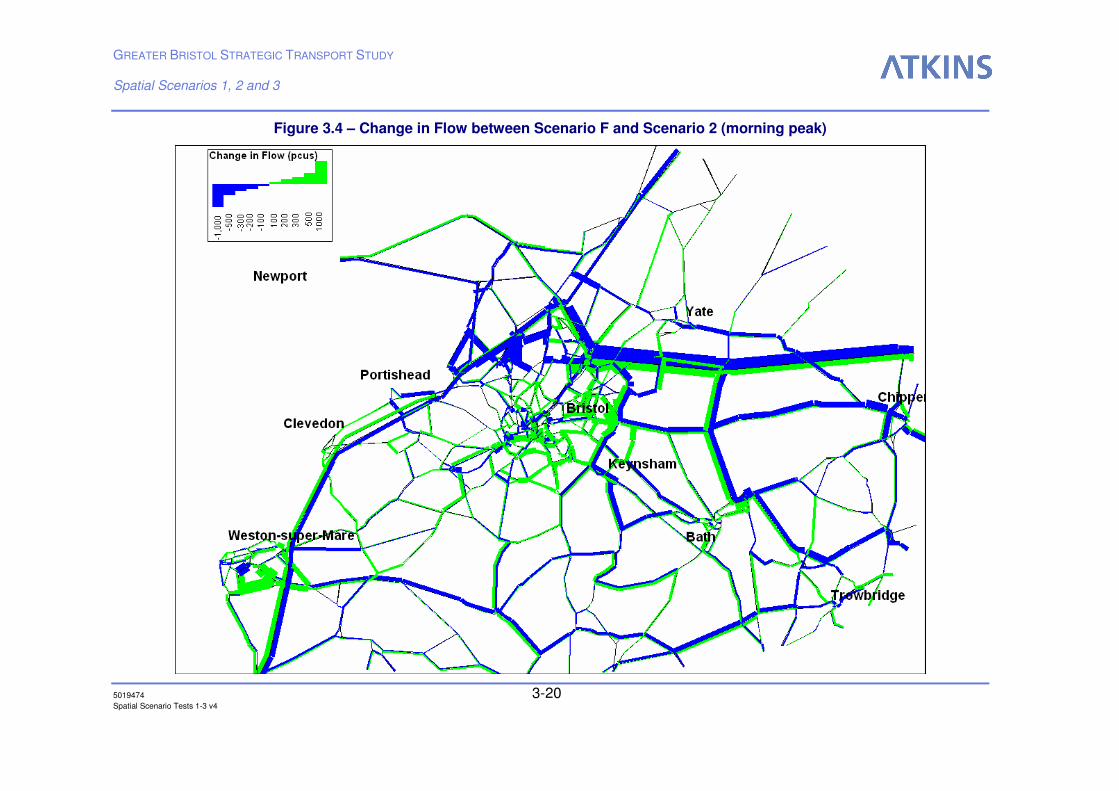
3.49 Figure 3.4 shows the change in traffic flows on the 2031 morning peak period highway network between Scenario F and Scenario2. The most significant flow reductions between Scenarios F and 2 occur:
♦ eastbound on the M4 between Junction 20 and Junction 17;
♦ southbound on the M5 from Junction 17 to Junction 22;
♦ northbound on the M5 from Junction 17 to Junction 14;
♦ clockwise on the A4174 Ring Road east of Bristol from Filton to Whitchurch;
♦ southbound on the M32 in both directions;
♦ southbound on the A46, from the M4 junction 18 to Bath; and
♦ on local roads in the Avonmouth, Filton and Cribbs Causeway areas.
3.50 Higher flows are evident in Scenario 2 on:
♦ the M4 westbound between Junction 20 and Junction 17;
♦ the M5 northbound from Junction 22 to Junction 19;
♦ northbound on the A38 from Bristol International Airport to Barrow Gurney, and north on the A370 through Long Ashton;
♦ northbound on the A46, from Bath to the M4 junction 18;
♦ various local roads in south and east Bristol; and
♦ local roads within Weston-super-Mare.
3.51 This pattern is very similar to that reported in the comparison between Scenarios F and 1.
GREATER BRISTOL STRATEGIC TRANSPORT STUDY Spatial Scenarios 1, 2 and 3
5019474 3-20 Spatial Scenario Tests 1-3 v4
Figure 3.4 – Change in Flow between Scenario F and Scenario 2 (morning peak)

GREATER BRISTOL STRATEGIC TRANSPORT STUDY Spatial Scenarios 1, 2 and 3
5019474 3-21 Spatial Scenario Tests 1-3 v4
3.52 Figure 3.5 considers the variations in capacity utilisation between Scenario F and Scenario 2. In the majority of cases, links that are above the 85 percent capacity threshold under Scenario F, remain that way under Scenario 2 and are shown in red on the figure. However, links that are within the capacity threshold under Scenario 2 but not under Scenario F are shown in green and include:
♦ the eastbound A420 between Wick and its junction with the A46; and
♦ southbound on the unclassified link between Lansdown and Bath;
3.53 Finally, links that exceed the capacity threshold under Scenario 2 but do not under Scenario F are shown in blue and include:
♦ the eastbound A36 from Bath to the A36/A46 link;
♦ the westbound A420 approach to the A4174 Bristol Ring Road;
♦ westbound on the B4057 from Stoke Gifford to the junction with the A38;
♦ southbound on an unclassified link between Broom Hill and the Brislington park and ride site;
♦ northbound on the unclassified link to the west of Filton Abbey Wood station, to the junction with the A4174 Ring Road;
♦ north-east bound on the B road between Westbury Park and Horfield;
♦ various additional local roads in Bristol City Centre; plus
♦ the queue on the eastbound A4 through Saltford is longer; and
♦ the queue to the M5 Junction 19 from Portishead extends further back – to Weston in Gordano.
3.54 The majority of the capacity utilisation changes between Scenarios F and 2 are the same as noted for Scenario 1. However the following key differences are noted:
♦ the unclassified link near Patchway and the A38 at Barrow Gurney remain congested in Scenario 2;
♦ the Brislington, Filton Abbey Wood and Horfield links noted above are not over capacity in Scenario1; while
♦ the southbound A36/A46 link is not over capacity in Scenario 2.

GREATER BRISTOL STRATEGIC TRANSPORT STUDY Spatial Scenarios 1, 2 and 3
5019474 3-22 Spatial Scenario Tests 1-3 v4
Figure 3.5 – Change in Capacity Utilisation between Scenario F and Scenario 2 (morning peak)

GREATER BRISTOL STRATEGIC TRANSPORT STUDY Spatial Scenarios 1, 2 and 3
5019474 3-23 Spatial Scenario Tests 1-3 v4
3.55 The increased delays as a result of the rising population and employment projections in Scenario 2 can be seen in the selected journey times included in Table 3.9. Even with the transport strategy, there is forecast to be a 23 percent increase in the journey time from Bristol City Centre to Bath and a 12 percent increase in the journey time between Keynsham and Bath. Journey times between Weston-super-Mare and Bristol Airport also appear to be badly affected under Scenario 2 – rising by around one quarter by 2031.
3.56 Compared with Scenario F, all of the selected journey times for trips into Bristol increase (see Figure 3.6), although journey times from Bristol and Keynsham to Bath are both lower. Compared with Scenario 1 (see Figure 3.7), the selected journey times into Weston-super-Mare and Bristol from the south and west increase, while those into Bath and Bristol from Thornbury and Yate decrease.
Table 3.9 – Selected Journey Times (morning peak)
Base Scenario F Do Min
Scenario F Final
Strategy
Scenario 2 Do Min
Scenario 2 Final
Strategy
Scenario 2 Do Min vs Base
Scenario 2 Final
Strategy vs Base
Scenario 2 Final Strategy vs Scenario F Final Strategy
2003 2031 2031 2031 2031 2031 v 2003
2031 v 2003
2031 v 2031
Bath to Bristol CC 37 57 38 67 42 79% 12% 12.0%
Bristol CC to Bath 40 75 53 64 49 60% 23% -7.9%
Bath to Filton 28 34 32 39 32 37% 15% 2.6%
Filton to Bath 37 66 47 53 41 45% 12% -12.0%
Bristol CC to Filton 13 21 16 22 16 69% 24% 6.1%
Filton to Bristol CC 19 40 19 41 20 113% 3% 3.6%
Weston-super-Mare to Bristol CC 55 97 54 109 58 100% 6% 7.2%
Keynsham to Bristol CC 26 47 21 53 24 103% -7% 13.5%
Keynsham to Bath 32 57 39 47 35 47% 12% -8.1%
Portishead to Bristol CC 28 47 28 50 29 78% 5% 5.3%
Portishead to Weston-super-Mare 42 78 53 72 53 71% 27% 1.0%
Thornbury to Filton 24 30 23 31 24 33% 3% 4.5%
Thornbury to Bristol CC 44 62 44 65 45 47% 2% 2.6%
Yate to Filton 18 27 22 28 22 58% 24% 0.5%
Yate to Bristol CC 33 56 35 58 35 78% 8% 2.2%
Bristol Airport to Bristol CC 27 52 20 57 22 113% -17% 9.1%
Bristol CC to Bristol Airport 16 26 15 26 15 62% -5% 0.8%

GREATER BRISTOL STRATEGIC TRANSPORT STUDY Spatial Scenarios 1, 2 and 3
5019474 3-24 Spatial Scenario Tests 1-3 v4
Base Scenario F Do Min
Scenario F Final
Strategy
Scenario 2 Do Min
Scenario 2 Final
Strategy
Scenario 2 Do Min vs Base
Scenario 2 Final
Strategy vs Base
Scenario 2 Final Strategy vs Scenario F Final Strategy
2003 2031 2031 2031 2031 2031 v 2003
2031 v 2003
2031 v 2031
Bristol Airport to Bath 62 111 59 105 55 70% -11% -6.0%
Bath to Bristol Airport 38 56 39 64 40 68% 6% 3.0%
Weston-super-Mare to Bristol Airport 29 50 35 55 37 87% 26% 5.8%
Bristol Airport to Weston-super-Mare 30 57 39 54 39 78% 28% 0.8%
Bristol Airport to Filton 30 55 26 57 28 91% -6% 6.6%
Filton to Bristol Airport 25 44 24 44 24 76% -3% 2.5%
Figure 3.6 – Percentage Change in Selected Journey Times between Scenario F and Scenario 2

GREATER BRISTOL STRATEGIC TRANSPORT STUDY Spatial Scenarios 1, 2 and 3
5019474 3-25 Spatial Scenario Tests 1-3 v4
Figure 3.7 – Percentage Change in Selected Journey Times between Scenario 2 and Scenario 1
3.57 Table 3.10 presents statistics on the performance of the public transport network in Scenario 2 and Scenario F. As with Scenario 1, a ‘Do Minimum’ approach results in a large (33 percent) reduction in bus passenger-kilometres and a small (7 percent) increase in rail passenger-kilometres. Implementation of the strategy results in increases in bus and rail passenger-kilometres of around 30 percent as well as adding around 176,000 rapid transit passenger-kilometres – a figure that is greater than the current or forecast number of bus passenger-kilometres.
3.58 While bus passenger-hours are little changed from the base, the additional rail trips mean that a 40 percent increase in rail passenger-hours (including walk and wait time) is forecast.
3.59 Increased congestion on the highway network will affect bus trips more by 2031 – the proportion of bus passenger-kilometres on links at less than 95 percent capacity falls while the proportion on links above 95 percent increases significantly. Scenario 2 results also appear to be worse than those reported for Scenario F – a 32.8 percent increase in the proportion of bus passenger-kilometres on links above 105 percent capacity – though it should be noted that this large percentage variation is associated with a small base number.

GREATER BRISTOL STRATEGIC TRANSPORT STUDY Spatial Scenarios 1, 2 and 3
5019474 3-26 Spatial Scenario Tests 1-3 v4
Table 3.10 – Public Transport Network Statistics (morning peak)
Base Scenario F Do Min
Scenario F Final
Strategy
Scenario 2 Do Min
Scenario 2 Final
Strategy
Scenario 2 Do Min vs
Base
Scenario 2 Final Strategy
vs Base
Scenario 2 Final Strategy vs Scenario
F Final Strategy
2003 2031 2031 2031 2031 2031 v 2003 2031 v 2003 2031 v 2031
Passenger-kilometres
Bus 104,019 81,368 138,229 69,831 132,354 -33% 27% -4.2%
Rail 601,350 639,245 816,342 641,586 810,651 7% 35% -0.7%
Rapid Transit 0 0 187,778 0 175,925 N/A N/A -6.3%
Passenger-hours (including walk & wait time)
Bus 12,473 11,850 12,909 12,265 12,868 -2% 3% -0.3%
Rail 32,901 35,639 46,201 35,694 45,989 8% 40% -0.5%
Rapid Transit 0 0 18,528 0 17,867 N/A N/A -3.6%
Crowded Time (Passenger-hours)
Rail 298 974 812 852 584 186% 96% -28.0%
Proportion of BUS passenger-kilometres on links at different levels of capacity utilisation
< 85% 79% 63% 79% 57% 78% -28% -1% -1.2%
85 - 95% 9% 7% 7% 10% 6% 15% -32% -12.3%
95 - 105% 7% 13% 10% 15% 10% 120% 49% 3.2%
> 105% 5% 16% 4% 18% 6% 224% 6% 32.8%

GREATER BRISTOL STRATEGIC TRANSPORT STUDY Spatial Scenarios 1, 2 and 3
5019474 3-27 Spatial Scenario Tests 1-3 v4
SCENARIO 3
3.60 The analysis for Scenario 3 follows a similar format to the earlier examination of Scenarios 1 and 2, including the series of tables and figures.
3.61 As shown in Table 3.11, under Scenario 3 there is a 24 percent rise in car person trips compared with the base, reduced to 6 percent under the transport strategy. A similar percentage rise – 25 percent – in rail trips is also forecast though with the transport strategy there would be a 74 percent increase in rail trips.
3.62 Comparing Scenario 3 with Scenario F (both with the transport strategy) generally reveals only small differences – car person trips are 2.6 percent greater, P&R shows the greatest variation with a 7.8 percent reduction, while overall there are 1.6 percent more trips. The results for Scenario 3 with the Final Strategy are not dissimilar to Scenarios 1 and 2 (reported above) though Scenario 3 total trips (~213,000) and specifically person trips by car (~164,000) are lower than in the other scenarios.
3.63 In terms of mode share, it is the public transport modes that see the greatest changes as a result of implementing the transport strategy under Scenario 3 – rail mode share increases from 2.5 percent in the base case to 3.6 percent under Scenario 3. While bus mode share falls from 7.8 percent to 5.9 percent, the addition of the rapid transit mode means the combined bus and rapid transit mode share becomes 15.6 percent.
3.64 Mode shares under Scenario 3 with the transport strategy are generally similar to those for Scenario F – the park and ride mode displays the greatest variation with a 9.3 percent reduction with Scenario 3. Car mode share is only 0.7 percentage points greater under Scenario 3 than under Scenario F.
3.65 The mode shares forecast under Scenario 3 are almost identical to Scenarios 1 and 2.

GREATER BRISTOL STRATEGIC TRANSPORT STUDY Spatial Scenarios 1, 2 and 3
5019474 3-28 Spatial Scenario Tests 1-3 v4
Table 3.11 – Person Trips by Mode and Mode Share (morning peak)
Mode Base Scenario F
Do Min
Scenario F Final
Strategy
Scenario 3 Do Min
Scenario 3 Final
Strategy
Scenario 3 Do Min vs
Base
Scenario 3 Final Strategy
vs Base
Scenario 3 Final Strategy vs Scenario F
Final Strategy
2003 2031 2031 2031 2031 2031 v 2003 2031 v 2003 2031 v 2031
Person Trips by Mode
Car 154,731 187,289 159,595 191,362 163,686 24% 6% 2.6%
Bus 13,607 11,659 12,797 12,062 12,597 -11% -7% -1.6%
Rail 4,424 5,566 7,851 5,530 7,703 25% 74% -1.9%
Rapid Transit 0 0 20,185 0 20,598 N/A N/A 2.0%
Park & Ride 1,552 1,767 8,980 1,563 8,276 1% 433% -7.8%
Total 174,314 206,281 209,408 210,517 212,859 21% 22% 1.6%
Mode Share
Car 88.8% 90.8% 76.2% 90.9% 76.9% 2% -13% 0.9%
Bus 7.8% 5.7% 6.1% 5.7% 5.9% -27% -24% -3.2%
Rail 2.5% 2.7% 3.7% 2.6% 3.6% 3% 43% -3.5%
Rapid Transit 0.0% 0.0% 9.6% 0.0% 9.7% N/A N/A 0.4%
Park & Ride 0.9% 0.9% 4.3% 0.7% 3.9% -17% 337% -9.3%

GREATER BRISTOL STRATEGIC TRANSPORT STUDY Spatial Scenarios 1, 2 and 3
5019474 3-29 Spatial Scenario Tests 1-3 v4
3.66 Even with the transport strategy, the additional population and employment set out in Scenario 3 means that the number of vehicle trips and vehicle kilometres are forecast to increase by 21 percent and 30 percent respectively between the base and 2031. This results in a 9 percent reduction in vehicle speed and a 63 percent increase in total hours of vehicle delay.
3.67 Compared with Scenario F, Scenario 3 results in a 3 percent reduction in mean journey lengths, although total vehicle trips change only marginally.
3.68 The forecast changes in key vehicle statistics under Scenario 3 are slightly more favourable than those described for Scenarios 1 and 2 – the increases in vehicle trips, kilometres and hours are all the same or slightly less while delays are reduced.
3.69 As with Scenario 2, the increased number of trips and journey length by 2031, even with the transport strategy, results in a 5 percent reduction in the proportion of vehicle-kilometres below 85 percent capacity utilisation. The proportion of vehicle-kilometres on roads at capacity, (95 percent to 105 percent capacity utilisation) is forecast to more than double – to 7 percent.
3.70 The national strategic network appears to be main road system to suffer from the higher trip volumes and delays – while in the base case only 8 percent is below a threshold speed of 90km/hr, by 2031 this is forecast to have risen to 48 percent without the transport strategy and still 35 percent with it. However, the local strategic network and other roads are less adversely affected and the results are similar to those forecast under Scenario F. This split of roads over capacity is the same as forecast under Scenarios 1 and 2.
3.71 Cordon crossing flows around Bath and Bristol show significant variation in the period 2003 to 2031 (Table 3.13) – without the transport strategy growth of between 33 and 51 percent is forecast. The transport strategy results in substantially less growth across the Bristol inner and outer cordons – growth inbound across the Bristol Inner cordon is only 6 percent – though the reductions around Bath are less while inbound trips across the Weston-super-Mare cordon increase by 75 percent with the strategy.
3.72 Compared with Scenario F, Scenario 3 results in 7.3 percent more inbound growth across the Bristol Inner cordon, but with reduced or unchanged flows across other Bath and Bristol cordons. There is also 5.3 percent more inbound growth across the Weston-super-Mare cordon though outbound growth falls by 16.5 percent.
3.73 Comparing the Scenario 3 with strategy results with those from Scenarios 1 and 2 indicates that Bath and Bristol cordon crossing flows are generally similar, though flows across the Weston-super-Mare cordon vary from those reported under Scenarios 1 and 2. Most notable is the reduction in outbound flow of around 1,000 vehicles compared with Scenarios 1 and 2. These differences are consistent with the spatial assumptions: Scenario 3 has much less housing in Weston-super-Mare than any of the other scenarios while employment levels in Weston-super-Mare and the Weston extension are the same as those in Scenario 1, slightly higher than those in Scenario F, and lower than in Scenario 2. The effect of this is that there is less out-commuting from Weston, and conversely, slightly more in-commuting due to the smaller pool of potential workers within the town.

GREATER BRISTOL STRATEGIC TRANSPORT STUDY Spatial Scenarios 1, 2 and 3
5019474 3-30 Spatial Scenario Tests 1-3 v4
Table 3.12 – Highway Vehicle Statistics, Capacity Utilisation and Network Speeds (morning peak)
Mode Base Scenario F Do Min
Scenario F Final
Strategy
Scenario 3 Do Min
Scenario 3 Final
Strategy
Scenario 3 Do Min vs
Base
Scenario 3 Final Strategy
vs Base
Scenario 3 Final Strategy vs Scenario
F Final Strategy
2003 2031 2031 2031 2031 2031 v 2003 2031 v 2003 2031 v 2031
Highway vehicle statistics
Vehicle trips 154,205 206,720 182,259 210,402 185,957 36% 21% 2.0%
Vehicle-kilometres 1,997,731 2,882,353 2,622,685 2,851,635 2,596,213 43% 30% -1.0%
Vehicle Hours 45,213 100,966 64,755 100,264 64,388 122% 42% -0.6%
Average Vehicle Speed (km/hr) 44.2 28.5 40.5 28.4 40.3 -36% -9% -0.4%
Mean Journey Length km/vehicle) 13.0 13.9 14.4 13.6 14.0 5% 8% -3.0%
Total Vehicle Delay (Hours) 19,130 63,770 31,481 63,248 31,249 231% 63% -0.7%
Time Lost (seconds/veh km) 34.5 79.6 43.2 79.8 43.3 132% 26% 0.3%
Proportion of Vehicle Kms on Links at Different Levels of Capacity Utilisation
< 85% 91% 69% 86% 74% 86% -18% -5% 0.3%
85 - 95% 4% 14% 5% 10% 5% 157% 20% -3.9%
95 - 105% 3% 8% 6% 7% 6% 165% 113% -0.3%
> 105% 3% 9% 3% 8% 3% 224% 29% -0.7%
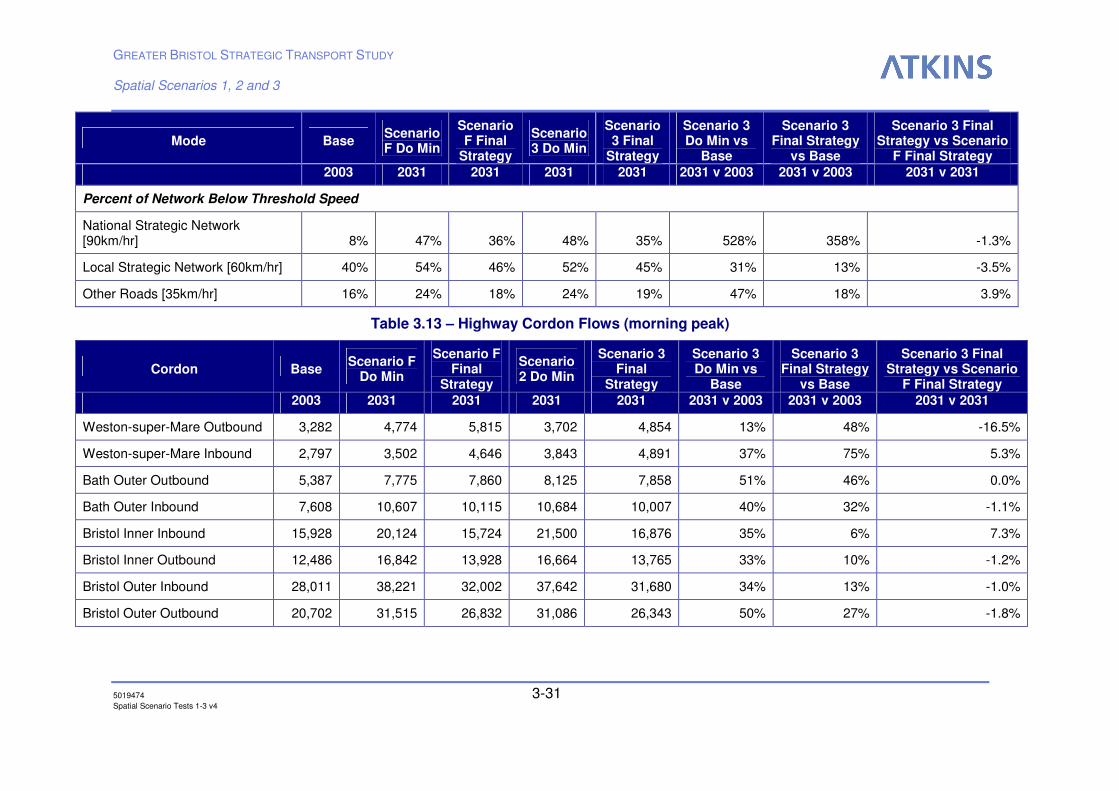
GREATER BRISTOL STRATEGIC TRANSPORT STUDY Spatial Scenarios 1, 2 and 3
5019474 3-31 Spatial Scenario Tests 1-3 v4
Mode Base Scenario F Do Min
Scenario F Final
Strategy
Scenario 3 Do Min
Scenario 3 Final
Strategy
Scenario 3 Do Min vs
Base
Scenario 3 Final Strategy
vs Base
Scenario 3 Final Strategy vs Scenario
F Final Strategy
2003 2031 2031 2031 2031 2031 v 2003 2031 v 2003 2031 v 2031
Percent of Network Below Threshold Speed
National Strategic Network [90km/hr] 8% 47% 36% 48% 35% 528% 358% -1.3%
Local Strategic Network [60km/hr] 40% 54% 46% 52% 45% 31% 13% -3.5%
Other Roads [35km/hr] 16% 24% 18% 24% 19% 47% 18% 3.9%
Table 3.13 – Highway Cordon Flows (morning peak)
Cordon Base Scenario F
Do Min
Scenario F Final
Strategy
Scenario 2 Do Min
Scenario 3 Final
Strategy
Scenario 3 Do Min vs
Base
Scenario 3 Final Strategy
vs Base
Scenario 3 Final Strategy vs Scenario
F Final Strategy
2003 2031 2031 2031 2031 2031 v 2003 2031 v 2003 2031 v 2031
Weston-super-Mare Outbound 3,282 4,774 5,815 3,702 4,854 13% 48% -16.5%
Weston-super-Mare Inbound 2,797 3,502 4,646 3,843 4,891 37% 75% 5.3%
Bath Outer Outbound 5,387 7,775 7,860 8,125 7,858 51% 46% 0.0%
Bath Outer Inbound 7,608 10,607 10,115 10,684 10,007 40% 32% -1.1%
Bristol Inner Inbound 15,928 20,124 15,724 21,500 16,876 35% 6% 7.3%
Bristol Inner Outbound 12,486 16,842 13,928 16,664 13,765 33% 10% -1.2%
Bristol Outer Inbound 28,011 38,221 32,002 37,642 31,680 34% 13% -1.0%
Bristol Outer Outbound 20,702 31,515 26,832 31,086 26,343 50% 27% -1.8%

GREATER BRISTOL STRATEGIC TRANSPORT STUDY Spatial Scenarios 1, 2 and 3
5019474 3-32 Spatial Scenario Tests 1-3 v4
3.74 The most significant flow reductions in the morning peak period, between Scenarios F and 3, (shown in Figure 3.8) occur:
♦ eastbound on the M4 between Junction 20 and Junction 17;
♦ northbound on the M5 from Junction 21 to Junction 18 and between junctions 17 and 15;
♦ southbound on the M5 from Junction 17 to Junction 18;
♦ clockwise on the A4174 Ring Road east of Bristol from Hambrook to the A420;
♦ southbound on the A46, from the M4 junction 18 to Bath; and
♦ Eastbound on the A368 through Banwell and northbound on the A38 from the M5 to South Bristol.
3.75 Higher flows are evident in Scenario 3 on:
♦ the M4 westbound between Junction 20 and Junction 17;
♦ northbound on the A46, from Bath to the M4 junction 18;
♦ various local roads in Bristol, particularly to the south and east;
♦ South and west bound on the A38 and A368 from Bristol International Airport to Weston-super-Mare; and
♦ the M5 northbound to Junction 21 along with the A370 northbound from the M5 to Weston-super-Mare.
3.76 This pattern is not dissimilar to that reported in the comparison between Scenario F and Scenarios 1 and 2. Scenario 3 does not, however, result in the same increase in vehicles around Weston-super-Mare as reported in Scenario 2, or the M5 northbound increases seen in both Scenarios 1 and 2. This is in line with the spatial distribution of population in Scenario 3, which reduces the level of out commuting from Weston.

GREATER BRISTOL STRATEGIC TRANSPORT STUDY Spatial Scenarios 1, 2 and 3
5019474 3-33 Spatial Scenario Tests 1-3 v4
Figure 3.8 – Change in Flow between Scenario F and Scenario 3 (morning peak)

GREATER BRISTOL STRATEGIC TRANSPORT STUDY Spatial Scenarios 1, 2 and 3
5019474 3-34 Spatial Scenario Tests 1-3 v4
3.77 In the majority of cases, links that are above the 85 percent capacity threshold under Scenario F, remain that way under Scenario 3 (shown in red in Figure 3.9). However, links that are within the capacity threshold under Scenario 3 but not under Scenario F are shown in green and include:
♦ the eastbound A420 between Wick and its junction with the A46; and
♦ eastbound on the A368 from the M5 to Banwell
3.78 Links that exceed the capacity threshold under Scenario 3 but do not under Scenario F are shown in blue and include:
♦ the eastbound A36 from Bath to the A36/A46 link;
♦ the northwest bound link between the A4174 at Siston and Staple Hill;
♦ north-east bound on the B road between Westbury Park and Horfield;
♦ southbound on the continuation of the M32 from Junction 3 to the Bristol Inner Ring Road;
♦ eastbound on the B4054 Shirehampton Road from Sea Mills to Stoke Bishop;
♦ the queue on the northbound A37 to the junction with the A4 is longer – extending back to the A4174; and
♦ various additional local roads in Bristol City Centre.
3.79 With the majority of links that are over capacity in Scenario F remaining that way in Scenario 3, the pattern of overcrowded links in Scenario 3 is similar to Scenarios 1 and 2. However, some changes are apparent:
♦ The A368 near Banwell is below the capacity threshold in Scenario 3, but above in Scenarios F, 1 and 2;
♦ Similarly the westbound unclassified link south of Weston-super-Mare;
♦ Scenario 3 does not reduce the length of over capacity highway on the southbound unclassified link between Wick and Bath in the way Scenarios 1 and 2 do;
♦ Additional local roads in Bristol are taken above the 85 percent capacity threshold compared with Scenarios 1 and 2.
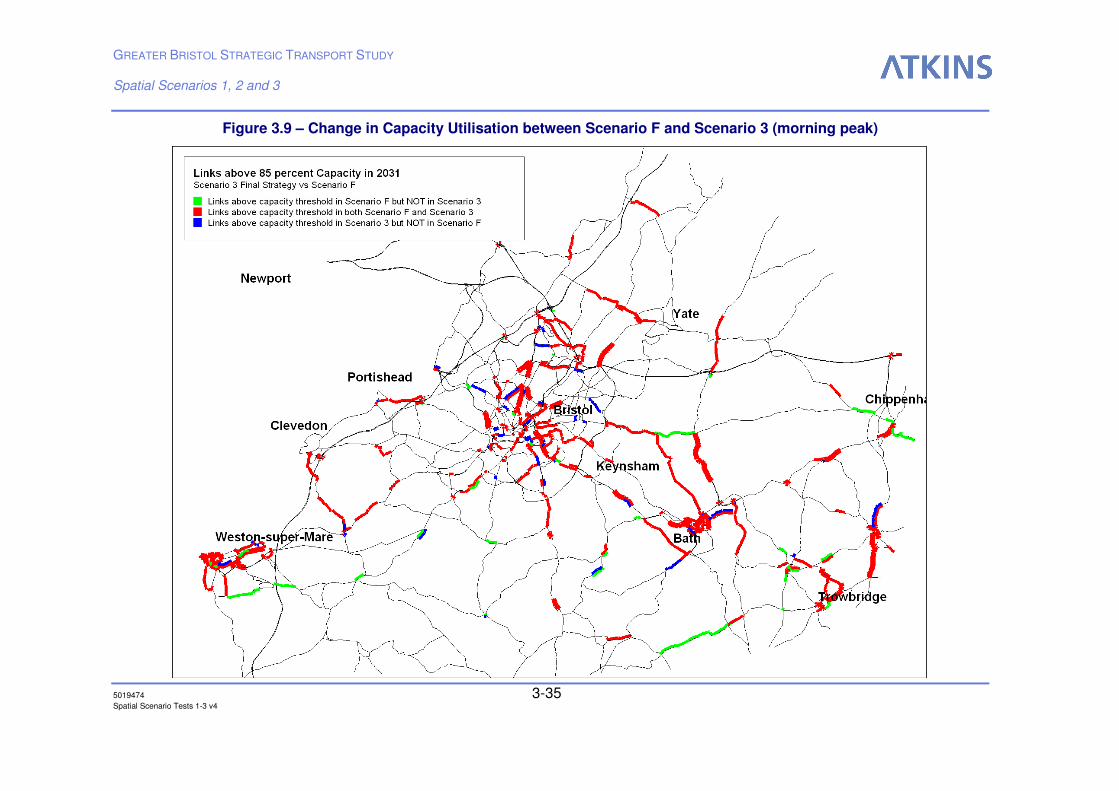
GREATER BRISTOL STRATEGIC TRANSPORT STUDY Spatial Scenarios 1, 2 and 3
5019474 3-35 Spatial Scenario Tests 1-3 v4
Figure 3.9 – Change in Capacity Utilisation between Scenario F and Scenario 3 (morning peak)

GREATER BRISTOL STRATEGIC TRANSPORT STUDY Spatial Scenarios 1, 2 and 3
5019474 3-36 Spatial Scenario Tests 1-3 v4
3.80 The increased delays as a result of the rising population and employment projections in Scenario 3 can be seen in the selected journey times included in Table 3.14. Even with the transport strategy, there is forecast to be a 27 percent increase in the journey time from Bristol City Centre to Bath and a 17 percent increase in the journey time between Keynsham and Bath. Other links that are badly affected include:
♦ Journeys from Bristol Airport to Weston-super-Mare rise by 20 percent by 2031;
♦ Bristol City Centre to Filton is 23 percent slower than in the base; and
♦ Yate to Filton journey times increase by 25 percent.
3.81 Compared with Scenario F, all of the selected journey times for trips into Bristol increase (see Figure 3.10) except those from Weston-super-Mare. However, journey times to Bath and Weston-super-Mare are lower under Scenario 3 compared with Scenario F.
3.82 The selected journey time results for trips into Bristol under Scenario 3, compared with those in Scenarios 1 and 2, are higher in all cases other than from Weston. Similarly journey times to from Bristol and Keynsham to Bath are higher than those in Scenarios 1 and 2. However, journey times from Bristol International Airport to both Weston-super-Mare and Bath are lower under Scenario 3 than they are under Scenario 2.
Table 3.14 – Selected Journey Times (morning peak)
Base Scenario F Do Min
Scenario F Final
Strategy
Scenario 3 Do Min
Scenario 3 Final
Strategy
Scenario 3 Do Min vs Base
Scenario 3 Final
Strategy vs Base
Scenario 3 Final Strategy vs Scenario F Final Strategy
2003 2031 2031 2031 2031 2031 v 2003
2031 v 2003
2031 v 2031
Bath to Bristol CC 37 57 38 68 45 82% 20% 19.8%
Bristol CC to Bath 40 75 53 67 50 69% 27% -5.2%
Bath to Filton 28 34 32 38 32 34% 15% 2.8%
Filton to Bath 37 66 47 57 43 54% 18% -7.5%
Bristol CC to Filton 13 21 16 23 16 73% 23% 5.0%
Filton to Bristol CC 19 40 19 41 21 114% 7% 7.8%
Weston-super-Mare to Bristol CC 55 97 54 96 52 76% -4% -3.0%
Keynsham to Bristol CC 26 47 21 55 25 111% -3% 18.7%
Keynsham to Bath 32 57 39 50 37 58% 17% -4.1%
Portishead to Bristol CC 28 47 28 50 30 77% 7% 7.7%
Portishead to Weston-super-Mare 42 78 53 71 51 70% 21% -4.0%
Thornbury to Filton 24 30 23 30 23 29% -1% 0.7%
Thornbury to Bristol CC 44 62 44 64 45 46% 2% 3.1%

GREATER BRISTOL STRATEGIC TRANSPORT STUDY Spatial Scenarios 1, 2 and 3
5019474 3-37 Spatial Scenario Tests 1-3 v4
Base Scenario F Do Min
Scenario F Final
Strategy
Scenario 3 Do Min
Scenario 3 Final
Strategy
Scenario 3 Do Min vs Base
Scenario 3 Final
Strategy vs Base
Scenario 3 Final Strategy vs Scenario F Final Strategy
2003 2031 2031 2031 2031 2031 v 2003
2031 v 2003
2031 v 2031
Yate to Filton 18 27 22 28 22 58% 25% 0.9%
Yate to Bristol CC 33 56 35 60 37 82% 12% 5.7%
Bristol Airport to Bristol CC 27 52 20 57 22 112% -16% 11.2%
Bristol CC to Bristol Airport 16 26 15 27 15 71% -3% 3.2%
Bristol Airport to Bath 62 111 59 107 57 73% -8% -2.8%
Bath to Bristol Airport 38 56 39 62 41 63% 8% 4.8%
Weston-super-Mare to Bristol Airport 29 50 35 41 31 39% 6% -11.1%
Bristol Airport to Weston-super-Mare 30 57 39 51 36 69% 20% -6.2%
Bristol Airport to Filton 30 55 26 57 28 89% -7% 6.1%
Filton to Bristol Airport 25 44 24 44 25 75% -2% 3.6%
Figure 3.10 – Percentage Change in Selected Journey Times between Scenario F and Scenario 3

GREATER BRISTOL STRATEGIC TRANSPORT STUDY Spatial Scenarios 1, 2 and 3
5019474 3-38 Spatial Scenario Tests 1-3 v4
3.83 As with Scenarios 1 and 2, a ‘Do Minimum’ approach results in a large (32 percent) reduction in bus passenger-kilometres and a small (7 percent) increase in rail passenger-kilometres (Table 3.15). Implementation of the strategy results in increases in bus and rail passenger-kilometres of around one third, as well as adding around 178,000 rapid transit passenger-kilometres – a figure that is greater than the current or forecast number of bus passenger-kilometres.
3.84 Bus passenger-hours are little changed from the base but the additional rail trips result in a 39 percent increase in rail passenger-hours (including walk and wait time) – similar to the results for Scenario 2, though slightly less than the 46 percent reported for Scenario 1.
3.85 As with Scenarios 1 and 2, increased congestion on the highway will affect bus trips more by 2031 – the proportion of bus passenger-kilometres on links at less than 95 percent capacity falls while the proportion on links above 95 percent increases significantly. Scenario 3 results also appear to be worse than those reported for Scenario F – a 23.8 percent increase in the proportion of bus passenger-kilometres on links above 105 percent capacity – though it should be noted that this large percentage variation is associated with a small base number. Scenario 3 also appears to perform better than Scenarios 1 and 2 in this respect.

GREATER BRISTOL STRATEGIC TRANSPORT STUDY Spatial Scenarios 1, 2 and 3
5019474 3-39 Spatial Scenario Tests 1-3 v4
Table 3.15 – Public Transport Network Statistics (morning peak)
Base Scenario F Do Min
Scenario F Final
Strategy
Scenario 3 Do Min
Scenario 3 Final
Strategy
Scenario 3 Do Min vs
Base
Scenario 3 Final Strategy
vs Base
Scenario 3 Final Strategy vs Scenario
F Final Strategy
2003 2031 2031 2031 2031 2031 v 2003 2031 v 2003 2031 v 2031
Passenger-kilometres
Bus 104,019 81,368 138,229 70,241 131,991 -32% 27% -4.5%
Rail 601,350 639,245 816,342 643,864 807,050 7% 34% -1.1%
Rapid Transit 0 0 187,778 0 177,542 N/A N/A -5.5%
Passenger-hours (including walk & wait time)
Bus 12,473 11,850 12,909 12,394 12,581 -1% 1% -2.5%
Rail 32,901 35,639 46,201 35,915 45,859 9% 39% -0.7%
Rapid Transit 0 0 18,528 0 18,179 N/A N/A -1.9%
Crowded Time (Passenger-hours)
Rail 298 974 812 809 571 172% 92% -29.6%
Proportion of BUS passenger-kilometres on links at different levels of capacity utilisation
< 85% 79% 63% 79% 58% 78% -26% -2% -1.9%
85 - 95% 9% 7% 7% 9% 7% 8% -21% 2.8%
95 - 105% 7% 13% 10% 14% 10% 106% 48% 2.9%
> 105% 5% 16% 4% 18% 5% 234% -1% 23.8%


GREATER BRISTOL STRATEGIC TRANSPORT STUDY Spatial Scenarios 1, 2 and 3
5019474 4-1 Spatial Scenario Tests 1-3 v4
4. Key Network Statistics – Inter-Peak Period
INTRODUCTION
4.1 The analysis in this chapter concentrates on the key statistics for the inter-peak period covered by the model. Compared with Chapter 3, it includes a more limited set of tables appropriate for the inter-peak period. It should be noted that whereas in the AM peak the majority of trips are commuting, this is not the case in the inter-peak. For this reason, the greater increase in employment has less effect than the reduction in population compared with Scenario F, and hence there are fewer trips forecast in Scenarios 1-3. In Scenarios 2 and 3 the difference in population is not significant, and hence the number of inter-peak trips is comparable with Scenario F.
SCENARIO 1
4.2 During the inter-peak period, park and ride experiences the greatest rate of growth in person trips with the transport strategy (Table 4.1), though rail’s 73 percent growth from a higher base results in more trips (around 3.5 thousand). With the transport strategy, there is only limited growth in bus trips, but combined with the 14 thousand new rapid transit trips the number of passengers is more than doubled from the base.
4.3 With the transport strategy, growth in all modes is less in Scenario 1 than in Scenario F. Overall person trips are 3.4 percent lower, with an 8.8 percent reduction in park and ride and a 10.7 percent drop in rapid transit.
4.4 The 7 percent reduction in car mode share with the transport strategy is accommodated through a 41 percent increase in rail and a 215 percent increase in park and ride mode shares (as well as trips by rapid transit).
4.5 The number, length and time of vehicle trips increase substantially by 2031 (Table 4.2), even with the transport strategy. This results in a 125 percent increase in total vehicle delay. Compared with Scenario F, Scenario 1 does result in lower highway trip numbers, length and time – also leading to 6.5 percent less total vehicle delay.

GREATER BRISTOL STRATEGIC TRANSPORT STUDY Spatial Scenarios 1, 2 and 3
5019474 4-2 Spatial Scenario Tests 1-3 v4
Table 4.1 – Person Trips by Mode and Mode Share (inter peak)
Mode Base Scenario F
Do Min
Scenario F Final
Strategy
Scenario 1 Do Min
Scenario 1 Final
Strategy
Scenario 1 Do Min vs
Base
Scenario 1 Final Strategy
vs Base
Scenario 1 Final Strategy vs Scenario F
Final Strategy
2003 2031 2031 2031 2031 2031 v 2003 2031 v 2003 2031 v 2031
Person Trips by Mode
Car 157,614 193,040 185,208 188,355 180,103 20% 14% -2.8%
Bus 10,525 9,433 11,081 9,035 10,719 -14% 2% -3.3%
Rail 2,110 2,736 3,777 2,566 3,656 22% 73% -3.2%
Rapid Transit 0 0 15,632 0 13,966 N/A N/A -10.7%
Park & Ride 401 510 1,703 436 1,554 9% 287% -8.8%
Total 170,651 205,719 217,401 200,392 209,998 17% 23% -3.4%
Mode Share
Car 92.4% 93.8% 85.2% 94.0% 85.8% 2% -7% 0.7%
Bus 6.2% 4.6% 5.1% 4.5% 5.1% -27% -17% 0.1%
Rail 1.2% 1.3% 1.7% 1.3% 1.7% 4% 41% 0.2%
Rapid Transit 0.0% 0.0% 7.2% 0.0% 6.7% N/A N/A -7.5%
Park & Ride 0.2% 0.2% 0.8% 0.2% 0.7% -7% 215% -5.6%

GREATER BRISTOL STRATEGIC TRANSPORT STUDY Spatial Scenarios 1, 2 and 3
5019474 4-3 Spatial Scenario Tests 1-3 v4
Table 4.2 – Highway Vehicle Statistics (inter peak)
Mode Base Scenario F Do Min
Scenario F Final
Strategy
Scenario 1 Do Min
Scenario 1 Final
Strategy
Scenario 1 Do Min vs
Base
Scenario 1 Final Strategy
vs Base
Scenario 1 Final Strategy vs Scenario
F Final Strategy
2003 2031 2031 2031 2031 2031 v 2003 2031 v 2003 2031 v 2031
Vehicle trips 139,360 190,197 183,410 187,536 180,489 35% 30% -1.6%
Vehicle-kilometres 1,643,619 2,498,316 2,386,527 2,409,024 2,304,296 47% 40% -3.4%
Vehicle Hours 29,739 61,199 50,594 57,807 48,306 94% 62% -4.5%
Average Vehicle Speed (km/hr) 55.3 40.8 47.2 41.7 47.7 -25% -14% 1.1%
Mean Journey Length km/vehicle) 11.8 13.1 13.0 12.8 12.8 9% 8% -1.9%
Total Vehicle Delay (Hours) 8,568 29,558 20,650 27,234 19,307 218% 125% -6.5%
Time Lost (seconds/veh km) 18.8 42.6 31.2 40.7 30.2 117% 61% -3.2%

GREATER BRISTOL STRATEGIC TRANSPORT STUDY Spatial Scenarios 1, 2 and 3
5019474 4-4 Spatial Scenario Tests 1-3 v4
4.6 During the inter-peak period there are significant reductions in traffic flow under Scenario 1 compared with Scenario F (Figure 4.1) on the following links:
♦ M4 westbound, east of Junction 19. but particularly between Junctions 18 and 19;
♦ M5 northbound, south of the M4, particularly between Junctions 19 and 17;
♦ A4174 Bristol Ring Road, east of Bristol, particularly between the A4 and Whitchurch (both directions);
♦ the A420 from A46 to the Bristol Ring Road (both directions); and
♦ the A46 from Batheaston to the junction with the A420 (both directions).
4.7 No links show comparable levels of traffic flow increases.
4.8 A comparison of links over capacity between Scenarios F and 1 shows a general level of improvement, notably with the following links reduced below 85 percent capacity:
♦ the A46 (both directions) between Upper Swainswick and the A420; and
♦ the M5 (both directions) between Junctions 16 and 17;
4.9 Very few additional links rise above the 85 percent capacity threshold under Scenario 1. The most notable ones that do are:
♦ northbound on the unclassified road between Brislington park and ride site and Broom Hill; and
♦ westbound on the A4174 Bristol Ring Road from the junction with the A4 to the junction with the A37.
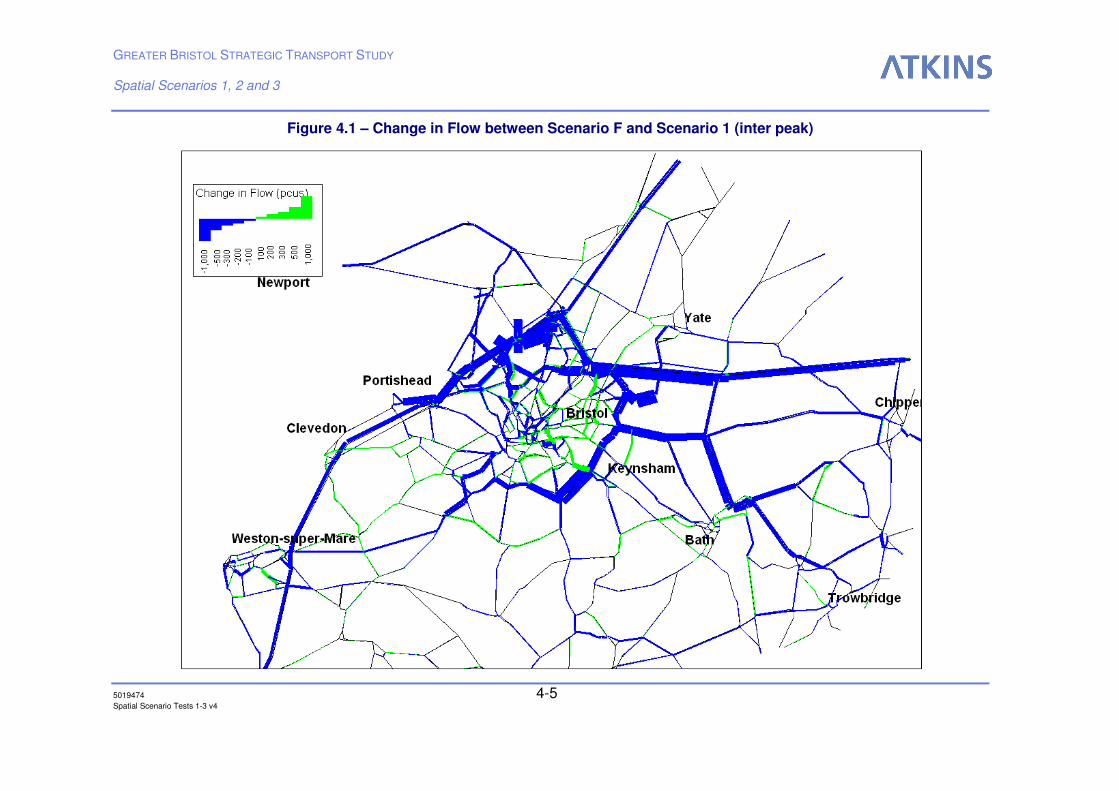
GREATER BRISTOL STRATEGIC TRANSPORT STUDY Spatial Scenarios 1, 2 and 3
5019474 4-5 Spatial Scenario Tests 1-3 v4
Figure 4.1 – Change in Flow between Scenario F and Scenario 1 (inter peak)

GREATER BRISTOL STRATEGIC TRANSPORT STUDY Spatial Scenarios 1, 2 and 3
5019474 4-6 Spatial Scenario Tests 1-3 v4
Figure 4.2 – Change in Capacity Utilisation between Scenario F and Scenario 1 (inter peak)

GREATER BRISTOL STRATEGIC TRANSPORT STUDY Spatial Scenarios 1, 2 and 3
5019474 4-7 Spatial Scenario Tests 1-3 v4
4.10 The transport strategy results in significantly higher public transport passenger-kilometres than either the base case or the Do Minimum case (Table 4.3) – in the case of buses a near 50 percent increase is predicted over the base case. However, public transport passenger-kilometres are lower under Scenario 1 than Scenario F – rapid transit passenger-kilometres are down by around 18 percent.
SCENARIO 2
4.11 Total inter-peak person trips under Scenario 2 with the transport strategy are similar to Scenario F – though variations exist within individual modes: there are around 5 percent less trips on both the rapid transit and park and ride modes (Table 4.4). The transport strategy is successful in reducing the number of car person trips under Scenario 2 compared with the Do Minimum case, while at the same time enabling a higher overall person trip rate.
4.12 With the transport strategy car mode share under Scenario 2, at 86 percent, is similar to that recorded under Scenario F. Rapid transit and park and ride mode shares both fall by around 5 percent compared with Scenario F, though the 0.5 percent increase in rail mode share accounts for these transferred trips.
4.13 Compared with Scenario F, and despite the slight increase in vehicle trips (0.8%) even with the transport strategy, there is a slight reduction in vehicle hours (-0.5%) and kilometres (-1.4%) – see Table 4.5. However, total vehicle delays are still slightly increased resulting in average vehicle speeds that are -0.9 percent lower than under Scenario F.

GREATER BRISTOL STRATEGIC TRANSPORT STUDY Spatial Scenarios 1, 2 and 3
5019474 4-8 Spatial Scenario Tests 1-3 v4
Table 4.3 – Public Transport Passenger-kilometres (inter peak)
Base Scenario F Do Min
Scenario F Final Strategy
Scenario 1 Do Min
Scenario 1 Final Strategy
Scenario 1 Do Min vs Base
Scenario 1 Final Strategy vs Base
Scenario 1 Final Strategy vs Scenario F Final Strategy
2003 2031 2031 2031 2031 2031 v 2003 2031 v 2003 2031 v 2031
Bus 74,277 60,409 118,366 56,991 110,994 -23% 49% -6.2%
Rail 284,672 339,387 403,827 327,709 390,121 15% 37% -3.4%
Rapid Transit 0 0 132,727 0 109,093 N/A N/A -17.8%

GREATER BRISTOL STRATEGIC TRANSPORT STUDY Spatial Scenarios 1, 2 and 3
5019474 4-9 Spatial Scenario Tests 1-3 v4
Table 4.4 – Person Trips by Mode and Mode Share (inter peak)
Mode Base Scenario F
Do Min
Scenario F Final
Strategy
Scenario 2 Do Min
Scenario 2 Final
Strategy
Scenario 2 Do Min vs
Base
Scenario 2 Final Strategy
vs Base
Scenario 2 Final Strategy vs Scenario F
Final Strategy
2003 2031 2031 2031 2031 2031 v 2003 2031 v 2003 2031 v 2031
Person Trips by Mode
Car 157,614 193,040 185,208 194,235 185,994 23% 18% 0.4%
Bus 10,525 9,433 11,081 9,252 10,913 -12% 4% -1.5%
Rail 2,110 2,736 3,777 2,666 3,788 26% 79% 0.3%
Rapid Transit 0 0 15,632 0 14,849 N/A N/A -5.0%
Park & Ride 401 510 1,703 436 1,611 9% 302% -5.4%
Total 170,651 205,719 217,401 206,589 217,156 21% 27% -0.1%
Mode Share
Car 92.4% 93.8% 85.2% 94.0% 85.7% 2% -7% 0.5%
Bus 6.2% 4.6% 5.1% 4.5% 5.0% -27% -19% -1.4%
Rail 1.2% 1.3% 1.7% 1.3% 1.7% 4% 41% 0.4%
Rapid Transit 0.0% 0.0% 7.2% 0.0% 6.8% N/A N/A -4.9%
Park & Ride 0.2% 0.2% 0.8% 0.2% 0.7% -10% 216% -5.3%

GREATER BRISTOL STRATEGIC TRANSPORT STUDY Spatial Scenarios 1, 2 and 3
5019474 4-10 Spatial Scenario Tests 1-3 v4
Table 4.5 – Highway Vehicle Statistics (inter peak)
Mode Base Scenario F Do Min
Scenario F Final
Strategy
Scenario 2 Do Min
Scenario 2 Final
Strategy
Scenario 2 Do Min vs
Base
Scenario 2 Final Strategy
vs Base
Scenario 2 Final Strategy vs Scenario
F Final Strategy
2003 2031 2031 2031 2031 2031 v 2003 2031 v 2003 2031 v 2031
Vehicle trips 139,360 190,197 183,410 191,977 184,870 38% 33% 0.8%
Vehicle-kilometres 1,643,619 2,498,316 2,386,527 2,458,864 2,353,236 50% 43% -1.4%
Vehicle Hours 29,739 61,199 50,594 60,638 50,330 104% 69% -0.5%
Average Vehicle Speed (km/hr) 55.3 40.8 47.2 40.6 46.8 -27% -15% -0.9%
Mean Journey Length km/vehicle) 11.8 13.1 13.0 12.8 12.7 9% 8% -2.2%
Total Vehicle Delay (Hours) 8,568 29,558 20,650 29,387 20,675 243% 141% 0.1%
Time Lost (seconds/veh km) 18.8 42.6 31.2 43.0 31.6 129% 69% 1.5%

GREATER BRISTOL STRATEGIC TRANSPORT STUDY Spatial Scenarios 1, 2 and 3
5019474 4-11 Spatial Scenario Tests 1-3 v4
4.14 During the inter-peak period there are significant reductions in traffic flow under Scenario 2 compared with Scenario F (Figure 4.3) on the following links:
♦ M4 westbound, east of Junction 19. but particularly between Junctions 18 and 19;
♦ M5 northbound, south of the M4, particularly between Junctions 19 and 17;
♦ A4174 Bristol Ring Road, east of Bristol, particularly between the A4 and Whitchurch (both directions);
♦ the A420 from A46 to the Bristol Ring Road (predominantly westbound); and
♦ the A46 from Batheaston to the junction with the A420 (predominantly northbound).
4.15 No links show comparable levels of traffic flow increases, although it is notable that many more roads in the Bristol urban area do experience a slight growth in traffic flows – more so than with Scenario 1.
4.16 A number of links that were above the 85 percent capacity threshold under Scenario F are brought below with Scenario 2 (see Figure 4.4):
♦ the A46 (both directions) between Upper Swainswick and the A420;
♦ the M5 southbound between Junctions 16 and 17; and
♦ the A420 east of the A4174 Bristol Ring Road.
4.17 However, a number of locations exist where the 85 percent capacity threshold is exceeded under Scenario 2 where they were not under Scenario F. These include:
♦ northbound on the unclassified road between Brislington park and ride site and Broom Hill; and
♦ westbound on the A4174 Bristol Ring Road from the junction with the A4 to the junction with the A37.
♦ two local access roads in the Locking and Hutton areas of Weston-super-Mare; and
♦ various local roads within the Bristol urban area.
4.18 While Scenario 2 with the transport strategy results in large increases in public transport passenger-kilometres compared with the base, passenger-kilometres on all public transport modes are less under Scenario 2 than forecast under Scenario F – an 11.7 percent reduction in rapid transit passenger-kilometres is forecast (Table 4.6).

GREATER BRISTOL STRATEGIC TRANSPORT STUDY Spatial Scenarios 1, 2 and 3
5019474 4-12 Spatial Scenario Tests 1-3 v4
Figure 4.3 – Change in Flow between Scenario F and Scenario 2 (inter peak)

GREATER BRISTOL STRATEGIC TRANSPORT STUDY Spatial Scenarios 1, 2 and 3
5019474 4-13 Spatial Scenario Tests 1-3 v4
Figure 4.4 – Change in Capacity Utilisation between Scenario F and Scenario 2 (inter peak)

GREATER BRISTOL STRATEGIC TRANSPORT STUDY Spatial Scenarios 1, 2 and 3
5019474 4-14 Spatial Scenario Tests 1-3 v4
SCENARIO 3
4.19 Total inter-peak person trips under Scenario 3 with the transport strategy are similar to Scenario F – though variations exist within individual modes: there are 3 to 4 percent less trips on both the park and ride and rapid transit modes (Table 4.7). The transport strategy is successful in reducing the growth in the number of car person trips under Scenario 3 compared with a Do Minimum case, while at the same time enabling a higher overall person trip rate.
4.20 With the transport strategy car mode share under Scenario 3, at 86 percent, is similar to that recorded under Scenario F as well as Scenarios 1 and 2. Rapid transit and park and ride mode shares both fall by around 3 percent compared with Scenario F – less than the reductions noted for Scenarios 1 and 2.
4.21 Compared with Scenario F, and despite the slight increase in vehicle trips (0.2%) even with the transport strategy, there is a slight reduction in vehicle hours (-0.5%) and kilometres (-1.4%) – see Table 4.8. Total vehicle delays also fall very slightly (-0.1%). These results are similar to those reported for Scenario 2.

GREATER BRISTOL STRATEGIC TRANSPORT STUDY Spatial Scenarios 1, 2 and 3
5019474 4-15 Spatial Scenario Tests 1-3 v4
Table 4.6 – Public Transport Passenger-kilometres (inter peak)
Base Scenario F Do Min
Scenario F Final
Strategy
Scenario 2 Do Min
Scenario 2 Final
Strategy
Scenario 2 Do Min vs
Base
Scenario 2 Final Strategy
vs Base
Scenario 2 Final Strategy vs Scenario
F Final Strategy
2003 2031 2031 2031 2031 2031 v 2003 2031 v 2003 2031 v 2031
Bus 74,277 60,409 118,366 57,424 112,593 -23% 52% -4.9%
Rail 284,672 339,387 403,827 338,395 401,688 19% 41% -0.5%
Rapid Transit 0 0 132,727 0 117,222 N/A N/A -11.7%

GREATER BRISTOL STRATEGIC TRANSPORT STUDY Spatial Scenarios 1, 2 and 3
5019474 4-16 Spatial Scenario Tests 1-3 v4
Table 4.7 – Person Trips by Mode and Mode Share (inter peak)
Mode Base Scenario F
Do Min
Scenario F Final
Strategy
Scenario 3 Do Min
Scenario 3 Final
Strategy
Scenario 3 Do Min vs
Base
Scenario 3 Final Strategy
vs Base
Scenario 3 Final Strategy vs Scenario F
Final Strategy
2003 2031 2031 2031 2031 2031 v 2003 2031 v 2003 2031 v 2031
Person Trips by Mode
Car 157,614 193,040 185,208 192,827 184,838 22% 17% -0.2%
Bus 10,525 9,433 11,081 9,203 10,910 -13% 4% -1.5%
Rail 2,110 2,736 3,777 2,698 3,794 28% 80% 0.5%
Rapid Transit 0 0 15,632 0 15,039 N/A N/A -3.8%
Park & Ride 401 510 1,703 465 1,654 16% 312% -2.9%
Total 170,651 205,719 217,401 205,192 216,236 20% 27% -0.5%
Mode Share
Car 92.4% 93.8% 85.2% 94.0% 85.5% 2% -7% 0.3%
Bus 6.2% 4.6% 5.1% 4.5% 5.0% -27% -18% -1.0%
Rail 1.2% 1.3% 1.7% 1.3% 1.8% 6% 42% 1.0%
Rapid Transit 0.0% 0.0% 7.2% 0.0% 7.0% N/A N/A -3.3%
Park & Ride 0.2% 0.2% 0.8% 0.2% 0.8% -4% 225% -2.4%

GREATER BRISTOL STRATEGIC TRANSPORT STUDY Spatial Scenarios 1, 2 and 3
5019474 4-17 Spatial Scenario Tests 1-3 v4
Table 4.8 – Highway Vehicle Statistics (inter peak)
Mode Base Scenario F Do Min
Scenario F Final
Strategy
Scenario 3 Do Min
Scenario 3 Final
Strategy
Scenario 3 Do Min vs
Base
Scenario 3 Final Strategy
vs Base
Scenario 3 Final Strategy vs Scenario
F Final Strategy
2003 2031 2031 2031 2031 2031 v 2003 2031 v 2003 2031 v 2031
Vehicle trips 139,360 190,197 183,410 190,708 183,790 37% 32% 0.2%
Vehicle-kilometres 1,643,619 2,498,316 2,386,527 2,465,659 2,357,593 50% 43% -1.2%
Vehicle Hours 29,739 61,199 50,594 60,689 50,326 104% 69% -0.5%
Average Vehicle Speed (km/hr) 55.3 40.8 47.2 40.6 46.8 -26% -15% -0.7%
Mean Journey Length km/vehicle) 11.8 13.1 13.0 12.9 12.8 10% 9% -1.4%
Total Vehicle Delay (Hours) 8,568 29,558 20,650 29,372 20,639 243% 141% -0.1%
Time Lost (seconds/veh km) 18.8 42.6 31.2 42.9 31.5 129% 68% 1.2%

GREATER BRISTOL STRATEGIC TRANSPORT STUDY Spatial Scenarios 1, 2 and 3
5019474 4-18 Spatial Scenario Tests 1-3 v4
4.22 During the inter-peak period there are significant reductions in traffic flow under Scenario 3 compared with Scenario F (Figure 4.5) on the following links:
♦ M4 westbound, east of Junction 19. but particularly between Junctions 18 and 19;
♦ M5 northbound, south of the M4, particularly between Junctions 19 and 17;
♦ Westbound on the A420 from Chippenham to the Bristol Ring Road;
♦ Northbound on the A46 from Batheaston to the junction with the M4; and
♦ The A4174 Bristol Ring Road from the A37 to the A4 (predominantly northeast bound).
4.23 No links show comparable levels of traffic flow increases, although it is notable that many more roads in the Bristol urban area and in the rural areas within the Bath-Bristol-Weston-super-Mare triangle do experience a slight growth in traffic flows – similar to Scenario 2 and more so than with Scenario 1.
4.24 A number of links that were above the 85 percent capacity threshold under Scenario F are brought below with Scenario 2 (see Figure 4.4):
♦ the southbound A46 between the A420 and Upper Swainswick;
♦ the M5 southbound between Junctions 16 and 17; and
♦ northwest bound along the unclassified road between the B4056 and the A4018 in Southmead.
4.25 However, a number of locations exist where the 85 percent capacity threshold is exceeded under Scenario 3 where they were not under Scenario F. These include:
♦ northbound on the unclassified road between Brislington park and ride site and Broom Hill; and
♦ westbound on the A4174 Bristol Ring Road from the junction with the A4 to the junction with the A37.
♦ southbound on the A4 in the Clifton area of Bristol; and
♦ various local roads within the Bristol urban area.
4.26 To an even greater degree than Scenarios 1 and 2, Scenario 3 with the transport strategy results in large increases in public transport passenger-kilometres compared with the base. However, these remain less than under Scenario F – a 9 percent reduction in rapid transit passenger-kilometres is forecast (Table 4.9).

GREATER BRISTOL STRATEGIC TRANSPORT STUDY Spatial Scenarios 1, 2 and 3
5019474 4-19 Spatial Scenario Tests 1-3 v4
Figure 4.5 – Change in Flow between Scenario F and Scenario 3 (inter peak)

GREATER BRISTOL STRATEGIC TRANSPORT STUDY Spatial Scenarios 1, 2 and 3
5019474 4-20 Spatial Scenario Tests 1-3 v4
Figure 4.6 – Change in Capacity Utilisation between Scenario F and Scenario 3 (inter peak)

GREATER BRISTOL STRATEGIC TRANSPORT STUDY Spatial Scenarios 1, 2 and 3
5019474 4-21 Spatial Scenario Tests 1-3 v4
Table 4.9 – Public Transport Passenger-kilometres (inter peak)
Base Scenario F Do Min
Scenario F Final
Strategy
Scenario 3 Do Min
Scenario 3 Final
Strategy
Scenario 3 Do Min vs
Base
Scenario 3 Final Strategy
vs Base
Scenario 3 Final Strategy vs Scenario
F Final Strategy
2003 2031 2031 2031 2031 2031 v 2003 2031 v 2003 2031 v 2031
Bus 74,277 60,409 118,366 57,911 115,220 -22% 55% -2.7%
Rail 284,672 339,387 403,827 339,656 402,614 19% 41% -0.3%
Rapid Transit 0 0 132,727 0 120,827 N/A N/A -9.0%


GREATER BRISTOL STRATEGIC TRANSPORT STUDY Spatial Scenarios 1, 2 and 3
5019474 5-1 Spatial Scenario Tests 1-3 v4
5. Summary and Conclusions
INTRODUCTION
5.1 The preceding analysis has highlighted a number of impacts from the changed population and employment forecasts for 2031 compared with the earlier Scenario F on which the GBSTS transport strategy was based. The main changes between Scenarios 1 to 3 and Scenario F in 2031 are summarised below.
SCENARIO 1
♦ similar number of additional dwellings (134,800) compared with Scenario F (138,700), but a lower population rise (160,300 in Scenario 1 against 221,500 in Scenario F) reflecting changing assumptions about dwelling and household sizes;
♦ there is an increased concentration of population in existing urban areas, particularly south, north west and east Bristol, Bath and Bathavon;
♦ the corresponding decrease in population growth occurs in the North Fringe and in rural areas between Bristol and Weston-super-Mare;
♦ there is significant employment growth of 159,300 compared with 87,900 in Scenario F;
♦ distribution of employment growth shows an emphasis in the existing urban areas of Bristol (central and north west), North Fringe and Bath;
♦ within an overall 3.4% growth in the number of person trips, between Scenarios F and 1, the number of car and bus based trips are broadly in line with the overall trend while rail shows a much higher level of growth and park and ride shows a small decline – these outputs from the model include an element of trip suppression where the capacity of the transport system (highway and public transport) restricts the ability to make journeys;
♦ although there is a growth in the volume of car trips, the 6.7% rise on delays produces a static level of vehicle-kms and a 3.4% fall in vehicle speeds;
♦ a higher proportion of the road network is operating at above 85% utilisation, with the main deterioration occurring on local rather than strategic roads;
♦ the changes in traffic patterns produce a change in flows on the road network, with reductions occurring:
- significant reductions on M4 eastbound between J20 and J17, - moderate reduction on M5 southbound from J17 to J22, - moderate reduction on M5 northbound from J17 to J14, - moderate reduction on the clockwise A4174 Avon Ring Road in the east of
Bristol from Filton to A37 including on the proposed GBSTS extension to the existing road in the Whitchurch area,
- moderate reduction on M32 in each direction, - moderate reduction on A46 southbound from M4 J18 to Bath, - moderate reduction on local roads in the Avonmouth and Cribbs Causeway
areas.
♦ increases in the highway flows between Scenario F and 1 occur:

GREATER BRISTOL STRATEGIC TRANSPORT STUDY Spatial Scenarios 1, 2 and 3
5019474 5-2 Spatial Scenario Tests 1-3 v4
- moderate increase on M4 westbound between J19 and J17, - slight increase on M5 between J22 and J19, - moderate increase on A46 northbound between Bristol and M4, - moderate increase on A38 between BIA and south Bristol, - moderate increases on local roads across south and east Bristol
♦ there are some significant increases in the journey times for individual journeys across the study area, including Bath to Bristol (9.6%), Keynsham to Bristol (14.4%), Thornbury to Filton (9.3%) and Bristol city centre to BIA (7.6%)
♦ although the number of trips by rail was shown to rise by 6.4%, the overall growth in rail passenger-kms is just 3.7% suggesting a shortening of journeys by rail while at the same time the level of crowding on rail increases by 13%;
SCENARIO 2
♦ an increase in the number of additional dwellings (159,800) compared with Scenario F (138,700), but a slightly lower population rise (212,600 in Scenario 2 against 221,500 in Scenario F) reflecting changing assumptions about dwelling and household sizes;
♦ growth is more concentrated within, and in extensions to, the existing urban areas of Bristol and Bath and extensions to Weston-super-Mare;
♦ at the same time there is reduced development in the North Fringe together with rural parts of the sub-region;
♦ there is significant employment growth of 189,200 compared with 87,900 with Scenario F;
♦ distribution of employment growth shows an emphasis in the existing urban areas of Bristol (central and north west), North Fringe and Bath
♦ the overall growth of 2.8% is slightly below the level of 3.6% for Scenario 1 despite a higher level of employment – this reflects an increased level of containment in areas such as Weston-super-Mare and Bath with residents being more likely to work locally and hence reduce the need for longer distance commuting within the sub-region. This is confirmed by the slight reductions in the volume of rail and park and ride trips in Scenario 2 compared with Scenario F while car travel shows an increase of 3.6%, in line with Scenario 1.
♦ although the growth in the volume of car trips and the reduction in average journey length is in line with Scenario 1, there are negligible changes in delay, implying that the growth in traffic is on relatively uncongested roads;
♦ the changes in traffic patterns produce a change in flows on the road network in line with Scenario 1, with reductions occurring:
- significant reductions on M4 eastbound between J20 and J17, - moderate reduction on M5 southbound from J17 to J22, - moderate reduction on M5 northbound from J17 to J14, - moderate reduction on the clockwise A4174 Avon Ring Road in the east of
Bristol from Filton to A37 including proposed GBSTS extension to the existing road in the Whitchurch area,
- moderate reduction on M32 in each direction, - moderate reduction on A46 southbound from M4 J18 to Bath, - moderate reduction on local roads in the Avonmouth and Cribbs Causeway
areas.

GREATER BRISTOL STRATEGIC TRANSPORT STUDY Spatial Scenarios 1, 2 and 3
5019474 5-3 Spatial Scenario Tests 1-3 v4
♦ increases in the highway flows between Scenario F and 2 occur;
- moderate increase on M4 westbound between J20 and J17, - slight increase on M5 between J22 and J19, - moderate increase on A46 northbound between Bristol and M4, - moderate increase on A38 between BIA and south Bristol, - significant increases on local roads across south and east Bristol, - significant increases on the local roads in the Weston-super-Mare area
♦ there are some significant increases in journey times on the morning peak highway network between Scenarios F and 2, including:
- Bath to Bristol (12.0%) - Weston-super-Mare to Bristol (7.2%) - Keynsham to Bristol (13.5%) - BIA to Bristol (9.1%)
♦ there is a significant reduction in the use of public transport between Scenarios F and 2, falls in passenger-kms for bus (4.2%), rail (0.7%) and rapid transit (6.3%) and a large improvement in passenger crowding (28%).
SCENARIO 3
♦ the increase in the number of additional dwellings (159,600) is greater than with Scenario F (138,700) and similar to Scenario 2 (159,800). The rise in population (212,900) in Scenario 3 is still less than that used in Scenario F (221,500), reflecting changing assumptions about dwelling and household sizes;
♦ growth is more concentrated within, and in extensions to, the existing urban areas of Bristol and Bath than under Scenario F. Compared with Scenarios 1 and 2, Scenario 3 is based on less development in and around Weston, with the dwellings reallocated to Bath and South Bristol urban extensions;
♦ at the same time, compared with Scenario F, there is reduced development in the North Fringe together with rural parts of the sub-region;
♦ there is significant employment growth from the base of 159,400 compared with 87,900 with Scenario F. This is almost identical to Scenario 1 but less than Scenario 2 (189,200);
♦ distribution of employment growth is similar to Scenario 1, but with greater emphasis on the Bristol and Bath urban extensions. The planned growth in employment included in Scenario 1 for Weston-super-Mare continues through to Scenario 3;
♦ the overall growth in trips per person of 1.6% over Scenario F is less than that recorded under Scenarios 1 (3.6%) despite the similar level of employment and higher level of housing in Scenario 3. The growth in trips per person is also lower than in Scenario 2 (2.8%) though this will be influenced by the reduced employment levels in Scenario 3 compared with Scenario 2. At a modal level Scenario 3 sees a reduction (7.8%) in P&R trips and a 2% increase in rapid transit trips compared with Scenario F, potentially reflecting an internalisation of trips within Bristol and Bath, and less commuting from rural areas and Weston-super-Mare.
♦ The forecast increases in vehicle trips, kilometres and hours under Scenario 3 are the same or slightly less than those described for Scenarios 1 and 2, while delays are reduced. This implies that Scenario 3 is more efficient in highway terms;

GREATER BRISTOL STRATEGIC TRANSPORT STUDY Spatial Scenarios 1, 2 and 3
5019474 5-4 Spatial Scenario Tests 1-3 v4
♦ the changes in traffic patterns produce changes in flows on the road network similar to those reported for Scenarios 1 and 2, with reductions occurring:
− eastbound on the M4 between Junction 20 and Junction 17;
− northbound on the M5 from Junction 21 to Junction 18 and between junctions 17 and 15; and
− southbound on the M5 from Junction 17 to Junction 18;
♦ The reduction in development in the Weston-super-Mare area also results in reduced flows eastbound on the A368 through Banwell and northbound on the A38 from the M5 to South Bristol.
♦ increases in the highway flows between Scenario F and 3 occur on;
− the M4 westbound between Junction 20 and Junction 17;
− various local roads in Bristol, particularly to the south and east; and
− South and west bound on the A38 and A368 from Bristol International Airport to Weston-super-Mare;
♦ Scenario 3 does not result in the same increase in vehicles around Weston-super-Mare as reported in Scenario 2, or the M5 northbound increases seen in both Scenarios 1 and 2;
♦ there are some significant changes in journey times in the morning peak highway network between the base case and Scenario 3, including:
− Bristol City Centre to Bath (+27%);
− Bristol Airport to Weston-super-Mare (+20%);
− Bristol City Centre to Filton (-23%); and
− Yate to Filton (+25%).
♦ As with Scenario 2 there is a significant reduction in the use of public transport between Scenarios F and 3; falls in passenger-kms for bus (4.5%), rail (1.1%) and rapid transit (5.5%) and a large reduction (30%) in rail passenger crowding.

GREATER BRISTOL STRATEGIC TRANSPORT STUDY Spatial Scenarios 1, 2 and 3
5019474 Spatial Scenario Tests 1-3 v4
Appendix A
Development of Dwelling and Employment Scenarios


GREATER BRISTOL STRATEGIC TRANSPORT STUDY Spatial Scenarios 1, 2 and 3
5019474 Spatial Scenario Tests 1-3 v4
Table A.1 – Scenario 1 Dwellings 2001-2031
Location Dwellings 2001-2006
(see note 1)
Dwellings 2006-2026
(see note 2)
Dwellings 2026-2031
(see note 3)
Dwellings 2001-2031
Assigned to GBSTS zones
Bristol Urban Area (Bristol) 8,163 26,500 6,625 41,288 pro rata basis based on number of dwellings at 2001 Bristol Urban Area (S.Glos) 2,260 13,000 3,250 18,510 pro rata basis based on number of dwellings at 2001
Area of Search A 19 10,500 2,625 13,144 shared equally between zones 393,394 and 395 (except for period 2001-2006 which was assigned on pro rata basis)
Area of Search B 10 6,000 1,500 7,510 shared equally between zones 191 and 192 (except for period 2001-2006 which was assigned on pro-rata basis)
Area of Search C 35 2,000 500 2,535 to a single zone (zone 427)
Area of Search D 84 6,000 1,500 7,584 shared equally between zones 421 and 494 (except for period 2001-2006 which was assigned on pro rata basis)
Bath Urban Area 722 6,000 1,500 8,222 pro rata basis based on number of dwellings at 2001 Area of Search E 14 1,500 375 1,889 to a single zone (zone 103) Weston Urban Area 1,968 3,000 750 5,718 pro rata basis based on number of dwellings at 2001
Area of Search F 486 9,000 2,250 11,736 shared equally between zones 306 and 313 (except for period 2001-2006 which was assigned on pro rata basis)
Elsewhere (B&NES) 645 2,000 500 3,145 pro-rata basis based on number of dwellings at 2001 Elsewhere (N.Soms 3,271 5,000 1,250 9,521 pro-rata basis based on number of dwellings at 2001 Elsewhere (S.Glos 1,448 2,000 500 3,948 pro-rata basis based on number of dwellings at 2001 Total 19,125 92,500 23,125 134,750
(1) The number of dwellings for 2001-2006 was derived from completions data provided by SWRA at a district level which were assigned to the GBSTS zones on a pro-rata basis based on the number of dwellings in each zone at 2001.
B&NES - 1,391 Bristol - 8,163 N.Somerset - 5,744 S.Glos - 3,828 Total – 19,126
(2) The dwellings for 2006- 2026 were derived from policies SR4-SR6 with an additional of Draft RSS. (3) The rate of growth in each Zone between 2006-2026 was annualised and projected for a further five years to obtain an estimate for the period 2026-2031 (total 23,143).

GREATER BRISTOL STRATEGIC TRANSPORT STUDY Spatial Scenarios 1, 2 and 3
5019474 Spatial Scenario Tests 1-3 v4
Table A.2 – Scenario 2 Dwellings 2001-2031
Location Dwellings 2001-2006
(see note 1)
Dwellings 2006-2026
(see note 2)
Dwellings 2026-2031
Dwellings 2001-2031
Assigned to GBSTS zones
Bristol Urban Area (Bristol) 8,163 32,247 8,062 48,472 pro-rata basis based on number of dwellings at 2001 Bristol Urban Area (S.Glos) 2,260 15,819 3,955 22,034 pro-rata basis based on number of dwellings at 2001
Area of Search A 19 12,777 3,194 15,990 shared equally between zones 393,394 and 395 (except for period 2001-2006 which was assigned on pro-rata basis)
Area of Search B 10 7,301 1,825 9,136 shared equally between zones 191 and 192 (except for period 2001-2006 which was assigned on pro-rata basis)
Area of Search C 35 2,434 608 3,077 to a single zone
Area of Search D 84 7,301 1,825 9,210 shared equally between zones 421 and 494 (except for period 2001-2006 which was assigned on pro-rata basis)
Bath Urban Area 722 7,301 1,825 9,848 pro-rata basis based on number of dwellings at 2001 Area of Search E 14 1,825 456 2,295 to a single zone Weston Urban Area 1,968 3,651 913 6,532 pro-rata basis based on number of dwellings at 2001
Area of Search F 486 10,952 2,738 14,176 shared equally between zones 306 and 313 (except for period 2001-2006 which was assigned on pro-rata basis)
Elsewhere (B&NES) 645 2,434 608 3,687 pro-rata basis based on number of dwellings at 2001 Elsewhere (N.Soms) 3,271 6,084 1,521 10,876 pro-rata basis based on number of dwellings at 2001 Elsewhere (S.Glos) 1,448 2,434 608 4,490 pro-rata basis based on number of dwellings at 2001 Total 19,125 112,560 28,138 159,823
(1) The number of dwellings for 2001-2006 was derived from completions data provided by SWRA at a district level and were assigned to the GBSTS zones on a pro-rata basis based on the number of dwellings in each zone at 2001.
B&NES - 1,391 Bristol - 8,163 N. Somerset - 5,744 S. Glos - 3,828
(2) This is based on the additional 5,000 dwellings per annum across the south west region identified by the South West Regional Assembly's analysis of the 2003 based revised household projections. A request by the SWRA for advice from strategic authorities of the implications of this growth was issued in October 2006. This request asked for advice on four scenarios including one that distributes the additional growth on pro rata distribution based on the draft RSS allocations. Based on advice from SWRA this level of development would equate to a 5,628 dwellings per annum in the sub-region. This growth was on pro rata distribution based on the draft RSS allocations. (3) The rate of growth in each Zone between 2006-2026 was annualised and projected for a further five years to obtain an estimate for the period 2026-2031.

GREATER BRISTOL STRATEGIC TRANSPORT STUDY Spatial Scenarios 1, 2 and 3
5019474 Spatial Scenario Tests 1-3 v4
Table A.3 – Scenario 3 Dwellings 2001-2031
Location Dwellings 2001-2006
(see note 1)
Dwellings 2006-2026
(see note 2)
Dwellings 2026-2031
Dwellings 2001-2031
Assigned to GBSTS zones
Bristol Urban Area (Bristol) 8,163 32,247 8,062 48,472 pro-rata basis based on number of dwellings at 2001 Bristol Urban Area (S.Glos) 2,260 15,819 3,955 22,034 pro-rata basis based on number of dwellings at 2001
Area of Search A 19 16,428 4,107 20,554 shared equally between zones 393,394 and 395 (except for period 2001-2006 which was assigned on pro-rata basis)
Area of Search B 10 9,734 2,434 12,178 shared equally between zones 191 and 192 (except for period 2001-2006 which was assigned on pro-rata basis)
Area of Search C 35 3,651 913 4,599 to a single zone
Area of Search D 84 9,734 2,434 12,252 shared equally between zones 421 and 494 (except for period 2001-2006 which was assigned on pro-rata basis)
Bath Urban Area 722 7,301 1,825 9,848 pro-rata basis based on number of dwellings at 2001 Area of Search E 14 3,042 761 3,817 to a single zone Weston Urban Area 1,968 3,651 913 6,532 pro-rata basis based on number of dwellings at 2001
Area of Search F 486 0 0 486 shared equally between zones 306 and 313 (except for period 2001-2006 which was assigned on pro-rata basis)
Elsewhere (B&NES) 645 2,434 608 3,687 pro-rata basis based on number of dwellings at 2001 Elsewhere (N.Soms) 3,271 6,084 1,521 10,876 pro-rata basis based on number of dwellings at 2001 Elsewhere (S.Glos) 1,448 2,434 608 4,490 pro-rata basis based on number of dwellings at 2001 Total 19,125 112,559 28,141 159,825
(1) The number of dwellings for 2001-2006 was derived from completions data provided by SWRA at a district level and were assigned to the GBSTS zones on a pro-rata basis based on the number of dwellings in each zone at 2001.
B&NES - 1,391 Bristol - 8,163 N. Somerset - 5,744 S. Glos - 3,828
(2) This is based on the additional 5,000 dwellings per annum across the south west region identified by the South West Regional Assembly's analysis of the 2003 based revised household projections. A request by the SWRA for advice from strategic authorities of the implications of this growth was issued in October 2006. This request asked for advice on four scenario’s including one that distributes the additional growth on pro rata distribution based on the draft RSS allocations. Based on advice from SWRA this level of development would equate to a 5,628 dwellings per annum in the sub-region. This growth was on pro rata distribution based on the draft RSS allocations (except for Area of Search F where this development was shared equally between Area of Search A-E in order to achieve greater alignment between jobs and homes in the sub region). (3) The rate of growth in each Zone between 2006-2026 was annualised and projected for a further five years to obtain an estimation for the period 2026-2031.

GREATER BRISTOL STRATEGIC TRANSPORT STUDY Spatial Scenarios 1, 2 and 3
5019474 Spatial Scenario Tests 1-3 v4
Employment - Scenario 1 Bristol - Policy SR4 of Draft RSS sets out provision for 92,000 jobs for the period 2006-2026 (4,600 per annum). In Scenarios 1 and 3 this level of growth was assumed for both 2001-2006 and 2026-2031 and that 95% of the jobs in the Bristol Travel to Work Area (TTWA) were in Greater Bristol Sub Region. This resulted in a need to test 131,100 jobs in the Bristol TTWA in the sub-region for the period 2001-2031 for Scenario 1 and 3. It was distributed as follows: Table A.4 – Employment for Scenarios 1 and 3 (Bristol) Location Jobs Assigned to GBSTS zones Area of Search A 4,000 shared equally between zones 393,394 and 395
Area of Search B 4,000 shared equally between zones 191 and 192
Area of Search C 3,500 to a single zone (zone 427)
Area of Search D 3,500 shared equally between zones 421 and 494
Bristol International Airport 4,000 to a single zone (zone 321)
Remainder of Bristol TTWA in Sub Region 112,100 pro-rata basis based on number of jobs at 2001 Total 131,100
Bath - Policy SR5 of Draft RSS sets out provision for 16,000 - 20,200 jobs for the period 2006-2026 (1,010 per annum). In Scenarios 1 and 3 this level of growth was assumed for both 2001-2006 and 2026-2031 and that 70% of the jobs in the Bath TTWA were in Greater Bristol Sub Region. This resulted in a need to test 21,210 jobs in the Bath TTWA for the period 2001-2031 for Scenarios 1 and 3. It was distributed as follows: Table A.5 – Employment for Scenarios 1 and 3 (Bath) Location Jobs Assigned to GBSTS zones Area of Search E 500 to a single zone (zone 103)
Remainder of Bath TTWA in Sub Region 20,710 pro-rata basis based on number of jobs at 2001 Total 21,210

GREATER BRISTOL STRATEGIC TRANSPORT STUDY Spatial Scenarios 1, 2 and 3
5019474 Spatial Scenario Tests 1-3 v4
Weston-super-Mare - Policy SR6 of Draft RSS sets out provision for 8,500 -10,000 jobs for the period 2006-2026 (500 per annum). In Scenarios 1 and 3 this level of growth was assumed for both 2001-2006 and 2026-2031 and that 95% of the Jobs in the Weston TTWA were in Greater Bristol Sub Region. This resulted in a need to test 14,250 jobs in the Weston TTWA for the period 2001-2031 for Scenarios 1 and 3. It was distributed as follows: Table A.6 – Employment for Scenarios 1 and 3 (Weston-super-Mare) Location Jobs Assigned to GBSTS zones Area of Search F 8,000 shared equally between zones 306 and 313
Remainder of Weston TTWA in Sub Region 6,250 pro-rata basis based on number of jobs at 2001 Total 14,250
Employment - Scenario 2 In order to assist the Panel conducting the South West Examination in Public (EiP) and respond to the issues raised in their notes 1 & 3, scenario 2 (higher level growth scenario) tested the impact of an additional 30,000 jobs to scenario 1. The 30,000 jobs figure was based on advice from the SWRDA, who concluded that 1,000 jobs per annum would be needed in the sub-region if the level of housing growth outlined in scenario 2 was achieved. This level of job growth would result in a total of 196,560 jobs in the period 2001-2031. This growth was distributed on following basis:- Table A.7 – Employment for Scenario 2 Location Jobs Assigned to GBSTS zones Area of Search A 8,720 shared equally between zones 393,394 and 395 Area of Search B 7,720 shared equally between zones 191 and 192 Area of Search C 7,630 to a single zone (zone 427)
Area of Search D 7,630 shared equally between zones 421 and 494 Bristol International Airport 4,000 to a single zone (zone 321)
Bristol Urban Area (Bristol & S.Glos) 94,142 pro-rata basis based on number of jobs at 2001 Remainder of Bristol TTWA in Sub Region 23,958 pro-rata basis based on number of jobs at 2001
Area of Search E 500 to a single zone (zone 103)
Remainder of Bath TTWA in Sub Region 20,710 pro-rata basis based on number of jobs at 2001
Area of Search F 15,300 shared equally between zones 306 and 313 Remainder of Weston TTWA in Sub Region 6,250 pro-rata basis based on number of jobs at 2001 Total 196,560


GREATER BRISTOL STRATEGIC TRANSPORT STUDY Spatial Scenarios 1, 2 and 3
5019474 Spatial Scenario Tests 1-3 v4
Appendix B
Summary of Dwelling and Employment Scenarios


GREATER BRISTOL STRATEGIC TRANSPORT STUDY Spatial Scenarios 1, 2 and 3
5019474 Spatial Scenario Tests 1-3 v4
Additional Dwellings & Jobs
Scenario 1 Scenario 2 Scenario 3
Dwellings Jobs Dwellings Jobs Dwellings Jobs
Bristol Urban Area 59,798 88,142 70,506 94,142 70,506 88,142
Area of Search A 13,144 4,000 15,991 8,720 20,554 4,000
Area of Search B 7,510 4,000 9,136 7,720 12,179 4,000
Area of Search C 2,535 3,500 3,078 7,630 4,599 3,500
Area of Search D 7,584 3,500 9,210 7,630 12,253 3,500
Bristol SSCT Sub Total 90,572 103,142 107,921 125,842 120,090 103,142
Bath Urban Area 8,240 15,580 9,848 15,580 9,848 15,580
Area of Search E 1,889 500 2,296 500 3,817 500
Bath SSCT Sub Total 10,129 16,080 12,144 16,080 13,665 16,080
Weston Urban Area 5,718 4,839 6,531 4,839 6,531 4,839
Area of Search F 11,736 8,000 14,176 15,300 486 8,000
Weston SSCT Sub Total 17,454 12,839 20,707 20,139 7,017 12,839
Elsewhere (inc BIA) 16,614 34,499 19,054 34,499 19,054 34,499
Total 134,769 166,560 159,826 196,560 159,826 166,560

GREATER BRISTOL STRATEGIC TRANSPORT STUDY Spatial Scenarios 1, 2 and 3
5019474 Spatial Scenario Tests 1-3 v4
Percentage Distribution of Dwellings & Jobs
2001 Baseline Scenario 1 @2031 Scenario 2 @ 2031 Scenario 3 @ 2031
Dwellings Jobs Dwellings Jobs Dwellings Jobs Dwellings Jobs
Bristol Urban Area 53.5% 60.5% 51.3% 58.6% 50.9% 56.9% 50.9% 58.6%
Area of Search A 0.1% 0.0% 2.4% 0.6% 2.8% 1.3% 3.6% 0.6%
Area of Search B 0.1% 0.2% 1.4% 0.7% 1.7% 1.2% 2.2% 0.7%
Area of Search C 0.2% 0.8% 0.6% 1.1% 0.7% 1.6% 0.9% 1.1%
Area of Search D 0.5% 0.5% 1.8% 0.9% 2.0% 1.5% 2.5% 0.9%
Bristol SSCT Sub Total 54.4% 62.0% 57.5% 62.0% 58.0% 62.6% 60.1% 62.0%
Bath Urban Area 8.9% 10.4% 8.3% 10.2% 8.2% 9.7% 8.2% 10.2%
Area of Search E 0.2% 0.1% 0.5% 0.2% 0.5% 0.2% 0.8% 0.2%
Bath SSCT Sub Total 9.1% 10.6% 8.7% 10.3% 8.7% 9.9% 9.0% 10.3%
Weston Urban Area 6.7% 4.9% 6.1% 4.4% 6.0% 4.2% 6.0% 4.4%
Area of Search F 1.6% 1.0% 3.3% 2.0% 3.6% 2.9% 1.3% 2.0% Weston SSCT Sub Total 8.3% 5.9% 9.4% 6.3% 9.6% 7.1% 7.2% 6.3%
Elsewhere (inc BIA) 28.2% 21.5% 24.3% 21.3% 23.7% 20.4% 23.7% 21.3%
Total 100.0% 100.0% 100.0% 100.0% 100.0% 100.0% 100.0% 100.0%

GREATER BRISTOL STRATEGIC TRANSPORT STUDY Spatial Scenarios 1, 2 and 3
5019474 Spatial Scenario Tests 1-3 v4
Overall Dwellings & Jobs
Scenario 1 @2031 Scenario 2 @ 2031 Scenario 3 @ 2031
Dwellings Jobs Dwellings Jobs Dwellings Jobs Dwellings Jobs
Bristol Urban Area 227,174 300,541 286,972 388,683 297,680 394,683 297,680 388,683
Area of Search A 280 167 13,424 4,167 16,271 8,887 20,834 4,167
Area of Search B 524 813 8,034 4,813 9,660 8,533 12,703 4,813
Area of Search C 943 3,801 3,478 7,301 4,021 11,431 5,542 7,301
Area of Search D 2,239 2,719 9,823 6,219 11,449 10,349 14,492 6,219
Bristol SSCT Sub Total 231,160 308,041 321,732 411,183 339,081 433,883 351,250 411,183
Bath Urban Area 38,000 51,831 46,240 67,411 47,848 67,411 47,848 67,411
Area of Search E 748 588 2,637 1,088 3,044 1,088 4,565 1,088
Bath SSCT Sub Total 38,748 52,419 48,877 68,499 50,892 68,499 52,413 68,499
Weston Urban Area 28,276 24,088 33,994 28,927 34,807 28,927 34,807 28,927
Area of Search F 6,987 5,085 18,723 13,085 21,163 20,385 7,473 13,085 Weston SSCT Sub Total 35,263 29,173 52,717 42,012 55,970 49,312 42,280 42,012
Elsewhere (inc BIA) 119,579 106,915 136,193 141,414 138,633 141,414 138,633 141,414
Total 424,750 496,548 559,519 663,108 584,576 693,108 584,576 663,108