spatial distribution and speciation of arsenic in peat...
TRANSCRIPT
Spatial Distribution and Speciation of Arsenic in Peat Studied withMicrofocused X‑ray Fluorescence Spectrometry and X‑rayAbsorption SpectroscopyPeggy Langner,† Christian Mikutta,*,† Elke Suess,† Matthew A. Marcus,‡ and Ruben Kretzschmar†
†Institute of Biogeochemistry and Pollutant Dynamics, Department of Environmental Systems Science, ETH Zurich, 8092 Zurich,Switzerland‡Advanced Light Source, Lawrence Berkeley National Laboratory, 1 Cyclotron Road, Berkeley, California 94720, United States
*S Supporting Information
ABSTRACT: Arsenic binding by sulfhydryl groups of natural organic matter(NOM) was recently identified as an important As sequestration pathway inthe naturally As-enriched minerotrophic peatland Gola di Lago, Switzerland.Here, we explore the microscale distribution, elemental correlations, andchemical speciation of As in the Gola di Lago peat. Thin sections ofundisturbed peat samples from 0−37 cm and 200−249 cm depth wereanalyzed by synchrotron microfocused X-ray fluorescence (μ-XRF) spectrom-etry and X-ray absorption spectroscopy (μ-XAS). Additionally, peat sampleswere studied by bulk As, Fe, and S K-edge XAS. Micro-XRF analyses showedthat As in the near-surface peat was mainly concentrated in 10−50 μm sizedhotspots, identified by μ-XAS as realgar (α-As4S4). In the deep peat layersamples, however, As was more diffusely distributed and mostly associatedwith particulate NOM of varying decomposition stages. The NOM-associatedAs was present as trivalent As bound by sulfhydryl groups. Arsenopyrite(FeAsS) and arsenian pyrite (FeAsxS2−x) of <25 μm size, which have escapeddetection by bulk As and Fe K-edge XAS, were found as minor As species inthe peat. Bulk S K-edge XAS revealed that the deep peat layers were significantly enriched in reduced organic S species. Ourfindings suggest an authigenic formation of realgar and arsenopyrite in strongly reducing microenvironments of the peat andindicate that As(III)−NOM complexes are formed by the passive sorption of As(III) to NOM. This reaction appears to befavored by a combination of abundant reduced organic S and comparatively low As solution concentrations preventing theformation of secondary As-bearing sulfides.
■ INTRODUCTION
Wetland soils are sensitive ecosystems that play an importantrole in the storage, transformation, and mobilization ofnutrients and contaminants. Besides natural sources, anthro-pogenic emissions from mining and smelting, fossil fuelcombustion and agriculture have led to the accumulation oftoxic trace elements like As in a number of wetland soils andpeaty sediments which may pose a continuing risk for surfaceand groundwater quality as well as ecosystem health.1−4
Arsenic is a redox-sensitive element whose toxicity and fate inthe environment strongly depends on its oxidation state andspeciation.5 Inorganic As commonly comprises arsenate, As(V),in oxic, and the more toxic arsenite, As(III), in anoxicenvironments low in S.5 In aerated soils and sediments,As(V) has a strong affinity toward mineral surfaces, rendering itcomparatively immobile.5−8 In O2 depleted soils and sediments,microbial decomposition of natural organic matter (NOM)drives the reductive dissolution of metal-(hydr)oxides and thusthe release of associated As(V) and its redox transformationinto As(III).9,10 The released As(III) may subsequently be
immobilized by Fe sulfides11,12 or mixed valence metal-(hydr)oxides,13,14 or precipitate as As sulfide.2,15,16 In addition,several studies provided indirect evidence for an association ofAs with NOM under reducing conditions,1,9,17−19 butspectroscopic assessments of the governing binding mecha-nisms and their environmental relevance are still scarce. In arecent bulk X-ray absorption spectroscopy (XAS) study on thesolid-phase speciation of As in a naturally As-enriched (≤1800mg As kg−1), slightly acidic minerotrophic peatland (Gola diLago, Switzerland), we observed that in deep peat layers (150−250 cm) As was predominantly sequestered by NOM in itstrivalent oxidation state (“As(III)−NOM complexes”). Shell-fitanalyses of As K-edge extended X-ray absorption fine structure(EXAFS) spectra of these samples revealed S coordinationnumbers of 2−3 and interatomic As−S distances of 2.26 Å,
Received: March 25, 2013Revised: July 18, 2013Accepted: July 26, 2013Published: July 26, 2013
Article
pubs.acs.org/est
© 2013 American Chemical Society 9706 dx.doi.org/10.1021/es401315e | Environ. Sci. Technol. 2013, 47, 9706−9714
values typical of inner-sphere As(III) complexes with sulfhydrylgroups.20 In contrast to the deep peat layers, near-surface peatsamples (0−41 cm) showed a variety of As species, includingrealgar (α-As4S4), As(III/V) sorbed to Fe(III)-(hydr)oxides,and As(III)−NOM complexes. These two contrasting Asspeciation patterns suggest fundamental differences in thedistribution of As within the peat. While bulk As K-edge XASanalyses yield information about the average coordinationenvironment of As, they do not provide information on itsspatial distribution, elemental correlations, and chemicalspeciation at the microscale. Bulk XAS analyses may also failto detect minor As species having a potentially highgeochemical activity. Here, we employed microfocused X-rayfluorescence (μ-XRF) spectrometry in combination withmicrofocused XAS (μ-XAS) to investigate the spatialdistribution, elemental correlations, and speciation of As inthe Gola di Lago peatland. These techniques have previouslybeen used to investigate the distribution and to some extent thespeciation of As in plant roots as well as As-rich soils andsediments.12,21−25 Hitherto, spatially resolved information onAs distribution and speciation in NOM-dominated soils andsediments subject to permanent or periodic water-logging iscurrently not available but may provide new insights intogeochemical conditions favoring particular As sequestrationpathways.The overall goal of this study was thus to provide the first
information on the microscale distribution and speciation of Asin a NOM-rich soil environment characterized by substantialdifferences in As speciation. More specifically, we used μ-XRF
spectrometry and μ-XAS (i) to investigate the size anddistribution of As sulfide minerals in the uppermost peat layersof the Gola di Lago site, (ii) to assess the distribution pattern ofAs(III)−NOM complexes in the deep peat layers, and (iii) toidentify minor As species.
■ MATERIALS AND METHODSField Site and Sampling. In a preceding study, we
sampled peat cores at locations B1−8 close to an As-richintermittent stream of the minerotrophic peatland Gola di Lago(canton Ticino, Switzerland) and analyzed the solid-phasespeciation of As and Fe by bulk XAS.20 In September 2009, wecollected two additional peat cores less than 25 cm away fromeach of the initial sampling locations B1, B3, and B5.20 Thesetwo peat cores are labeled “I” and “II” in the following.Undisturbed peat material was sampled in ∼25 cm intervalsusing Kubiena boxes made of bladed Al (8 cm × 6 cm × 5 cm).The boxes and all samples used for bulk speciation measure-ments of S were instantly shock-frozen in liquid N2, transportedon dry ice to the laboratory, and processed in an anoxicglovebox (O2 <10 ppm). Additional material of each peatsample was used for general sample characterization asdescribed in ref 20. Redox potential, pH, and electricalconductivity of the field-moist, mostly water-saturated peatsamples were immediately measured on-site.
Sample Preparation and Synchrotron Measurements.On the basis of the elemental composition and previous resultsfrom bulk As and Fe XAS analyses,20 four samples wereselected for the preparation of thin sections as well as for bulk
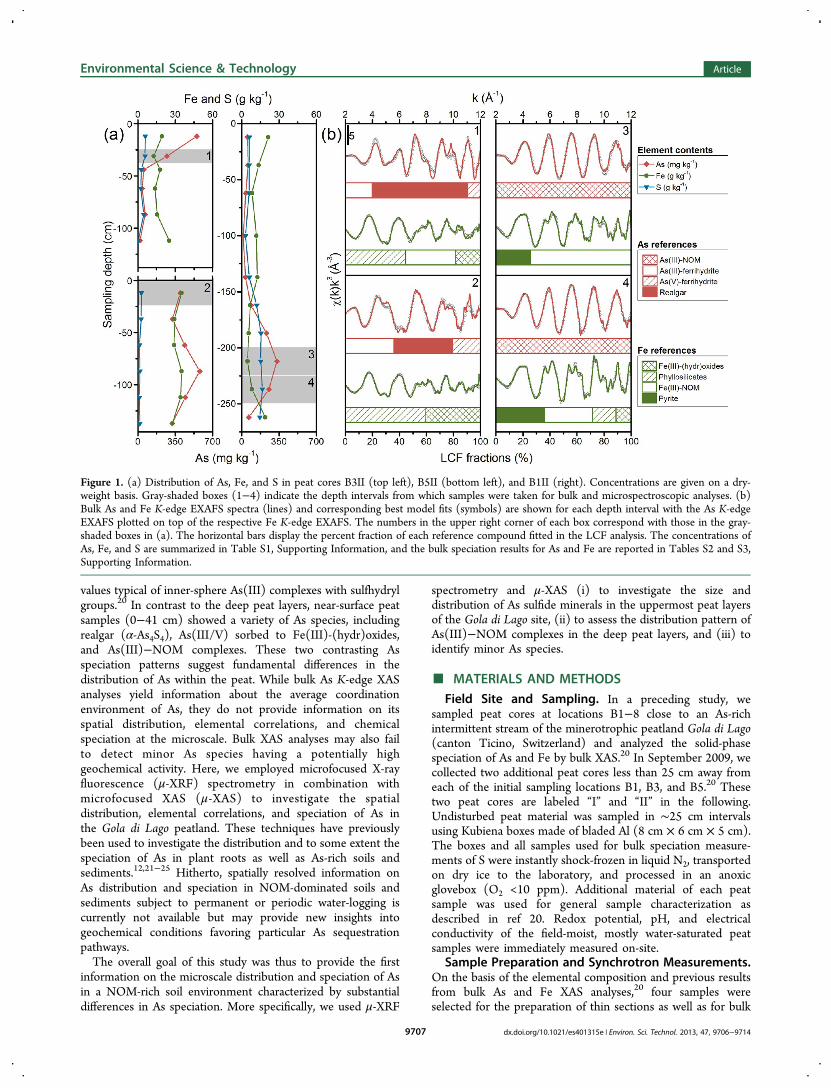
Figure 1. (a) Distribution of As, Fe, and S in peat cores B3II (top left), B5II (bottom left), and B1II (right). Concentrations are given on a dry-weight basis. Gray-shaded boxes (1−4) indicate the depth intervals from which samples were taken for bulk and microspectroscopic analyses. (b)Bulk As and Fe K-edge EXAFS spectra (lines) and corresponding best model fits (symbols) are shown for each depth interval with the As K-edgeEXAFS plotted on top of the respective Fe K-edge EXAFS. The numbers in the upper right corner of each box correspond with those in the gray-shaded boxes in (a). The horizontal bars display the percent fraction of each reference compound fitted in the LCF analysis. The concentrations ofAs, Fe, and S are summarized in Table S1, Supporting Information, and the bulk speciation results for As and Fe are reported in Tables S2 and S3,Supporting Information.
Environmental Science & Technology Article
dx.doi.org/10.1021/es401315e | Environ. Sci. Technol. 2013, 47, 9706−97149707
XAS and synchrotron X-ray diffraction (SXRD) measurementsfrom peat cores B1II (200−224 and 225−249 cm), B3II (25−37 cm), and B5II (0−24 cm) (Figure 1). For the sake of clarity,the sample notation will be confined to core label and meansampling depth in centimeters, for example, B1II-212 or B3II-31. The four Kubiena boxes were freeze-dried and immediatelytransferred in Ar atmosphere into an anoxic glovebox, wherethey were impregnated with epoxy resin (Epotek 301-2FL,Epoxy Technology Inc., USA). Sections of 1 mm thicknesswere then cut using a diamond saw, mounted on As-free silicaglass slides, and polished down to a thickness of 30 μm underexclusion of O2 (Spectrum Petrographics Inc., USA). Asubsample of each Kubiena box was prepared for bulk As andFe XAS and SXRD analyses. The sample preparation for XASanalyses was identical to that described in ref 20. For SXRDmeasurements, homogenized peat material was filled into 1 mmo.d. borosilicate glass capillaries. Peat samples used for S K-edgeXAS analysis were prepared in the same manner as those usedfor As and Fe XAS analyses, except that the samples werediluted to a concentration of 1800 mg S kg−1 using BN in orderto reduce overabsorption effects26 and pressed into 1.3 cmpellets.Bulk As K-edge (11867 eV), Fe K-edge (7112 eV), and S K-
edge (2472 eV) XAS spectra were collected in fluorescencemode at beamlines 11−2 (As), 4−1 (Fe), and 4−3 (S) of theStanford Synchrotron Radiation Lightsource (SSRL, SLACNational Accelerator Laboratory, Menlo Park, USA). The thinsections were analyzed by μ-XRF spectrometry and μ-XAS atbeamline 10.3.2 of the Advanced Light Source (ALS, Berkeley,USA) after identification of representative regions using plane-and cross-polarized light microscopy (Zeiss Axioskop 40microscope). The mineralogy of the peat samples wasinvestigated by SXRD. These measurements were conductedat the powder diffraction station of the Material Sciences (MS-Powder) beamline at the Swiss Light Source (SLS, Villingen,Switzerland). Details about all experimental setups, measure-ment conditions, and data evaluations can be found in theSupporting Information.
■ RESULTS
Peat Characterization. For the investigation of themicroscale distribution and speciation of As in the Gola diLago peatland, three sampling locations characterized by twodifferent As speciation patterns were selected. At locations B3and B5, As was enriched in the top 41 cm and mainly present asrealgar and As(III/V) sorbed to Fe(III)-(hydr)oxides. Atlocation B1, however, As was concentrated at 150−200 cmdepth and entirely sequestered as trivalent As by organic S.20
The field-moist peat sampled in September 2009 and used forthis study (cores B1I/II, B3I/II, and B5I/II) was slightly acidic(pH 5.7 ± 0.5). The redox potential, Eh, ranged from −11 to364 mV, and the mean ionic strength estimated from electricalconductivity values27 was 9 × 10⁻⁴ M (n = 54). Arsenic, Fe, andS concentrations in the “II” peat cores are displayed in Figure 1and summarized together with those of other major elements inTable S1, Supporting Information. Except for core B5II, the As-enriched zones in peat cores B1II (175−249 cm) and B3II (0−37 cm) were located at approximately the same depths as thoseof the initial peat cores B1 and B3 collected in March 2009.20
The concentration maxima of As in the “II” peat cores (331−580 mg As kg−1), however, were up to five times lowercompared to the initial peat cores (469−1800 mg As kg−1),
emphasizing the high spatial variability of As at the decimeterscale.Synchrotron XRD patterns of peat samples used for μ-XRF
and μ-XAS analyses (Figure 1), which are displayed in FigureS1, Supporting Information, confirmed the presence of primaryminerals in the near-surface peat samples B3II-31 and B5II-12,including quartz, phyllosilicates (biotite, muscovite, chlorite),and plagioclase (albite, oligoclase, anorthite). The deep peatlayer samples of core B1II showed Bragg peaks belonging toquartz, muscovite, plagioclase (albite, oligoclase), and pyrite.Mineral-phase assemblages in the thin sections studied by μ-XRF spectrometry and μ-XAS were also investigated by lightmicroscopy. These analyses revealed considerable amounts ofmineral phases embedded in the organic matrix of the near-surface peat sample B3II-31, which included single particles(∼100−500 μm) of plagioclase, quartz, mica-group minerals(biotite, muscovite), some epidote, and chlorite, as well asaltered rock fragments of mainly gneiss (∼1−3 mm) (FigureS2, Supporting Information). In contrast, mineral phases wereless abundant in the two thin sections of the deep peat layersamples B1II-212 and B1II-237, and only comprised quartz andmica particles (∼10−50 μm) (Figures S2 and S3, SupportingInformation). Using cross-polarized light,28 however, wedetected fine-grained, reddish-brown colored secondary Fe-(hydr)oxides in all thin sections, partially infilling pores orcoating mineral surfaces (Figure S3, Supporting Information).
Bulk XAS Analyses. Bulk As and Fe K-edge EXAFS spectraof all four peat samples used to prepare the thin sections areillustrated in Figure 1 along with the corresponding linearcombination fits (LCF). The LCF results for As and Fe, shownas horizontal bars in Figure 1, are compiled in Tables S2 andS3, Supporting Information. In the near-surface peat layersamples B3II-31 and B5II-12, the major As species comprisedrealgar (43−71%) and As(III) (20−36%) as well as As(V) (9−21%) sorbed to Fe(III)-(hydr)oxides. In contrast, As(III)−NOM complexes completely dominated the As speciation inthe deep-peat layer samples B1II-212 and B1II-237, inagreement with our earlier findings.20 The presence ofpararealgar, a polymorph of realgar, in the near-surface peatsamples can be excluded since its local As coordination (e.g.,rAs−As = 2.48−2.53 vs. 2.57 Å)29−31 and hence As K-edgeEXAFS differs from that of realgar (not shown). Othermodifications of realgar (β-As4S4 and As4S4(II)) can also bedismissed since they do not form in low pressure/lowtemperature environments.31−33 Note also that orpiment(As2S3) was not detected in any peat sample.The LCF results of the bulk Fe K-edge EXAFS spectra
revealed that the major Fe species in the near-surface peat layersamples included Fe(III)-(hydr)oxides (19−41%), phyllosili-cates (44−59%), and Fe(III)−NOM complexes (0−37%). Ironin the deep peat layer samples was predominantly present asFe(III)−NOM complexes (35−75%) and pyrite (25−36%),whereas Fe(III)-(hydr)oxides (0−11%) and phyllosilicates (0−18%) were much less abundant (Figure 1, Table S3, SupportingInformation). These findings are in general agreement with ourSXRD, light microscopy, and As speciation results (FiguresS1−3 and Table S2, Supporting Information).The differences in As and Fe speciation observed for the
near-surface and deep peat layer samples (Figure 1) suggestimportant differences in the bulk S speciation as a function ofdepth. For this reason, we also studied the speciation of S inpeat material originating from peat cores B1I, B3I, and B5I.These samples were taken from similar depths as those of the
Environmental Science & Technology Article
dx.doi.org/10.1021/es401315e | Environ. Sci. Technol. 2013, 47, 9706−97149708
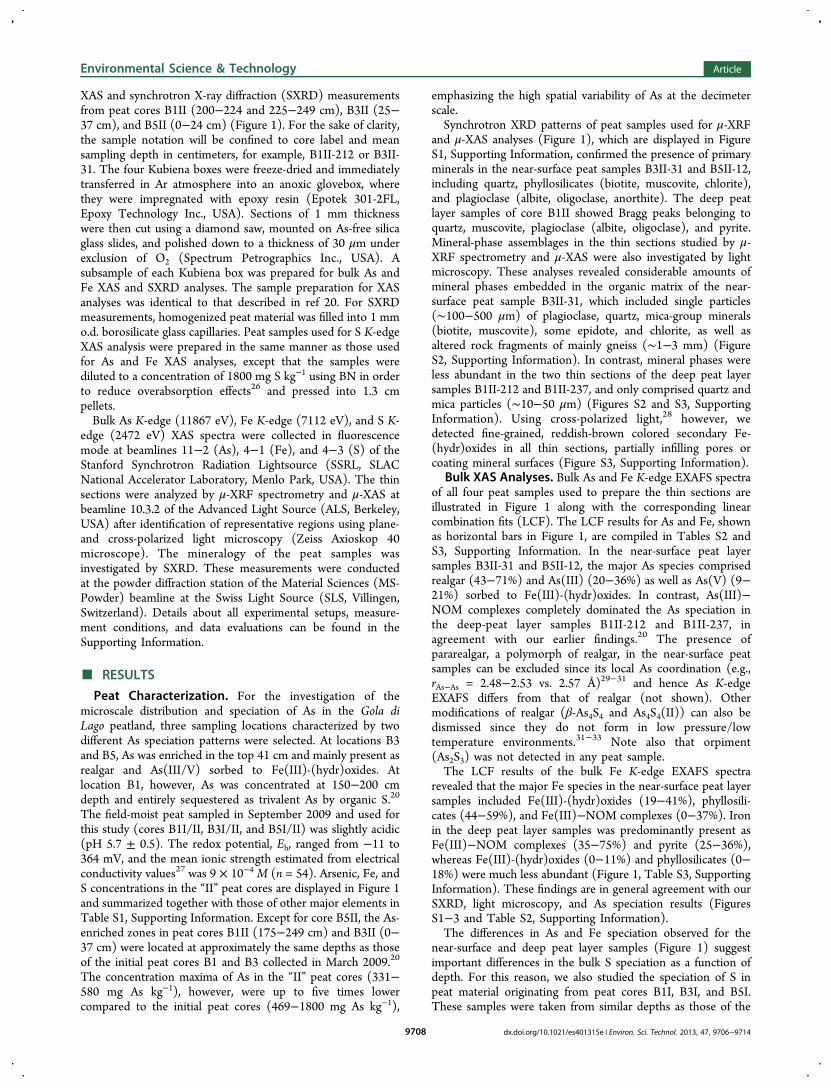
“II” peat cores and also had similar S contents (Table S4,Supporting Information). Figure 2 shows the S K-edge XANESspectra of peat samples B3I-18, B5I-12, and B1I-196, as well astheir spectral deconvolution based on Gaussians representingresonance peaks of the main S functionalities.34 All peatsamples showed two distinct resonance-peak ranges. The firstpeak range from 2471 to 2475 eV includes “reduced S” species(inorganic sulfide and organic exocyclic/heterocyclic S), andthe second peak ranging from 2481 to 2483 eV represents“oxidized S” species (sulfonate and sulfate). “Intermediateoxidized S” species (sulfoxide, sulfite, and sulfone) withresonance peaks located between 2476 and 2480 eV weregenerally of less quantitative importance (Tables S4 and S5,Supporting Information).Both “oxidized” and “intermediate oxidized” S species were
more abundant in the near-surface peat samples B3I-18 andB5I-12 compared to the deep peat layer sample B1I-196(Figure 2, Table S4, Supporting Information). However, thefitted fractions of sulfoxide, sulfite, and sulfone S as part of the“intermediate oxidized S” are presumably overestimated in allsamples, since the energy range of 2476−2480 eV issignificantly affected by postedge absorption features of reducedorganic S species as well as the first arctangent function.35 Dueto their low quantitative importance and in order to obtain agenerally reasonable fit quality, these “intermediate oxidized S”species were nonetheless included in our fitting procedure.
With 80−92% of total S, “reduced S” was the dominant Sform in all peat samples (Table S4, Supporting Information).Inorganic sulfide S only comprised 9−16% of the “reduced S”pool. A significant attenuation of the inorganic sulfide signaldue to the limited X-ray penetration depth at the S K-edge36
can be ruled out because the pyrites observed in the Gola diLago peat were smaller than one absorption length calculatedfor pyrite at 2.5 keV.20 Thus, according to the white-linepositions,34,35,37 the majority of S can be attributed to reducedorganic S species (64−83%), which falls at the high end ofreduced organic S in peatlands (14−87%).35,38−42 Even thoughthe relative amount of reduced organic S in the near-surfaceand deep peat layer samples was comparable, the deep peatlayer sample contained 2−7 times more S. Thus, its reducedorganic S pool significantly exceeded that of the shallow peatlayer samples.
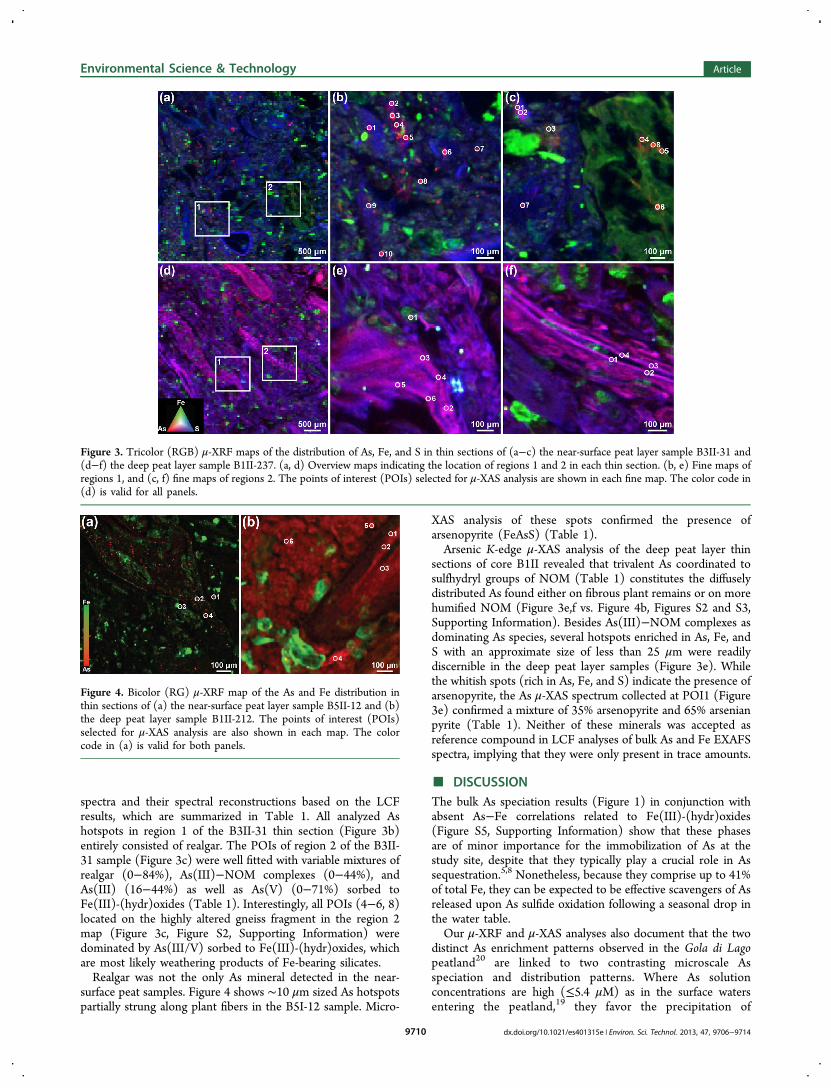
μ-XRF and μ-XAS Analyses. Elemental mapping by μ-XRFspectrometry was employed to investigate the distribution of Asand its correlations with other elements, notably Fe and S. Onthe basis of the elemental associations of As, μ-XAS analysiswas used to identify major and minor As species at selectedpoints of interest (POIs). Figure 3 shows coarse and fineelemental distribution maps of As, Fe, and S obtained from thinsections of the near-surface peat layer sample B3II-31 and thedeep peat layer sample B1II-237. The distributions of As andFe in the near-surface peat sample B5II-12 and the second deeppeat layer sample B1II-212 are additionally depicted in Figure4. The elemental distribution maps document that thedistribution of As in the near-surface peat samples differedsubstantially from that in the deep peat layer samples. Whereasintense As hotspots of about 10−50 μm size dominated thenear-surface peat samples, As was for the most part morediffusely distributed in the deep peat layer samples andassociated with plant fibers (Figure 3) and brownish NOMwith a “cauliflower”-like morphology representing morehumified NOM (Figure 4b, Figure S3d−f, SupportingInformation). At the As hotspots found mostly close to thepeat surface, a clear correlation with S was recognized (FigureS4a−c, Supporting Information). A second As−S correlation,characterized by lower As/S ratios, was additionally noticed inthe near-surface peat sample B3II-31 and was linked to thediffuse As distribution in this particular sample (Figure S4d−f,Supporting Information). For the deep peat layer thin sections,we also observed two pronounced correlations between As andS. Whereas the first correlation corresponds to the diffusedistribution of As, the second is restricted to rare but intense Ashotspots (Figure S4g−l, Supporting Information).Correlations between As and Fe ranged from strong to
nonexistent (Figure S5, Supporting Information). The mostevident As−Fe correlation was found in a deep peat layersample, where Fe-rich As hotspots were particularly enriched inS, pointing toward arsenopyrite and/or arsenian pyrite (FigureS4g−i vs. Figure S5g−i, Supporting Information). In contrast,Fe correlated well with Mn in all samples, particularly in thenear-surface peat samples (Figure S6, Supporting Information).Here, a significant portion of Fe and Mn was associated with Si-poor secondary Fe-(hydr)oxides identified by light microscopy(Figures S3 and S7, Supporting Information).The speciation of As was studied by As K-edge μ-XAS at
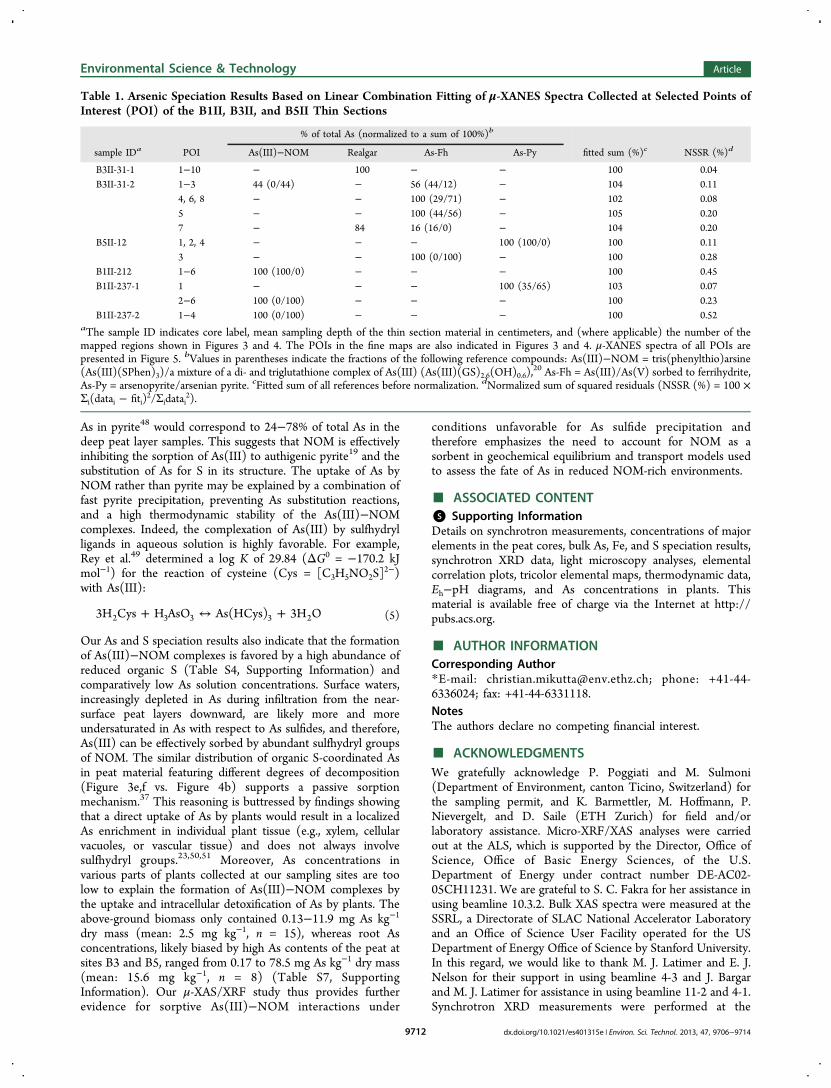
selected POIs indicated in each fine map shown in Figures 3and 4. Similar POI spectra were averaged in order to increasethe signal-to-noise ratio. The μ-XANES spectra and their LCFsare illustrated in Figure 5 along with the k2-weighted μ-EXAFS
Figure 2. Deconvolution of normalized bulk S K-edge XANES spectrainto several Gaussians and two arctangent curves of the near-surfacepeat samples (a) B3I-18 and (b) B5I-12, as well as the deep peat layersample (c) B1I-196. Data is shown as solid blue lines, fit envelopes assymbols, fit components as dashed lines, and arctangent functions assolid black lines. Parameter values and fit results are summarized inTables S4 and S5, Supporting Information.
Environmental Science & Technology Article
dx.doi.org/10.1021/es401315e | Environ. Sci. Technol. 2013, 47, 9706−97149709
spectra and their spectral reconstructions based on the LCFresults, which are summarized in Table 1. All analyzed Ashotspots in region 1 of the B3II-31 thin section (Figure 3b)entirely consisted of realgar. The POIs of region 2 of the B3II-31 sample (Figure 3c) were well fitted with variable mixtures ofrealgar (0−84%), As(III)−NOM complexes (0−44%), andAs(III) (16−44%) as well as As(V) (0−71%) sorbed toFe(III)-(hydr)oxides (Table 1). Interestingly, all POIs (4−6, 8)located on the highly altered gneiss fragment in the region 2map (Figure 3c, Figure S2, Supporting Information) weredominated by As(III/V) sorbed to Fe(III)-(hydr)oxides, whichare most likely weathering products of Fe-bearing silicates.Realgar was not the only As mineral detected in the near-
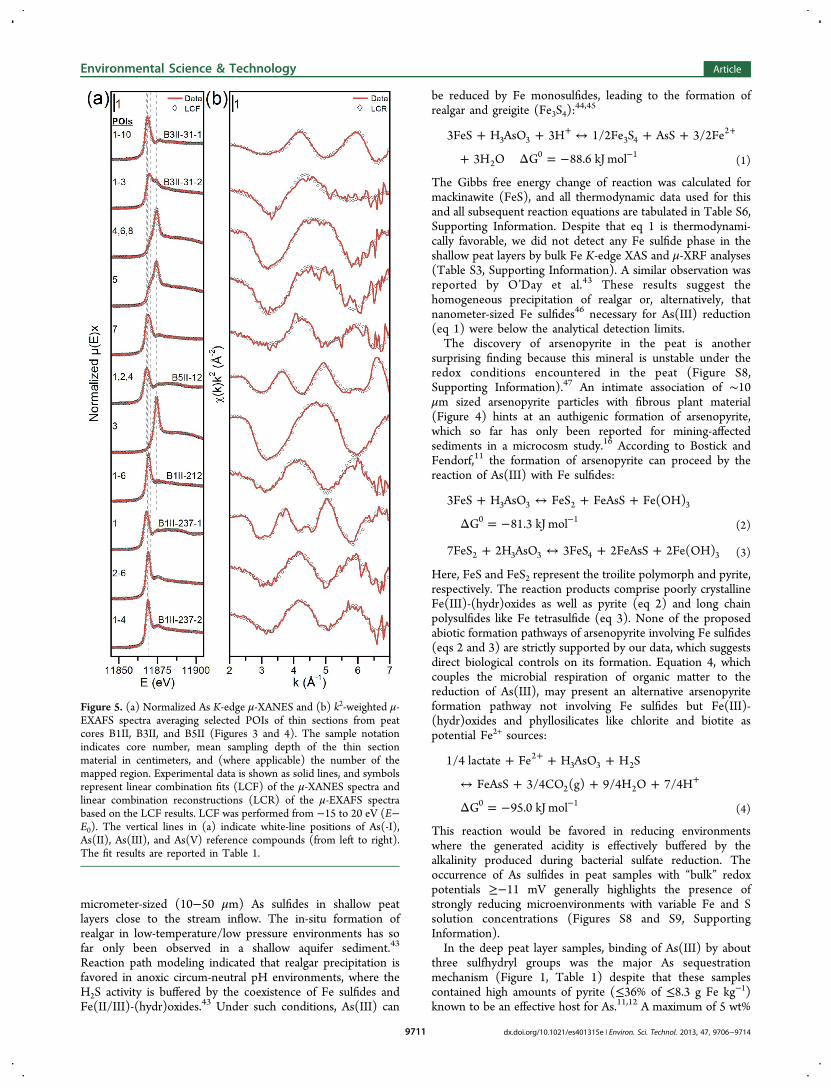
surface peat samples. Figure 4 shows ∼10 μm sized As hotspotspartially strung along plant fibers in the B5I-12 sample. Micro-
XAS analysis of these spots confirmed the presence ofarsenopyrite (FeAsS) (Table 1).Arsenic K-edge μ-XAS analysis of the deep peat layer thin
sections of core B1II revealed that trivalent As coordinated tosulfhydryl groups of NOM (Table 1) constitutes the diffuselydistributed As found either on fibrous plant remains or on morehumified NOM (Figure 3e,f vs. Figure 4b, Figures S2 and S3,Supporting Information). Besides As(III)−NOM complexes asdominating As species, several hotspots enriched in As, Fe, andS with an approximate size of less than 25 μm were readilydiscernible in the deep peat layer samples (Figure 3e). Whilethe whitish spots (rich in As, Fe, and S) indicate the presence ofarsenopyrite, the As μ-XAS spectrum collected at POI1 (Figure3e) confirmed a mixture of 35% arsenopyrite and 65% arsenianpyrite (Table 1). Neither of these minerals was accepted asreference compound in LCF analyses of bulk As and Fe EXAFSspectra, implying that they were only present in trace amounts.
■ DISCUSSIONThe bulk As speciation results (Figure 1) in conjunction withabsent As−Fe correlations related to Fe(III)-(hydr)oxides(Figure S5, Supporting Information) show that these phasesare of minor importance for the immobilization of As at thestudy site, despite that they typically play a crucial role in Assequestration.5,8 Nonetheless, because they comprise up to 41%of total Fe, they can be expected to be effective scavengers of Asreleased upon As sulfide oxidation following a seasonal drop inthe water table.Our μ-XRF and μ-XAS analyses also document that the two
distinct As enrichment patterns observed in the Gola di Lagopeatland20 are linked to two contrasting microscale Asspeciation and distribution patterns. Where As solutionconcentrations are high (≤5.4 μM) as in the surface watersentering the peatland,19 they favor the precipitation of
Figure 3. Tricolor (RGB) μ-XRF maps of the distribution of As, Fe, and S in thin sections of (a−c) the near-surface peat layer sample B3II-31 and(d−f) the deep peat layer sample B1II-237. (a, d) Overview maps indicating the location of regions 1 and 2 in each thin section. (b, e) Fine maps ofregions 1, and (c, f) fine maps of regions 2. The points of interest (POIs) selected for μ-XAS analysis are shown in each fine map. The color code in(d) is valid for all panels.
Figure 4. Bicolor (RG) μ-XRF map of the As and Fe distribution inthin sections of (a) the near-surface peat layer sample B5II-12 and (b)the deep peat layer sample B1II-212. The points of interest (POIs)selected for μ-XAS analysis are also shown in each map. The colorcode in (a) is valid for both panels.
Environmental Science & Technology Article
dx.doi.org/10.1021/es401315e | Environ. Sci. Technol. 2013, 47, 9706−97149710
micrometer-sized (10−50 μm) As sulfides in shallow peatlayers close to the stream inflow. The in-situ formation ofrealgar in low-temperature/low pressure environments has sofar only been observed in a shallow aquifer sediment.43
Reaction path modeling indicated that realgar precipitation isfavored in anoxic circum-neutral pH environments, where theH2S activity is buffered by the coexistence of Fe sulfides andFe(II/III)-(hydr)oxides.43 Under such conditions, As(III) can
be reduced by Fe monosulfides, leading to the formation ofrealgar and greigite (Fe3S4):
44,45
+ + ↔ + +
+ Δ = −
+ +
−
3FeS H AsO 3H 1/2Fe S AsS 3/2Fe
3H O G 88.6 kJ mol3 3 3 4
2
20 1
(1)
The Gibbs free energy change of reaction was calculated formackinawite (FeS), and all thermodynamic data used for thisand all subsequent reaction equations are tabulated in Table S6,Supporting Information. Despite that eq 1 is thermodynami-cally favorable, we did not detect any Fe sulfide phase in theshallow peat layers by bulk Fe K-edge XAS and μ-XRF analyses(Table S3, Supporting Information). A similar observation wasreported by O’Day et al.43 These results suggest thehomogeneous precipitation of realgar or, alternatively, thatnanometer-sized Fe sulfides46 necessary for As(III) reduction(eq 1) were below the analytical detection limits.The discovery of arsenopyrite in the peat is another
surprising finding because this mineral is unstable under theredox conditions encountered in the peat (Figure S8,Supporting Information).47 An intimate association of ∼10μm sized arsenopyrite particles with fibrous plant material(Figure 4) hints at an authigenic formation of arsenopyrite,which so far has only been reported for mining-affectedsediments in a microcosm study.16 According to Bostick andFendorf,11 the formation of arsenopyrite can proceed by thereaction of As(III) with Fe sulfides:
+ ↔ + +
Δ = − −
3FeS H AsO FeS FeAsS Fe(OH)
G 81.3 kJ mol3 3 2 3
0 1(2)
+ ↔ + +7FeS 2H AsO 3FeS 2FeAsS 2Fe(OH)2 3 3 4 3 (3)
Here, FeS and FeS2 represent the troilite polymorph and pyrite,respectively. The reaction products comprise poorly crystallineFe(III)-(hydr)oxides as well as pyrite (eq 2) and long chainpolysulfides like Fe tetrasulfide (eq 3). None of the proposedabiotic formation pathways of arsenopyrite involving Fe sulfides(eqs 2 and 3) are strictly supported by our data, which suggestsdirect biological controls on its formation. Equation 4, whichcouples the microbial respiration of organic matter to thereduction of As(III), may present an alternative arsenopyriteformation pathway not involving Fe sulfides but Fe(III)-(hydr)oxides and phyllosilicates like chlorite and biotite aspotential Fe2+ sources:
+ + +
↔ + + +
Δ = −
+
+
−
1/4 lactate Fe H AsO H S
FeAsS 3/4CO (g) 9/4H O 7/4H
G 95.0 kJ mol
23 3 2
2 20 1
(4)
This reaction would be favored in reducing environmentswhere the generated acidity is effectively buffered by thealkalinity produced during bacterial sulfate reduction. Theoccurrence of As sulfides in peat samples with “bulk” redoxpotentials ≥−11 mV generally highlights the presence ofstrongly reducing microenvironments with variable Fe and Ssolution concentrations (Figures S8 and S9, SupportingInformation).In the deep peat layer samples, binding of As(III) by about
three sulfhydryl groups was the major As sequestrationmechanism (Figure 1, Table 1) despite that these samplescontained high amounts of pyrite (≤36% of ≤8.3 g Fe kg−1)known to be an effective host for As.11,12 A maximum of 5 wt%
Figure 5. (a) Normalized As K-edge μ-XANES and (b) k2-weighted μ-EXAFS spectra averaging selected POIs of thin sections from peatcores B1II, B3II, and B5II (Figures 3 and 4). The sample notationindicates core number, mean sampling depth of the thin sectionmaterial in centimeters, and (where applicable) the number of themapped region. Experimental data is shown as solid lines, and symbolsrepresent linear combination fits (LCF) of the μ-XANES spectra andlinear combination reconstructions (LCR) of the μ-EXAFS spectrabased on the LCF results. LCF was performed from −15 to 20 eV (E−E0). The vertical lines in (a) indicate white-line positions of As(-I),As(II), As(III), and As(V) reference compounds (from left to right).The fit results are reported in Table 1.
Environmental Science & Technology Article
dx.doi.org/10.1021/es401315e | Environ. Sci. Technol. 2013, 47, 9706−97149711
As in pyrite48 would correspond to 24−78% of total As in thedeep peat layer samples. This suggests that NOM is effectivelyinhibiting the sorption of As(III) to authigenic pyrite19 and thesubstitution of As for S in its structure. The uptake of As byNOM rather than pyrite may be explained by a combination offast pyrite precipitation, preventing As substitution reactions,and a high thermodynamic stability of the As(III)−NOMcomplexes. Indeed, the complexation of As(III) by sulfhydrylligands in aqueous solution is highly favorable. For example,Rey et al.49 determined a log K of 29.84 (ΔG0 = −170.2 kJmol−1) for the reaction of cysteine (Cys = [C3H5NO2S]
2−)with As(III):
+ ↔ +3H Cys H AsO As(HCys) 3H O2 3 3 3 2 (5)
Our As and S speciation results also indicate that the formationof As(III)−NOM complexes is favored by a high abundance ofreduced organic S (Table S4, Supporting Information) andcomparatively low As solution concentrations. Surface waters,increasingly depleted in As during infiltration from the near-surface peat layers downward, are likely more and moreundersaturated in As with respect to As sulfides, and therefore,As(III) can be effectively sorbed by abundant sulfhydryl groupsof NOM. The similar distribution of organic S-coordinated Asin peat material featuring different degrees of decomposition(Figure 3e,f vs. Figure 4b) supports a passive sorptionmechanism.37 This reasoning is buttressed by findings showingthat a direct uptake of As by plants would result in a localizedAs enrichment in individual plant tissue (e.g., xylem, cellularvacuoles, or vascular tissue) and does not always involvesulfhydryl groups.23,50,51 Moreover, As concentrations invarious parts of plants collected at our sampling sites are toolow to explain the formation of As(III)−NOM complexes bythe uptake and intracellular detoxification of As by plants. Theabove-ground biomass only contained 0.13−11.9 mg As kg−1
dry mass (mean: 2.5 mg kg−1, n = 15), whereas root Asconcentrations, likely biased by high As contents of the peat atsites B3 and B5, ranged from 0.17 to 78.5 mg As kg−1 dry mass(mean: 15.6 mg kg−1, n = 8) (Table S7, SupportingInformation). Our μ-XAS/XRF study thus provides furtherevidence for sorptive As(III)−NOM interactions under
conditions unfavorable for As sulfide precipitation andtherefore emphasizes the need to account for NOM as asorbent in geochemical equilibrium and transport models usedto assess the fate of As in reduced NOM-rich environments.
■ ASSOCIATED CONTENT*S Supporting InformationDetails on synchrotron measurements, concentrations of majorelements in the peat cores, bulk As, Fe, and S speciation results,synchrotron XRD data, light microscopy analyses, elementalcorrelation plots, tricolor elemental maps, thermodynamic data,Eh−pH diagrams, and As concentrations in plants. Thismaterial is available free of charge via the Internet at http://pubs.acs.org.
■ AUTHOR INFORMATIONCorresponding Author*E-mail: [email protected]; phone: +41-44-6336024; fax: +41-44-6331118.NotesThe authors declare no competing financial interest.
■ ACKNOWLEDGMENTSWe gratefully acknowledge P. Poggiati and M. Sulmoni(Department of Environment, canton Ticino, Switzerland) forthe sampling permit, and K. Barmettler, M. Hoffmann, P.Nievergelt, and D. Saile (ETH Zurich) for field and/orlaboratory assistance. Micro-XRF/XAS analyses were carriedout at the ALS, which is supported by the Director, Office ofScience, Office of Basic Energy Sciences, of the U.S.Department of Energy under contract number DE-AC02-05CH11231. We are grateful to S. C. Fakra for her assistance inusing beamline 10.3.2. Bulk XAS spectra were measured at theSSRL, a Directorate of SLAC National Accelerator Laboratoryand an Office of Science User Facility operated for the USDepartment of Energy Office of Science by Stanford University.In this regard, we would like to thank M. J. Latimer and E. J.Nelson for their support in using beamline 4-3 and J. Bargarand M. J. Latimer for assistance in using beamline 11-2 and 4-1.Synchrotron XRD measurements were performed at the
Table 1. Arsenic Speciation Results Based on Linear Combination Fitting of μ-XANES Spectra Collected at Selected Points ofInterest (POI) of the B1II, B3II, and B5II Thin Sections
% of total As (normalized to a sum of 100%)b
sample IDa POI As(III)−NOM Realgar As-Fh As-Py fitted sum (%)c NSSR (%)d
B3II-31-1 1−10 − 100 − − 100 0.04B3II-31-2 1−3 44 (0/44) − 56 (44/12) − 104 0.11
4, 6, 8 − − 100 (29/71) − 102 0.085 − − 100 (44/56) − 105 0.207 − 84 16 (16/0) − 104 0.20
B5II-12 1, 2, 4 − − − 100 (100/0) 100 0.113 − − 100 (0/100) − 100 0.28
B1II-212 1−6 100 (100/0) − − − 100 0.45B1II-237-1 1 − − − 100 (35/65) 103 0.07
2−6 100 (0/100) − − − 100 0.23B1II-237-2 1−4 100 (0/100) − − − 100 0.52
aThe sample ID indicates core label, mean sampling depth of the thin section material in centimeters, and (where applicable) the number of themapped regions shown in Figures 3 and 4. The POIs in the fine maps are also indicated in Figures 3 and 4. μ-XANES spectra of all POIs arepresented in Figure 5. bValues in parentheses indicate the fractions of the following reference compounds: As(III)−NOM = tris(phenylthio)arsine(As(III)(SPhen)3)/a mixture of a di- and triglutathione complex of As(III) (As(III)(GS)2.6(OH)0.6),
20 As-Fh = As(III)/As(V) sorbed to ferrihydrite,As-Py = arsenopyrite/arsenian pyrite. cFitted sum of all references before normalization. dNormalized sum of squared residuals (NSSR (%) = 100 ×Σi(datai − fiti)
2/Σidatai2).
Environmental Science & Technology Article
dx.doi.org/10.1021/es401315e | Environ. Sci. Technol. 2013, 47, 9706−97149712

powder diffraction station of the MS-Powder beamline at theSLS, Paul Scherrer Institute, Villingen, Switzerland. Thesupport of A. Cervellino (beamline scientist) and P. N.Mandaliev, K. Ehlert, and M. Hoffmann (ETH Zurich) isgratefully acknowledged. This research project was financiallysupported by the ETH Zurich under grant number 2708-2.
■ REFERENCES(1) Rothwell, J. J.; Taylor, K. G.; Chenery, S. R. N.; Cundy, A. B.;Evans, M. G.; Allott, T. E. H. Storage and behavior of As, Sb, Pb, andCu in ombrotrophic peat bogs under contrasting water tableconditions. Environ. Sci. Technol. 2010, 44, 8497−8502.(2) La Force, M. J.; Hansel, C. M.; Fendorf, S. Arsenic speciation,seasonal transformations, and co-distribution with iron in a minewaste-influenced palustrine emergent wetland. Environ. Sci. Technol.2000, 34, 3937−3943.(3) Lemly, A. D.; Finger, S. E.; Nelson, M. K. Sources and impacts ofirrigation drainwater contaminants in arid wetlands. Environ. Toxicol.Chem. 1993, 12, 2265−2279.(4) Dittmar, J.; Voegelin, A.; Roberts, L. C.; Hug, S. J.; Saha, G. C.;Ali, M. A.; Badruzzaman, A. B. M.; Kretzschmar, R. Arsenicaccumulation in a paddy field in Bangladesh: Seasonal dynamics andtrends over a three-year monitoring period. Environ. Sci. Technol. 2010,44, 2925−2931.(5) Smedley, P. L.; Kinniburgh, D. G. A review of the source,behaviour and distribution of arsenic in natural waters. Appl. Geochem.2002, 17, 517−568.(6) Manning, B. A.; Goldberg, S. Arsenic(III) and arsenic(V)absorption on three California soils. Soil Sci. 1997, 162, 886−895.(7) Violante, A.; Pigna, M. Competitive sorption of arsenate andphosphate on different clay minerals and soils. Soil Sci. Soc. Am. J.2002, 66, 1788−1796.(8) Bowell, R. J. Sorption of arsenic by iron-oxides and oxyhydroxidesin soils. Appl. Geochem. 1994, 9, 279−286.(9) Anawar, H. M.; Akai, J.; Komaki, K.; Terao, H.; Yoshioka, T.;Ishizuka, T.; Safiullah, S.; Kato, K. Geochemical occurrence of arsenicin groundwater of Bangladesh: Sources and mobilization processes. J.Geochem. Explor. 2003, 77, 109−131.(10) Masscheleyn, P. H.; Delaune, R. D.; Patrick, W. H. Effect ofredox potential and pH on arsenic speciation and solubility in acontaminated soil. Environ. Sci. Technol. 1991, 25, 1414−1419.(11) Bostick, B. C.; Fendorf, S. Arsenite sorption on troilite (FeS)and pyrite (FeS2). Geochim. Cosmochim. Acta 2003, 67, 909−921.(12) Lowers, H. A.; Breit, G. N.; Foster, A. L.; Whitney, J.; Yount, J.;Uddin, N.; Muneem, A. Arsenic incorporation into authigenic pyrite,Bengal Basin sediment, Bangladesh. Geochim. Cosmochim. Acta 2007,71, 2699−2717.(13) Dixit, S.; Hering, J. G. Comparison of arsenic(V) andarsenic(III) sorption onto iron oxide minerals: Implications for arsenicmobility. Environ. Sci. Technol. 2003, 37, 4182−4189.(14) Root, R. A.; Dixit, S.; Campbell, K. M.; Jew, A. D.; Hering, J. G.;O’Day, P. A. Arsenic sequestration by sorption processes in high-ironsediments. Geochim. Cosmochim. Acta 2007, 71, 5782−5803.(15) Moore, J. N.; Ficklin, W. H.; Johns, C. Partitioning of arsenicand metals in reducing sulfidic sediments. Environ. Sci. Technol. 1988,22, 432−437.(16) Rittle, K. A.; Drever, J. I.; Colberg, P. J. S. Precipitation ofarsenic during bacterial sulfate reduction. Geomicrobiol. J. 1995, 13, 1−11.(17) Buschmann, J.; Kappeler, A.; Lindauer, U.; Kistler, D.; Berg, M.;Sigg, L. Arsenite and arsenate binding to dissolved humic acids:Influence of pH, type of humic acid, and aluminum. Environ. Sci.Technol. 2006, 40, 6015−6020.(18) Redman, A. D.; Macalady, D. L.; Ahmann, D. Natural organicmatter affects arsenic speciation and sorption onto hematite. Environ.Sci. Technol. 2002, 36, 2889−2896.(19) Gonzalez A., Z. I.; Krachler, M.; Cheburkin, A. K.; Shotyk, W.Spatial distribution of natural enrichments of arsenic, selenium, and
uranium in a minerotrophic peatland, Gola di Lago, Canton Ticino,Switzerland. Environ. Sci. Technol. 2006, 40, 6568−6574.(20) Langner, P.; Mikutta, C.; Kretzschmar, R. Arsenic sequestrationby organic sulphur in peat. Nat. Geosci. 2012, 5, 66−73.(21) Zimmer, D.; Kruse, J.; Baum, C.; Borca, C.; Laue, M.; Hause, G.;Meissner, R.; Leinweber, P. Spatial distribution of arsenic and heavymetals in willow roots from a contaminated floodplain soil measuredby X-ray fluorescence spectroscopy. Sci. Total Environ. 2011, 409,4094−4100.(22) Frommer, J.; Voegelin, A.; Dittmar, J.; Marcus, M. A.;Kretzschmar, R. Biogeochemical processes and arsenic enrichmentaround rice roots in paddy soil: Results from micro-focused X-rayspectroscopy. Eur. J. Soil Sci. 2011, 62, 305−317.(23) Castillo-Michel, H.; Hernandez-Viezcas, J.; Dokken, K. M.;Marcus, M. A.; Peralta-Videa, J. R.; Gardea-Torresdey, J. L.Localization and speciation of arsenic in soil and desert plantParkinsonia florida using μ-XRF and μ-XANES. Environ. Sci. Technol.2011, 45, 7848−7854.(24) Strawn, D.; Doner, H.; Zavarin, M.; McHugo, S. Microscaleinvestigation into the geochemistry of arsenic, selenium, and iron insoil developed in pyritic shale materials. Geoderma 2002, 108, 237−257.(25) Landrot, G.; Tappero, R.; Webb, S. M.; Sparks, D. L. Arsenicand chromium speciation in an urban contaminated soil. Chemosphere2012, 88, 1196−1201.(26) Prietzel, J.; Botzaki, A.; Tyufekchieva, N.; Brettholle, M.;Thieme, J.; Klysubun, W. Sulfur speciation in soil by S K-edge XANESspectroscopy: Comparison of spectral deconvolution and linearcombination fitting. Environ. Sci. Technol. 2011, 45, 2878−2886.(27) Griffin, R. A.; Jurinak, J. J. Estimation of activitiy coefficientsfrom electrical conductivity of natural aquatic systems and soil extracts.Soil Sci. 1973, 116, 26−30.(28) Delvigne, J. E. Atlas of micromorphology of mineral alteration andweathering; Mineralogical Association of Canada: Ottawa, 1998.(29) Bonazzi, P.; Menchetti, S.; Pratesi, G. The crystal structure ofpararealgar, As4S4. Am. Mineral. 1995, 80, 400−403.(30) Mullen, D. J. E.; Nowacki, W. Refinement of crystal structures ofrealgar, AsS and orpiment, As2S3. Z. Kristallogr. 1972, 136, 48−65.(31) Bonazzi, P.; Bindi, L. A crystallographic review of arsenicsulfides: Effects of chemical variations and changes induced byexposure to light. Z. Kristallogr. 2008, 223, 132−147.(32) Kutoglu, A. Preparation and crystal-structure of a new isomericform of As4S4. Z. Anorg. Allg. Chem. 1976, 419, 176−184.(33) Tuktabiev, M. A.; Popova, S. V.; Brazhkin, V. V.; Lyapin, A. G.;Katayama, Y. Compressibility and polymorphism of α-As4S4 realgarunder high pressure. J. Phys.: Condens. Matter 2009, 21, 1−7.(34) Vairavamurthy, A. Using X-ray absorption to probe sulfuroxidation states in complex molecules. Spectrochim. Acta, Part A 1998,54, 2009−2017.(35) Manceau, A.; Nagy, K. L. Quantitative analysis of sulfurfunctional groups in natural organic matter by XANES spectroscopy.Geochim. Cosmochim. Acta 2012, 99, 206−223.(36) Bolin, T. B. Direct determination of pyrite content in Argonnepremium coals by the use of sulfur X-ray near edge absorptionspectroscopy (S-XANES). Energy Fuels 2010, 24, 5479−5482.(37) Hoffmann, M.; Mikutta, C.; Kretzschmar, R. Bisulfide reactionwith natural organic matter enhances arsenite sorption: Insights fromX-ray absorption spectroscopy. Environ. Sci. Technol. 2012, 46, 11788−11797.(38) Skyllberg, U.; Xia, K.; Bloom, P. R.; Nater, E. A.; Bleam, W. F.Binding of mercury(II) to reduced sulfur in soil organic matter alongupland-peat soil transects. J. Environ. Qual. 2000, 29, 855−865.(39) Zhao, F. J.; Lehmann, J.; Solomon, D.; Fox, M. A.; McGrath, S.P. Sulphur speciation and turnover in soils: Evidence from sulphur K-edge XANES spectroscopy and isotope dilution studies. Soil Biol.Biochem. 2006, 38, 1000−1007.(40) Prietzel, J.; Thieme, J.; Salome, M.; Knicker, H. Sulfur K-edgeXANES spectroscopy reveals differences in sulfur speciation of bulk
Environmental Science & Technology Article
dx.doi.org/10.1021/es401315e | Environ. Sci. Technol. 2013, 47, 9706−97149713
soils, humic acid, fulvic acid, and particle size separates. Soil Biol.Biochem. 2007, 39, 877−890.(41) Prietzel, J.; Tyufekchieva, N.; Eusterhues, K.; Kogel-Knabner, I.;Thieme, J.; Paterson, D.; McNulty, I.; de Jonge, M.; Eichert, D.;Salome, M. Anoxic versus oxic sample pretreatment: Effects on thespeciation of sulfur and iron in well-aerated and wetland soils asassessed by X-ray absorption near-edge spectroscopy (XANES).Geoderma 2009, 153, 318−330.(42) Xia, K.; Weesner, F.; Bleam, W. F.; Bloom, P. R.; Skyllberg, U.L.; Helmke, P. A. XANES studies of oxidation states of sulfur inaquatic and soil humic substances. Soil Sci. Soc. Am. J. 1998, 62, 1240−1246.(43) O’Day, P. A.; Vlassopoulos, D.; Root, R.; Rivera, N. Theinfluence of sulfur and iron on dissolved arsenic concentrations in theshallow subsurface under changing redox conditions. Proc. Natl. Acad.Sci. U.S.A. 2004, 101, 13703−13708.(44) Gallegos, T. J.; Han, Y.-S.; Hayes, K. F. Model predictions ofrealgar precipitation by reaction of As(III) with synthetic mackinawiteunder anoxic conditions. Environ. Sci. Technol. 2008, 42, 9338−9343.(45) Gallegos, T. J.; Hyun, S. P.; Hayes, K. F. Spectroscopicinvestigation of the uptake of arsenite from solution by syntheticmackinawite. Environ. Sci. Technol. 2007, 41, 7781−7786.(46) Wolthers, M.; Van der Gaast, S. J.; Rickard, D. The structure ofdisordered mackinawite. Am. Mineral. 2003, 88, 2007−2015.(47) Craw, D.; Falconer, D.; Youngson, J. H. Environmentalarsenopyrite stability and dissolution: Theory, experiment, and fieldobservations. Chem. Geol. 2003, 199, 71−82.(48) Savage, K. S.; Tingle, T. N.; O’Day, P. A.; Waychunas, G. A.;Bird, D. K. Arsenic speciation in pyrite and secondary weatheringphases, Mother Lode Gold District, Tuolumne County, California.Appl. Geochem. 2000, 15, 1219−1244.(49) Rey, N. A.; Howarth, O. W.; Pereira-Maia, E. C. Equilibriumcharacterization of the As(III)-cysteine and the As(III)-glutathionesystems in aqueous solution. J. Inorg. Biochem. 2004, 98, 1151−1159.(50) Seyfferth, A. L.; Webb, S. M.; Andrews, J. C.; Fendorf, S.Defining the distribution of arsenic species and plant nutrients in rice(Oryza sativa L.) from the root to the grain. Geochim. Cosmochim. Acta2011, 75, 6655−6671.(51) Pickering, I. J.; Gumaelius, L.; Harris, H. H.; Prince, R. C.;Hirsch, G.; Banks, J. A.; Salt, D. E.; George, G. N. Localizing thebiochemical transformations of arsenate in a hyperaccumulating fern.Environ. Sci. Technol. 2006, 40, 5010−5014.
Environmental Science & Technology Article
dx.doi.org/10.1021/es401315e | Environ. Sci. Technol. 2013, 47, 9706−97149714