spatial and temporal profiling of griseofulvin...
TRANSCRIPT

Spatial and Temporal Profiling of Griseofulvin Production in Xylaria cubensis Using Mass Spectrometry Mapping By: Vincent Sica, Evan Rees, Edem Tchegnon, Robert Bardsley, Huzefa Raja, and Nicholas Oberlies “Spatial and Temporal Profiling of Griseofulvin Production in Xylaria cubensis Using Mass Spectrometry Mapping.” Vincent Sica, Evan Rees, Edem Tchegnon, Robert Bardsley, Huzefa Raja, and Nicholas Oberlies. Frontiers in Microbiology, 2016, 7. PMID: 27199902; PMCID: PMC4844619; doi: 10.3389/fmicb.2016.00544 Made available courtesy of Frontiers Media: https://doi.org/10.3389/fmicb.2016.00544 © 2016 Sica, Rees, Tchegnon, Bardsley, Raja, and Oberlies. Published under a Creative Commons Attribution License (CC BY 4.0); https://creativecommons.org/licenses/by/4.0/ Abstract: A large portion of natural products research revolves around the discovery of new, bioactive chemical entities; however, studies to probe the biological purpose of such secondary metabolites for the host organism are often limited. Mass spectrometry mapping of secondary metabolite biosynthesis in situcan be used to probe a series of ecological questions about fungi that may be lost through traditional natural products chemistry extraction protocols. A griseofulvin-producing fungal culture of the Xylariaceae family, isolated as an endophyte of the tree Asimina triloba, was analyzed through a series of spatial and temporal mapping experiments. This fungus produced unique fungal characteristics, such as guttates and stroma, both of which were explored spatially. The distribution of griseofulvin on this culture in isolation was compared to its dispersal when grown in co-culture with a competing Penicillium species via a droplet–based surface sampling system. The fungistatic properties of griseofulvin were visualized, including the consequences for biosynthesis of polyhydroxyanthraquinones in a rival culture. Keywords: griseofulvin | polyhydroxyanthraquinones | fungal secondary metabolites | co-culture | endophytes | mass spectrometry mapping Article: ***Note: Full text of article below

fmicb-07-00544 April 22, 2016 Time: 11:38 # 1
ORIGINAL RESEARCHpublished: 26 April 2016
doi: 10.3389/fmicb.2016.00544
Edited by:Dominique Sanglard,
University of Lausanne and LausanneUniversity Hospital, Switzerland
Reviewed by:Bjorn Sandrock,
Philipps-Universität Marburg,Germany
Laura Alcazar-Fuoli,Instituto de Salud Carlos III, Spain
*Correspondence:Nicholas H. Oberlies
Specialty section:This article was submitted toFungi and Their Interactions,
a section of the journalFrontiers in Microbiology
Received: 17 February 2016Accepted: 04 April 2016Published: 26 April 2016
Citation:Sica VP, Rees ER, Tchegnon E,
Bardsley RH, Raja HAand Oberlies NH (2016) Spatial
and Temporal Profiling of GriseofulvinProduction in Xylaria cubensis Using
Mass Spectrometry Mapping.Front. Microbiol. 7:544.
doi: 10.3389/fmicb.2016.00544
Spatial and Temporal Profiling ofGriseofulvin Production in Xylariacubensis Using Mass SpectrometryMappingVincent P. Sica, Evan R. Rees, Edem Tchegnon, Robert H. Bardsley, Huzefa A. Raja andNicholas H. Oberlies*
Department of Chemistry and Biochemistry, University of North Carolina at Greensboro, Greensboro, NC, USA
A large portion of natural products research revolves around the discovery of new,bioactive chemical entities; however, studies to probe the biological purpose of suchsecondary metabolites for the host organism are often limited. Mass spectrometrymapping of secondary metabolite biosynthesis in situ can be used to probe a seriesof ecological questions about fungi that may be lost through traditional natural productschemistry extraction protocols. A griseofulvin-producing fungal culture of the Xylariaceaefamily, isolated as an endophyte of the tree Asimina triloba, was analyzed through aseries of spatial and temporal mapping experiments. This fungus produced uniquefungal characteristics, such as guttates and stroma, both of which were exploredspatially. The distribution of griseofulvin on this culture in isolation was compared toits dispersal when grown in co-culture with a competing Penicillium species via adroplet–based surface sampling system. The fungistatic properties of griseofulvin werevisualized, including the consequences for biosynthesis of polyhydroxyanthraquinonesin a rival culture.
Keywords: griseofulvin, polyhydroxyanthraquinones, fungal secondary metabolites, co-culture, endophytes,mass spectrometry mapping
INTRODUCTION
For decades, griseofulvin (Figure 1) has been well studied, imparting a rich history in mycology,structure elucidation, and biological activity (Petersen et al., 2014). For mycologists, its initialdiscovery from Penicillium griseofulvum (Oxford et al., 1939) and subsequently P. janczewskii(Brian, 1946; McGowan, 1946) proved noteworthy as these griseofulvin-producing culturesinduced abnormal development of fungal hyphae. Essentially, griseofulvin triggered other fungalhyphae to “curl” imparting the name “curling factor” as its original descriptor (Brian, 1946;McGowan, 1946). From the perspective of organic chemistry, the characterization of griseofulvindetails how the structure elucidation of fungal metabolites evolved in the 20th century. Initially,an ensemble of IR and UV spectroscopy, coupled with combustion analysis of derivatives ordegradation products, was employed (Oxford et al., 1939; Grove and McGowan, 1947; Groveet al., 1952). Ultimately, 1H NMR (Levine and Hicks, 1971) and X-ray crystallography (Malmroset al., 1977) were used to support the previously proposed structures. From a biological activitystandpoint, griseofulvin was originally noted to have a unique effect on molds (Grove andMcGowan, 1947). Griseofulvin has been employed to treat fungal infections (Gentles, 1958;
Frontiers in Microbiology | www.frontiersin.org 1 April 2016 | Volume 7 | Article 544

fmicb-07-00544 April 22, 2016 Time: 11:38 # 2
Sica et al. Mass Spectrometry Mapping of Griseofulvin In Situ
FIGURE 1 | The structure of the antifungal agent, griseofulvin (1; red), from Xylaria cubensis (G536). The polyhydroxyanthraquinones (2–6) from Penicilliumrestrictum (G85) were grouped into two categories (purple and blue) based on their distributions in co-culture.
Williams et al., 1958), notably dermatophytosis (ringworm),and ultimately became a commercialized product in 1975 (e.g.,Fulvicin, Gris-PEG, Grifulvin V). More recently, griseofulvin hasshown potential by inhibiting the proliferation of cancer cellsbut with low general toxicity (Ho et al., 2001; Kim et al., 2011;Liéby-Muller et al., 2015).
As an antifungal agent, griseofulvin is fungistatic (Robinson,1960; Corvis et al., 2006) as opposed to fungicidal. This denotesthat it inhibits fungal growth, rather than kills competingfungi. While this inhibition has been observed biologicallyvia agar-based disk diffusion assays (Nweze et al., 2010), thespatial and temporal distribution of its chemistry has neverbefore been visualized. Advances in ambient mass spectrometrytechniques, such as mass spectrometry imaging, have allowedfor the mapping of secondary metabolites in situ (Hsu andDorrestein, 2014; Jarmusch and Cooks, 2014). However, only afew recent studies have explored mass spectrometry mappingexperiments of fungi in situ (Sica et al., 2014, 2015), and evenfewer have attempted to understand the chemical interactionsbetween competing microbial cultures (Moree et al., 2013).
The popular ambient ionization mass spectrometrytechniques include matrix assisted laser desorption electrosprayionization (MALDI), desorption electrospray ionization (DESI),and nanoDESI to achieve surface sampling and mapping ofmetabolites directly on fungal cultures. While effective, eachof these techniques is not without limitations. Comparatively,MALDI provides superior spatial resolution, but it often requiresthe application of a matrix to the sample, which can cause ionsuppression when dealing with small molecules. Also, it destroysthe sample during the laser desorption/ionization process, thuslimiting repeat analysis of a growing fungal culture. DESI isless destructive, but the gas and solvent pressures used for thissystem can manipulate the surface of the fungal culture and itssurrounding environment, making it difficult to analyze directly(Sica et al., 2014; Tata et al., 2015). NanoDESI overcomes some ofthese issues by forming a liquid microjunction with the surface
of the culture. This technique is even less abrasive than DESIand more amenable for surface sampling of a fungus and itssurrounding agar. However, certain characteristics, such as aerialfungal hyphae and guttates (liquid droplets; Figueroa et al.,2014), have been known to clog the system (Watrous et al., 2012).Furthermore, both DESI and nanoDESI are not amenable to thenatural heterogeneous topography of a fungal culture (Sica et al.,2014, 2015).
To overcome these issues, a droplet–liquid microjunction–surface sampling probe (droplet–LMJ–SSP) (Kertesz and VanBerkel, 2010, 2013) was optimized to sample and map thesecondary metabolites of fungal cultures in situ (Sica et al.,2015). This technique is robust and provides a non-destructivesampling system that is tolerant of the topography that fungalcultures possess. Additionally, it has great ionization efficiencyand reliability due to its use of electrospray ionization (ESI). Theincorporation of liquid chromatography is also beneficial, sinceit provides mutually supportive data, including retention timeand UV data, when analyzing fungal metabolites. The summationof these data, and the ability to separate complex mixtures viachromatography, imparts a high degree of confidence whenassigning structures.
Previously, griseofulvin was discovered from xylariaceousendophytes, an important taxonomic group of fungi (Park et al.,2005; Richardson et al., 2014). Endophytes of the Xylaria generatemorphologically distinct stromatic outgrowths, but the spatialdistribution of secondary metabolites throughout the stromais poorly understood (Stadler et al., 2006; Bills et al., 2012;Pažoutová et al., 2013). Recently, fungal endophytes from thetree Asimina triloba were isolated and revealed several speciesof xylariaceous fungi, one of which biosynthesized griseofulvin.Mapping the chemical entities of this fungus as it interactswith a competing fungus in situ can begin to answer a seriesof ecological questions that may be lost through a traditionalnatural products extraction protocol: where are the metabolitesdistributed (spatial), when is each metabolite formed (temporal),
Frontiers in Microbiology | www.frontiersin.org 2 April 2016 | Volume 7 | Article 544

fmicb-07-00544 April 22, 2016 Time: 11:38 # 3
Sica et al. Mass Spectrometry Mapping of Griseofulvin In Situ
what metabolites are interacting (qualitative), how much ofeach metabolite is produced (quantitative), why do the fungiproduce them (function), and which fungus is most affectedby the interaction (target). This project sought to probe thesequestions by using the droplet–LMJ–SSP for direct analysis of agriseofulvin-producing endophytic fungus.
MATERIALS AND METHODS
Isolation of Fungal CulturesBoth fungal species employed in this study were isolatedas endophytes from surface sterilized plant tissue segments.Fungal strain G536 was isolated from surface sterilized twigsof paw paw (A. triloba (L.) Dunal, Annonaceae) collectedfrom Pfafftown, NC, USA (36◦09′58.8′′N 80◦24′18.6′′W).Fungal strain G85 was isolated from surface sterilized stems ofa milk thistle [Silybum marianum (L.) Gaertn. Asteraceae](Figueroa et al., 2014). Isolation of fungal endophyteswas performed using methodology described previously(Vandermolen et al., 2013; Raja et al., 2015b). These fungalcultures are maintained at the University of North Carolina atGreensboro, Department of Chemistry and Biochemistry FungalCulture Collection, under voucher numbers G536 and G85,respectively.
Identification of Fungal CulturesBoth strains were identified via morphological and molecularmethods. Since the former could only provide informationregarding the genus of the fungal isolates, molecular data wereused to obtain a more complete identification.
For strain G536, the partial ribosomal polymerase II subunit2 (RPB2) gene was amplified using primers RPB2-5f and RPB2-7cR primers (Liu et al., 1999). DNA extraction, PCR amplificationand Sanger sequencing was performed using protocols outlinedpreviously (Malkus et al., 2006; Figueroa et al., 2014). Typically,we acquire genomic DNA from 2 week old cultures on PDA(El-Elimat et al., 2014; Figueroa et al., 2014); however, this provedchallenging for culture G536 and each attempt to acquire DNAfrom 2 week old cultures proved unsuccessful. Interestingly, toovercome this challenge, DNA was acquired from a younger(1 week) culture grown on 10 ml of YESD. Methods utilizedfor the molecular identification of strain G85 have been outlinedpreviously (Figueroa et al., 2014).
Two forward and reverse contigs of the partial RPB2 regionswere obtained for strain G536 and were assembled and editedusing Sequencher v5.3 (Gene Codes Corporation, Ann Arbor,MI, USA). The consensus sequence was then submitted to NCBIGenBank database via BLAST search to obtain matches withidentical sequences for subsequent phylogenetic analysis. TheBLAST search revealed Xylaria cubensis (GQ848365, GQ848364,GQ848366, and GQ853017), as the top match with high coverageand percent identity values. Therefore, these sequences, alongwith other RPB2 sequences of Xylaria obtained for a recent multi-gene phylogenetic evaluation of Xylariaceae (Hsieh et al., 2010),were downloaded and incorporated into a multiple alignment
for maximum likelihood (ML) analysis with RAxML usingpreviously described methods (Raja et al., 2015a).
In addition to the RPB2 gene, the entire ITS regionwas PCR-amplified using primer combinations ITS5 andITS4 (White et al., 1990; Gardes and Bruns, 1993) using PCRamplification protocols defined previously (Figueroa et al.,2014). A forward and reverse contig was obtained as aboveusing Sequencher. The ITS sequence was then subjected toa BLAST search using NCBI GenBank database. Based onthis, the closest hits were members of the genus X. cubensis,Ascomycota [X. cubensis (Mont.) Fr., GenBank GU991523;Identities = 386/392 (98%); Gaps = 0/392 (0%), X. cubensisGenBank AB625440; Identities = 383/392 (98%); Gaps = 0/392(0%)]. In addition, our ITS sequence also showed high coverageand percent identity values with 26 unidentified sequences ofSordariomycetes, Ascomycota [GenBank JQ761856, JQ761796,JQ761749, JQ761744, JQ761693, JQ761562, JQ761423, JQ761405,JQ761381, JQ760963, JQ760763, JQ760481, JQ760128, JQ761454,JQ760138, JQ761695, JQ761549, JQ761384, JQ761371, JQ761326,JQ761317, JQ760708, JQ760193, JQ761847, JQ761823, JQ761727;Identities = 391/392 (99%); Gaps = 0/392 (0%)]. Interestingly,these ITS sequences were isolated as endophytes from lichenfungi (endolichenic) collected from Highlands Biological Station,North Carolina (U’Ren et al., 2012), which was within 200 milesfrom where fungal culture G536 was collected. The top BLASTmatches were downloaded and incorporated into a multiplealignment for ML analysis with RAxML as above.
Fermentation of Fungal CulturesIn preparation for chemical extraction, G536 was grown onrice, as this has been shown to be an efficient medium for theproduction of secondary metabolites in culture (Vandermolenet al., 2013). To make seed cultures for inoculating rice, a piece offresh culture grown in potato dextrose (PD) (Difco) or 2% maltextract (ME) (Difco) media was excised from the leading edge ofthe colony and transferred to a liquid seed medium containing2% soy peptone, 2% dextrose, and 1% yeast extract (YESD; 5 gof yeast extract, 10 g of soy peptone, and 10 g of D-glucose in500 ml distilled water). Following incubation for 7 days at 22◦Cwith agitation, the culture was used to inoculate 10 g of rice mediaprepared using 30 ml of distilled H2O and autoclaved in a 250 mlErlenmeyer flask. This screener scale fermentation was incubatedat 22◦C for 14–21 days prior to chemical extraction. For large-scale production of fungal cultures, four 250 ml Erlenmeyer flaskscontaining 10 g of rice were inoculated using one seed culture foreach flask.
Extraction of Fungal CultureThe fungal culture, coded G536, was extracted using a previouslyreported procedure (Ayers et al., 2011; Figueroa et al., 2012;El-Elimat et al., 2014). Briefly, the fungus was extracted byadding 60 ml of MeOH–CHCl3 (1:1) to a 250 ml flaskcontaining 10 g of rice with endophytic fungal growth. Thefungus was chopped with a spatula before shaking overnight(∼16 h) at ∼100 rpm at room temperature. Using vacuumfiltration, the sample was filtered, and the remaining residuewas washed with MeOH. To the filtrate, 90 ml of CHCl3
Frontiers in Microbiology | www.frontiersin.org 3 April 2016 | Volume 7 | Article 544

fmicb-07-00544 April 22, 2016 Time: 11:38 # 4
Sica et al. Mass Spectrometry Mapping of Griseofulvin In Situ
and 150 ml of H2O were added. The mixture was stirred for30 min and then transferred into a separatory funnel. Theorganic layer was drawn off and evaporated to dryness. Thedried organic extract was re-constituted in 100 ml of MeOH–CH3CN (1:1) and 100 ml of hexanes and transferred to aseparatory funnel. The biphasic solution was shaken vigorously.The MeOH–CH3CN layer was evaporated to dryness undervacuum (69 mg).
Isolation and Identification ofGriseofulvinThe extracted material (69 mg) was dissolved in CHCl3,adsorbed onto Celite 545, and fractionated via normal phase flashchromatography on a CombiFlash Rf system using a 4 g RediSepRf Si-gel Gold column (Teledyne-Isco, Lincoln, NE, USA). Thegradient solvent system was hexane–CHCl3–MeOH at a flow rateof 18 ml/min with 72.9 column volumes over 19.4 min. Thisafforded three fractions: fraction 1 (0.8 mg), fraction 2 (10 mg),and fraction 3 (50 mg). Fraction 2 was subjected to preparativeHPLC using a gradient system of 40 to 100% CH3CN in H2O(acidified with 0.1% formic acid) over 30 min at a flow rate of21.1 ml/min on a Kinetex C18 column (Phenomenex, Torrance,CA, USA; 5 µm; 250 mm × 21.2 mm). Griseofulvin elutedat 6.9 min and yielded 1.06 mg. The structure of griseofulvinwas verified (Supplementary Figure S1; Supplementary Table S1)via NMR on a JEOL ECS-400 NMR spectrometer (400 MHz;JEOL Ltd., Tokyo, Japan) and HRMS on a QExactive Plus(Thermo Fisher Scientific, San Jose, CA, USA) in positiveionization mode coupled to an Acquity UPLC system (WatersCorp., Milford, MA, USA); literature values were compared forstructural confirmation (Grove et al., 1952; Levine and Hicks,1971; Simpson and Holker, 1977). The 1H and 13C NMR dataare included to update the literature (Supplementary Figure S1;Supplementary Table S1), and this material was used as a standardfor the mapping experiments.
LC-MS MethodologyThe QExactive Plus mass spectrometer was scanned across arange from m/z 225 to 2000 at a resolution of 70,000. The voltagefor both positive and negative ionization modes were set to 3.7 kV,with a nitrogen sheath gas set to 25 arb, and an auxiliary gas setto 5 arb. The S–Lens RF level was set to 50.0 with a capillarytemperature at 350◦C. The flow rate of the UPLC was set to0.3 ml/min using a BEH C18 (2.1 mm × 50 mm × 1.7 µm)equilibrated at 40◦C. The mobile phase consisted of FisherOptima LC–MS grade CH3CN–H2O (acidified with 0.1% formicacid), starting at 15% CH3CN and increasing linearly to 100%CH3CN over 8 min. It was held at 100% CH3CN for 1.5 minbefore returning to starting conditions for re-equilibration. ThePDA was set to acquire from 200 to 500 nm with 4 nm resolution.
Solid Media Co-cultivationFungal cultures of X. cubensis (G536) and P. restrictum(G85) were transferred separately from PDA solid media withantibiotics onto three plates of MEA separately to act ascontrols. Simultaneously, six plates of MEA were prepared for
co-cultivation of X. cubensis (G536) and P. restrictum (G85).X. cubensis was transferred first and allowed to grow for10 days because P. restrictum grows relatively fast compared toX. cubensis. After initiating the co-culture experiments, the plateswere then parafilmed and allowed to grow for 30 days, untilthe cultures began to grow toward each other. Concomitantly,the same experiment was performed using PDA and SDA(Sabouraud Dextrose). Visually, the zone of inhibition was mostnotable in the MEA plates (data not shown). Thus, the co-cultures grown on MEA were subsequently sampled by droplet–LMJ–SSP.
Surface Sampling and MappingThe dropletProbe Premium software converted a CTC/LEAPHTC PAL auto–sampler (LEAP Technologies Inc.) into adroplet–liquid microjunction–surface sampling probe (droplet–LMJ–SSP) (Kertesz and Van Berkel, 2010, 2013; Sica et al., 2015).This probe performs 5 µl microextractions using Fisher OptimaLC–MS grade MeOH–H2O (1:1). Droplets were dispensed ontothe surface of the fungal cultures at a rate of 2 µl/s, held on thesurface for 2 s, and withdrawn back into the syringe at the samerate. This extraction process was performed in triplicate using thesame droplet. The droplet was then injected into the UPLC-MSsystem. The relative concentrations of the metabolites, calculatedusing the dropletProbe Premium software via the area of theexact mass chromatograms for each metabolite at their specificretention times, were mapped, resulting in a visualization of theirspatial distribution. The heat mapping experiments focused ongriseofulvin (m/z 353.0792± 5 ppm), which eluted at a retentiontime of 4.49 ± 0.05 min when using the droplet–LMJ–SSP–UPLC–MS system.
Stroma SectioningThe fungal culture G536 was inoculated in 10 ml liquid YESDmedia for 7 days then poured into an autoclaved Petri dishcontaining autoclaved rice. The Petri dish was then placed insidea sterile plant tissue-cultivating container (Plant Con R©), andsealed with parafilm. The plant container provides a sterileenvironment for the stroma producing fungus to grow on rice-based media. Stroma began appearing after 2–3 weeks, but thecultures were allowed to grow for 5.5 weeks (Figure 2).
Stroma were then cut and removed from the Petri dish usinga sterile scalpel and forceps. Three individual stroma (one thin[(∼40 mm × 2 mm), one medium (∼50 mm × 4 mm), and onethick (∼50 mm× 6 mm)] were removed from the fungal cultureG536. Each stroma was cut into three segments: tip, middle,and base (Figure 3; Supplementary Figure S2). The three whitetips, the three mid-sections, and the three bases were combinedand placed into separate vials and weighed. This procedure wasrepeated two more times resulting in three groups that sampled atotal of nine stromata (Supplementary Table S2).
To each vial, 5 ml of MeOH–H2O (1:1) were added and shakenovernight (∼16 h). The supernatant was then drawn off, placed ina weighed vial and dried under a stream of nitrogen. An aliquotof each dried extract was prepared in MeOH–H2O (1:1) to aconcentration of 2 mg/ml and subjected to LC-MS analysis.
Frontiers in Microbiology | www.frontiersin.org 4 April 2016 | Volume 7 | Article 544

fmicb-07-00544 April 22, 2016 Time: 11:38 # 5
Sica et al. Mass Spectrometry Mapping of Griseofulvin In Situ
FIGURE 2 | Images of G536 grown in a glass Petri dish and placed in a sterile plant tissue-cultivating container (Plant Con R©) to maintain sterileconditions while providing room for stroma growth.
FIGURE 3 | A representative group (Group 3) of three stroma and their respective segments. Each segment ranged from 9 to 20 mm.
RESULTS
Molecular AnalysisStromata were examined for sporulating structures, but we wereunable to observe any ascospores, asci or conidia. Thus, speciesdelimitation based on morphological characters in cultures ofendophytic Xylaria was difficult because of a lack of diagnosticcharacters; therefore, molecular data were used for speciesidentification.
Based on RAxML analysis using RPB2 sequences(Supplementary Figure S3), the strain G536 was identifiedas X. cubensis. RPB2 sequences of strain G536 were nested withinthe X. cubensis aggregate (Hsieh et al., 2010) with 80% RAxMLbootstrap support. X. cubensis (G536) is sister to GQ848365, aX. cubensis isolate collected from the Great Smoky MountainsNational Park, and forms a monophyletic clade with 100%
RAxML bootstrap support with other collections of X. cubensisfrom different geographical locations, including Russia, FrenchWest Indies, and Papua New Guinea (Supplementary Figure S3).The phylogenetic tree obtained using ITS sequences supportedthe RPB2 results. Strain G536 was nested in a clade containingother identified X. cubensis sequences, including authenticatevoucher sequences of X. cubensis (GU373810 and GU991523;Supplementary Figure S4). The sequence data were deposited inthe GenBank (KU560914, KU560915, KU560916).
Spatial Distribution of Griseofulvin onX. cubensisThe griseofulvin-producing fungus, X. cubensis, was subjectedto surface sampling analysis via the droplet–LMJ–SSP, and thespatial distribution of griseofulvin was mapped. X. cubensis wasgrown on MEA for 2.5 weeks. The culture was then sampled
Frontiers in Microbiology | www.frontiersin.org 5 April 2016 | Volume 7 | Article 544
fmicb-07-00544 April 22, 2016 Time: 11:38 # 6
Sica et al. Mass Spectrometry Mapping of Griseofulvin In Situ
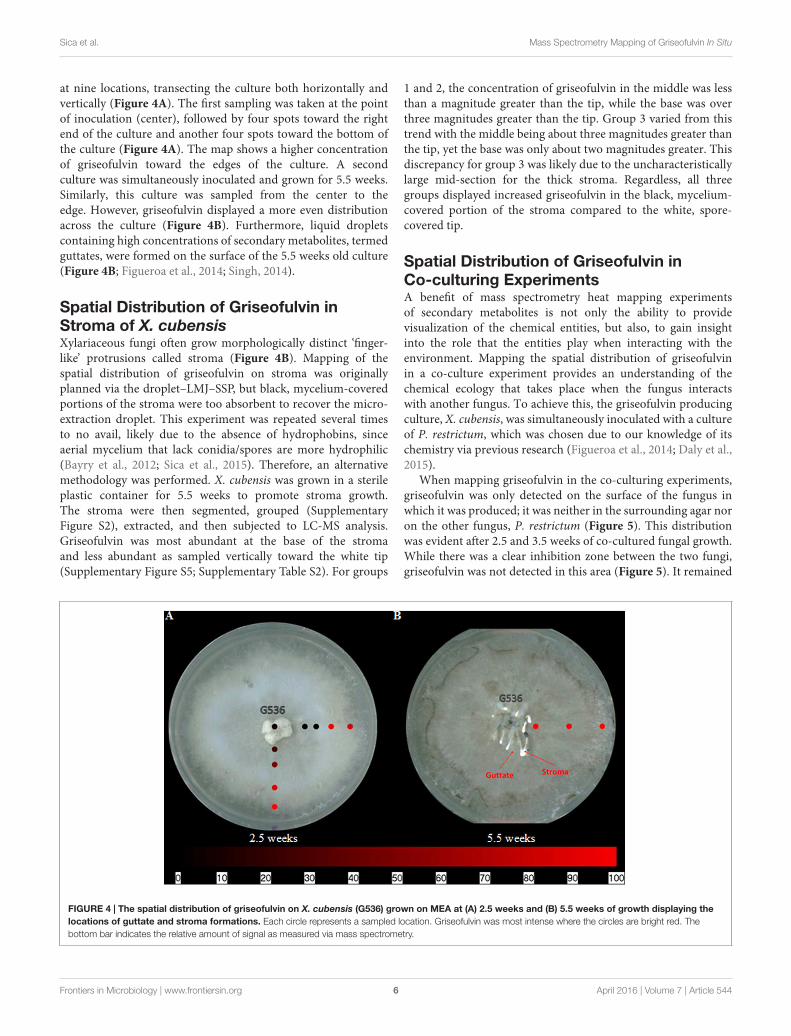
at nine locations, transecting the culture both horizontally andvertically (Figure 4A). The first sampling was taken at the pointof inoculation (center), followed by four spots toward the rightend of the culture and another four spots toward the bottom ofthe culture (Figure 4A). The map shows a higher concentrationof griseofulvin toward the edges of the culture. A secondculture was simultaneously inoculated and grown for 5.5 weeks.Similarly, this culture was sampled from the center to theedge. However, griseofulvin displayed a more even distributionacross the culture (Figure 4B). Furthermore, liquid dropletscontaining high concentrations of secondary metabolites, termedguttates, were formed on the surface of the 5.5 weeks old culture(Figure 4B; Figueroa et al., 2014; Singh, 2014).
Spatial Distribution of Griseofulvin inStroma of X. cubensisXylariaceous fungi often grow morphologically distinct ‘finger-like’ protrusions called stroma (Figure 4B). Mapping of thespatial distribution of griseofulvin on stroma was originallyplanned via the droplet–LMJ–SSP, but black, mycelium-coveredportions of the stroma were too absorbent to recover the micro-extraction droplet. This experiment was repeated several timesto no avail, likely due to the absence of hydrophobins, sinceaerial mycelium that lack conidia/spores are more hydrophilic(Bayry et al., 2012; Sica et al., 2015). Therefore, an alternativemethodology was performed. X. cubensis was grown in a sterileplastic container for 5.5 weeks to promote stroma growth.The stroma were then segmented, grouped (SupplementaryFigure S2), extracted, and then subjected to LC-MS analysis.Griseofulvin was most abundant at the base of the stromaand less abundant as sampled vertically toward the white tip(Supplementary Figure S5; Supplementary Table S2). For groups
1 and 2, the concentration of griseofulvin in the middle was lessthan a magnitude greater than the tip, while the base was overthree magnitudes greater than the tip. Group 3 varied from thistrend with the middle being about three magnitudes greater thanthe tip, yet the base was only about two magnitudes greater. Thisdiscrepancy for group 3 was likely due to the uncharacteristicallylarge mid-section for the thick stroma. Regardless, all threegroups displayed increased griseofulvin in the black, mycelium-covered portion of the stroma compared to the white, spore-covered tip.
Spatial Distribution of Griseofulvin inCo-culturing ExperimentsA benefit of mass spectrometry heat mapping experimentsof secondary metabolites is not only the ability to providevisualization of the chemical entities, but also, to gain insightinto the role that the entities play when interacting with theenvironment. Mapping the spatial distribution of griseofulvinin a co-culture experiment provides an understanding of thechemical ecology that takes place when the fungus interactswith another fungus. To achieve this, the griseofulvin producingculture, X. cubensis, was simultaneously inoculated with a cultureof P. restrictum, which was chosen due to our knowledge of itschemistry via previous research (Figueroa et al., 2014; Daly et al.,2015).
When mapping griseofulvin in the co-culturing experiments,griseofulvin was only detected on the surface of the fungus inwhich it was produced; it was neither in the surrounding agar noron the other fungus, P. restrictum (Figure 5). This distributionwas evident after 2.5 and 3.5 weeks of co-cultured fungal growth.While there was a clear inhibition zone between the two fungi,griseofulvin was not detected in this area (Figure 5). It remained
FIGURE 4 | The spatial distribution of griseofulvin on X. cubensis (G536) grown on MEA at (A) 2.5 weeks and (B) 5.5 weeks of growth displaying thelocations of guttate and stroma formations. Each circle represents a sampled location. Griseofulvin was most intense where the circles are bright red. Thebottom bar indicates the relative amount of signal as measured via mass spectrometry.
Frontiers in Microbiology | www.frontiersin.org 6 April 2016 | Volume 7 | Article 544

fmicb-07-00544 April 22, 2016 Time: 11:38 # 7
Sica et al. Mass Spectrometry Mapping of Griseofulvin In Situ
FIGURE 5 | The spatial distribution of griseofulvin from X. cubensis (G536) while grown in co-culture with P. restrictum (G85) at (A) 2.5 weeks and (B)3.5 weeks. Each circle represents a sampled location. Griseofulvin was most intense where the circles are bright red. The bottom bar indicates the relative amountof signal as measured via mass spectrometry.
on the surface of X. cubensis, similar to its spatial distributionwhen grown in isolation (Figure 4). Furthermore, X. cubensis didnot display any physical changes to its growth patterns, besidesthe inhibition zone.
The Co-culturing Effects on theCompeting P. restrictum CultureIn addition to mapping the spatial distribution of griseofulvin,it is important to understand the toll that is taken onthe other fungal culture. By mapping the metabolites ofP. restrictum, the inhibitory effects of griseofulvin can befurther understood. In a previous study of P. restrictum, aseries of polyhydroxyanthraquinones were identified (Figueroaet al., 2014; Daly et al., 2015). In this study, P. restrictumwas grown on agar for 2.5 weeks, and five of its secondarymetabolites (compounds 2–6) (Figure 1) were readily detectedon the surface using the droplet–LMJ–SSP (Figure 6A). Whilethe metabolites were detected on the surface of the mycelium,their signals were a magnitude greater on the surface of theagar (Supplementary Figure S6). Furthermore, another plate ofthis culture was grown for 5.5 weeks, and similar distributions(Figure 6B) and magnitude differences (Supplementary FigureS7) were observed.
Visualizing the secondary metabolites from P. restrictum inisolation created a baseline of how this fungal culture distributesits metabolites. Subsequently, by mapping the metabolites ofP. restrictum in co-culture with X. cubensis, the effects ofgriseofulvin on a competing fungus could be probed. The fivecompounds from P. restrictum were grouped into two categories(compounds 2–3; purple and compounds 4–6; blue; Figure 1)that were determined by their distribution patterns in co-culture (Figure 7). As a fungal isolate, P. restrictum metabolites
(2–6) were exuded into the surrounding agar (Figure 6);however, in co-culture with X. cubensis, only three of the fivecompounds (4–6; blue) continued this trend by being detectedon both sides of the colony (Figure 7A). The other twometabolites (2–3; purple) were not detected in the interactionzone, but still remain exuded into the media on the sideof the colony farthest from the griseofulvin-producing fungus(Figure 7B).
As the co-cultures continued to grow for another weekto a total of 3.5 weeks, the pattern continued (Figure 8A).Griseofulvin still remained primarily on X. cubensis, whilesome of the P. restrictum (G85) metabolites were no longerdetectable (2–3; purple). By 5.5 weeks, griseofulvin was detectedon both the original X. cubensis colony and where the originalP. restrictum colony was inoculated (Figure 8B). This wasattributed to the observation that new growths of X. cubensishad begun to grow where the original P. restrictum colonywas, as indicated by the formation of guttates and stromacontaining griseofulvin. This suggests how griseofulvin maybe used by X. cubensis to outcompete other fungi and thenpropagate.
Visually, the growth of the competing culture, P. restrictum,began to lose color after 2.5 weeks. (Figure 9A). The leftmost edge of P. restrictum began to turn white, something thatwas not observed when this fungus was grown in isolation.The discoloration continued to grow, eventually turning theentire P. restrictum colony white after 3.5 weeks of co-culturing (Figure 9B). After 5.5 weeks, the P. restrictumculture failed to grow further and the griseofulvin-producer,X. cubensis, began to grow new colonies on top of P. restrictum(Figure 9C). Guttates formed on both the original and thenew growths of X. cubensis. Furthermore, the formation ofstroma, morphological characteristics of fungi of this family, were
Frontiers in Microbiology | www.frontiersin.org 7 April 2016 | Volume 7 | Article 544

fmicb-07-00544 April 22, 2016 Time: 11:38 # 8
Sica et al. Mass Spectrometry Mapping of Griseofulvin In Situ
FIGURE 6 | The spatial distribution of both groups of polyhydroxyanthraquinones on fungal isolates of P. restrictum (G85) at (A) 2.5 weeks and (B)5.5 weeks. The color coding (blue and purple) corresponds to the structures in Figure 1. Each circle represents a sampled location. The polyhydroxyanthraquinoneswere most intense where the blue or purple circles were brightest. The bottom bar indicates the relative amount of signal as measured via mass spectrometry.
visible on both colonies as well. By 8 weeks, the stromata fromX. cubensis were prevalent on both the original colony and thenew growths that were on top of the presumed dead P. restrictumcolony (Figure 9D).
DISCUSSION
Spatial Distribution of Griseofulvin onX. cubensisThe heat mapping experiments of the griseofulvin-producer,X. cubensis (G536), showed a relative concentration ofgriseofulvin toward the edges after 2.5 weeks of growth(Figure 4A). As the culture grew for 5.5 weeks, the distributionappeared more uniform across the culture (Figure 4B). It ishypothesized that griseofulvin is most abundant in the youngersections of a colony (i.e., the outer edges) to facilitate continued
growth, but evens out when the culture is no longer growinglaterally.
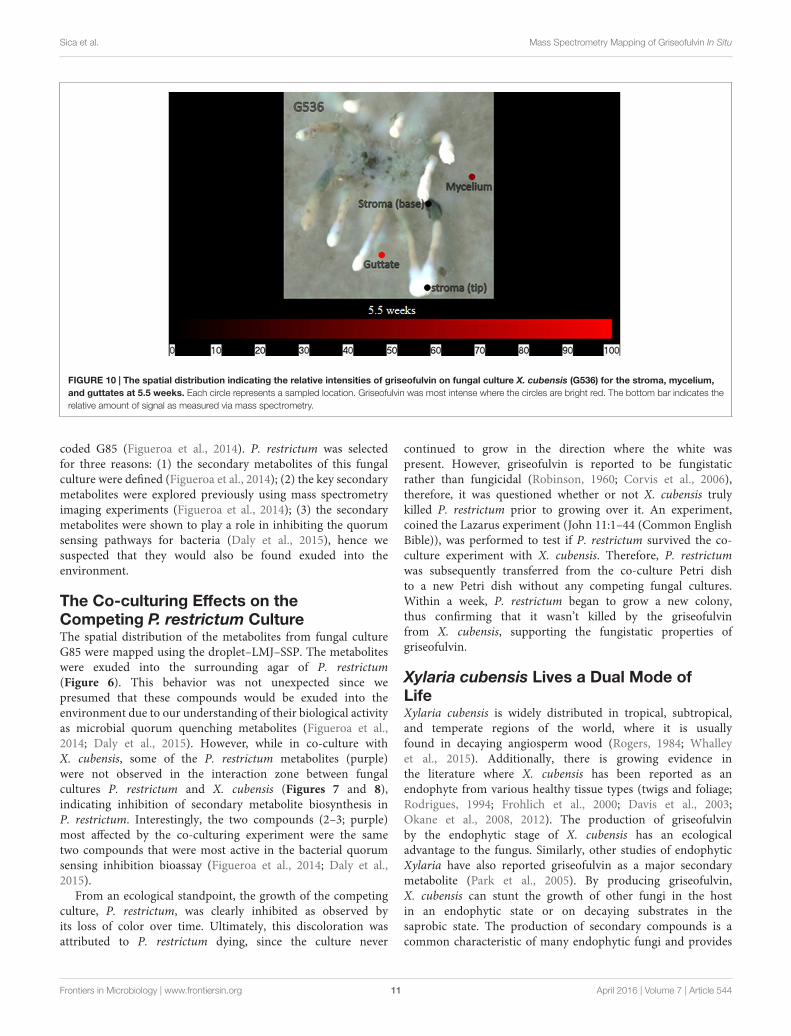
Additionally, at 3.5 weeks, the culture began to formstromata and produce guttates (i.e., liquid droplets; Figueroaet al., 2014; Singh, 2014) on its surface. On a culture at5.5 weeks, surface sampling analysis was performed using thedroplet–LMJ–SSP to analyze the stromata and guttates. Thesignal of griseofulvin on a guttate was over two magnitudesgreater than that of a stroma (both base and tip) and abouthalf a magnitude greater than on the mycelium (Figure 10;Supplementary Figure S8). This finding continues to supporta previous hypothesis that guttates are concentrated dropletsof metabolites exuded into their environment (Wang et al.,2010; Sica et al., 2015; Paguigan et al., 2016). In this culture,the stroma were immature, thus the black, mycelium-coveredbody was not as hydrophilic as it was for the older stroma. Assuch, the droplet–LMJ–SSP was able to carry out the analysisin situ.
Frontiers in Microbiology | www.frontiersin.org 8 April 2016 | Volume 7 | Article 544

fmicb-07-00544 April 22, 2016 Time: 11:38 # 9
Sica et al. Mass Spectrometry Mapping of Griseofulvin In Situ
FIGURE 7 | The spatial distribution of the (A) blue and (B) purple groups of polyhydroxyanthraquinones on fungal isolates of P. restrictum (G85) whilegrown in co-culture with X. cubensis (G536) at 2.5 weeks. The color coding (blue and purple) corresponds to the structures in Figure 1. Each circle representsa sampled location. The polyhydroxyanthraquinones were most intense where the blue or purple circles were brightest. The bottom bar indicates the relative amountof signal as measured via mass spectrometry.
FIGURE 8 | Heat map of griseofulvin (red) and the P. restrictum (G85) metabolites (blue group only; purple metabolites were undetectable) at (A)3.5 weeks and (B) 5.5 weeks. The heights of the bars are relative to their intensity from the HRMS data.
Spatial Distribution of Griseofulvin inStroma of X. cubensisInitially, the stroma were to be analyzed via the droplet–LMJ–SSP to give a heat map from the base of a stroma to the tip.However, upon sampling the black, mycelium-covered portionsof the stroma, the droplet was quickly absorbed in the stroma,rendering the droplet unrecoverable. The white tips of the stromawere amenable to droplet recovery, but not the black regionsof the stroma, which were more heavily covered by mycelium.Various methods were explored in an effort to directly sample the
stroma using the droplet–LMJ–SSP but all proved unsuccessful.Three of these stroma modifications included: (1) freezing stromain liquid nitrogen, (2) drying stroma in a desiccator, or (3) cuttingstroma open longitudinally. None of these methods workedand all resulted in the droplet being absorbed into the stroma.Combinations of all of these methods were also attempted withno success. This led to the more traditional procedure of cuttingthe stroma into three segments, extracting, and then analyzingvia LC-MS. The results indicated that griseofulvin was mostabundant at the base compared to the tip. Since griseofulvinwas concentrated toward the edges of the mycelial growth
Frontiers in Microbiology | www.frontiersin.org 9 April 2016 | Volume 7 | Article 544

fmicb-07-00544 April 22, 2016 Time: 11:38 # 10
Sica et al. Mass Spectrometry Mapping of Griseofulvin In Situ
FIGURE 9 | The visible discoloration of P. restrictum (G85) while in co-culture with the griseofulvin-producer, X. cubensis (G536), at (A) 2.5 weeks and(B) 3.5 weeks. The discolored regions of P. restrictum (G85) are circled in red. The visible expansion of X. cubensis (G536) while in co-culture with P. restrictum(G85) at (C) 5.5 weeks and (D) 8 weeks. The guttates were attributed to X. cubensis (G536) due to the detection of griseofulvin. The stroma were attributed toX. cubensis (G536) since P. restrictum (G85) does not produce stroma.
(Figure 4A), compounded with the observation that griseofulvinwas concentrated toward the base of the stroma, we hypothesizedthat the stroma were basipetal (i.e., youngest at the base of thestromata).
Spatial Distribution of Griseofulvin inCo-culturing ExperimentsSince griseofulvin is known to be fungistatic and not fungicidal,we hypothesized that griseofulvin would reside mostly onthe surface of X. cubensis, rather than actively being exudedinto its surroundings. This would inhibit the growth of otherfungi, rather than kill them. This contrasts a phenomenon thatwas previously reported when mapping the spatial distributionof the fungicidal compound, iturin (Klich et al., 1994),from a coral microbe (Moree et al., 2013) in co-culture
with a fungus. In that case, iturin was exuded into themedia, thus similarly inhibiting the fungal growth and theproduction of fungal secondary metabolites (Moree et al.,2013).
The spatial distribution patterns of griseofulvin as an isolatedfungal culture (Figure 4) and as part of a co-culture experiment(Figure 5) displayed minimal changes. Griseofulvin appearedto remain on the surface of X. cubensis, rather than exudinginto the surrounding media or on the competing fungus.These mapping experiments support the fungistatic abilityof griseofulvin by remaining on the griseofulvin-producingfungus.
The fungistatic ability of griseofulvin was explored furtherby growing X. cubensis along with another fungus. The fungusselected was a non-xylariaceous endophyte from S. marianum(milk thistle) and was previously identified as P. restrictum,
Frontiers in Microbiology | www.frontiersin.org 10 April 2016 | Volume 7 | Article 544
fmicb-07-00544 April 22, 2016 Time: 11:38 # 11
Sica et al. Mass Spectrometry Mapping of Griseofulvin In Situ
FIGURE 10 | The spatial distribution indicating the relative intensities of griseofulvin on fungal culture X. cubensis (G536) for the stroma, mycelium,and guttates at 5.5 weeks. Each circle represents a sampled location. Griseofulvin was most intense where the circles are bright red. The bottom bar indicates therelative amount of signal as measured via mass spectrometry.
coded G85 (Figueroa et al., 2014). P. restrictum was selectedfor three reasons: (1) the secondary metabolites of this fungalculture were defined (Figueroa et al., 2014); (2) the key secondarymetabolites were explored previously using mass spectrometryimaging experiments (Figueroa et al., 2014); (3) the secondarymetabolites were shown to play a role in inhibiting the quorumsensing pathways for bacteria (Daly et al., 2015), hence wesuspected that they would also be found exuded into theenvironment.
The Co-culturing Effects on theCompeting P. restrictum CultureThe spatial distribution of the metabolites from fungal cultureG85 were mapped using the droplet–LMJ–SSP. The metaboliteswere exuded into the surrounding agar of P. restrictum(Figure 6). This behavior was not unexpected since wepresumed that these compounds would be exuded into theenvironment due to our understanding of their biological activityas microbial quorum quenching metabolites (Figueroa et al.,2014; Daly et al., 2015). However, while in co-culture withX. cubensis, some of the P. restrictum metabolites (purple)were not observed in the interaction zone between fungalcultures P. restrictum and X. cubensis (Figures 7 and 8),indicating inhibition of secondary metabolite biosynthesis inP. restrictum. Interestingly, the two compounds (2–3; purple)most affected by the co-culturing experiment were the sametwo compounds that were most active in the bacterial quorumsensing inhibition bioassay (Figueroa et al., 2014; Daly et al.,2015).
From an ecological standpoint, the growth of the competingculture, P. restrictum, was clearly inhibited as observed byits loss of color over time. Ultimately, this discoloration wasattributed to P. restrictum dying, since the culture never
continued to grow in the direction where the white waspresent. However, griseofulvin is reported to be fungistaticrather than fungicidal (Robinson, 1960; Corvis et al., 2006),therefore, it was questioned whether or not X. cubensis trulykilled P. restrictum prior to growing over it. An experiment,coined the Lazarus experiment (John 11:1–44 (Common EnglishBible)), was performed to test if P. restrictum survived the co-culture experiment with X. cubensis. Therefore, P. restrictumwas subsequently transferred from the co-culture Petri dishto a new Petri dish without any competing fungal cultures.Within a week, P. restrictum began to grow a new colony,thus confirming that it wasn’t killed by the griseofulvinfrom X. cubensis, supporting the fungistatic properties ofgriseofulvin.
Xylaria cubensis Lives a Dual Mode ofLifeXylaria cubensis is widely distributed in tropical, subtropical,and temperate regions of the world, where it is usuallyfound in decaying angiosperm wood (Rogers, 1984; Whalleyet al., 2015). Additionally, there is growing evidence inthe literature where X. cubensis has been reported as anendophyte from various healthy tissue types (twigs and foliage;Rodrigues, 1994; Frohlich et al., 2000; Davis et al., 2003;Okane et al., 2008, 2012). The production of griseofulvinby the endophytic stage of X. cubensis has an ecologicaladvantage to the fungus. Similarly, other studies of endophyticXylaria have also reported griseofulvin as a major secondarymetabolite (Park et al., 2005). By producing griseofulvin,X. cubensis can stunt the growth of other fungi in the hostin an endophytic state or on decaying substrates in thesaprobic state. The production of secondary compounds is acommon characteristic of many endophytic fungi and provides
Frontiers in Microbiology | www.frontiersin.org 11 April 2016 | Volume 7 | Article 544

fmicb-07-00544 April 22, 2016 Time: 11:38 # 12
Sica et al. Mass Spectrometry Mapping of Griseofulvin In Situ
a basis for selection supporting the symbiosis in the host plant(Carroll, 1988). Thus, by inhibiting the growth of other fungi,X. cubensis ensures it can spread its mycelium throughout thehost when its host senesces, at which time it can begin to sustainas a saprobe by decomposing cell wall materials (Petrini et al.,1995; Whalley, 1996); griseofulvin biosynthesis likely imparts acompetitive advantage in the saprobic state as well.
Mass spectrometry mapping experiments enabled thevisualization of how griseofulvin biosynthesis imparts anecological advantage to a fungus, which can lead dual(endophytic/saprobic) modes of life. The measurements of thespatial and temporal production of griseofulvin by endophyticXylaria sp. when in competition with another endophytedemonstrated how endophytes might use secondary metabolitesagainst other microorganisms in nature. Our chemistry datalend support to the hypothesis that Xylaria endophytes arequiet colonizers of their host. Presumably, they use secondarymetabolites, such as griseofulvin, to keep other microbes in check.This allows them to spread within the host, so it can decomposethe plant when it begins to senesce (Petrini et al., 1995; Whalley,1996).
CONCLUSION
Ambient mass spectrometry mapping techniques providedan understanding of the chemical ecology that took placebetween two fungal cultures. For X. cubensis, it was revealedthat griseofulvin was concentrated in the younger tissues of thefungus, typically around 2–3 weeks of development, toward theedges of the mycelial growth and at the base of the stroma.Conversely, P. restrictum excreted the secondary metabolites,polyhydroxyanthraquinones, into the surrounding environmentwith only trace amounts detected on the mycelium. WhenX. cubensis was grown in co-culture with P. restrictum, thespatial and temporal distributions of griseofulvin remainedthe same, but there was a noticeable effect on the distributionof polyhydroxyanthraquinones from P. restrictum. Thebiosyntheses of two of the five polyhydroxyanthraquinoneswere greatly hindered. Eventually, the growth of P. restrictumwas inhibited and X. cubensis began to overtake the culture.Griseofulvin displayed clear signs of having a fungistatic effect
on competing fungi as visualized via mass spectrometry mappingexperiments. By exploring the temporal and spatial distributionsof fungal secondary metabolites through these co-culturingexperiments, the questions of – where (spatial), when (temporal),what (qualitative), how much (quantitative), why (function), andwhich (target) – were probed in detail.
AUTHOR CONTRIBUTIONS
VS carried out the mass spectrometry mapping experiments. Healso helped with the general design of the experiments and thewriting of the manuscript. HR dealt with the mycology aspectsof the science, including molecular identification of fungi andgrowth of the fungi. He also assisted with the writing of themanuscript. ER isolated griseofulvin under the direction of VS.ET assisted with the isolation of the fungal endophyte from theplant. RB prepared the stroma for measurements and maintainedcultures for the co-culture experiments. NO led the project,particularly the experimental design, interpretation of data, andwriting of manuscript.
FUNDING
Fungal culture G85 was first isolated via support from aBiotechnology Research Grant (2011-BRG-1206) from the NorthCarolina Biotechnology Center.
ACKNOWLEDGMENTS
The authors thank Drs. Vilmos Kertesz and Gary J. VanBerkel (Mass Spectrometry and Laser Spectroscopy Group,Chemical Sciences Division, Oak Ridge National Laboratory) forinspiration and guidance with the droplet-LMJ-SSP.
SUPPLEMENTARY MATERIAL
The Supplementary Material for this article can be foundonline at: http://journal.frontiersin.org/article/10.3389/fmicb.2016.00544
REFERENCESAyers, S., Graf, T. N., Adcock, A. F., Kroll, D. J., Matthew, S., Carcache de Blanco,
E. J., et al. (2011). Resorcylic acid lactones with cytotoxic and NF-kappaBinhibitory activities and their structure-activity relationships. J. Nat. Prod. 74,1126–1131. doi: 10.1021/np200062x
Bayry, J., Aimanianda, V., Guijarro, J. I., Sunde, M., and Latge, J. P.(2012). Hydrophobins–unique fungal proteins. PLoS Pathog. 8:e1002700. doi:10.1371/journal.ppat.1002700
Bills, G. F., González-Menéndez, V., Martín, J., Platas, G., Fournier, J., Peršoh, D.,et al. (2012). Hypoxylon pulicicidum sp. nov. (Ascomycota, Xylariales),a pantropical insecticide-producing endophyte. PloS ONE 7:e46687. doi:10.1371/journal.pone.0046687
Brian, P. (1946). A substance causing abnormal development of fungal hyphaeproduced by Penicillium janczewskii Zal. I. Biological assay, production,
and isolation of “curling factor.” Trans. Br. Mycol. Soc. 29, 173–187. doi:10.1016/S0007-1536(46)80042-1
Carroll, G. (1988). Fungal endophytes in stems and leaves: from latent pathogen tomutualistic symbiont. Ecology 69, 2–9. doi: 10.2307/1943154
Corvis, Y., Barzyk, W., Brezesinski, G., Mrabet, N., Badis, M., Hecht, S., et al.(2006). Interactions of a fungistatic antibiotic, griseofulvin, with phospholipidmonolayers used as models of biological membranes. Langmuir 22, 7701–7711.doi: 10.1021/la060998x
Daly, S. M., Elmore, B. O., Kavanaugh, J. S., Triplett, K. D., Figueroa, M.,Raja, H. A., et al. (2015). Omega-hydroxyemodin limits Staphylococcus aureusquorum sensing-mediated pathogenesis and inflammation. Antimicrob. AgentsChemother. 59, 2223–2235. doi: 10.1128/AAC.04564-14
Davis, E. C., Franklin, J. B., Shaw, A. J., and Vilgalys, R. (2003). Endophytic Xylaria(Xylariaceae) among liverworts and angiosperms: phylogenetics, distribution,and symbiosis. Am. J. Bot. 90, 1661–1667. doi: 10.3732/ajb.90.11.1661
Frontiers in Microbiology | www.frontiersin.org 12 April 2016 | Volume 7 | Article 544

fmicb-07-00544 April 22, 2016 Time: 11:38 # 13
Sica et al. Mass Spectrometry Mapping of Griseofulvin In Situ
El-Elimat, T., Raja, H. A., Day, C. S., Chen, W. L., Swanson, S. M., andOberlies, N. H. (2014). Greensporones: Resorcylic acid lactones from an aquaticHalenospora sp. J. Nat. Prod. 77, 2088–2098. doi: 10.1021/np500497r
Figueroa, M., Graf, T. N., Ayers, S., Adcock, A. F., Kroll, D. J., Yang, J., et al. (2012).Cytotoxic epipolythiodioxopiperazine alkaloids from filamentous fungi of theBionectriaceae. J. Antibiot. 65, 559–564. doi: 10.1038/ja.2012.69
Figueroa, M., Jarmusch, A. K., Raja, H. A., El-Elimat, T., Kavanaugh, J. S., Horswill,A. R., et al. (2014). Polyhydroxyanthraquinones as quorum sensing inhibitorsfrom the guttates of Penicillium restrictum and their analysis by desorptionelectrospray ionization mass spectrometry. J. Nat. Prod. 77, 1351–1358. doi:10.1021/np5000704
Frohlich, J., Hyde, K. D., and Petrini, O. (2000). Endophytic fungi associated withpalms. Mycol. Res. 104, 1202–1212. doi: 10.1017/s095375620000263x
Gardes, M., and Bruns, T. D. (1993). ITS primers with enhanced specificity forbasidiomycetes–application to the identification of mycorrhizae and rusts. Mol.Ecol. 2, 113–118. doi: 10.1111/j.1365-294X.1993.tb00005.x
Gentles, J. C. (1958). Experimental ringworm in guinea pigs: Oral treatment withgriseofulvin. Nature 182, 476–477. doi: 10.1038/182476a0
Grove, J. F., MacMillan, J., Mulholland, T. P. C., and Rogers, M. A. T. (1952). 759.Griseofulvin. Part I. J. Chem. Soc. 3949–3958. doi: 10.1039/jr9520003949
Grove, J. F., and McGowan, J. C. (1947). Identity of griseofulvin and curling-factor.Nature 160:574. doi: 10.1038/160574a0
Ho, Y.-S., Duh, J.-S., Jeng, J.-H., Wang, Y.-J., Liang, Y.-C., Lin, C.-H.,et al. (2001). Griseofulvin potentiates antitumorigenesis effects of nocodazolethrough induction of apoptosis and G2/M cell cycle arrest in humancolorectal cancer cells. Int. J. Cancer 91, 393–401. doi: 10.1002/1097-0215(200002)9999:9999<::AID-IJC1070>3.0.CO;2-#
Hsieh, H. M., Lin, C. R., Fang, M. J., Rogers, J. D., Fournier, J., Lechat, C.,et al. (2010). Phylogenetic status of Xylaria subgenus Pseudoxylaria amongtaxa of the subfamily Xylarioideae (Xylariaceae) and phylogeny of thetaxa involved in the subfamily. Mol. Phylogenet. Evol. 54, 957–969. doi:10.1016/j.ympev.2009.12.015
Hsu, C. C., and Dorrestein, P. C. (2014). Visualizing life with ambientmass spectrometry. Curr. Opin. Biotechnol. 31C, 24–34. doi:10.1016/j.copbio.2014.07.005
Jarmusch, A. K., and Cooks, R. G. (2014). Emerging capabilities of massspectrometry for natural products. Nat. Prod. Rep. 31, 730–738. doi:10.1039/c3np70121b
Kertesz, V., and Van Berkel, G. J. (2010). Liquid microjunction surface samplingcoupled with high-pressure liquid chromatography-electrospray ionization-mass spectrometry for analysis of drugs and metabolites in whole-body thintissue sections. Anal. Chem. 82, 5917–5921. doi: 10.1021/ac100954p
Kertesz, V., and Van Berkel, G. J. (2013). Automated liquid microjunction surfacesampling-HPLC-MS/MS analysis of drugs and metabolites in whole-body thintissue sections. Bioanalysis 5, 819–826. doi: 10.4155/bio.13.42
Kim, Y., Alpmann, P., Blaum-Feder, S., Kramer, S., Endo, T., Lu, D., et al. (2011). Invivo efficacy of griseofulvin against multiple myeloma. Leuk. Res. 35, 1070–1073.doi: 10.1016/j.leukres.2010.10.008
Klich, M. A., Arthur, K. S., Lax, A. R., and Bland, J. M. (1994). Iturin A: Apotential new fungicide for stored grains. Mycopathologia 127, 123–127. doi:10.1007/bf01103068
Levine, S. G., and Hicks, R. E. (1971). The conformation of griseofulvin.Application of an NMR shift reagent. Tetrahedron Lett. 12, 311–314. doi:10.1016/S0040-4039(01)96427-5
Liéby-Muller, F., Heudré Le Baliner, Q., Grisoni, S., Fournier, E., Guilbaud, N.,and Marion, F. (2015). Synthesis and activities towards resistant cancer cellsof sulfone and sulfoxide griseofulvin derivatives. Bioorg. Med. Chem. Lett. 25,2078–2081. doi: 10.1016/j.bmcl.2015.03.081
Liu, Y. J., Whelen, S., and Hall, B. D. (1999). Phylogenetic relationships amongascomycetes: evidence from an RNA polymerse II subunit. Mol. Biol. Evol. 16,1799–1808. doi: 10.1093/oxfordjournals.molbev.a026092
Malkus, A., Chang, P. F., Zuzga, S. M., Chung, K. R., Shao, J., Cunfer, B. M., et al.(2006). RNA polymerase II gene (RPB2) encoding the second largest proteinsubunit in Phaeosphaeria nodorum and P. avenaria. Mycol. Res. 110, 1152–1164.doi: 10.1016/j.mycres.2006.07.015
Malmros, G., Waägner, A., and Maron, L. (1977). (2s,6′R)-7-chloro-2′,4,6,-trime-thoxy-6′-methyl-spiro-(benzofuran-2(3h),2-(2′)cyclohexene)-3,4′-dioneC17H17CLO6. Cryst. Struct. Commun. 6:463.
McGowan, J. C. (1946). A substance causing abnormal development of fungalhyphae produced by Penicillium janczewskii Zal. II. Preliminary notes on thechemical and physical properties of the “curling factor.” Trans. Br. Mycol. Soc.29, 188. doi: 10.1016/S0007-1536(46)80043-3
Moree, W. J., Yang, J. Y., Zhao, X. L., Liu, W. T., Aparicio, M., Atencio, L., et al.(2013). Imaging mass spectrometry of a coral microbe interaction with fungi.J. Chem. Ecol. 39, 1045–1054. doi: 10.1007/s10886-013-0320-1
Nweze, E. I., Mukherjee, P. K., and Ghannoum, M. A. (2010). Agar-based diskdiffusion assay for susceptibility testing of dermatophytes. J. Clin. Microbiol. 48,3750–3752. doi: 10.1128/JCM.01357-10
Okane, I., Srikitikulchai, P., Tabuchi, Y., Sivichai, S., and Nakagiri, A. (2012).Recognition and characterization of four Thai xylariaceous fungi inhabitingvarious tropical foliages as endophytes by DNA sequences and host plantpreference. Mycoscience 53, 122–132. doi: 10.1007/S10267-011-0149-9
Okane, I., Srikitikulchai, P., Toyama, K., Læssøe, T., Sivichai, S., Hywel-Jones, N.,et al. (2008). Study of endophytic Xylariaceae in Thailand: Diversity andtaxonomy inferred from rDNA sequence analyses with saprobes forming fruitbodies in the field. Mycoscience 49, 359–372. doi: 10.1007/S10267-008-0440-6
Oxford, A. E., Raistrick, H., and Simonart, P. (1939). Studies in the biochemistry ofmicro-organisms: Griseofulvin, C(17)H(17)O(6)Cl, a metabolic productof Penicillium griseo-fulvum Dierckx. Biochem. J. 33, 240–248. doi:10.1042/bj0330240
Paguigan, N. D., Raja, H. A., Day, C. S., and Oberlies, N. H. (2016). Acetophenonederivatives from a freshwater fungal isolate of recently described Lindgomycesmadisonensis (G416). Phytochemistry doi: 10.1016/j.phytochem.2016.03.007[Epub ahead of print].
Park, J. H., Choi, G. J., Lee, H. B., Kim, K. M., Jung, H. S., Lee, S. W., et al. (2005).Griseofulvin from Xylaria sp. Strain F0010, an endophytic fungus of Abiesholophylla and its antifungal activity against plant pathogenic fungi. J. Microbiol.Biotechnol. 15, 112–117.
Pažoutová, S., Follert, S., Bitzer, J., Keck, M., Surup, F., Šru̇tka, P., et al. (2013).A new endophytic insect-associated Daldinia species, recognised from acomparison of secondary metabolite profiles and molecular phylogeny. Fungal.Divers. 60, 107–123. doi: 10.1007/s13225-013-0238-5
Petersen, A. B., Ronnest, M. H., Larsen, T. O., and Clausen, M. H.(2014). The chemistry of griseofulvin. Chem. Rev. 114, 12088–12107. doi:10.1021/cr400368e
Petrini, O., Petrini, L., and Rodrigues, K. (1995). Xylariaceous endophytes: Anexercise in biodiversity. Fitopatol. Bras. 20, 531–539.
Raja, H. A., El-Elimat, T., Oberlies, N. H., Shearer, C. A., Miller, A. N., Tanaka, K.,et al. (2015a). Minutisphaerales (Dothideomycetes, Ascomycota): A new orderof freshwater ascomycetes including a new family, Minutisphaeraceae, andtwo new species from North Carolina, USA. Mycologia 107, 845–862. doi:10.3852/15-013
Raja, H. A., Kaur, A., El-Elimat, T., Figueroa, M., Kumar, R., Deep, G., et al.(2015b). Phylogenetic and chemical diversity of fungal endophytes isolatedfrom Silybum marianum (L) Gaertn. (milk thistle). Mycology 6, 8–27. doi:10.1080/21501203.2015.1009186
Richardson, S. N., Walker, A. K., Nsiama, T. K., McFarlane, J., Sumarah, M. W.,Ibrahim, A., et al. (2014). Griseofulvin-producing Xylaria endophytes of Pinusstrobus and Vaccinium angustifolium: Evidence for a conifer-understory speciesendophyte ecology. Fungal Ecol. 11, 107–113. doi: 10.1016/j.funeco.2014.05.004
Robinson, R. C. V. (1960). Antifungal activity of griseofulvin. Southern Med. J. 53,73–76. doi: 10.1097/00007611-196001000-00016
Rodrigues, K. F. (1994). The foliar fungal endophytes of the Amazonian palmEuterpe oleracea. Mycologia 86, 376–385. doi: 10.2307/3760568
Rogers, J. D. (1984). Xylaria acuta, Xylaria cornu-damae, and Xylariamali in Continental United States. Mycologia 76, 23–33. doi: 10.2307/3792832
Sica, V. P., Raja, H. A., El-Elimat, T., Kertesz, V., Van Berkel, G. J., Pearce, C. J., et al.(2015). Dereplicating and spatial mapping of secondary metabolites from fungalcultures in situ. J. Nat. Prod. 78, 1926–1936. doi: 10.1021/acs.jnatprod.5b00268
Sica, V. P., Raja, H. A., El-Elimat, T., and Oberlies, N. H. (2014). Mass spectrometryimaging of secondary metabolites directly on fungal cultures. RSC Adv. 4,63221–63227. doi: 10.1039/c4ra11564c
Simpson, T. J., and Holker, J. S. E. (1977). 13C-NMR studies on griseofulvinbiosynthesis and acetate metabolism in Penicillium patulum. Phytochemistry 16,229–233. doi: 10.1016/S0031-9422(00)86791-6
Frontiers in Microbiology | www.frontiersin.org 13 April 2016 | Volume 7 | Article 544

fmicb-07-00544 April 22, 2016 Time: 11:38 # 14
Sica et al. Mass Spectrometry Mapping of Griseofulvin In Situ
Singh, S. (2014). “Guttation: Quantification, microbiology and implications forphytopathology,” in Progress Botany, eds U. Lüttge, W. Beyschlag, and J.Cushman (Berlin: Springer), 187–214.
Stadler, M., Quang, D. N., Tomita, A., Hashimoto, T., and Asakawa, Y. (2006).Changes in secondary metabolism during stromatal ontogeny of Hypoxylonfragiforme. Mycol. Res. 110, 811–820. doi: 10.1016/j.mycres.2006.03.013
Tata, A., Perez, C. J., Ore, M. O., Lostun, D., Passas, A., Morin, S., et al. (2015).Evaluation of imprint DESI-MS substrates for the analysis of fungal metabolites.RSC Adv. 5, 75458–75464. doi: 10.1039/c5ra12805f
U’Ren, J. M., Lutzoni, F., Miadlikowska, J., Laetsch, A. D., and Arnold, A. E.(2012). Host and geographic structure of endophytic and endolichenic fungiat a continental scale. Am. J. Bot. 99, 898–914. doi: 10.3732/ajb.1100459
Vandermolen, K. M., Raja, H. A., El-Elimat, T., and Oberlies, N. H. (2013).Evaluation of culture media for the production of secondary metabolites in anatural products screening program. AMB Express 3:71.
Wang, X., Sena Filho, J. G., Hoover, A. R., King, J. B., Ellis, T. K., Powell, D. R.,et al. (2010). Chemical epigenetics alters the secondary metabolite compositionof guttate excreted by an atlantic-forest-soil-derived Penicillium citreonigrum.J. Nat. Prod. 73, 942–948. doi: 10.1021/np100142h
Watrous, J., Roach, P., Alexandrov, T., Heath, B. S., Yang, J. Y., Kersten, R. D.,et al. (2012). Mass spectral molecular networking of living microbial colonies.Proc. Natl. Acad. Sci. U.S.A. 109, E1743–E1752. doi: 10.1073/pnas.1203689109
Whalley, A. J. S. (1996). The xylariaceous way of life. Mycol. Res. 100, 897–922. doi:10.1016/S0953-7562(96)80042-6
Whalley, A. J. S., Suwannasai, N., Ruchikachorn, N., Sangvichien, E., andSihanonth, P. (2015). Endophytic xylariaceae from Thai plants. Suan SunandhaJ. Sci. Technol. 2, 11–17.
White, T. J., Bruns, T., Lee, S., and Taylor, J. (1990). “Amplification and directsequencing of fungal ribosomal RNA genes for phylogenetics,” in PCR Protocols:Guide to Methods and Applications, eds M. A. Innis, D. H. Gelfand, J. J. Sninsky,and T. J. White(New York, NY: Academic Press, Inc.), 315–322.
Williams, D. I., Marten, R. H., and Sarkany, I. (1958). Oral treatment of ringwormwith griseofulvin. Lancet 2, 1212–1213. doi: 10.1016/S0140-6736(58)92363-8
Conflict of Interest Statement: The authors declare that the research wasconducted in the absence of any commercial or financial relationships that couldbe construed as a potential conflict of interest.
Copyright © 2016 Sica, Rees, Tchegnon, Bardsley, Raja and Oberlies. This is anopen-access article distributed under the terms of the Creative Commons AttributionLicense (CC BY). The use, distribution or reproduction in other forums is permitted,provided the original author(s) or licensor are credited and that the originalpublication in this journal is cited, in accordance with accepted academic practice.No use, distribution or reproduction is permitted which does not comply with theseterms.
Frontiers in Microbiology | www.frontiersin.org 14 April 2016 | Volume 7 | Article 544