spatial and temporal analysis of skin glycation by the use of multiphoton microscopy and...
TRANSCRIPT
Journal of Dermatological Science 65 (2012) 189–195
Spatial and temporal analysis of skin glycation by the use of multiphotonmicroscopy and spectroscopy
Ara A. Ghazaryan a,1, Po-Sheng Hu a,1, Shean-Jen Chen b, Hsin-Yuan Tan c,d, Chen-Yuan Dong a,e,f,*a Department of Physics, National Taiwan University, Taipei 106, Taiwanb Department of Engineering Science, National Cheng Kung University Medical College, Taipei, Taiwanc Institute of Biomedical Engineering, National Taiwan University, Taipei, Taiwand Department of Ophthalmology, Chang Gung Memorial Hospital, Linko, Taiwane Center for Quantum Science and Engineering, National Taiwan University, Taipei 106, Taiwanf Biomedical Molecular Imaging Core, Division of Genomic Medicine, Research Center for Medical Excellence, National Taiwan University, Taipei, Taiwan
A R T I C L E I N F O
Article history:
Received 3 August 2011
Received in revised form 20 November 2011
Accepted 10 December 2011
Keywords:
Multiphoton imaging
Tissue glycation
Advanced glycation endproducts
Second harmonic generation
A B S T R A C T
Background: Tissue glycation, the main cause of many diabetes-related complications, results in the
accumulation of advanced glycation endproducts (AGE).
Objectives: These AGEs are endogenous fluorophores that can serve as a viable pathological indicator for
disease diagnostics. Here we explore the capabilities of multiphoton microscopy to non-invasively
localize and quantify the skin glycation.
Methods: In our study, multiphoton microscopy and spectroscopy were used to investigate glycation
events-induced changes in the intensities of autofluorescence and second harmonic generation on ex
vivo human skin.
Results: Temporal and spatial dependence of degrees of glycation of the epidermis, collagen and elastin
fibers of dermis were evaluated for their relevance to the changes in amplitudes of autofluorescence
signals. We found that glycation drastically and linearly increases multiphoton autofluorescence
intensity of epidermis and dermal collagen whereas changes in dermal elastin are moderate. We also
found decrease in the level of second harmonic generation signal.
Conclusion: Our study suggests that due to intrinsically weak autofluorescence the dermal collagen is
the most sensitive skin tissue to be used for detecting changes in tissue glycation.
� 2012 Japanese Society for Investigative Dermatology. Published by Elsevier Ireland Ltd. All rights
reserved.
Contents lists available at SciVerse ScienceDirect
Journal of Dermatological Science
jou r nal h o mep ag e: w ww .e lsev ier . co m / jds
1. Introduction
A number of long-term organ-level diseases such as vasculardiseases, osteoarthritis, and chronic kidney diseases have beenfound to be associated with diabetes and its main contributor knownas advanced glycation endproduct (AGE) [1–3]. AGE is a group ofchemically modified proteins that plays a central role in diabeticcomplications and affects physical, chemical and mechanicalproperties of proteins via cross-linking of proteins [4]. Thus, as awhole, the accumulation of AGEs damages tissues by modifyingprotein structure, activation of AGE-specific protein receptors, andgeneration of reactive oxidants [5]. Therefore, detection of AGE
Abbreviations: AGE, advanced glycation endproducts; MPAF, multiphoton auto-
fluorescence; SHG, second harmonic generation.
* Corresponding author at: Department of Physics, National Taiwan University,
Office: Room 530, Taipei 106, Taiwan. Tel.: +886 975568324; fax: +886 975568324.
E-mail addresses: [email protected] (H.-Y. Tan), [email protected]
(C.-Y. Dong).1 These authors contributed equally to this work.
0923-1811/$36.00 � 2012 Japanese Society for Investigative Dermatology. Published b
doi:10.1016/j.jdermsci.2011.12.012
presence in tissues has become a valuable biomarker for earlydiagnosis of diseases, the track of progression of diabetes-induceddiseases and effects of therapeutic procedures [5]. Most prevalentAGEs, such as pentosidine, pyrroline, and N-carboxymethyl lysine(CML), are endogenous fluorophores which emit autofluorescence(AF) in the spectral range of 300–600 nm [6]. Based on this feature,the measurement of skin autofluorescence has been proposed forAGE content quantification [6,7]. Corresponding clinical methodol-ogies and instrumentation have become prevalent for rapid andnon-invasive reliable diagnosis as compared to conventionalhistological and immunochemical protocols. Although biochemicaland immunochemical studies of AGEs can provide direct informa-tion about the structure, molecular formation and its bindingreceptors [8–10], it is AGE autofluorescence that allows non-invasive evaluation and quantification of tissue glycation formonitoring of long-term diabetic complications.
Recently, a 10-year follow-up study demonstrated that glycatedcollagen and CML predict future microvascular events better thanconventional HbA1c measurements [11]. It was shown thatelevated levels of AGEs in skin can be indicative of future
y Elsevier Ireland Ltd. All rights reserved.
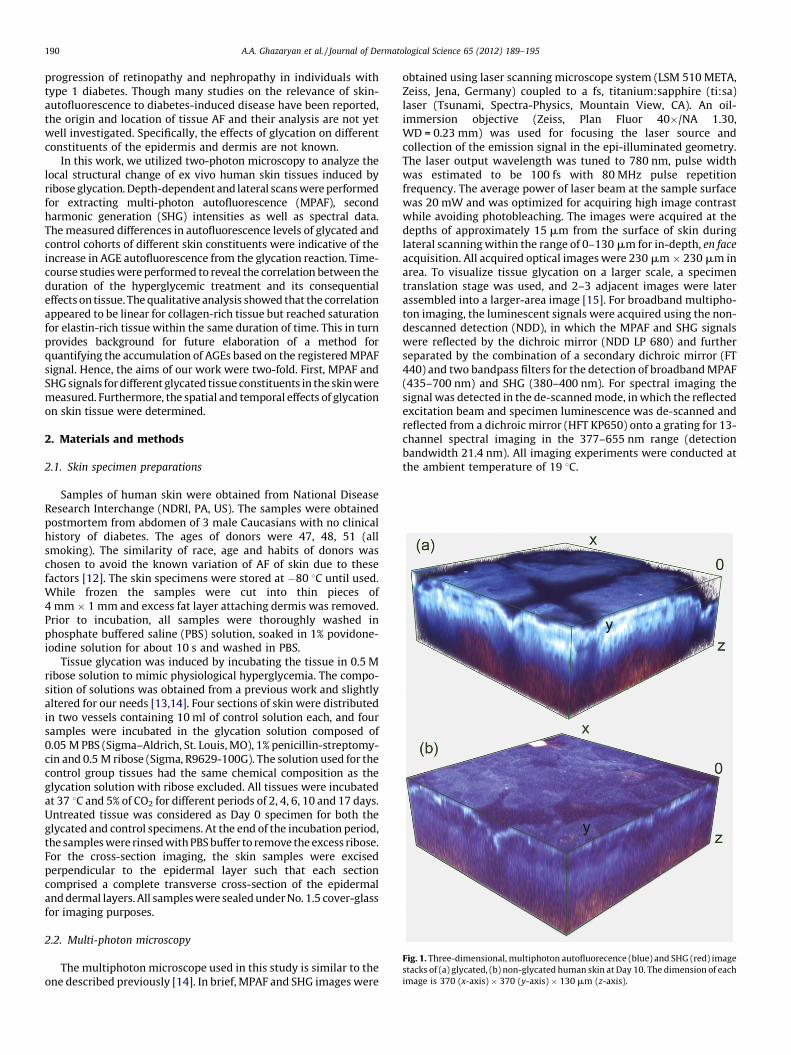
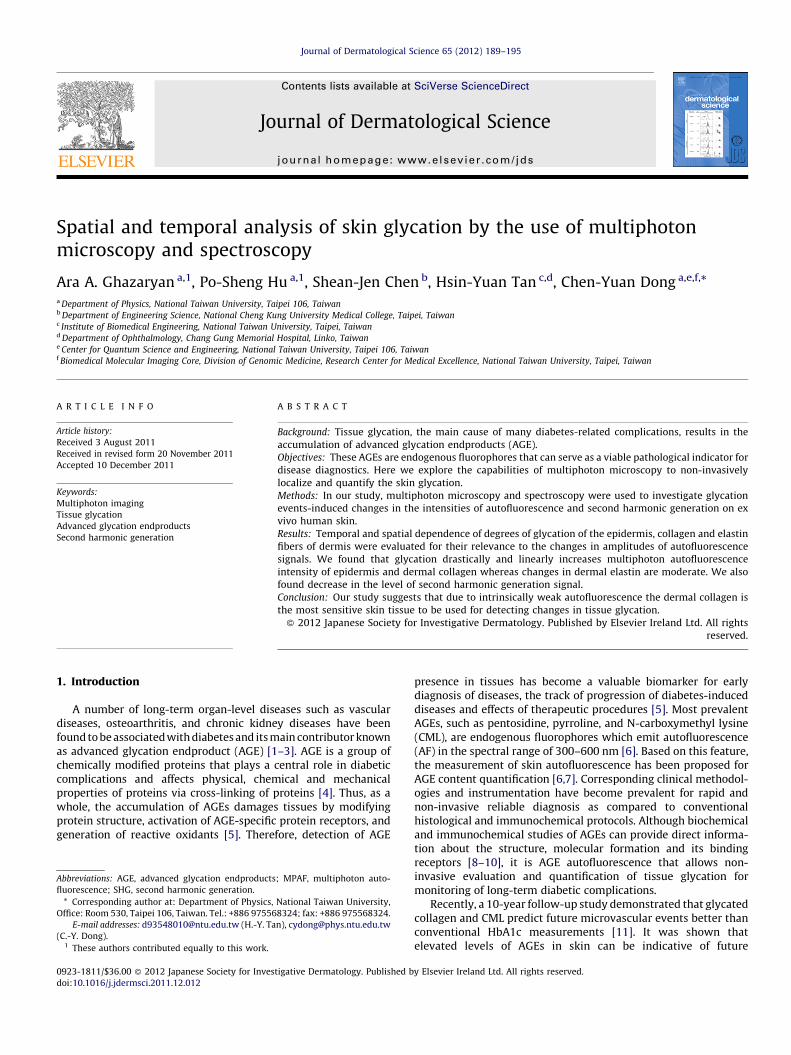
Fig. 1. Three-dimensional, multiphoton autofluorecence (blue) and SHG (red) image
stacks of (a) glycated, (b) non-glycated human skin at Day 10. The dimension of each
image is 370 (x-axis) � 370 (y-axis) � 130 mm (z-axis).
A.A. Ghazaryan et al. / Journal of Dermatological Science 65 (2012) 189–195190
progression of retinopathy and nephropathy in individuals withtype 1 diabetes. Though many studies on the relevance of skin-autofluorescence to diabetes-induced disease have been reported,the origin and location of tissue AF and their analysis are not yetwell investigated. Specifically, the effects of glycation on differentconstituents of the epidermis and dermis are not known.
In this work, we utilized two-photon microscopy to analyze thelocal structural change of ex vivo human skin tissues induced byribose glycation. Depth-dependent and lateral scans were performedfor extracting multi-photon autofluorescence (MPAF), secondharmonic generation (SHG) intensities as well as spectral data.The measured differences in autofluorescence levels of glycated andcontrol cohorts of different skin constituents were indicative of theincrease in AGE autofluorescence from the glycation reaction. Time-course studies were performed to reveal the correlation between theduration of the hyperglycemic treatment and its consequentialeffects on tissue. The qualitative analysis showed that the correlationappeared to be linear for collagen-rich tissue but reached saturationfor elastin-rich tissue within the same duration of time. This in turnprovides background for future elaboration of a method forquantifying the accumulation of AGEs based on the registered MPAFsignal. Hence, the aims of our work were two-fold. First, MPAF andSHG signals for different glycated tissue constituents in the skin weremeasured. Furthermore, the spatial and temporal effects of glycationon skin tissue were determined.
2. Materials and methods
2.1. Skin specimen preparations
Samples of human skin were obtained from National DiseaseResearch Interchange (NDRI, PA, US). The samples were obtainedpostmortem from abdomen of 3 male Caucasians with no clinicalhistory of diabetes. The ages of donors were 47, 48, 51 (allsmoking). The similarity of race, age and habits of donors waschosen to avoid the known variation of AF of skin due to thesefactors [12]. The skin specimens were stored at �80 8C until used.While frozen the samples were cut into thin pieces of4 mm � 1 mm and excess fat layer attaching dermis was removed.Prior to incubation, all samples were thoroughly washed inphosphate buffered saline (PBS) solution, soaked in 1% povidone-iodine solution for about 10 s and washed in PBS.
Tissue glycation was induced by incubating the tissue in 0.5 Mribose solution to mimic physiological hyperglycemia. The compo-sition of solutions was obtained from a previous work and slightlyaltered for our needs [13,14]. Four sections of skin were distributedin two vessels containing 10 ml of control solution each, and foursamples were incubated in the glycation solution composed of0.05 M PBS (Sigma–Aldrich, St. Louis, MO), 1% penicillin-streptomy-cin and 0.5 M ribose (Sigma, R9629-100G). The solution used for thecontrol group tissues had the same chemical composition as theglycation solution with ribose excluded. All tissues were incubatedat 37 8C and 5% of CO2 for different periods of 2, 4, 6, 10 and 17 days.Untreated tissue was considered as Day 0 specimen for both theglycated and control specimens. At the end of the incubation period,the samples were rinsed with PBS buffer to remove the excess ribose.For the cross-section imaging, the skin samples were excisedperpendicular to the epidermal layer such that each sectioncomprised a complete transverse cross-section of the epidermaland dermal layers. All samples were sealed under No. 1.5 cover-glassfor imaging purposes.
2.2. Multi-photon microscopy
The multiphoton microscope used in this study is similar to theone described previously [14]. In brief, MPAF and SHG images were
obtained using laser scanning microscope system (LSM 510 META,Zeiss, Jena, Germany) coupled to a fs, titanium:sapphire (ti:sa)laser (Tsunami, Spectra-Physics, Mountain View, CA). An oil-immersion objective (Zeiss, Plan Fluor 40�/NA 1.30,WD = 0.23 mm) was used for focusing the laser source andcollection of the emission signal in the epi-illuminated geometry.The laser output wavelength was tuned to 780 nm, pulse widthwas estimated to be 100 fs with 80 MHz pulse repetitionfrequency. The average power of laser beam at the sample surfacewas 20 mW and was optimized for acquiring high image contrastwhile avoiding photobleaching. The images were acquired at thedepths of approximately 15 mm from the surface of skin duringlateral scanning within the range of 0–130 mm for in-depth, en face
acquisition. All acquired optical images were 230 mm � 230 mm inarea. To visualize tissue glycation on a larger scale, a specimentranslation stage was used, and 2–3 adjacent images were laterassembled into a larger-area image [15]. For broadband multipho-ton imaging, the luminescent signals were acquired using the non-descanned detection (NDD), in which the MPAF and SHG signalswere reflected by the dichroic mirror (NDD LP 680) and furtherseparated by the combination of a secondary dichroic mirror (FT440) and two bandpass filters for the detection of broadband MPAF(435–700 nm) and SHG (380–400 nm). For spectral imaging thesignal was detected in the de-scanned mode, in which the reflectedexcitation beam and specimen luminescence was de-scanned andreflected from a dichroic mirror (HFT KP650) onto a grating for 13-channel spectral imaging in the 377–655 nm range (detectionbandwidth 21.4 nm). All imaging experiments were conducted atthe ambient temperature of 19 8C.
A.A. Ghazaryan et al. / Journal of Dermatological Science 65 (2012) 189–195 191
3. Results and discussion
3.1. MPAF and SHG imaging
To visualize the effects of glycation on dermal tissues, weperformed both cross-sectional and 3-D en face imaging. Shown inFig. 1a is the 3-D multiphoton autofluorescence and SHG imagestacks of a representative sample, kept in 0.5 M Ribose solution for10 days. The corresponding image of non-glycated tissue, kept forthe same amount of days in PBS is shown in Fig. 1b. As can be seen,there is a clear increase in autofluorescence in the glycatedspecimen. To perform further analysis, we imaged and analyzedcross-sectional images. Shown in Fig. 2a–c are images representingchanges in MPAF and SHG of non-glycated human skin and theimages of glycated tissues are shown in Fig. 2d–f. Both tissuesamples were incubated in corresponding solutions for 17 days.Presented images are lateral sections of skin including cross-sections of both epidermis and epithelial layers. It can be clearlyseen that glycated sample can be characterized by drasticallyincreased MPAF intensity (blue) and somewhat moderatelydecreased SHG intensity (red) as compared to the control sample(incubated in PBS).
3.2. Quantification of skin glycation
Using the time-course multiphoton images of the skin sections,we quantified the dependence of MPAF and SHG signals of differentskin constituents as a function of time. Two images were taken
Fig. 2. Representative cross-sectional multiphoton images of human skin sections unde
(blue), SHG (red), and composite channels of non-glycated tissues. The respective image
incubated in 0.5 M ribose for 17 days, whereas the control was kept in PBS for the same
was 20 mW. Images were obtained at the depth of 15 mm. Scale bar = 100 mm.
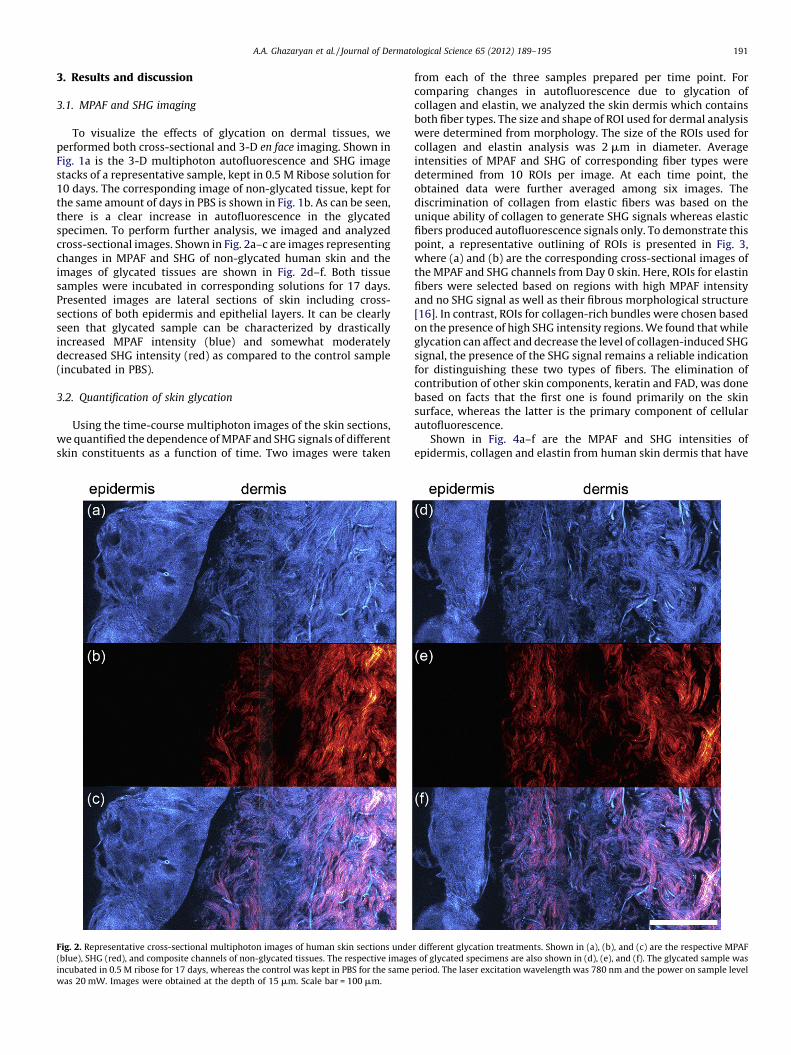
from each of the three samples prepared per time point. Forcomparing changes in autofluorescence due to glycation ofcollagen and elastin, we analyzed the skin dermis which containsboth fiber types. The size and shape of ROI used for dermal analysiswere determined from morphology. The size of the ROIs used forcollagen and elastin analysis was 2 mm in diameter. Averageintensities of MPAF and SHG of corresponding fiber types weredetermined from 10 ROIs per image. At each time point, theobtained data were further averaged among six images. Thediscrimination of collagen from elastic fibers was based on theunique ability of collagen to generate SHG signals whereas elasticfibers produced autofluorescence signals only. To demonstrate thispoint, a representative outlining of ROIs is presented in Fig. 3,where (a) and (b) are the corresponding cross-sectional images ofthe MPAF and SHG channels from Day 0 skin. Here, ROIs for elastinfibers were selected based on regions with high MPAF intensityand no SHG signal as well as their fibrous morphological structure[16]. In contrast, ROIs for collagen-rich bundles were chosen basedon the presence of high SHG intensity regions. We found that whileglycation can affect and decrease the level of collagen-induced SHGsignal, the presence of the SHG signal remains a reliable indicationfor distinguishing these two types of fibers. The elimination ofcontribution of other skin components, keratin and FAD, was donebased on facts that the first one is found primarily on the skinsurface, whereas the latter is the primary component of cellularautofluorescence.
Shown in Fig. 4a–f are the MPAF and SHG intensities ofepidermis, collagen and elastin from human skin dermis that have
r different glycation treatments. Shown in (a), (b), and (c) are the respective MPAF
s of glycated specimens are also shown in (d), (e), and (f). The glycated sample was
period. The laser excitation wavelength was 780 nm and the power on sample level
Fig. 3. Outlined pattern of ROIs for separate analysis of glycation effect on epidermis, collagen, and elastin of skin in (a) MPAF channel and (b) SHG channel. Solid yellow lines
delineate the epidermal region, green arrows point on ROI circles placed on elastin fibers, blue arrows point on collagen-rich areas. Dashed grid in Fig. 2a outlines ROIs, in
which depth dependence spectral analysis was made. Specifically, the intensity of desired emission band was averaged over area of each of 16 rectangular ROIs each
26 mm � 230 mm in area. The representative image was taken from Day 0, control sample. Scale bar = 25 mm. (For interpretation of the references to color in this figure
legend, the reader is referred to the web version of the article.)
A.A. Ghazaryan et al. / Journal of Dermatological Science 65 (2012) 189–195192
been treated to different degrees of glycation. As can be clearlyseen from Fig. 4 the trends for glycation-induced changes in MPAFintensities are similar in epidermis and collagen. During the first 4days, the intensity of collagen-rich tissue shows moderateincrease. However, starting from Day 4, MPAF dramaticallyincreased in a linear fashion. During the 17-day glycation period,MPAF increased by factors of 10.9 � 3.1 in epidermis, 5.9 � 1.4 inskin dermal collagen, 1.2 � 0.2 in skin elastin. These results aresimilar to those that we observed in bovine skin collagen (17.5 � 2.3fold increase over a 10-day period) and elastin from bovine inneraorta (1.42 � 0.3 fold increase over a 10-day period) [14]. In contrast,within experimental error, the MPAF intensity of the control groupremained the same for all treatment times. Similar trend of changes incase of glycated and control samples of elastin point out thepossibility that treatment in aqueous solution may moderately affecttissue MPAF.
In comparison, the SHG signal either decreased as in case ofdermal collagen, or fluctuated about a baseline value for epidermisand dermal elastin. This observation is consistent with previousreports and indicates glycation-induced disorder in the collagenstructure [17]. In all cases, no statistically significant changes ofSHG were observed in the control samples. Despite the fact that thepresence of SHG can serve as a footprint of collagen-containingtissue and a discriminating marker of elastin-rich fibers fromcollagen, it is the MPAF rather than SHG signal that can be used as asensitive metric for the quantitative determination of the extent oftissue glycation.
To estimate and compare the changes in MPAF intensityinduced by glycation in different constituents of skin we havecalculated the glycated/control ratios. Over a period of 17 days, wefound a change of 7.7 � 2.4, 6.9 � 1.4 and 1.3 � 0.1 for epidermis,dermis collagen and dermis elastin, respectively. These values aresimilar to the results found for bovine dermal collagen and elastinfrom bovine inner aorta. The difference between the calculated ratios
of glycated to control MPAF intensities, which may serve as acharacteristic estimate for AGE-content, is similar in cases of severelyglycated epidermis and collagen. In the case of glycated elastin whichcontains base autofluorescence, the overall change in MPAF is lesspronounced. However, for lesser degree of tissue glycation (Days 2–6), we found fluctuations of MPAF level for the control epidermissamples, whereas the MPAF signal for collagen from control sampleswere stable.
Our results show that epidermis and dermal collagen are moreresponsive to the formation of autofluorescent AGEs than dermalelastic fibers, which suggests that the relatively low intrinsicautofluorescence of these two tissue constituents allow them to beused as a more sensitive marker for the determination of the extentof tissue glycation. Moreover, the quantification of low-levelglycation rates, based on analysis of dermal collagen, proves to bemore accurate.
Depth-dependent profiles of MPAF and SHG signals. We alsocompared the MPAF and SHG depth-dependent profiles obtainedfrom cross-sectional imaging of skin with those of en face imagescollected through the epidermal and dermal layers of skin (0–130 mm). In this case, MPAF and SHG intensities were defined asaverages over entire area of each 2-D image. The depth-dependentsignal intensity curves for both channels and their glycated-to-control ratios for skin samples on Day 10 are presented in Fig. 5.The en face imaging results indicate that MPAF is more sensitive toglycation than the SHG signal. Specifically, the change in ratio ofMPAF intensity of glycated tissue relative to that of the controltissue (Day 10) increases 2.8 times compared to untreated tissue,whereas the SHG intensity decreased by a factor of 1.7. Maximumchange of MPAF was recorded at the depths of 25–50 mm andchanges in SHG were observed at depths of �25 mm and �100 mm.The two-peaks of MPAF found at the depths of 20–25 mm are dueto the gap between epidermis and epithelium which occurs as aresult of swelling (see Fig. 2d).
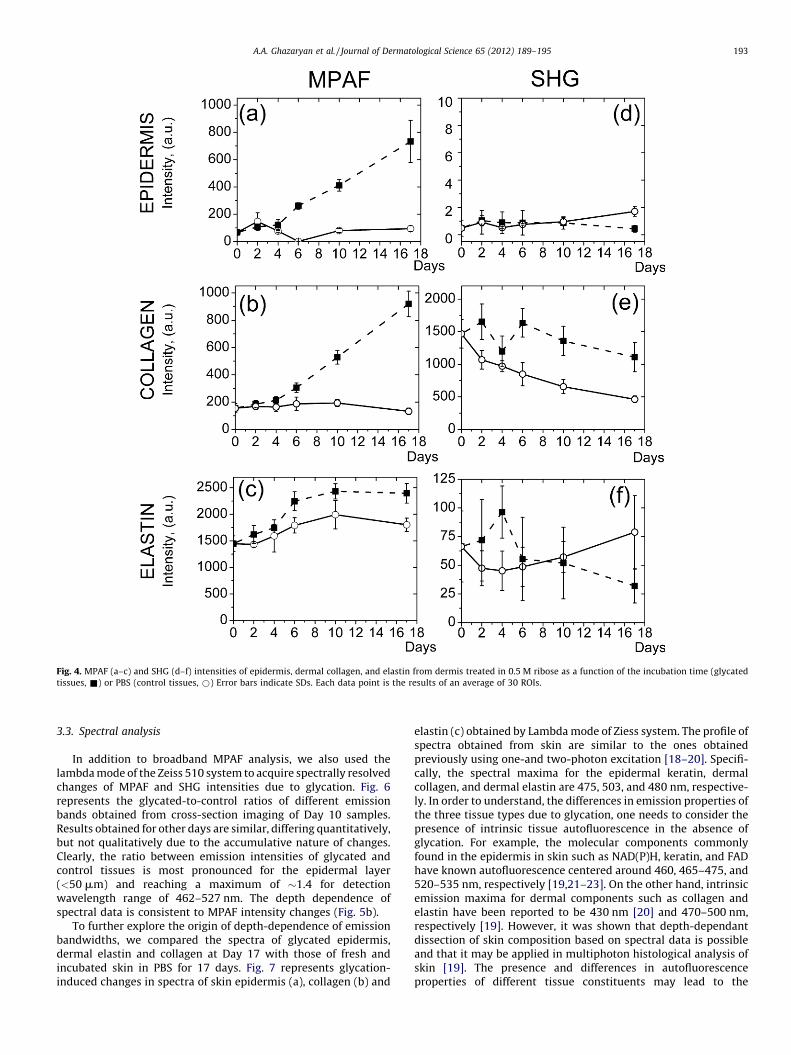
Fig. 4. MPAF (a–c) and SHG (d–f) intensities of epidermis, dermal collagen, and elastin from dermis treated in 0.5 M ribose as a function of the incubation time (glycated
tissues, &) or PBS (control tissues, *) Error bars indicate SDs. Each data point is the results of an average of 30 ROIs.
A.A. Ghazaryan et al. / Journal of Dermatological Science 65 (2012) 189–195 193
3.3. Spectral analysis
In addition to broadband MPAF analysis, we also used thelambda mode of the Zeiss 510 system to acquire spectrally resolvedchanges of MPAF and SHG intensities due to glycation. Fig. 6represents the glycated-to-control ratios of different emissionbands obtained from cross-section imaging of Day 10 samples.Results obtained for other days are similar, differing quantitatively,but not qualitatively due to the accumulative nature of changes.Clearly, the ratio between emission intensities of glycated andcontrol tissues is most pronounced for the epidermal layer(<50 mm) and reaching a maximum of �1.4 for detectionwavelength range of 462–527 nm. The depth dependence ofspectral data is consistent to MPAF intensity changes (Fig. 5b).
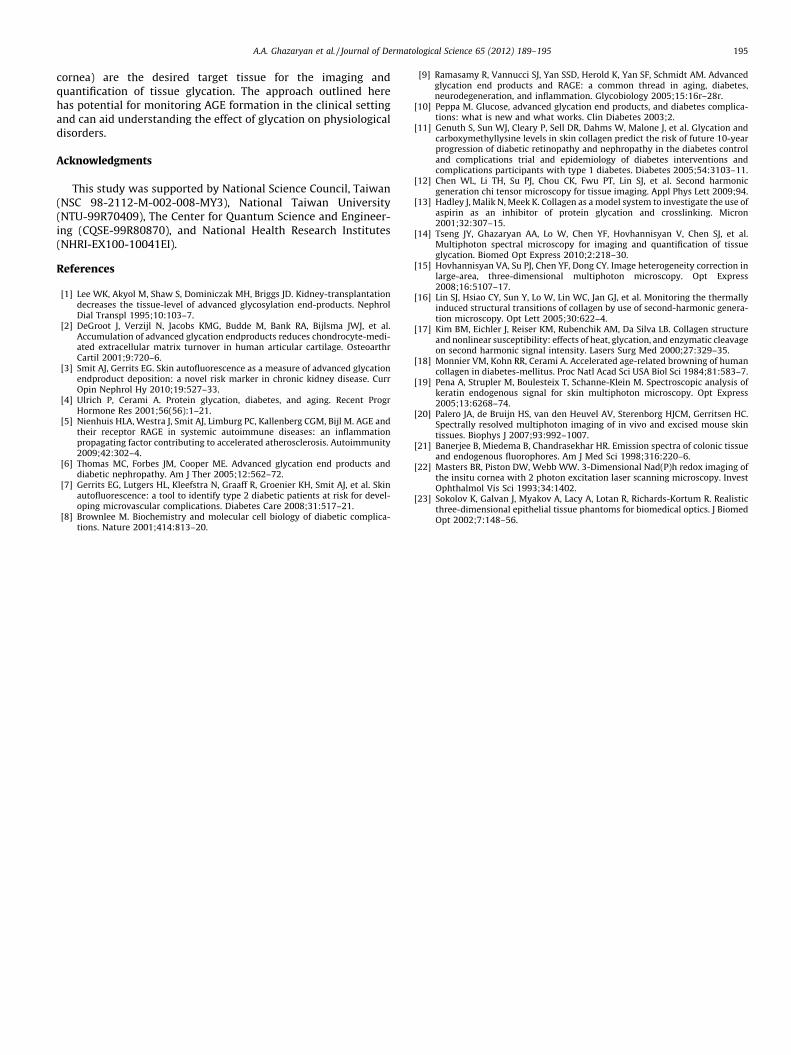
To further explore the origin of depth-dependence of emissionbandwidths, we compared the spectra of glycated epidermis,dermal elastin and collagen at Day 17 with those of fresh andincubated skin in PBS for 17 days. Fig. 7 represents glycation-induced changes in spectra of skin epidermis (a), collagen (b) and
elastin (c) obtained by Lambda mode of Ziess system. The profile ofspectra obtained from skin are similar to the ones obtainedpreviously using one-and two-photon excitation [18–20]. Specifi-cally, the spectral maxima for the epidermal keratin, dermalcollagen, and dermal elastin are 475, 503, and 480 nm, respective-ly. In order to understand, the differences in emission properties ofthe three tissue types due to glycation, one needs to consider thepresence of intrinsic tissue autofluorescence in the absence ofglycation. For example, the molecular components commonlyfound in the epidermis in skin such as NAD(P)H, keratin, and FADhave known autofluorescence centered around 460, 465–475, and520–535 nm, respectively [19,21–23]. On the other hand, intrinsicemission maxima for dermal components such as collagen andelastin have been reported to be 430 nm [20] and 470–500 nm,respectively [19]. However, it was shown that depth-dependantdissection of skin composition based on spectral data is possibleand that it may be applied in multiphoton histological analysis ofskin [19]. The presence and differences in autofluorescenceproperties of different tissue constituents may lead to the
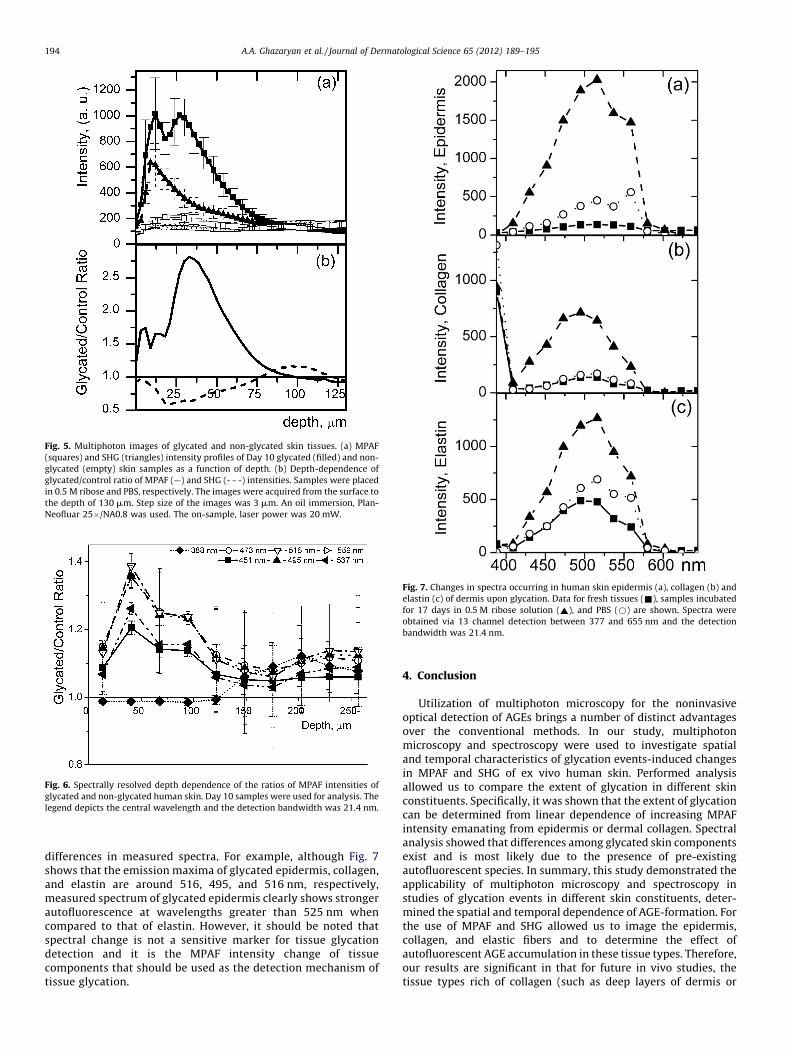
Fig. 5. Multiphoton images of glycated and non-glycated skin tissues. (a) MPAF
(squares) and SHG (triangles) intensity profiles of Day 10 glycated (filled) and non-
glycated (empty) skin samples as a function of depth. (b) Depth-dependence of
glycated/control ratio of MPAF (—) and SHG (- - -) intensities. Samples were placed
in 0.5 M ribose and PBS, respectively. The images were acquired from the surface to
the depth of 130 mm. Step size of the images was 3 mm. An oil immersion, Plan-
Neofluar 25�/NA0.8 was used. The on-sample, laser power was 20 mW.
Fig. 6. Spectrally resolved depth dependence of the ratios of MPAF intensities of
glycated and non-glycated human skin. Day 10 samples were used for analysis. The
legend depicts the central wavelength and the detection bandwidth was 21.4 nm.
Fig. 7. Changes in spectra occurring in human skin epidermis (a), collagen (b) and
elastin (c) of dermis upon glycation. Data for fresh tissues (&), samples incubated
for 17 days in 0.5 M ribose solution (~), and PBS (*) are shown. Spectra were
obtained via 13 channel detection between 377 and 655 nm and the detection
bandwidth was 21.4 nm.
A.A. Ghazaryan et al. / Journal of Dermatological Science 65 (2012) 189–195194
differences in measured spectra. For example, although Fig. 7shows that the emission maxima of glycated epidermis, collagen,and elastin are around 516, 495, and 516 nm, respectively,measured spectrum of glycated epidermis clearly shows strongerautofluorescence at wavelengths greater than 525 nm whencompared to that of elastin. However, it should be noted thatspectral change is not a sensitive marker for tissue glycationdetection and it is the MPAF intensity change of tissuecomponents that should be used as the detection mechanism oftissue glycation.
4. Conclusion
Utilization of multiphoton microscopy for the noninvasiveoptical detection of AGEs brings a number of distinct advantagesover the conventional methods. In our study, multiphotonmicroscopy and spectroscopy were used to investigate spatialand temporal characteristics of glycation events-induced changesin MPAF and SHG of ex vivo human skin. Performed analysisallowed us to compare the extent of glycation in different skinconstituents. Specifically, it was shown that the extent of glycationcan be determined from linear dependence of increasing MPAFintensity emanating from epidermis or dermal collagen. Spectralanalysis showed that differences among glycated skin componentsexist and is most likely due to the presence of pre-existingautofluorescent species. In summary, this study demonstrated theapplicability of multiphoton microscopy and spectroscopy instudies of glycation events in different skin constituents, deter-mined the spatial and temporal dependence of AGE-formation. Forthe use of MPAF and SHG allowed us to image the epidermis,collagen, and elastic fibers and to determine the effect ofautofluorescent AGE accumulation in these tissue types. Therefore,our results are significant in that for future in vivo studies, thetissue types rich of collagen (such as deep layers of dermis or
A.A. Ghazaryan et al. / Journal of Dermatological Science 65 (2012) 189–195 195
cornea) are the desired target tissue for the imaging andquantification of tissue glycation. The approach outlined herehas potential for monitoring AGE formation in the clinical settingand can aid understanding the effect of glycation on physiologicaldisorders.
Acknowledgments
This study was supported by National Science Council, Taiwan(NSC 98-2112-M-002-008-MY3), National Taiwan University(NTU-99R70409), The Center for Quantum Science and Engineer-ing (CQSE-99R80870), and National Health Research Institutes(NHRI-EX100-10041EI).
References
[1] Lee WK, Akyol M, Shaw S, Dominiczak MH, Briggs JD. Kidney-transplantationdecreases the tissue-level of advanced glycosylation end-products. NephrolDial Transpl 1995;10:103–7.
[2] DeGroot J, Verzijl N, Jacobs KMG, Budde M, Bank RA, Bijlsma JWJ, et al.Accumulation of advanced glycation endproducts reduces chondrocyte-medi-ated extracellular matrix turnover in human articular cartilage. OsteoarthrCartil 2001;9:720–6.
[3] Smit AJ, Gerrits EG. Skin autofluorescence as a measure of advanced glycationendproduct deposition: a novel risk marker in chronic kidney disease. CurrOpin Nephrol Hy 2010;19:527–33.
[4] Ulrich P, Cerami A. Protein glycation, diabetes, and aging. Recent ProgrHormone Res 2001;56(56):1–21.
[5] Nienhuis HLA, Westra J, Smit AJ, Limburg PC, Kallenberg CGM, Bijl M. AGE andtheir receptor RAGE in systemic autoimmune diseases: an inflammationpropagating factor contributing to accelerated atherosclerosis. Autoimmunity2009;42:302–4.
[6] Thomas MC, Forbes JM, Cooper ME. Advanced glycation end products anddiabetic nephropathy. Am J Ther 2005;12:562–72.
[7] Gerrits EG, Lutgers HL, Kleefstra N, Graaff R, Groenier KH, Smit AJ, et al. Skinautofluorescence: a tool to identify type 2 diabetic patients at risk for devel-oping microvascular complications. Diabetes Care 2008;31:517–21.
[8] Brownlee M. Biochemistry and molecular cell biology of diabetic complica-tions. Nature 2001;414:813–20.
[9] Ramasamy R, Vannucci SJ, Yan SSD, Herold K, Yan SF, Schmidt AM. Advancedglycation end products and RAGE: a common thread in aging, diabetes,neurodegeneration, and inflammation. Glycobiology 2005;15:16r–28r.
[10] Peppa M. Glucose, advanced glycation end products, and diabetes complica-tions: what is new and what works. Clin Diabetes 2003;2.
[11] Genuth S, Sun WJ, Cleary P, Sell DR, Dahms W, Malone J, et al. Glycation andcarboxymethyllysine levels in skin collagen predict the risk of future 10-yearprogression of diabetic retinopathy and nephropathy in the diabetes controland complications trial and epidemiology of diabetes interventions andcomplications participants with type 1 diabetes. Diabetes 2005;54:3103–11.
[12] Chen WL, Li TH, Su PJ, Chou CK, Fwu PT, Lin SJ, et al. Second harmonicgeneration chi tensor microscopy for tissue imaging. Appl Phys Lett 2009;94.
[13] Hadley J, Malik N, Meek K. Collagen as a model system to investigate the use ofaspirin as an inhibitor of protein glycation and crosslinking. Micron2001;32:307–15.
[14] Tseng JY, Ghazaryan AA, Lo W, Chen YF, Hovhannisyan V, Chen SJ, et al.Multiphoton spectral microscopy for imaging and quantification of tissueglycation. Biomed Opt Express 2010;2:218–30.
[15] Hovhannisyan VA, Su PJ, Chen YF, Dong CY. Image heterogeneity correction inlarge-area, three-dimensional multiphoton microscopy. Opt Express2008;16:5107–17.
[16] Lin SJ, Hsiao CY, Sun Y, Lo W, Lin WC, Jan GJ, et al. Monitoring the thermallyinduced structural transitions of collagen by use of second-harmonic genera-tion microscopy. Opt Lett 2005;30:622–4.
[17] Kim BM, Eichler J, Reiser KM, Rubenchik AM, Da Silva LB. Collagen structureand nonlinear susceptibility: effects of heat, glycation, and enzymatic cleavageon second harmonic signal intensity. Lasers Surg Med 2000;27:329–35.
[18] Monnier VM, Kohn RR, Cerami A. Accelerated age-related browning of humancollagen in diabetes-mellitus. Proc Natl Acad Sci USA Biol Sci 1984;81:583–7.
[19] Pena A, Strupler M, Boulesteix T, Schanne-Klein M. Spectroscopic analysis ofkeratin endogenous signal for skin multiphoton microscopy. Opt Express2005;13:6268–74.
[20] Palero JA, de Bruijn HS, van den Heuvel AV, Sterenborg HJCM, Gerritsen HC.Spectrally resolved multiphoton imaging of in vivo and excised mouse skintissues. Biophys J 2007;93:992–1007.
[21] Banerjee B, Miedema B, Chandrasekhar HR. Emission spectra of colonic tissueand endogenous fluorophores. Am J Med Sci 1998;316:220–6.
[22] Masters BR, Piston DW, Webb WW. 3-Dimensional Nad(P)h redox imaging ofthe insitu cornea with 2 photon excitation laser scanning microscopy. InvestOphthalmol Vis Sci 1993;34:1402.
[23] Sokolov K, Galvan J, Myakov A, Lacy A, Lotan R, Richards-Kortum R. Realisticthree-dimensional epithelial tissue phantoms for biomedical optics. J BiomedOpt 2002;7:148–56.