spatial analysis of groundwater quality using gis system
TRANSCRIPT

Spatial Analysis of Groundwater Quality Using GIS System in Jnanabharathi, Ward. No 129,
Bangalore, Karnataka state, India
by,Aditya G1
Sathvik A S1,Kakumanu Venkata Sai Sumanth1,
GrandhiPavan Kumar1, Alfhan1
Under the guidance ofAsst Prof.Pradeep Raja K P2,
Prof. Revanasiddappa M3
1Department of Electronics and Communication Engineering, 2Department of Civil Engineering, 3Department of Engineering Chemistry,
Hosur Road, PESIT Bangalore South Campus, Bangalore 560 100

Outline of Presentation
• Objective • Study Area• Parameters under monitoring– Electrical Conductance– Total Hardness– pH– Chemical Oxygen Demand(COD)
Conclusion

Objective
To study ground water quality of Jnanabharathi ward no.129 area using GIS software
To analyze systematically for physio-chemical parameters such as pH, Total Hardness, Electrical Conductivity and Chemical Oxygen Demand (COD).
Generate Ground Water Quality Map based on all the above factors.

Introduction• Ground water is an essential renewable resource which we rely on since
centuries without estimating its fate in terms of quality and quantity. The ground water is considered as pollution free and cleaner than surface water due to its hideous nature underneath the surface. Industries, residential, municipal, agricultural and commercial activities adversely affect the quality of ground water.
• In India, ground water is considered to be the major source for most of the population especially for drinking purposes. Though groundwater is believed to be clean and free from pollution as compared to the surface water, it is being contaminated by natural or numerous types of human activities such as commercial, industrial, agricultural etc.

What is GIS?• GIS(Geographic Information Systems) is one of the most effective
tools for mapping of groundwater quality and plays a vital role in monitoring the environmental changes. GIS is being used to map the classification of groundwater quality, based on correlating the values of TDS (Total Dissolved Solids) with some aquifer characteristics. GIS is also used as a database system in preparing maps of water quality based on the concentration values of different chemical constituents. In such surveys, GIS is utilized to trace the groundwater quality zones suitable for different usages such as irrigation and domestic. Babiker et al. proposed a GIS-based groundwater quality index method which synthesizes different available water quality data by indexing them numerically relative to the WHO standards. Thus, the use of GIS technology has greatly simplified the assessment of natural resources and environmental concerns, including groundwater.

What is GIS?• In groundwater studies, GIS is commonly used for site suitability
analysis, managing site inventory data, estimation of groundwater vulnerability to contamination, groundwater flow modeling, modeling solute transport and leaching, and integrating groundwater quality assessment models with spatial data to create spatial decision support systems . Barber et al carried out a GIS based study to determine the effect of urbanization on groundwater quality in relation to land-use changes. Using GIS, Nas and Berktay have mapped urban groundwater quality in Koyna, Turkey. Ground water quality map is important for any city to estimate the water safeness for drinking and irrigation purposes. It is also helpful as a precautionary indication of potential environmental health problems.
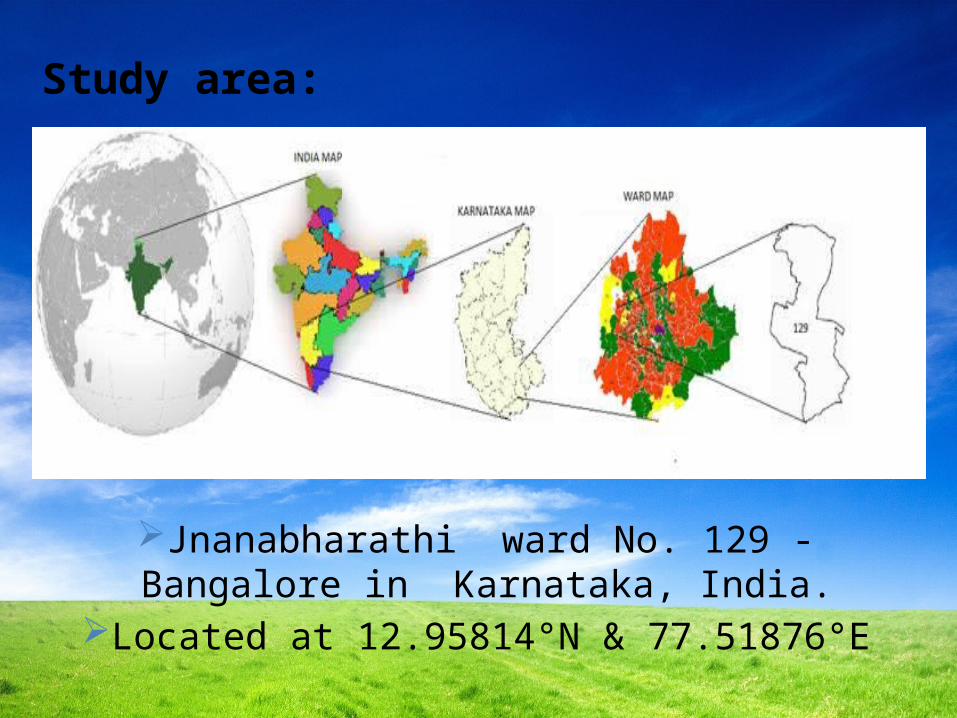
Study area:
Jnanabharathi ward No. 129 - Bangalore in Karnataka, India.
Located at 12.95814°N & 77.51876°E

Parameters under monitoring
Ground water sample were collected from 19 bore wells.Samples were analyzed by using physical and chemical parameters using standard procedures.Samples were analyzed for various parameters such as Electrical Conductance, total hardness, pH, COD.

Results and Discussion
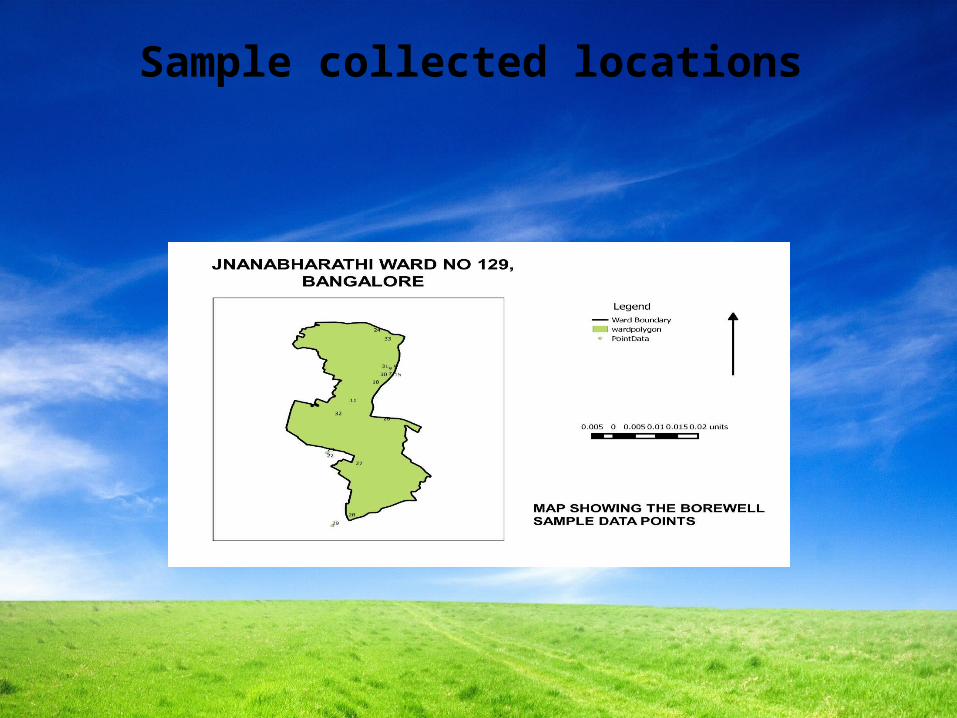
Sample collected locations

Electrical Conductance
• It is the ability of a medium to conduct electricity.
• Greater conductance makes water unfit for drinking.
• The conductance of the ground water is generally more than the permissible limit due to the inclusion of different salts present in the soil.

Sample No.Map Point No. Conductivity
1 15 1320
2 4 1720
3 5 1680
4 6 2240
5 7 2120
6 30 2000
7 9 1440
8 10 1720
9 11 1640
10 32 2240
11 27 1240
12 26 1700
13 31 1500
14 33 2220
15 28 2280
16 29 2160
17 22 1740
18 24 2400
19 23 1660
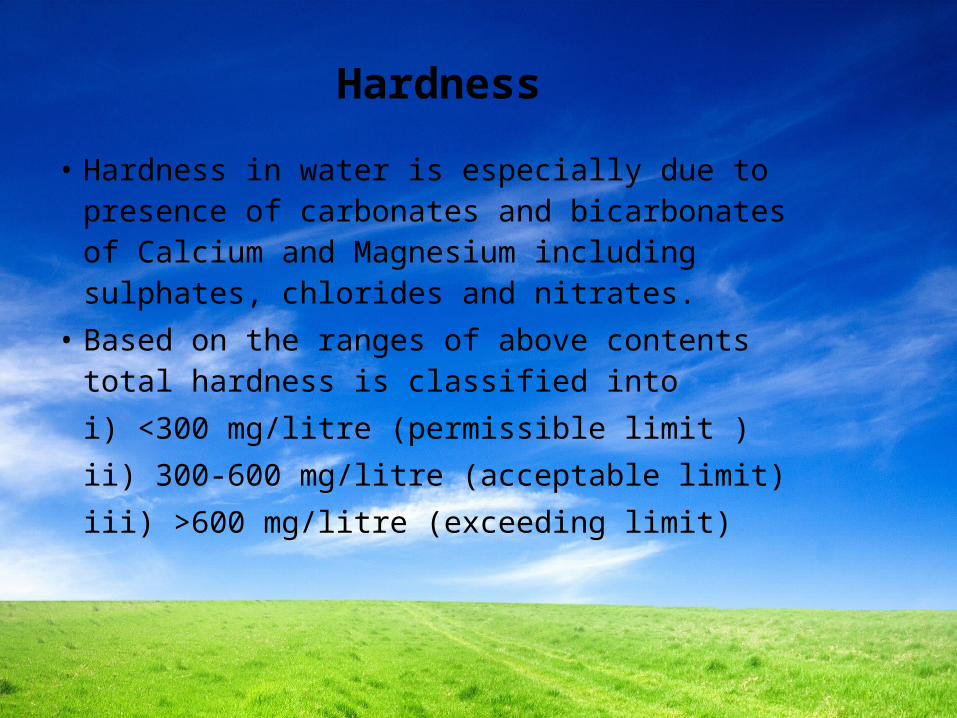
Hardness
• Hardness in water is especially due to presence of carbonates and bicarbonates of Calcium and Magnesium including sulphates, chlorides and nitrates.
• Based on the ranges of above contents total hardness is classified intoi) <300 mg/litre (permissible limit )ii) 300-600 mg/litre (acceptable limit)iii) >600 mg/litre (exceeding limit)

Sample No.
Map Point No. Hardness
1 15 328.00
2 4 428.00
3 5 404.00
4 6 539.28
5 7 453.60
6 30 372.36
7 9 389.48
8 10 398.04
9 11 419.44
10 32 505.04
11 27 234.72
12 26 361.11
13 31 379.16
14 33 496.52
15 28 541.66
16 29 523.61
17 22 397.22
18 24 496.52
19 23 352.08

pH
• pH is defined as negative logarithm of concentration of [H+] ions in a liquid.
• It ranges from 1 to 14. pH of pure water is 7.• If it is <7, then it is acidic, else it is basic.• Lesser the pH value, greater the acidity of a
liquid.• According to the WHO permissible limit of
drinking water is 6.5 to 7.5.

Sample No.
Map Point No. pH
1 15 7.3
2 4 7.2
3 5 7.2
4 6 7.2
5 7 7
6 30 7.2
7 9 7.4
8 10 7
9 11 7.3
10 32 6.9
11 27 6.9
12 26 7.5
13 31 7
14 33 7.1
15 28 7
16 29 6.8
17 22 7.5
18 24 6.9
19 23 6.8

Chemical Oxygen Demand (COD)
• It is amount of oxygen required for the complete chemical oxidation of both organic and inorganic matter present in the sample of water by a strong chemical oxidizing agent such as acidified potassium dichromate.
• Greater the COD, greater contamination of water.

Sample No.Map Point No. C.O.D
1 15 0
2 4 0
3 5 0.68272
4 6 0
5 7 0
6 30 0
7 9 0
8 10 0
9 11 0
10 32 0
11 27 2.8202
12 26 0
13 31 0.94006
14 33 0.94006
15 28 1.88013
16 29 0
17 22 1.88013
18 24 0.94006
19 23 2.8202

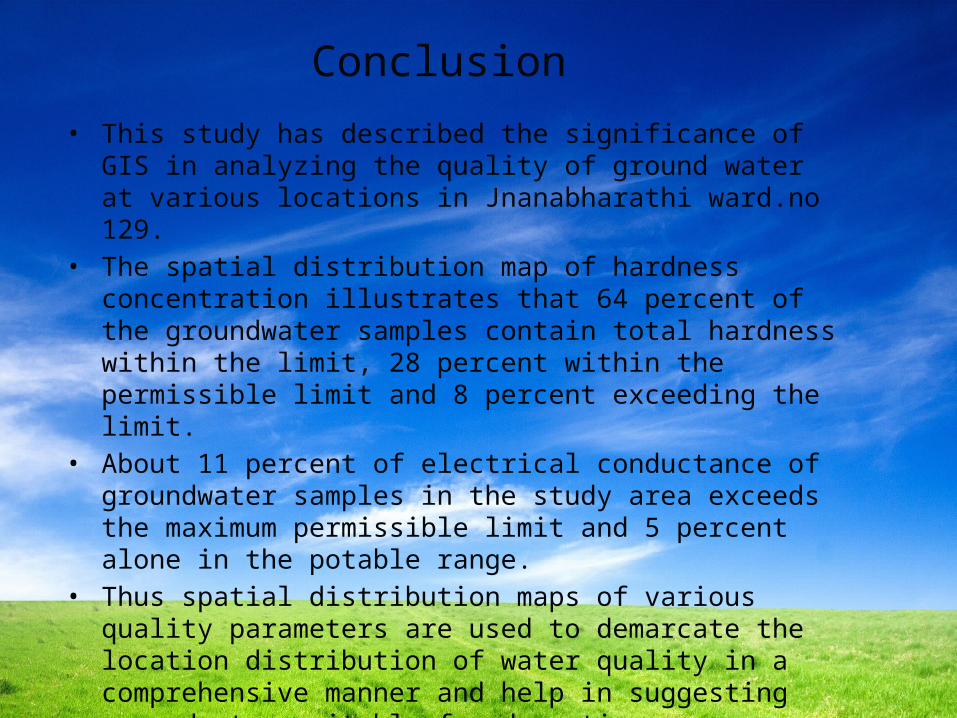
Conclusion• This study has described the significance of GIS in analyzing the
quality of ground water at various locations in Jnanabharathi ward.no 129.
• The spatial distribution map of hardness concentration illustrates that 64 percent of the groundwater samples contain total hardness within the limit, 28 percent within the permissible limit and 8 percent exceeding the limit.
• About 11 percent of electrical conductance of groundwater samples in the study area exceeds the maximum permissible limit and 5 percent alone in the potable range.
• Thus spatial distribution maps of various quality parameters are used to demarcate the location distribution of water quality in a comprehensive manner and help in suggesting groundwater suitable for domestic purposes.

Thank you,