spatial analysis in arcgis online - joseph kerski · esri definition of spatial analysis: “the...
TRANSCRIPT
Joseph Kerski 1
Spatial Analysis in ArcGIS
Online
Joseph Kerski, PhD GISP
Education Manager
Esri
http://www.youtube.com/geographyuberalles
Twitter http://twitter.com/josephkerski
303-449-7779 x 18237
Joseph Kerski 2
Goals
1. Understand what spatial analysis is.
2. Understand why spatial analysis is a unique
characteristics of GIS and why it is powerful in
education and in greater society.
3. Build skills in spatial analysis using ArcGIS
Online.

Joseph Kerski 3
What is GIS I?
1. Classical Definition: GIS is a tool that can access,
integrate, and distribute layers of map information. The
five parts of a GIS include hardware, software, data,
procedures, and people.
2. A more Modern Definition (?): GIS lets us visualize,
question, analyze, interpret, and understand data in
new ways. This can reveal relationships, patterns, and
trends.
Joseph Kerski 4
What is GIS II?
3. Give it some context: A transformation is taking place.
Businesses and government, schools and hospitals, nonprofit
organizations, and others are taking advantage of it. All
around the world, people are working more efficiently because
of it. Information that was limited to spreadsheets and
databases is being examined in a new, exciting way—all using
GIS.
4. A workflow definition: People intuitively understand maps.
When a decision needs to be made, GIS helps us gather
information and place it on a digital map. We then use GIS to
evaluate the decision geographically. Once we fully
understand the geographic consequences of the decision, we
can act in an informed, responsible manner.

Joseph Kerski 5
What is GIS III?
5. The value proposition: The benefits of GIS generally fall
into five basic
categories:
• Cost savings resulting from greater efficiency
• Better decision making
• Improved communication
• Better geographic information recordkeeping
• Managing geographically
6. Or, a simple definition: GIS helps us see where things
are—and decide where they should be.
Bottom line: GIS is more than maps. It is more than
visualizing. It allows us to do spatial analysis.
Joseph Kerski 6
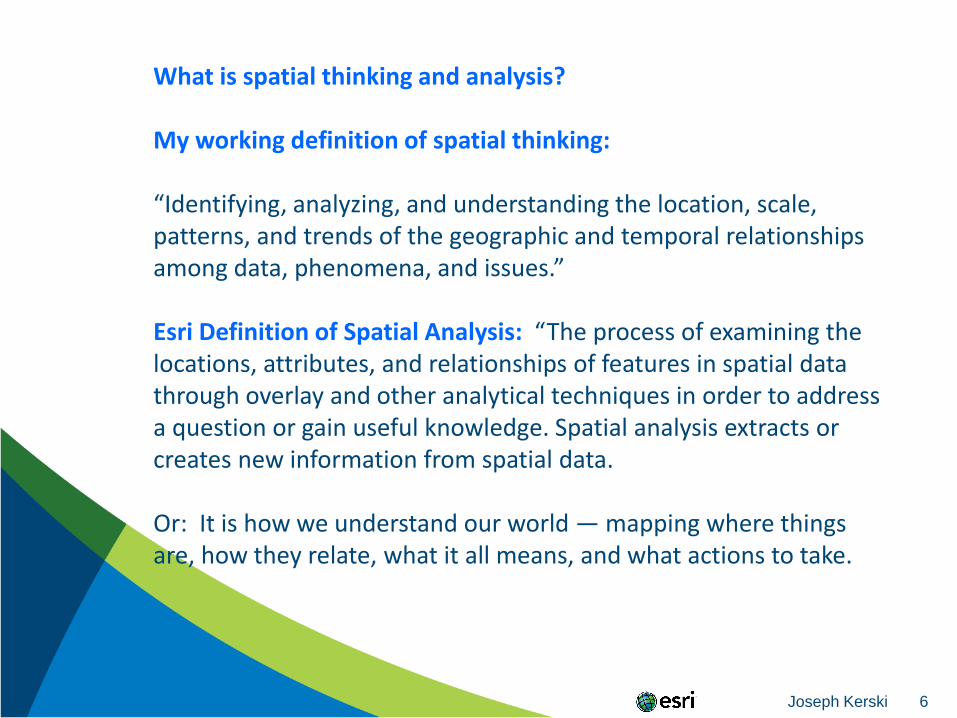
What is spatial thinking and analysis?
My working definition of spatial thinking:
“Identifying, analyzing, and understanding the location, scale, patterns, and trends of the geographic and temporal relationships among data, phenomena, and issues.”
Esri Definition of Spatial Analysis: “The process of examining the locations, attributes, and relationships of features in spatial data through overlay and other analytical techniques in order to address a question or gain useful knowledge. Spatial analysis extracts or creates new information from spatial data.
Or: It is how we understand our world — mapping where things are, how they relate, what it all means, and what actions to take.
Joseph Kerski 7
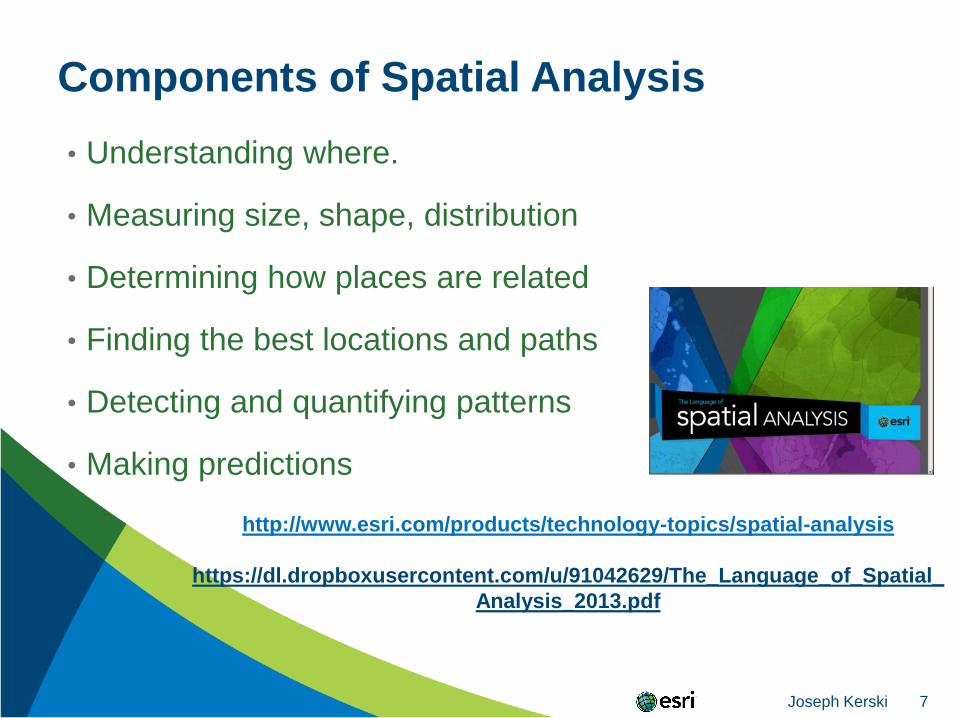
Components of Spatial Analysis
• Understanding where.
• Measuring size, shape, distribution
• Determining how places are related
• Finding the best locations and paths
• Detecting and quantifying patterns
• Making predictions
http://www.esri.com/products/technology-topics/spatial-analysis
https://dl.dropboxusercontent.com/u/91042629/The_Language_of_Spatial_
Analysis_2013.pdf
Joseph Kerski 8
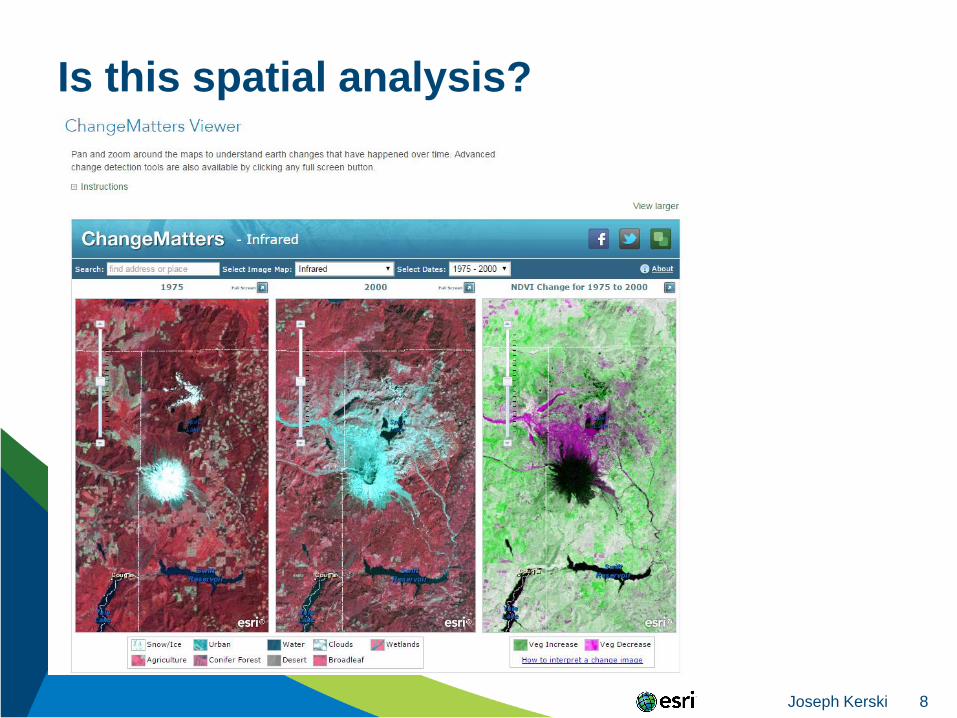
Is this spatial analysis?
Joseph Kerski 9
You need data and tools to do spatial analysis!
Finding and Using Spatial Data
Old Paradigm
--Download data Unzip Format ProjectTabular
Manipulation Use.
New Paradigm
--Access data in cloud Use.
We are not quite to the point of fully using the new
paradigm … yet.
Joseph Kerski 10
Thus, best practice today is still the hybrid model:
1. Start with ArcGIS Online to search for data.
2. Search local, state, national, international data
depositories and portals.
Examples:
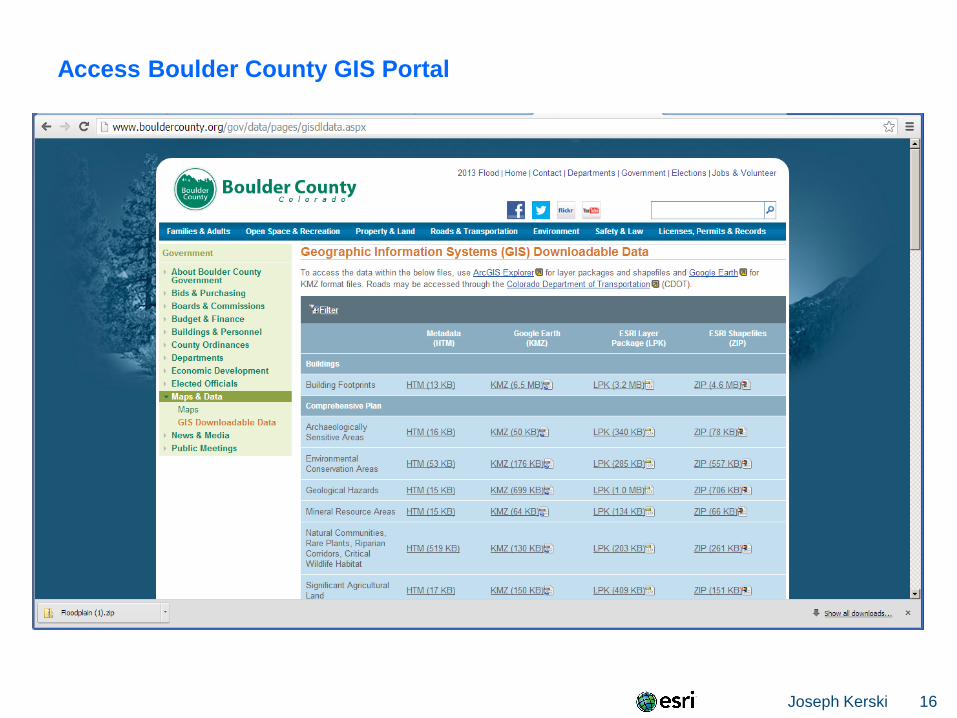
Local: Boulder County CO, Los Angeles County CA
State: www.tnris.org (Texas), CASIL (California), RIGIS
(RI), NRIS (MT)
National: USGS, NASA, Census Bureau, NOAA, EPA, US
DOT, USFWS, BLM, USFS, FAA, National Atlas,
LINZ (New Zealand), IBGE (Brazil), OS (UK)
International: WRI, WWF, UNEP, World Bank, Natural Earth
Data
Joseph Kerski 11
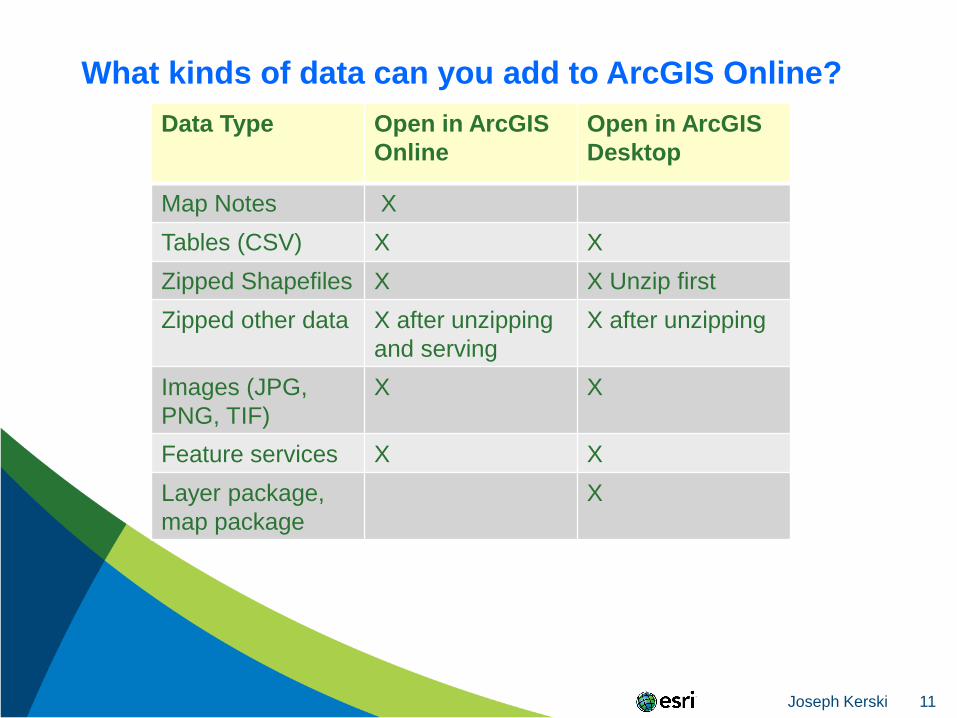
What kinds of data can you add to ArcGIS Online?
Data Type Open in ArcGIS
Online
Open in ArcGIS
Desktop
Map Notes X
Tables (CSV) X X
Zipped Shapefiles X X Unzip first
Zipped other data X after unzipping
and serving
X after unzipping
Images (JPG,
PNG, TIF)
X X
Feature services X X
Layer package,
map package
X
Joseph Kerski 12
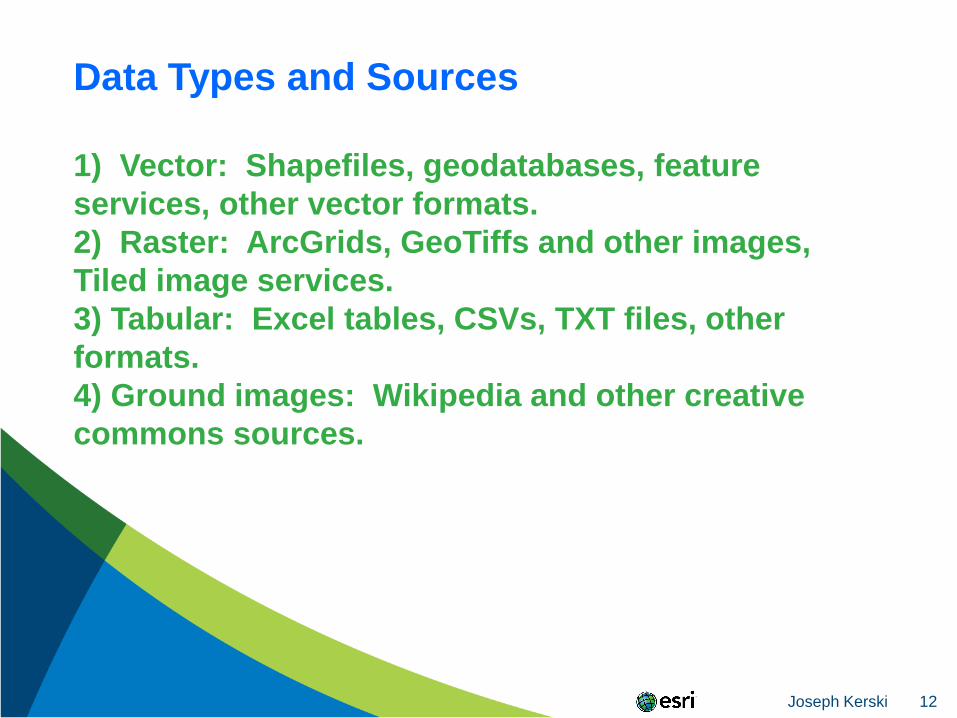
Data Types and Sources
1) Vector: Shapefiles, geodatabases, feature
services, other vector formats.
2) Raster: ArcGrids, GeoTiffs and other images,
Tiled image services.
3) Tabular: Excel tables, CSVs, TXT files, other
formats.
4) Ground images: Wikipedia and other creative
commons sources.
Joseph Kerski 13
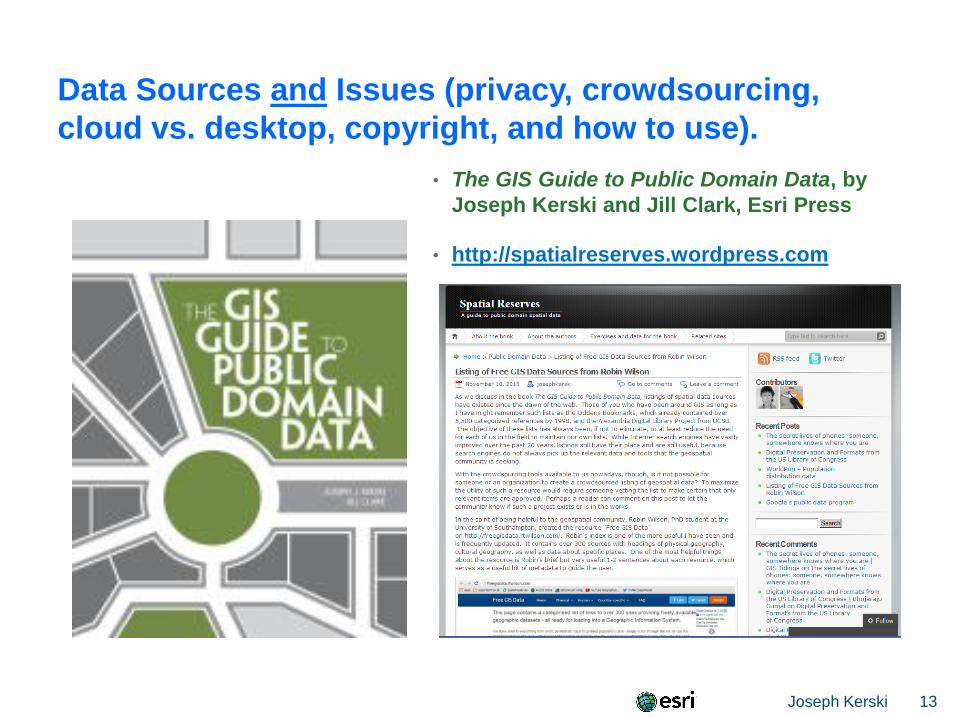
Data Sources and Issues (privacy, crowdsourcing,
cloud vs. desktop, copyright, and how to use).
• The GIS Guide to Public Domain Data, by
Joseph Kerski and Jill Clark, Esri Press
• http://spatialreserves.wordpress.com
Joseph Kerski 14
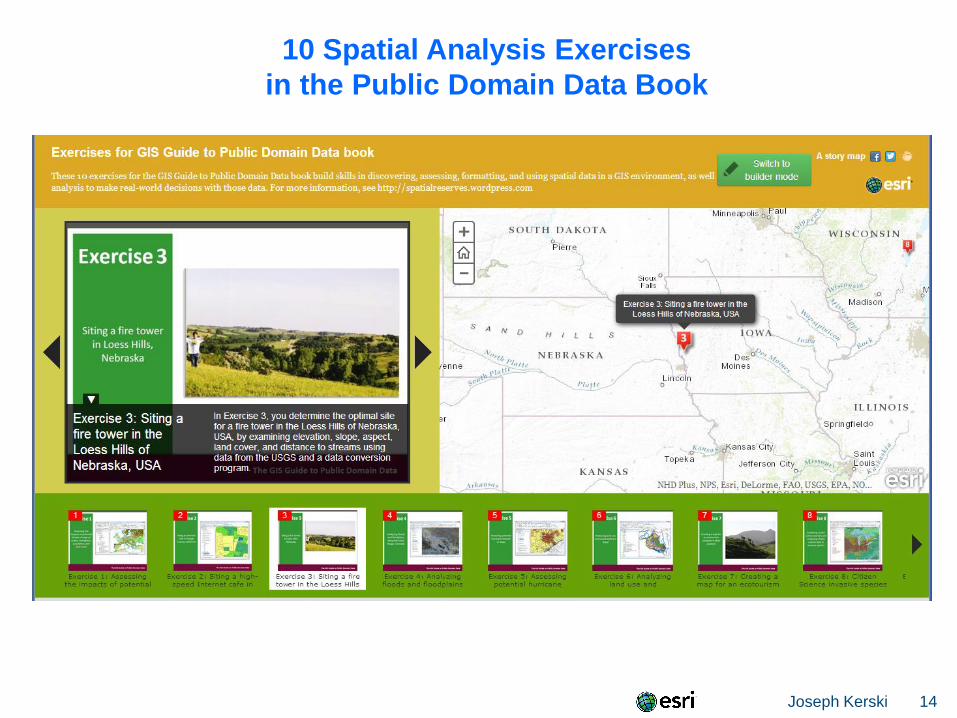
10 Spatial Analysis Exercises
in the Public Domain Data Book
Joseph Kerski 15
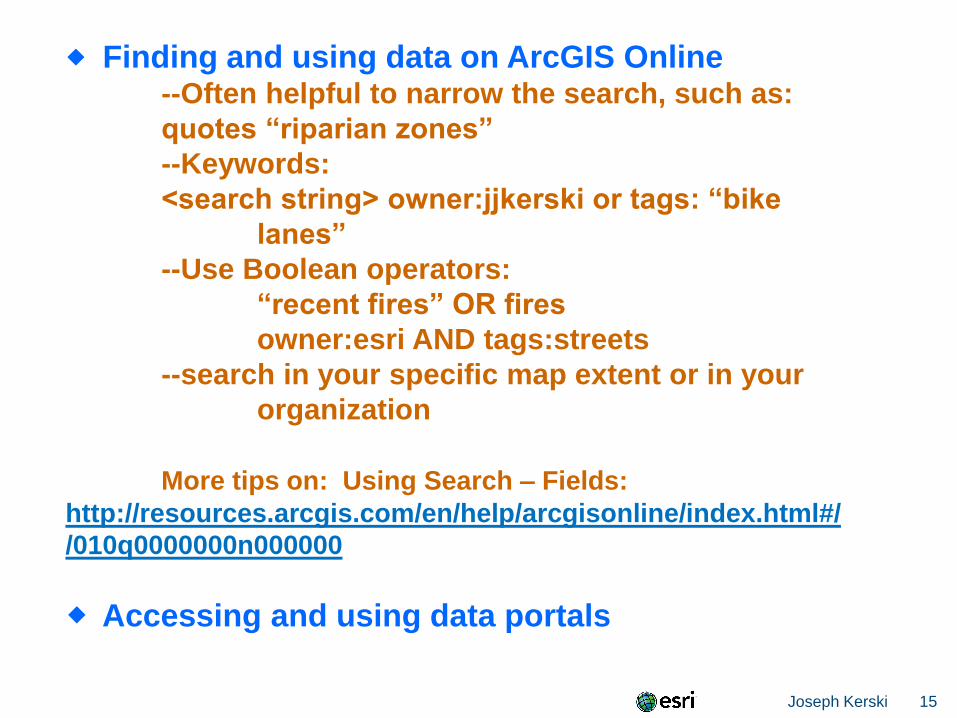
Finding and using data on ArcGIS Online--Often helpful to narrow the search, such as:
quotes “riparian zones”
--Keywords:
<search string> owner:jjkerski or tags: “bike
lanes”
--Use Boolean operators:
“recent fires” OR fires
owner:esri AND tags:streets
--search in your specific map extent or in your
organization
More tips on: Using Search – Fields:
http://resources.arcgis.com/en/help/arcgisonline/index.html#/
/010q0000000n000000
Accessing and using data portals
Joseph Kerski 16
Access Boulder County GIS Portal
Joseph Kerski 17
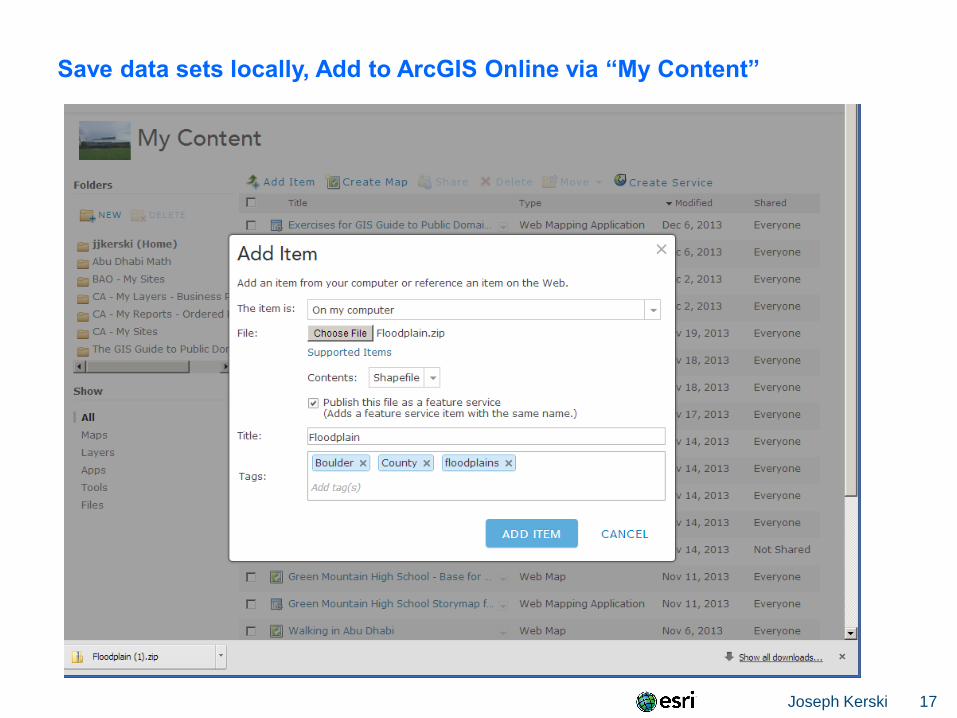
Save data sets locally, Add to ArcGIS Online via “My Content”

Joseph Kerski 19
Using ArcGIS Online Analytical Tools
ArcGIS Online is a cloud-based GIS, not just an online set
of web maps. Hence, you can use it for conducting spatial
analysis.
The spatial analysis capabilities of ArcGIS Desktop still
far exceed that of ArcGIS Online, given its 30 year head
start, but more analytical capabilities are being added
quarterly to ArcGIS Online.
The spatial analytical tools in ArcGIS Online are easy to
use. They are accessed from the arrows to the right of
specific layers. Whether you see the analytical tools
depends on (1) if you are using an ArcGIS Online
organizational subscription, and (2) how the data are served
in ArcGIS Online (i.e. ideally, as services)
Joseph Kerski 20
Hands-On Activities
1. Plate Tectonics.
2. London cholera in 1854
3. Real Time Weather.
4. Floodplains and Geologic Hazards.
5. Crime.
Joseph Kerski 21
Hands-On Activity: Plate Tectonics
Using Analytical capabilities in ArcGIS Online.
Examine: Layers, CSVs, feature services, styling,
filtering, tabular work, statistics, analysis.
Questions include:
What is the spatial pattern of earthquakes?
Where did the deepest and most intense earthquakes
occur?
What is the relationship of the pattern of earthquakes to
plate boundaries?
Joseph Kerski 22
Hands-On Activity: Plate Tectonics
www.arcgis.com > Create folder for plate tectonics
analysis > Search for Plates 4 Types map > Save map in
your working folder.
http://earthquakes.usgs.gov > Real Time Feeds and
Notifications > Spreadsheet Format.
Joseph Kerski 23
Hands-On Activity: Cholera Analysis, London
1854
Using Analytical capabilities in ArcGIS Online
Problem Statement: What percentage of the cholera
outbreak cases are associated with the Broad Street well?
You will consider public water pumps, and locations with 1
or more deaths, in your assessment.

Joseph Kerski 24
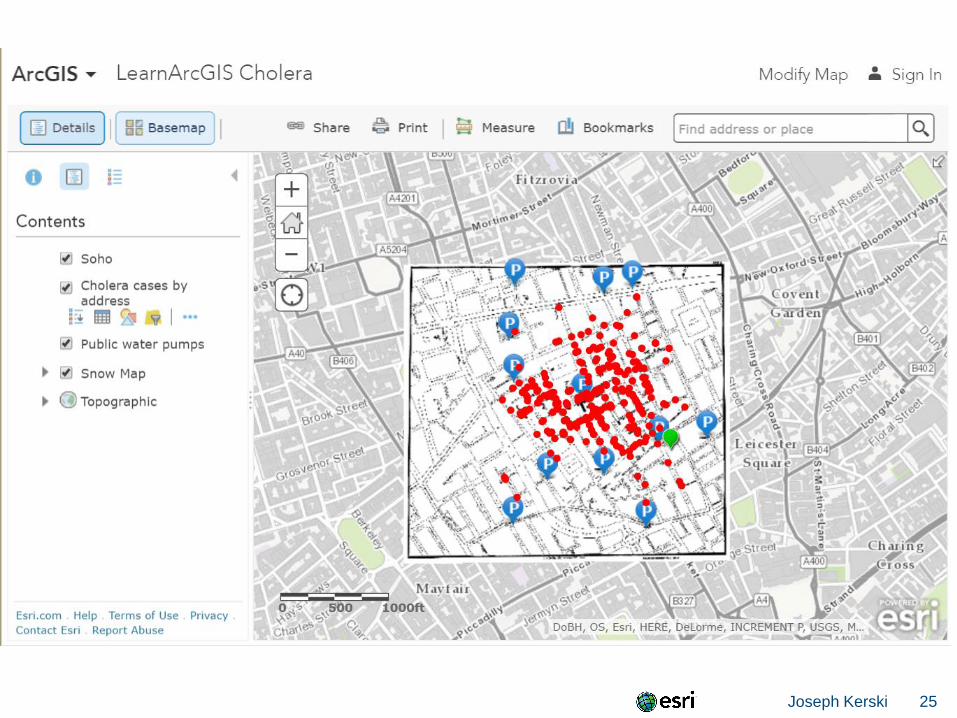
Hands-On Activity: Cholera Analysis, London
1854
Start with: www.arcgis.com > Create cholera folder >
Search for LearnArcGIS Cholera > Save it in your folder >
Then: A series of analytical steps designed to understand
the patterns of the cholera deaths and to compute a route
for Dr Snow and Rev. Whitehead to visit the cholera victims’
homes.
Joseph Kerski 25
Joseph Kerski 26
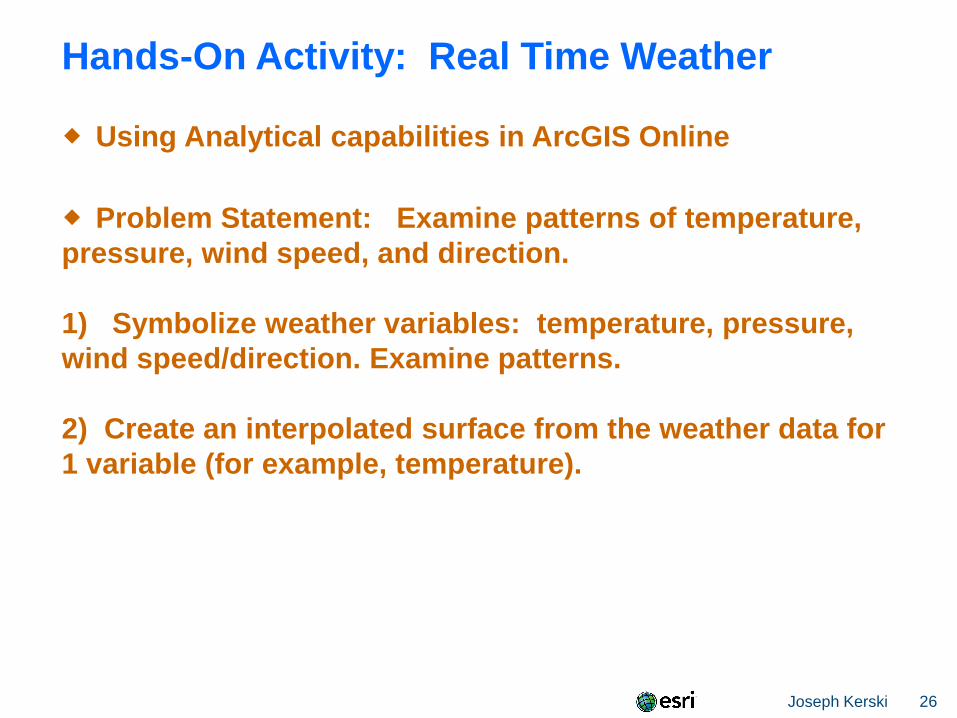
Hands-On Activity: Real Time Weather
Using Analytical capabilities in ArcGIS Online
Problem Statement: Examine patterns of temperature,
pressure, wind speed, and direction.
1) Symbolize weather variables: temperature, pressure,
wind speed/direction. Examine patterns.
2) Create an interpolated surface from the weather data for
1 variable (for example, temperature).
Joseph Kerski 27
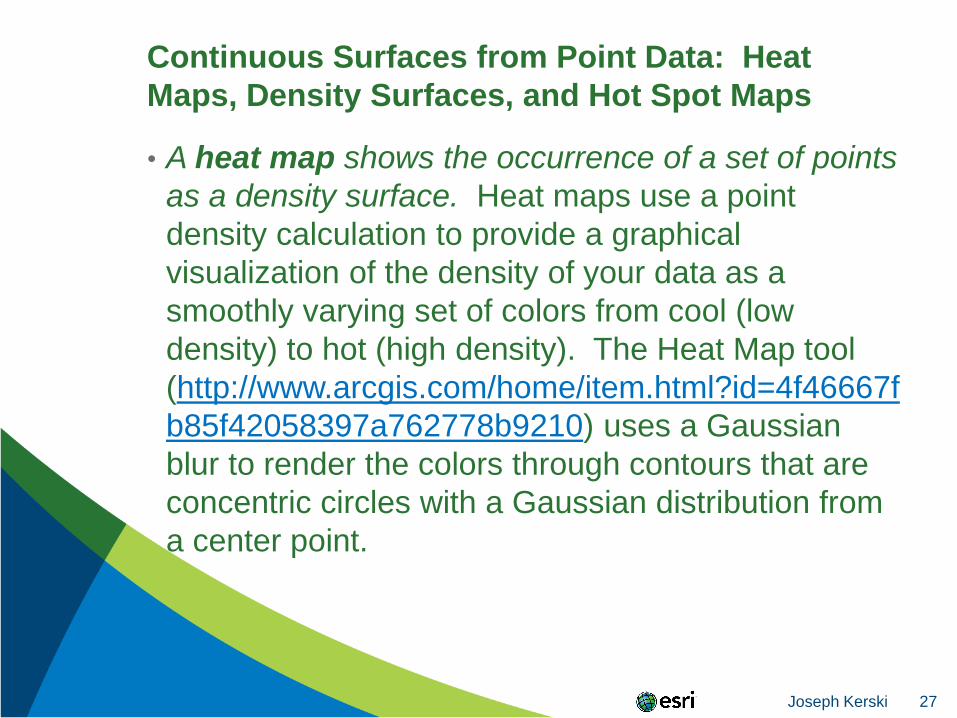
Continuous Surfaces from Point Data: Heat
Maps, Density Surfaces, and Hot Spot Maps
• A heat map shows the occurrence of a set of points
as a density surface. Heat maps use a point
density calculation to provide a graphical
visualization of the density of your data as a
smoothly varying set of colors from cool (low
density) to hot (high density). The Heat Map tool
(http://www.arcgis.com/home/item.html?id=4f46667f
b85f42058397a762778b9210) uses a Gaussian
blur to render the colors through contours that are
concentric circles with a Gaussian distribution from
a center point.
Joseph Kerski 28
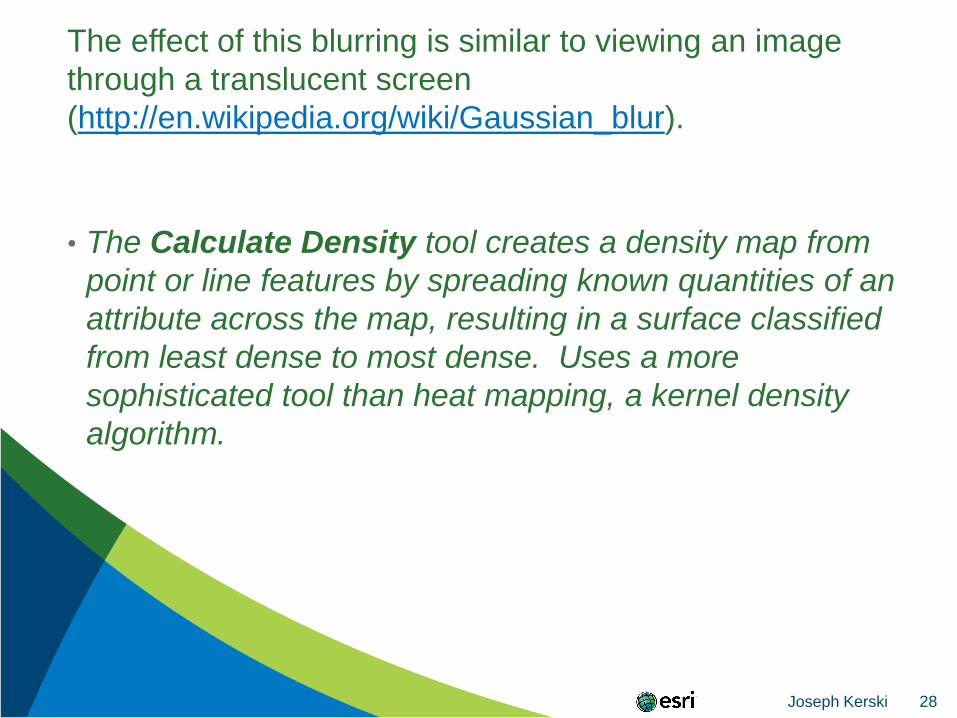
The effect of this blurring is similar to viewing an image
through a translucent screen
(http://en.wikipedia.org/wiki/Gaussian_blur).
• The Calculate Density tool creates a density map from
point or line features by spreading known quantities of an
attribute across the map, resulting in a surface classified
from least dense to most dense. Uses a more
sophisticated tool than heat mapping, a kernel density
algorithm.

Joseph Kerski 29
• A Hot Spot map shows the results of statistically
significant spatial clusters of high values (hot spots) and
low values (cold spots). A mathematical algorithm is
used and the results are expressed in terms of statistical
confidence.
• Both the Heat Map and Calculate Density tools indicate
the density of features. Hot spot maps show clustering
that is statistically significant, rather than just an
indication of density.
•
Joseph Kerski 30
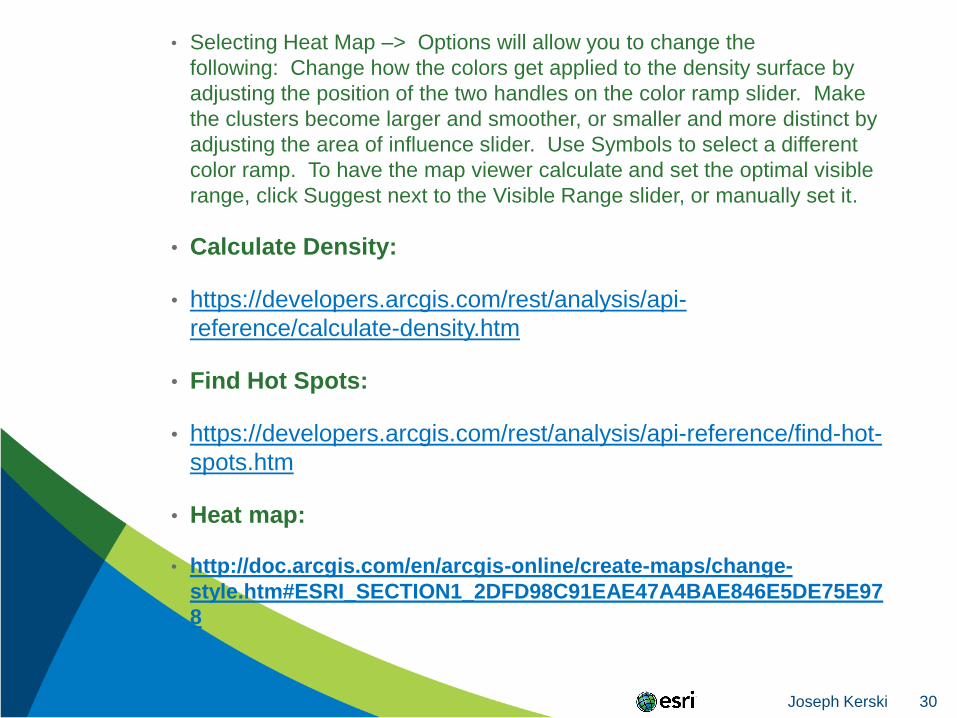
• Selecting Heat Map –> Options will allow you to change the
following: Change how the colors get applied to the density surface by
adjusting the position of the two handles on the color ramp slider. Make
the clusters become larger and smoother, or smaller and more distinct by
adjusting the area of influence slider. Use Symbols to select a different
color ramp. To have the map viewer calculate and set the optimal visible
range, click Suggest next to the Visible Range slider, or manually set it.
• Calculate Density:
• https://developers.arcgis.com/rest/analysis/api-
reference/calculate-density.htm
• Find Hot Spots:
• https://developers.arcgis.com/rest/analysis/api-reference/find-hot-
spots.htm
• Heat map:
• http://doc.arcgis.com/en/arcgis-online/create-maps/change-
style.htm#ESRI_SECTION1_2DFD98C91EAE47A4BAE846E5DE75E97
8
Joseph Kerski 31
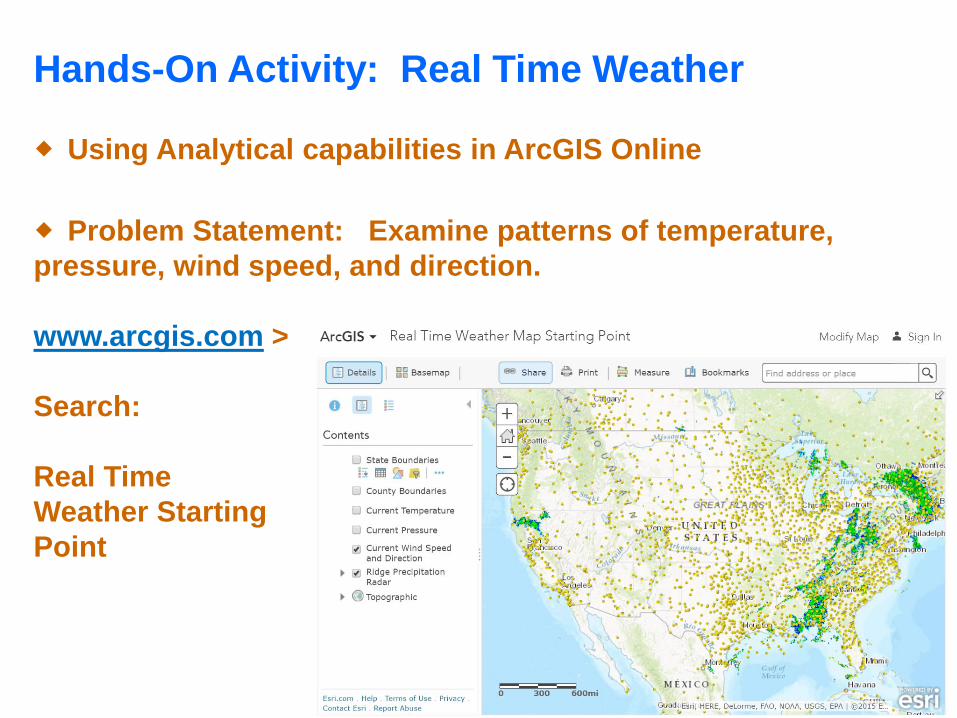
Hands-On Activity: Real Time Weather
Using Analytical capabilities in ArcGIS Online
Problem Statement: Examine patterns of temperature,
pressure, wind speed, and direction.
www.arcgis.com >
Search:
Real Time
Weather Starting
Point
Joseph Kerski 32
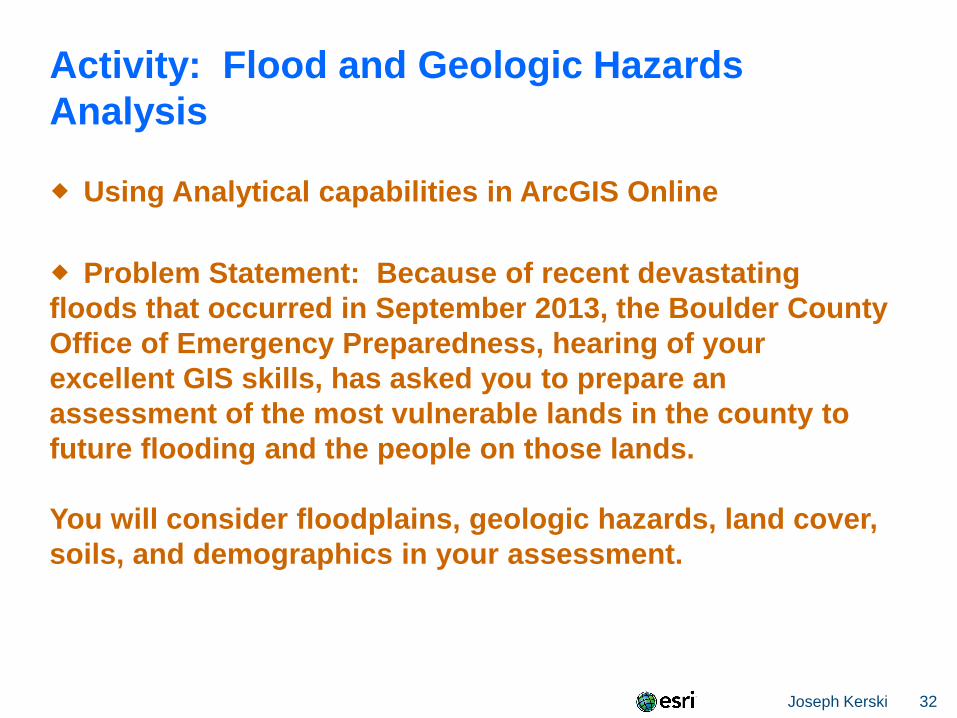
Activity: Flood and Geologic Hazards
Analysis
Using Analytical capabilities in ArcGIS Online
Problem Statement: Because of recent devastating
floods that occurred in September 2013, the Boulder County
Office of Emergency Preparedness, hearing of your
excellent GIS skills, has asked you to prepare an
assessment of the most vulnerable lands in the county to
future flooding and the people on those lands.
You will consider floodplains, geologic hazards, land cover,
soils, and demographics in your assessment.
Joseph Kerski 33
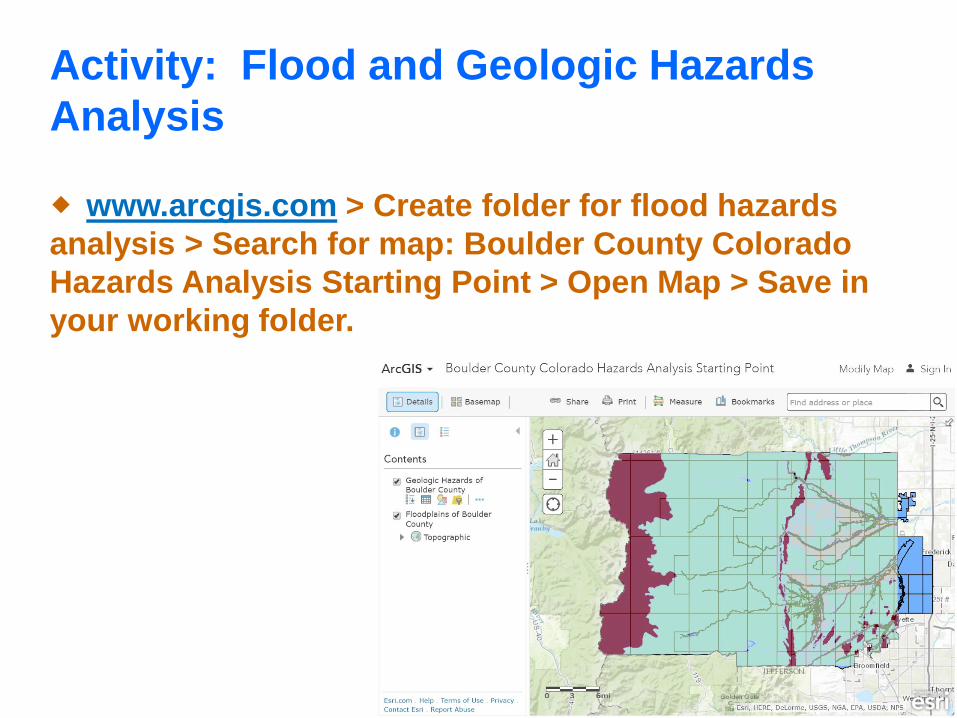
Activity: Flood and Geologic Hazards
Analysis
www.arcgis.com > Create folder for flood hazards
analysis > Search for map: Boulder County Colorado
Hazards Analysis Starting Point > Open Map > Save in
your working folder.
Joseph Kerski 34
Analysis Workflow
1. Filter Floodplains layer to only consider the true
floodplains. Filter geologic hazards layer to only consider
Major Hazards.
2. Proximity Buffer floodplains by 200 meters.
3. Dissolve the buffer’s internal polygons.
4. Manage Data Overlay Intersect the dissolved
floodplain buffers with Major Geologic Hazards.
5. Sort on Analysis Area and only consider the largest
polygons.
6. Data Enrichment, with Group Quarters and %
Wetlands.
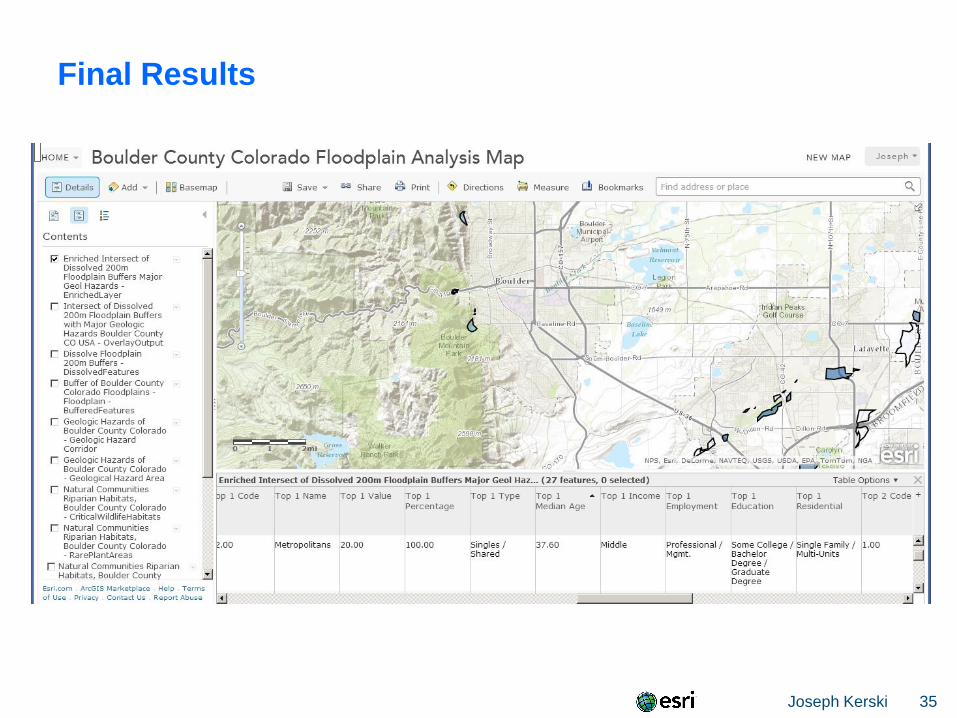
Joseph Kerski 35
Final Results
Joseph Kerski 36
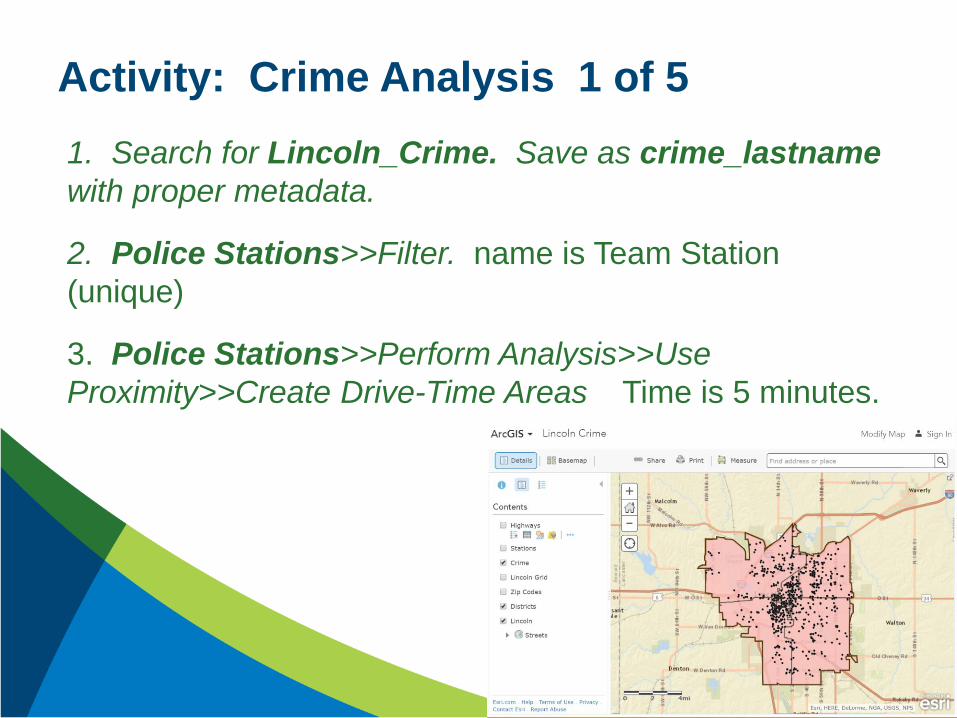
Activity: Crime Analysis 1 of 5
1. Search for Lincoln_Crime. Save as crime_lastname
with proper metadata.
2. Police Stations>>Filter. name is Team Station
(unique)
3. Police Stations>>Perform Analysis>>Use
Proximity>>Create Drive-Time Areas Time is 5 minutes.
Joseph Kerski 37
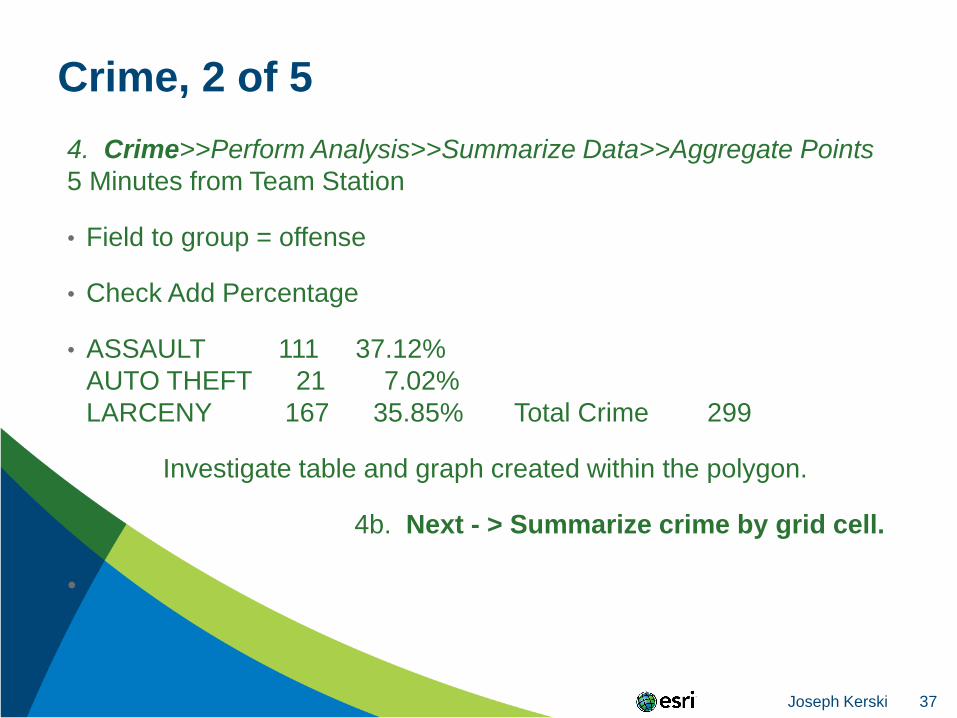
Crime, 2 of 5
4. Crime>>Perform Analysis>>Summarize Data>>Aggregate Points
5 Minutes from Team Station
• Field to group = offense
• Check Add Percentage
• ASSAULT 111 37.12%
AUTO THEFT 21 7.02%
LARCENY 167 35.85% Total Crime 299
Investigate table and graph created within the polygon.
4b. Next - > Summarize crime by grid cell.
•
Joseph Kerski 38
Crime, 3 of 5
5. Crime>>Change Style>>Heat Map
• Try additional analysis by offense:
• Filter for Assault
• Filter for Auto Theft
• Filter for Larceny
A heat map is a graphical representation of data where the
individual values area represented as colors. No new data is
formed. The data is styled.
•

Joseph Kerski 39
Crime, 4 of 5
Density surfaces show where point or line features are concentrated. It
shows the predicted distribution throughout the landscape. A mathematical
algorithm is used and new data is produced.
• 6. Crime>>Perform Analysis>>Analyze Patterns>>Calculate Density
Options:
• Search Distance = Miles (Default)
• Clip Output to Lincoln
• Number of Classes = 10
• Output Area Units = Square Miles
Joseph Kerski 40
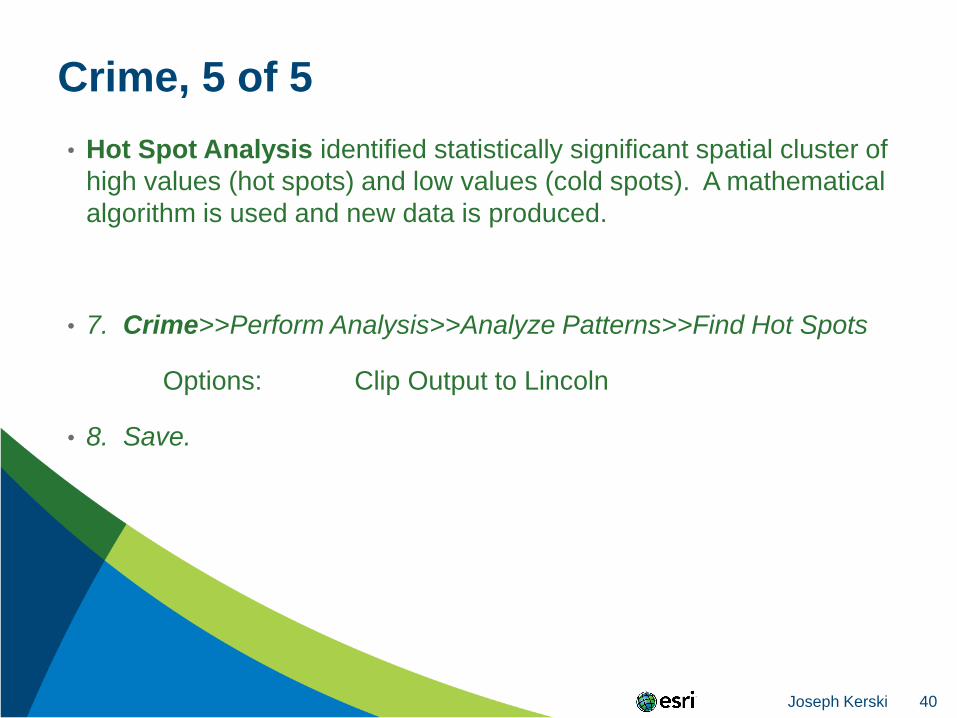
Crime, 5 of 5
• Hot Spot Analysis identified statistically significant spatial cluster of
high values (hot spots) and low values (cold spots). A mathematical
algorithm is used and new data is produced.
• 7. Crime>>Perform Analysis>>Analyze Patterns>>Find Hot Spots
Options: Clip Output to Lincoln
• 8. Save.
Joseph Kerski 41
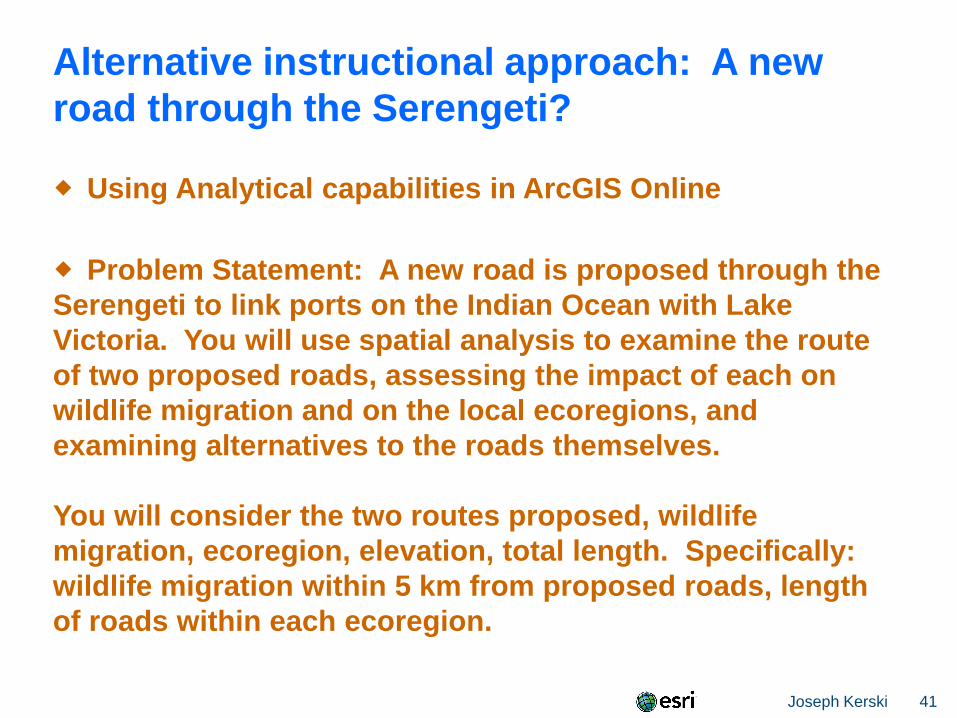
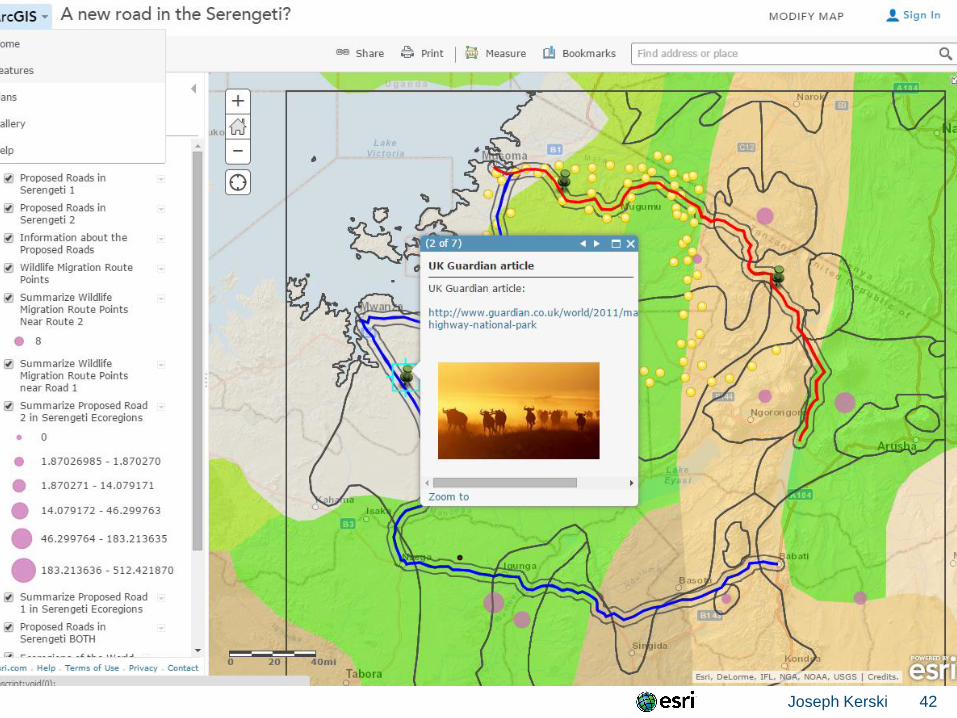
Alternative instructional approach: A new
road through the Serengeti?
Using Analytical capabilities in ArcGIS Online
Problem Statement: A new road is proposed through the
Serengeti to link ports on the Indian Ocean with Lake
Victoria. You will use spatial analysis to examine the route
of two proposed roads, assessing the impact of each on
wildlife migration and on the local ecoregions, and
examining alternatives to the roads themselves.
You will consider the two routes proposed, wildlife
migration, ecoregion, elevation, total length. Specifically:
wildlife migration within 5 km from proposed roads, length
of roads within each ecoregion.
Joseph Kerski 42
Joseph Kerski 43
Instructional Considerations
You can have your stakeholders perform the analysis.
- Or -
You can perform the analysis and have your stakeholders
analyze the results (as I do often with the Serengeti lesson).
- Or –
A combination of the two.
- Or –
Teach with visual analysis of patterns, linkages, and trends,
without the quantitative measures.
Joseph Kerski 44
Next Steps 1 of 2
Access these maps in ArcGIS Online. They are all public. Go
through some of these analytical steps.
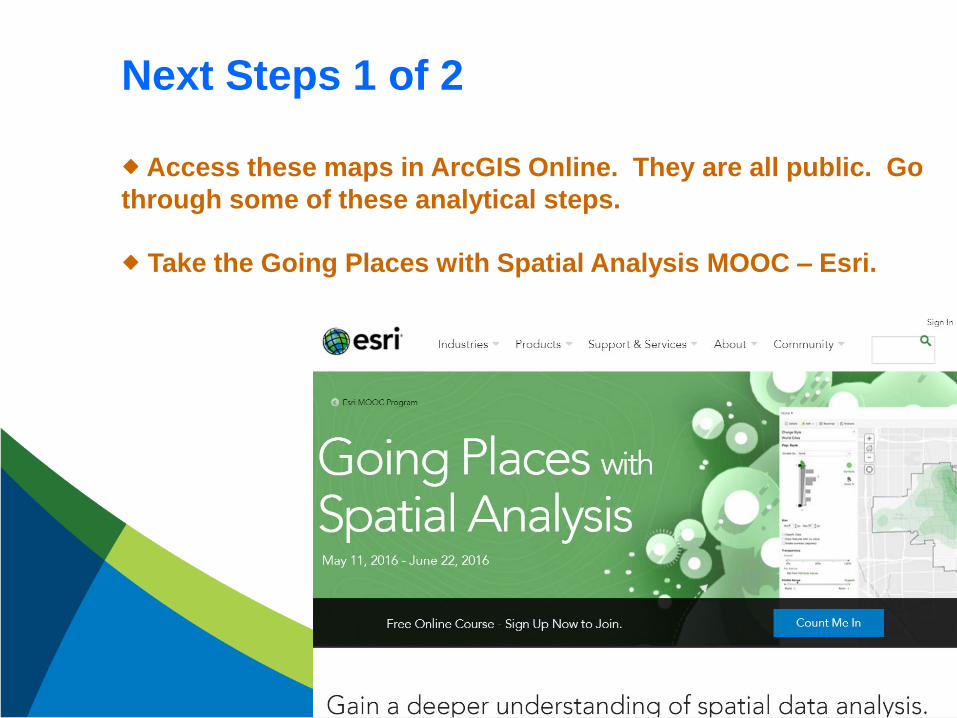
Take the Going Places with Spatial Analysis MOOC – Esri.
Joseph Kerski 45
Next Steps 2 of 2
Examine “How to teach with the ArcGIS Platform” documents,
including video on spatial analysis tools:
http://www.esri.com/landing-pages/industries/education/higher-
education/teach-with-arcgis-platform
Review video tutorials: A Deeper Dive with ArcGIS Online:
See playlist : http://www.youtube.com/geographyuberalles
Joseph Kerski 46
Spatial Analysis in ArcGIS
Online
Joseph Kerski, PhD GISP
Education Manager
Esri
http://www.youtube.com/geographyuberalles
Twitter http://twitter.com/josephkerski
303-449-7779 x 18237