sparebank 1 sr-bank - cisionmb.cision.com/main/2876/9318352/54613.pdf · the sparebank 1 sr-bank...
TRANSCRIPT

Contents.
2.
3.
4.
6.
10.
14.
20.
22.
25.
46.
47.
48.
49.
50.
51.
53.
54.
55.
56.
SpareBank 1 SR-Bank
Main and key figures
A bank for everyone
A bank for all generations
A bank for business and industry
Directors Report for 1999
Annual Accounts for 1999
Accounting Principles
Notes
Cash flow analysis
Auditors’ and The Audit Committee’s Report
Deposits, Loans and Profits
Five-year Overviews in key figures
Five-year Overviews in Graphs
Primary Capital Certificates
Representatives
Organisational Chart
Map of branch offices
Addresses overview
1.
2.
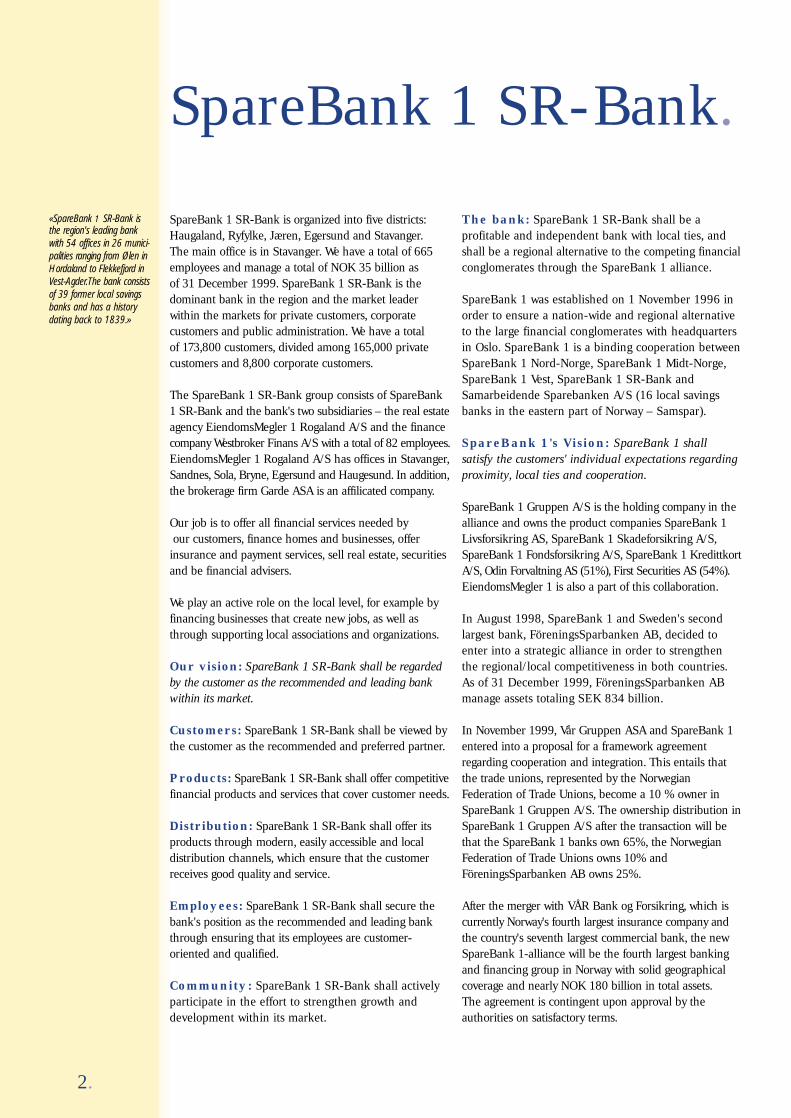
SpareBank 1 SR-Bank is organized into five districts:Haugaland, Ryfylke, Jæren, Egersund and Stavanger. The main office is in Stavanger. We have a total of 665employees and manage a total of NOK 35 billion as of 31 December 1999. SpareBank 1 SR-Bank is the dominant bank in the region and the market leader within the markets for private customers, corporate customers and public administration. We have a total of 173,800 customers, divided among 165,000 privatecustomers and 8,800 corporate customers.
The SpareBank 1 SR-Bank group consists of SpareBank1 SR-Bank and the bank's two subsidiaries – the real estateagency EiendomsMegler 1 Rogaland A/S and the financecompany Westbroker Finans A/S with a total of 82 employees.EiendomsMegler 1 Rogaland A/S has offices in Stavanger,Sandnes, Sola, Bryne, Egersund and Haugesund. In addition,the brokerage firm Garde ASA is an affilicated company.
Our job is to offer all financial services needed byour customers, finance homes and businesses, offer
insurance and payment services, sell real estate, securitiesand be financial advisers.
We play an active role on the local level, for example byfinancing businesses that create new jobs, as well asthrough supporting local associations and organizations.
Our vision: SpareBank 1 SR-Bank shall be regardedby the customer as the recommended and leading bankwithin its market.
Customers: SpareBank 1 SR-Bank shall be viewed bythe customer as the recommended and preferred partner.
Products: SpareBank 1 SR-Bank shall offer competitivefinancial products and services that cover customer needs.
Distribution: SpareBank 1 SR-Bank shall offer itsproducts through modern, easily accessible and local distribution channels, which ensure that the customerreceives good quality and service.
Employees: SpareBank 1 SR-Bank shall secure thebank's position as the recommended and leading bankthrough ensuring that its employees are customer-oriented and qualified.
Community: SpareBank 1 SR-Bank shall actively participate in the effort to strengthen growth anddevelopment within its market.
The bank: SpareBank 1 SR-Bank shall be a profitable and independent bank with local ties, andshall be a regional alternative to the competing financialconglomerates through the SpareBank 1 alliance.
SpareBank 1 was established on 1 November 1996 inorder to ensure a nation-wide and regional alternativeto the large financial conglomerates with headquartersin Oslo. SpareBank 1 is a binding cooperation betweenSpareBank 1 Nord-Norge, SpareBank 1 Midt-Norge,SpareBank 1 Vest, SpareBank 1 SR-Bank andSamarbeidende Sparebanken A/S (16 local savingsbanks in the eastern part of Norway – Samspar).
SpareBank 1's Vision: SpareBank 1 shall satisfy the customers' individual expectations regardingproximity, local ties and cooperation.
SpareBank 1 Gruppen A/S is the holding company in thealliance and owns the product companies SpareBank 1Livsforsikring AS, SpareBank 1 Skadeforsikring A/S,SpareBank 1 Fondsforsikring A/S, SpareBank 1 KredittkortA/S, Odin Forvaltning AS (51%), First Securities AS (54%).EiendomsMegler 1 is also a part of this collaboration.
In August 1998, SpareBank 1 and Sweden's secondlargest bank, FöreningsSparbanken AB, decided toenter into a strategic alliance in order to strengthen the regional/local competitiveness in both countries.As of 31 December 1999, FöreningsSparbanken ABmanage assets totaling SEK 834 billion.
In November 1999, Vår Gruppen ASA and SpareBank 1entered into a proposal for a framework agreementregarding cooperation and integration. This entails thatthe trade unions, represented by the NorwegianFederation of Trade Unions, become a 10 % owner inSpareBank 1 Gruppen A/S. The ownership distribution inSpareBank 1 Gruppen A/S after the transaction will bethat the SpareBank 1 banks own 65%, the NorwegianFederation of Trade Unions owns 10% andFöreningsSparbanken AB owns 25%.
After the merger with VÅR Bank og Forsikring, which iscurrently Norway's fourth largest insurance company andthe country's seventh largest commercial bank, the newSpareBank 1-alliance will be the fourth largest bankingand financing group in Norway with solid geographicalcoverage and nearly NOK 180 billion in total assets. The agreement is contingent upon approval by theauthorities on satisfactory terms.
SpareBank 1 SR-Bank.
«SpareBank 1 SR-Bank isthe region's leading bankwith 54 offices in 26 munici-palities ranging from Ølen inHordaland to Flekkefjord inVest-Agder.The bank consistsof 39 former local savingsbanks and has a historydating back to 1839.»
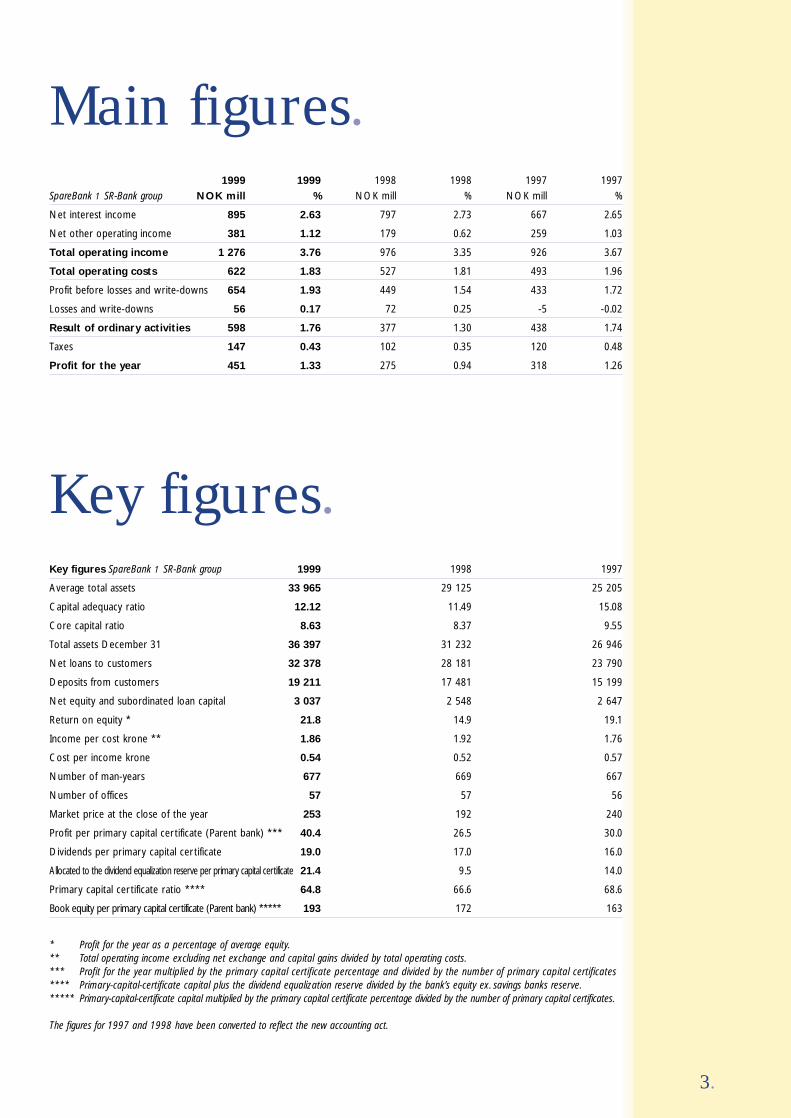
SpareBank 1 SR-Bank group NOK mill % NOK mill % NOK mill %
Net interest income 895 2.63 797 2.73 667 2.65
Net other operating income 381 1.12 179 0.62 259 1.03
Total operating income 1 276 3.76 976 3.35 926 3.67
Total operating costs 622 1.83 527 1.81 493 1.96
Profit before losses and write-downs 654 1.93 449 1.54 433 1.72
Losses and write-downs 56 0.17 72 0.25 -5 -0.02
Result of ordinary activities 598 1.76 377 1.30 438 1.74
Taxes 147 0.43 102 0.35 120 0.48
Profit for the year 451 1.33 275 0.94 318 1.26
Key figures SpareBank 1 SR-Bank group 1999 1998 1997
Average total assets 33 965 29 125 25 205
Capital adequacy ratio 12.12 11.49 15.08
Core capital ratio 8.63 8.37 9.55
Total assets December 31 36 397 31 232 26 946
Net loans to customers 32 378 28 181 23 790
Deposits from customers 19 211 17 481 15 199
Net equity and subordinated loan capital 3 037 2 548 2 647
Return on equity * 21.8 14.9 19.1
Income per cost krone ** 1.86 1.92 1.76
Cost per income krone 0.54 0.52 0.57
Number of man-years 677 669 667
Number of offices 57 57 56
Market price at the close of the year 253 192 240
Profit per primary capital certificate (Parent bank) *** 40.4 26.5 30.0
Dividends per primary capital certificate 19.0 17.0 16.0
Allocated to the dividend equalization reserve per primary capital certificate 21.4 9.5 14.0
Primary capital certificate ratio **** 64.8 66.6 68.6
Book equity per primary capital certificate (Parent bank) ***** 193 172 163
3.
Key figures.
Main figures.1999 1999 1998 1998 1997 1997
* Profit for the year as a percentage of average equity.** Total operating income excluding net exchange and capital gains divided by total operating costs.*** Profit for the year multiplied by the primary capital certificate percentage and divided by the number of primary capital certificates**** Primary-capital-certificate capital plus the dividend equalization reserve divided by the bank’s equity ex. savings banks reserve.***** Primary-capital-certificate capital multiplied by the primary capital certificate percentage divided by the number of primary capital certificates.
The figures for 1997 and 1998 have been converted to reflect the new accounting act.
«We will do our utmost toensure that the customersin our region always have a competitive financialpartner with local ties.»
4.
A bank for everyone.
SpareBank 1 SR-Bank consolidated its position in1999 as the bank for everyone in our region. We arehappy to see the good results and progress made inthe quality of the services provided to the customers.We have set an ambitious goal; we want to be therecommended bank for our customers. Thus, we aimhigh. A motivated and competent organization workshard every day to meet the customers' needs. Themarkets are undergoing major changes. New productsare added and the customers' needs change – alsodepending on what phase of life they are goingthrough. Our challenge as a bank is to be able tooffer our customers competitive products and goodcounseling in a world where framework conditionsand the competition change with an enormous speed.
Closeness of a local bankThe technological development entails major changesin how we meet our customers. The Internet bank isin the process of taking over many of the simple andtraditional banking operations. The number of trans-actions via the Internet bank is currently increasing by20 percent per month and will in a short time exceedthe number of transactions on bank premises. Thiswill of course change the workday for many of ouremployees. However, we are not of the opinion that theposition of the local bank is threatened by technolog-ical changes, but the contents of the tasks will bechanged. We believe that future customers will needmore counseling. Good advice is based on trust and thisis where the human factor is essential. Our ambitionis clearly stated; through the closeness of the localbank and its knowledge of the market, we wish to bethe leading financial partner for private and corpo-rate customers. Through good advice and good finan-cial solutions, we will contribute to improved privatefinances and improved profitability for our customers.
Strength of a large-scale bankDevelopment of technology, good products and a strongbrand name is expensive and these are important forcesthat explain concentration and mergers within thefinancial industry. Through the SpareBank 1-allianceand collaboration with FöreningsSparbanken inSweden, we have established Scandinavia's leadingbanking alliance. This is not goal in itself, but ameans of reaching our local goals. We want to takeadvantage of the economies of scale without the dis-advantages associated with large mergers.Through the SpareBank 1 Alliance we are offeredcompetitive products and cost-effective technological
solutions adapted to the future requirements regarding good banking operations.
Financial partner with local tiesOur region enjoys the benefits of a very competitivefinancial services industry with both local, national andinternational players. This is good for the customers.
Through the SpareBank 1-alliance, SpareBank 1 SR-Bank is now a competitive financial partner withlocal ties. We want to combine the closeness of alocal bank with the strength of a large-scale bank. It is essential for us that all decisions concerning thecustomers are based on local ties.
We are of the opinion that a financial alternativebased on our model warrants a role within this competitive picture. We will do our utmost to ensurethat the customers in our region always have a competitive financial partner with local ties.
The bank for everyoneSpareBank 1 SR-Bank is currently the leading bankin the region. We want to strengthen this position,both in relation to private customers and industry andcommerce. Industry and commerce are facing majorchallenges in the years ahead, and many new jobsmust be created through innovations and offsprings.We want to be a good financial partner for businessdevelopment and setting up house in our region.
Through the SpareBank 1 group's acquisition of VårBank og Forsikring, we have a good foundation forstrengthening the position in our region even further.We are significantly stronger in the insurance marketand make contact with large, new customer groupswith a need for good financial products.
We want to become an even better bank and to con-solidate our position as the bank for everyone and weare making good progress. You, the customer, decide.We will always do our best to meet your expectationsin order that you safely can recommend us to yourbest friends and connections.
Stavanger, February 2000
Terje VarebergManaging Director
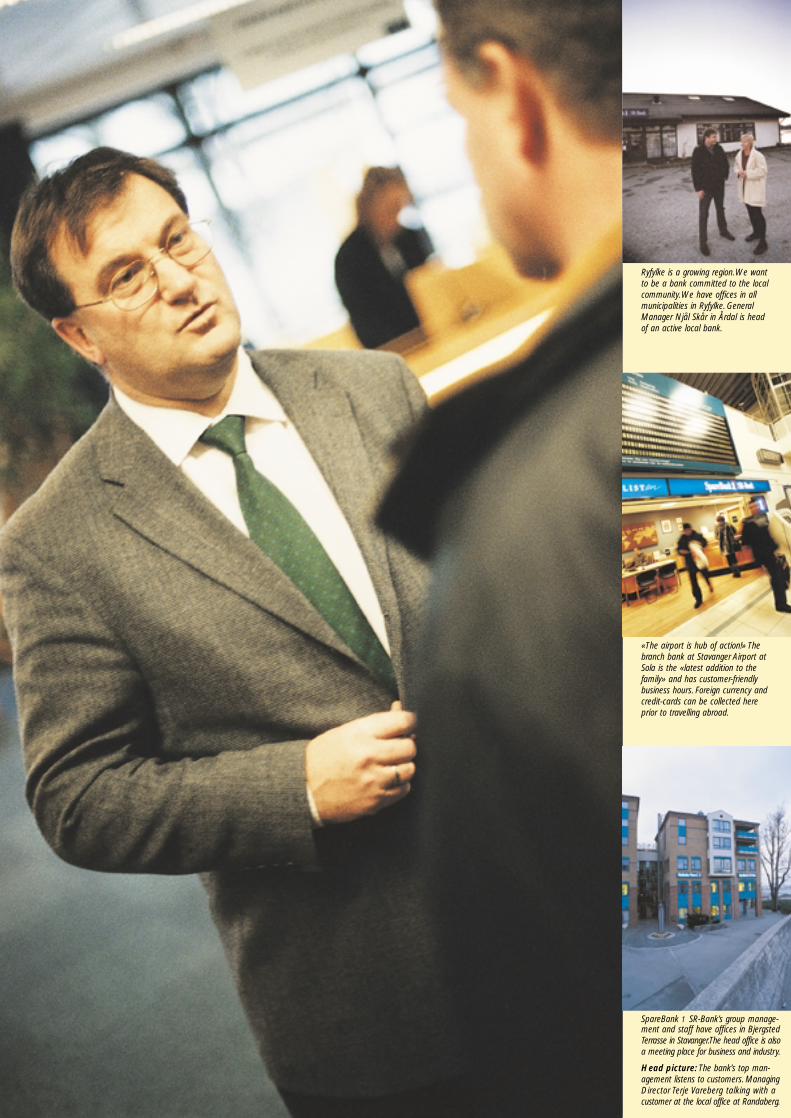
Ryfylke is a growing region.We wantto be a bank committed to the localcommunity.We have offices in allmunicipalities in Ryfylke. GeneralManager Njål Skår in Årdal is headof an active local bank.
«The airport is hub of action!» Thebranch bank at Stavanger Airport atSola is the «latest addition to thefamily» and has customer-friendlybusiness hours. Foreign currency andcredit-cards can be collected hereprior to travelling abroad.
SpareBank 1 SR-Bank’s group manage-ment and staff have offices in BjergstedTerrasse in Stavanger.The head office is alsoa meeting place for business and industry.
Head picture: The bank’s top man-agement listens to customers. ManagingDirector Terje Vareberg talking with acustomer at the local office at Randaberg.
SpareBank 1 SR-Bank was founded as a result of 22 local savings banks joining forces in 1976, andeven more banks have joined over time. Thirty yearslater, in 1996, the bank joined the SpareBank 1-alliance together with other long-established savingsbanks. The oldest bank is Egersund Sparebank whichcelebrated its 160-year anniversary last year. For generations this bank and the other savingsbanks have safeguarded our customers' money.SpareBank 1 SR-Bank's vision encompasses the corevalues from the local savings banks: «SpareBank 1SR-Bank shall be regarded by the customer as therecommended and leading bank within its market».
This vision focuses on the customers and their needs.The bank is founded on trust, quality, close customerrelations and local ties. Even though the bank haslocal ties, it is also facing the world at large. But themain focus is our customers from Rogaland and wehave now taken care of them for 160 years.Currently, our customers include almost half the population of Rogaland. SpareBank 1 SR-Bank has a strong local presence with 54 offices in 26 munici-palities ranging from Ølen to Flekkefjord. We wish tomaintain a close physical presence and accessibilityin the years to come, while we simultaneously develop a new electronic bank channel. We wish tomake it possible for our customers to chose how theywant to use the bank at any given time – both regarding automated self-service and personal problem-solving and counseling.
We have many different customers and SpareBank 1SR-Bank wants to be «a bank for everyone». Life has manyphases – characterized by different circumstances,
problems and opportunities. Elements include beingyoung, going to school, getting a job, buying a house,having children, becoming grandparents and retiring.Our private finances are affected in many ways as wepass through these phases. As a bank we are requiredto adapt our products to the phases our customersare going through and their everyday finances.
The bank for children and young peopleSmall children need to learn good habits regardingsaving money early on. For many years Sparius wastheir trusted companion. Today their new savingscompanions are called Labb and Line, and currentlythe new savings club has more than 26,000 savings
friends. We have introduced Labb and LineBarneforsikring (Children's Insurance) and
we will introduce Labb and Line mutualfund savings in the future. Mutual
fund savings for children is a newbut very exciting product for
many. It is all about getting a good start in life. Last year,children between elevenand fifteen were offeredmembership in – youguessed it, ElleveFemten-Klubben (the Eleven-FifteenClub). Currently,this club has almost
9,000 members, and it keeps on growing. The prod-uct is adapted to the customers' young age and theprocess of becoming more financially independent.
Students and other young people just starting outhave been very receptive of our «På Egne Ben» (On Your Own) program, which is a unique preferredcustomer program for young adults. More than12,000 customers above 16 years of age signed up for the product in the past year. They have beenassigned their own advisor and receive an offerregarding favorable home-ownership savings contracts.When they need their own home, SpareBank 1 SR-Bankoffers the market's best financing (up to 90 percentof the value of the home) as one of the benefits of På Egne Ben. For many years, the bank has supportedvarious youth activities related to sports, culture andeducation. This has benefited young people and wewill strengthen our efforts on behalf of young people and competence training in the near future through a dedicated endowment fund.
«We value good customersthat have shown us theirtrust by using SpareBank 1SR-Bank as their mainbank. As more and morepeople elect to use elec-tronic bank services,the bank’s operations will be less costly.»
6.
A bank for all generations.
50 000
40 000
30 000
20 000
10 000
00-10 11-15 16-34 18- 18-Age
Labb & Line
ElleveFemtenKlubben
På EgneBen
PrivatPluss
PrivatEkstra Source: Norsk Gallup
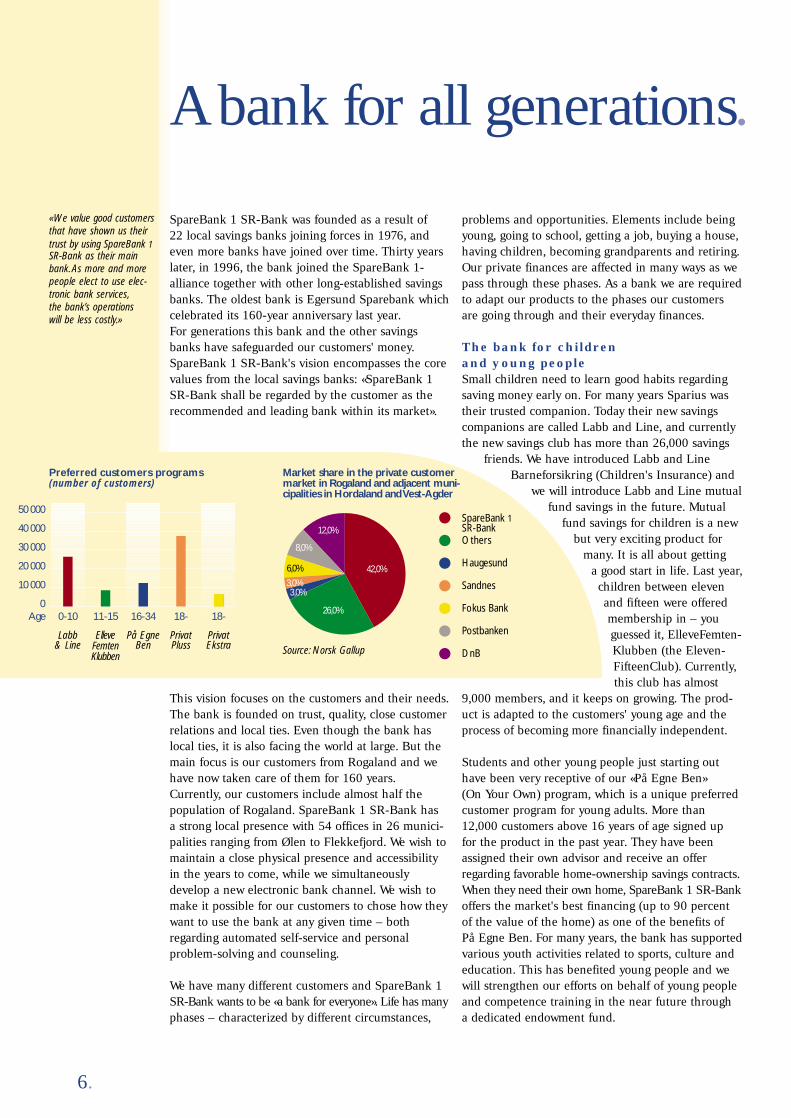
Preferred customers programs(number of customers)
Market share in the private customermarket in Rogaland and adjacent muni-cipalities in Hordaland and Vest-Agder
42,0%
26,0%
3,0%3,0%
6,0%
8,0%
12,0%
Sandnes
Haugesund
Others
Postbanken
DnB
SpareBank 1SR-Bank
Fokus Bank

Good savings habits last a lifetime.Children now have Labb and Linepiggy banks.When the piggy banksare emtied the children receiveprices. Labb and Line will release aCD in the year 2000 with fairy talesand music. Saving is fun!
When I am 13 I can have my own membership card in theElleveFemten Klubben (ElevenFifteenClub).When I am 16 I can join the«På Egne Ben» (On Your Own) program.
SR-Nettbank now has more than20,000 users. It is practical to sit athome and have an overview of yourown accounts.The bank’s job is to bean adviser, not a giro handler.
Head picture: The bank council inHaugesund handed out reflector badgesto six-year olds when school started.

Children now have a Labb and Linetrain. SpareBank 1 SR-Bank made anagreement with the local bus service.Children all over the county havesomething to look forward to.
«På Egne Ben» (On Your Own) is tailoredto young people starting out. Young people from the age of 16 can becomemembers.After having been a memberand saved under the BSU scheme, Spare-Bank 1 SR-Bank can offer the banks´smost favorable housing loan.Your ownpersonal advisor is part of the bargain.
Head picture: Our oldest customersneed a good bank. A bank that alsooffers social events and activities.«Den Gyldne Spaserstokk» (GoldenWalking Stick) is a popular initiativefor senior citizens.
Good customers shall benefitWe value good customers that have shown ustheir trust by using SpareBank 1 SR-Bankas their main bank. As more and morepeople elect to use the electronicbanking services, the bank'soperations will be less costly.This means that we can offerour established customerseven better products andservices in the preferredcustomer programs calledPrivat Pluss (PrivatePlus) and Privat Ekstra (Private Extra).
At the end of the year,37,000 and 6,500 customers respectivelyhas chosen to becomecustomers in the preferred customer programs. The main element in this conceptis a dedicated advisorwho is very familiar with the customer's personal finances. The customer willreceive personal counseling related to beneficial investments, loans,insurance, payment services, etc. Many of our oldestcustomers would like to receive offers regardingsocial events and activities outside of the ordinarybanking activities. Every year SpareBank 1 SR-Bankorganizes trips to Norwegian and foreign destinations.Locally, many senior citizens collect points in orderto qualify for «Den Gyldne Spaserstokk» (the GoldenWalking Stick).
It’s up to the customerSpareBank 1 SR-Bank has a broad range of productsadapted to customers in all phases of life. We emphasizethe importance of being the bank for everyone. Everylocal office can offer all financial services to the customerwhere he or she lives, whether this concerns savings,loans, life and non-life insurance, payment services orreal estate services. The bank received almost 8,000new non-life insurance customers in 1999, and weintroduced 10 new mutual funds from Odin
Forvaltning in November. We have well-managedproducts for customers that wish to place their sav-ings for short or long terms. New mutual funds andstock-indexed bank deposits, together with Unit Linkand Livrente (Life Annuity), are only a few of theproducts our customers can chose among.
New technology creates new opportunities for both the bank and the bank's customers. Internetand Nettbank (the Net Bank) are examples worthmentioning. In 1999 as many as 17,000 customersperformed the most common banking services fromtheir own PC. We welcome this development and arepreparing for developing the Internet services evenmore in cooperation with FöreningsSparbanken.There is a great potential and we have seen just the beginning of a totally new way of distributingbanking services. However, it is the customer whodecides how he or she wants the menu prepared – electronic or personal – or both.
9.
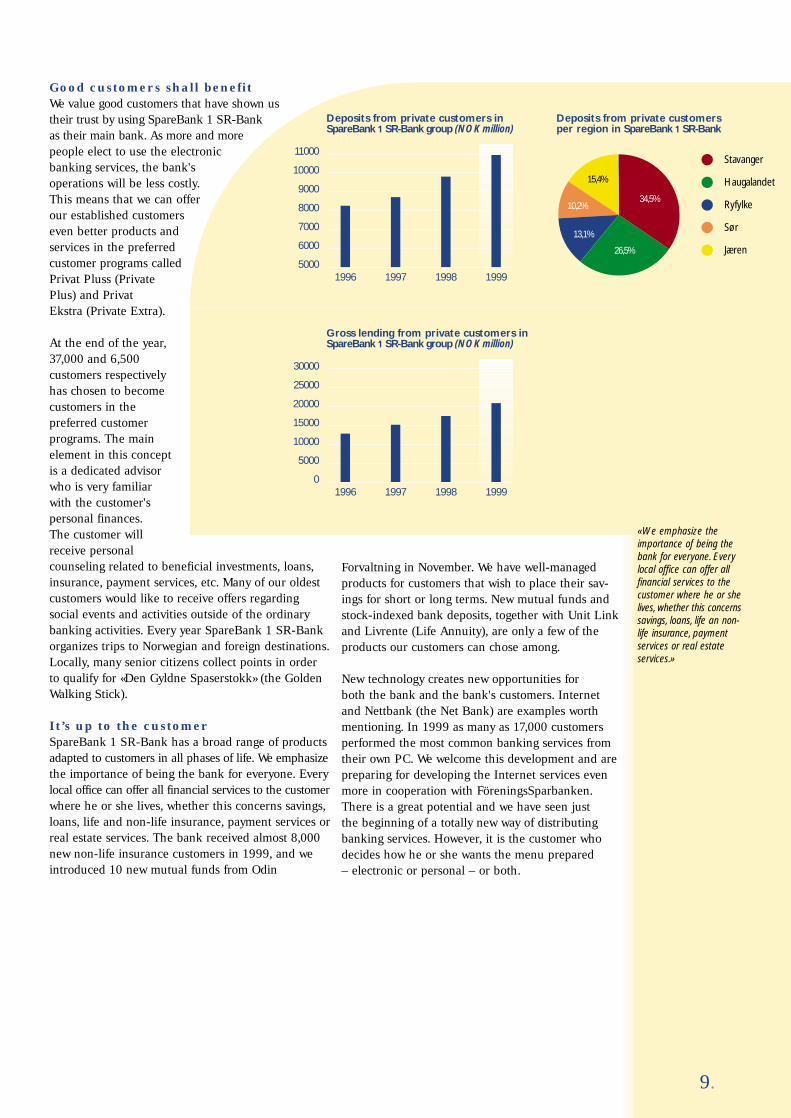
11000
10000
9000
8000
7000
6000
50001996 1998 1999
Deposits from private customers inSpareBank 1 SR-Bank group (NOK million)
1997
30000
25000
20000
15000
10000
5000
01997 1998 1999
Gross lending from private customers inSpareBank 1 SR-Bank group (NOK million)
1996
Deposits from private customers per region in SpareBank 1 SR-Bank
34,5%
26,5%
13,1%
10,2%
15,4%
Sør
Ryfylke
Haugalandet
Stavanger
Jæren
«We emphasize theimportance of being thebank for everyone. Everylocal office can offer allfinancial services to thecustomer where he or shelives, whether this concernssavings, loans, life an non-life insurance, paymentservices or real estateservices.»

When local industry and commerce do well,SpareBank 1 SR-Bank does well. That is the way it is when we do business in the same market and aremutually dependent on each other. We have a stronginvolvement in local industry and commerce and arevery interested in making a contribution to the futuredevelopment. As part of the local industry and com-merce, we have a close relationship with the busi-nesses. We know the companies and their line ofbusiness from the inside and are able to make quickdecisions when needed. Our corporate customershave taught us that accessibility is the most impor-tant product a bank can supply. This is something we intend to maintain and strengthen in the future.
In 1999 we performed a market position survey incooperation with Norsk Gallup in order to acquireknowledge about the bank's position in relation to itscompetitors with a focus on market share, preferenceshare and product potential in the corporate market.As many as 1200 interviews were conducted withrandomly selected companies within our market area. The following main conclusions emerged:
• Knowledge about SpareBank 1 SR-Bank as a corporate bank has increased significantly and the development has been especially positiveamong large businesses.
• The bank has strengthened its position in relationto its competitors. The profile is increasing and itshould be possible to convert it into an increasedmarket share.
• The bank's market share is 39% measured in relation to the number of businesses within themarket area.
Building networksOur position within local industry and commerce isthe basis for a unique network. As a large and localbusiness bank, we probably represent the largestbusiness network in the district. It gives us theopportunity to create a forum for companies that willbenefit from talking together. We regularly initiatecontact between customers and organize variousgatherings and professional seminars. Our hope is tocontribute to general competency training and toestablish relations that will hopefully create newbusiness opportunities.
In this connection, we would mention our breakfastmeetings which are held about 6-8 times a year.
Several well-known local and national speakershave participated at the meetings. Several
seminars have been held as part of the business sector alliance in
SpareBank 1.
In addition to building net-works among companies and increasing expertise,the events also profileSpareBank 1 SR-Bank as a business bank andstrengthen the relation-ship between the bankand its customers. In
our industry it does not take long before a successfulproduct has been copied by several competitors.Lasting success is dependent upon continuous development of people and human relationships.
Loans and financingWe have a wide range of products and services toensure correct financing for companies. Combinedwith our extensive expertise within various industries,this makes us a strong partner. By customizing ourproducts, we can solve the financing challenges facing industry and commerce, and we are happy to contribute input on how a company can reducecosts by efficient use of financing products.
Investment and asset managementThe interest in alternatives to the traditional place-ment of money in the bank has shown a strongincrease in recent years. The range of managementproducts has expanded significantly with many newsecurities products and capital instruments.
«In 1999 SpareBank 1SR-Bank group had agrowth in lending to business and industry of7.6%. Growth in depositsfor the same year was7.7%. Loans to businessand industry account forabout 36.3% of the bank’stotal loans.»
10.
A bank for business and industry.
15000
12500
10000
7500
5000
2500
01996 1998 1999
Gross lending corporate market inSpareBank 1 SR-Bank group (NOK million)
1997
10000
9000
8000
7000
6000
5000
40001997 1998 1999
Deposits corporate market inSpareBank 1 SR-Bank group (NOK million)
1996

Our coast still provides fertile conditionsfor rich and diverse business and industry.The entire value chain from raw materialto finished product is an interesting commitment area for the bank.
Head picture: Our foreign exchange de-partment is the only one in Rogaland thattrades directly in the international market.
Brødrene Risa A/S is one of the largestcontractors in Rogaland and acquiredAS Betong in 1999.The Brødrene Risagroup is involved in large and smalldevelopments, cultivation, road con-struction, concrete production, pilingand construction of buildings.Thegroup’s headquarters are in Nærbø.
The IT company Lan-x AS in Sandnesstarted operations in September 1998. Itsobjects are to conduct sales of goods andservices within information technology.Thecompany currently has 17 employees andsales of nearly NOK 43 million. Lan-x aimsat being the preferred professional bodywithin structured data processing. Its custo-mers consist of more than 200 companies.
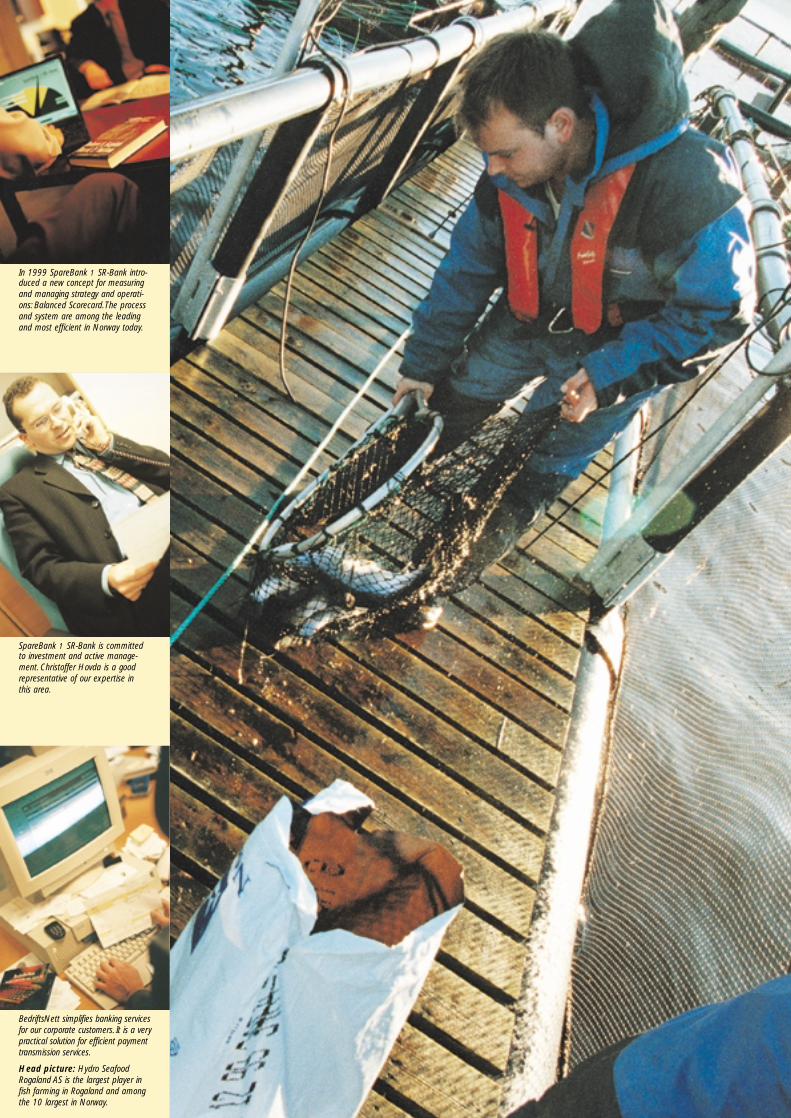
In 1999 SpareBank 1 SR-Bank intro-duced a new concept for measuringand managing strategy and operati-ons: Balanced Scorecard.The processand system are among the leadingand most efficient in Norway today.
SpareBank 1 SR-Bank is committedto investment and active manage-ment. Christoffer Hovda is a goodrepresentative of our expertise in this area.
BedriftsNett simplifies banking services for our corporate customers. It is a verypractical solution for efficient paymenttransmission services.
Head picture: Hydro Seafood Rogaland AS is the largest player in fish farming in Rogaland and among the 10 largest in Norway.
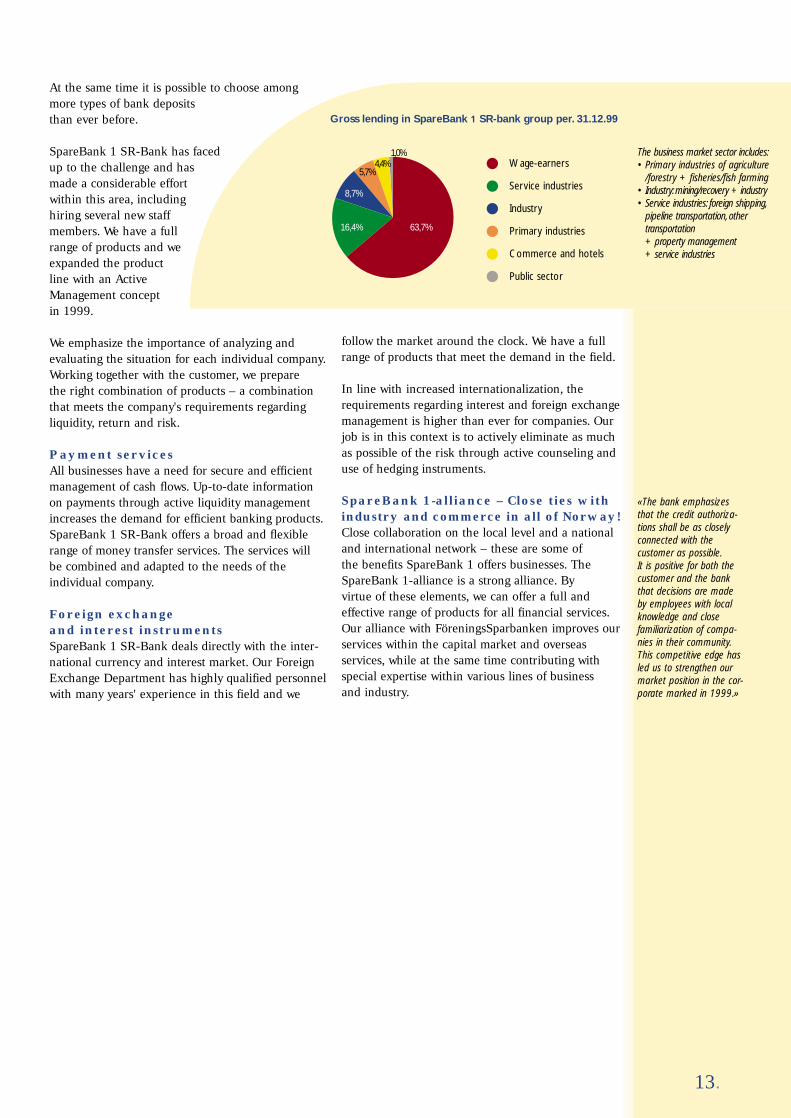
At the same time it is possible to choose amongmore types of bank deposits than ever before.
SpareBank 1 SR-Bank has facedup to the challenge and hasmade a considerable effortwithin this area, includinghiring several new staffmembers. We have a fullrange of products and weexpanded the productline with an ActiveManagement concept in 1999.
We emphasize the importance of analyzing and evaluating the situation for each individual company.Working together with the customer, we prepare the right combination of products – a combinationthat meets the company's requirements regarding liquidity, return and risk.
Payment servicesAll businesses have a need for secure and efficientmanagement of cash flows. Up-to-date informationon payments through active liquidity managementincreases the demand for efficient banking products. SpareBank 1 SR-Bank offers a broad and flexiblerange of money transfer services. The services will be combined and adapted to the needs of the individual company.
Foreign exchange and interest instrumentsSpareBank 1 SR-Bank deals directly with the inter-national currency and interest market. Our ForeignExchange Department has highly qualified personnelwith many years' experience in this field and we
follow the market around the clock. We have a full range of products that meet the demand in the field.
In line with increased internationalization, therequirements regarding interest and foreign exchangemanagement is higher than ever for companies. Ourjob is in this context is to actively eliminate as muchas possible of the risk through active counseling anduse of hedging instruments.
SpareBank 1-alliance – Close ties withindustry and commerce in all of Norway!Close collaboration on the local level and a nationaland international network – these are some of the benefits SpareBank 1 offers businesses. TheSpareBank 1-alliance is a strong alliance. By virtue of these elements, we can offer a full andeffective range of products for all financial services.Our alliance with FöreningsSparbanken improves ourservices within the capital market and overseas services, while at the same time contributing withspecial expertise within various lines of business and industry.
13.
Gross lending in SpareBank 1 SR-bank group per. 31.12.99
63,7%16,4%
8,7%
5,7%4,4%
1,0%
Primary industries
Industry
Service industries
Public sector
Wage-earners
Commerce and hotels
The business market sector includes:• Primary industries of agriculture
/forestry + fisheries/fish farming• Industry:mining/recovery + industry• Service industries: foreign shipping,
pipeline transportation, othertransportation+ property management+ service industries
«The bank emphasizesthat the credit authoriza-tions shall be as closelyconnected with the customer as possible.It is positive for both thecustomer and the bankthat decisions are madeby employees with localknowledge and closefamiliarization of compa-nies in their community.This competitive edge hasled us to strengthen ourmarket position in the cor-porate marked in 1999.»

Earnings and growth The SpareBank 1 SR-Bank group's profit before lossand write-downs was NOK 654 million, which is NOK205 million more than last year's profit of NOK 449million. Net losses of NOK 62 million and unspecifiedloss allocations in the amount of NOK 40 million,together with gains from capital assets worth NOK 46million, resulted in a group profit before tax of NOK598 million. Tax costs are estimated at NOK 147 million, which gives a profit for the year of NOK 451million. Total assets increased in 1999 by 17% to NOK
36.4 billion. At the end of the year, the group's equityand subordinated loan capital was NOK 3,037 millionand the capital adequacy ratio 12.12%.
1999 turned into a good year for SpareBank 1 SR-Bank. The profit from the ordinary banking operationindicates an efficient bank as regards sales and opera-tions. Combined with stock market gains and goodmanagement of the bank's securities, this produced anunprecedented profit for SpareBank 1 SR-Bank. Theresult also reflects an organization with products, servicesand customer relations adapted to the market for private
700
600
500
400
300
200
100
0
Operating profit before losses and write-downs
«1999 turned into a good year for SpareBank 1SR-Bank.The profit fromthe ordinary banking oper-ation indicates an efficientbank as regards sales andoperations. Combined withstock market gains andgood management of the bank's securities, thisproduced an unprecedentedprofit for SpareBank 1SR-Bank.»
Operating profit after losses and write-downs
1995 1996 1997 1998 1999
Operating profit in the SpareBank 1 SR-Bank group
Equity and subordinated loans in the SpareBank 1 SR-Bank group
800
750
700
650
600
550
500
450
SpareBank 1 SR-BankSubsidiaries
1995 1996 1997 1998 1999
Man-years in SpareBank 1 SR-Bank and subsidiaries for the last five years
3500
3000
2500
2000
1500
1000
500
0
EquitySubordinated Loan Capital
1995 1996 1997 1998 1999
14.
Directors Report for 1999.
Well run banking operation produce unprecedented earnings
• Operating profit of NOK 598 million before tax
• SpareBank 1 SR-Bank is the district's savings bank
• 12% and NOK 1,100 million in increased private deposits
• NOK 410 million in sales of securities products
• 15% increase in lending
• NOK 120 million in capital gains
• Cost percentage of 1.83
• 21.8% return on equity capital after tax
• NOK 40.40 in profit on primary capital certificates
• The Board proposes to pay NOK 19 in dividends
Strong alliance strengthens distribution and product development
• Acquisition of 51% of First Securities
• Acquisition of Vår Bank og Forsikring
• EiendomsMegler 1 becomes nationwide chain

and corporate customers. A 15% growth in lendingresulted in increased market shares in a region with acontinued high level of activity and the 10% growth indeposits and new growth in alternative forms of savingsindicate customers that have solid finances. Total operating income (excluding gains from securities) in-creased by 20% and cost-effectiveness was maintainedat the same level. Gross default remains stable. Dueto the improved balance, the group has increased theunspecified loss allocations by NOK 40 million. Marketsurveys confirm the bank's strong position as the leading bank in the region.
Norwegian economy and framework conditionsThe Norwegian economy experienced slower growthin 1999 as expected. The growth for the grossdomestic product was reduced to less than 1% in1999 as compared with the long-lasting averageannual growth for the Norwegian mainland of morethan 3%. However, the temperature in parts of theeconomy was still high and the likelihood of a signifi-cant downturn has been reduced. The growth in pub-lic and private consumption will ensure that labormarket demand in respect of the service industry andthe public sector will remain high. A turnaround inthe Norwegian economy will probably be limited toindustry due to lower profitability and weakenedcompetitiveness, but will also be due to permanentlyreduced investments in the petroleum sector. Thiswill entail a significant restructuring of the shipbuild-ing industry and parts of the engineering industry.The consequences for the affected companies willdepend on their ability to restructure their activities.
The development in Rogaland At the beginning of 1999, the businesses in Rogalandwere characterized by a high level of activity, but clearlyexpecting a change in climate. This was related to anexpected unfavorable development within the engineeringand agriculture industry and for production of ships and oilplatforms, all of which are very important for the county.Even though employment was satisfactory in 1999, theactivity level at the beginning of 2000 is significantly lower.
Few new orders are being placed, the oil companiesare adapting to new framework conditions
and industry is being restructured bymergers of national and inter-
national companies. The effectsare first seen as lower
employment levels and a reorganization of the
labor market. The oil industry hasannounced start-upof new developmentprojects, but theeffects of these willnot be noticeable
in the short term. The investment level will never-theless be considerable lower than the peak years in1998 and 1999.
With a leveling off of the petroleum investments in2001, positive effects on household consumption dueto lower interest rates, somewhat stronger export and acontinued moderate growth in public consumption andemployment, the growth in the Norwegian economycan again reach normal levels in 2001. Even thoughRogaland probably at first will not benefit as muchfrom the more positive outlook as the rest of the country, the fall in employment can be softened andthe increase in unemployment reduced.
Continuous positive development in the ninetieshas provided businesses and private households withsolid finances that can handle a short-term downturn.
Group developmentThe SpareBank 1 SR-Bank group's performance hasbeen characterized by a very high level of activity in1999. The group continued its emphasis on the need toadapt to the market's demand for products and servicesdelivered quickly and effectively in close cooperationwith the customers. Advantageous programs for full-service customers, new savings plans and, not least, thefocus on young people and customers starting out havebeen well received. Our home financing plans haveimproved and closeness through personal customer follow-up has been prioritized. The challenge in thecorporate market has been to strengthen the relation-ship with the traditional customer in the market forsmall and medium-sized businesses, while simultane-ously offering a wider range of counseling services and products to the larger businesses. Alliance withinthe Norwegian and Scandinavian alliance results inincreased power and expertise, which can be offered tocurrent and new groups of customers. This entails par-ticipation in projects requiring high levels of expertiseand substantial capital supply, as well as products in linewith the broad range of Norwegian industry and com-merce. Through the Norwegian and Scandinavianalliance, the SpareBank 1 group has the capacity toparticipate in the restructuring taking place in industriessuch as the power industry and the aquaculture industry.
In 1999 the group initiated an extensive projectwhich will reassess and adjust the most important busi-ness processes. This is done in order to increase the effi-ciency and strengthen the level of expertise and thus thegroup's competitiveness. This work is supported by newtechnology developed in cooperation with the alliance. Over the next two years, the alliance will focus on busi-ness processes that make use of common technology.
Market surveys in 1999 confirm that SpareBank 1 SR-Bank is on the right track and is increasing its marketshares. The same surveys also show that the group mustdevelop even further in order to satisfy increasinglyhigher expectations from the customers regarding activecooperation in order to support private households andthe region's industrial and commercial development.
«Alliance within the Nor-wegian and Scandinavianalliance results in increasedpower and expertise, whichcan be offered to currentand new groups of custo-mers.»
15.
«In 1999 the group initiated an extensive project which will reassessand adjust the most im-portant work procedures.This is done in order toincrease the efficiency andstrengthen the level ofexpertise and thus thegroup's competitiveness.»
SpareBank 1 Alliance The SpareBank 1-alliance is a Scandinavian bank and product alliance where the SpareBank 1 banks inNorway and FöreningsSparbanken AB in Sweden cooperatethrough the jointly owned holding company SpareBank 1Gruppen AS. The primary objective of the SpareBank 1-alliance is to ensure that the individual banks, by beinghighly competitive, profitable and solid, remain independentwith regional ties. At the same time, the SpareBank 1-alliance represents a competitive alternative on a nationaland Scandinavian level. The alliance is now a strong,Scandinavian alliance – with solid finances, a very broadcustomer base and a competitive range of products.
Building a Scandinavian alliance An agreement was signed between the NorwegianSpareBank 1 banks and the Swedish commercial bankFöreningsSparbanken AB in August of 1998. As of 24February 1999, FöreningsSparbanken AB became an ownerin SpareBank 1 Gruppen AS through a private placingof NOK 720 million where FöreningsSparbankenbought a 24% interest in SpareBank 1 Gruppen AS.This resulted in a reported gain for SpareBank 1 SR-Bank of NOK 52 million. The transaction does not trig-ger any tax-related costs. The other owners kept 15.2%each. The agreement with FöreningsSparbanken was aresult of the desire to strengthen the regional/localcompetitiveness within the banking industry for bothcountries. The alliance was initiated because of the fastpace of changes within the financial services industry.The alliance includes joint development of productsand expertise. Due to the establishment of a wholesalebank in Oslo, FöreningsSparbanken will provide additional strength for the SpareBank 1-banks withinthe money and capital markets as well as for overseasservices. Within the framework of the activities of thebranch, the alliance will establish a joint process forhandling major Norwegian businesses.
Acquisition and integration of VÅR Gruppen ASA At the end of November 1999, the boards of SpareBank 1Gruppen AS and VÅR Gruppen ASA approved an agree-
ment regarding cooperation and integration betweenthe two groups. On 22 December 1999, an agreementwas signed whereby SpareBank 1 Gruppen AS pur-chased the shares in VÅR Gruppen ASA for NOK 3.3billion. In connection with the purchase, a long-term,comprehensive strategic and business-related alliancewill be established between SpareBank 1 Gruppen ASand LO/NKL (Norwegian Federation of Trade Unions/Norwegian Co-Operative Union and Wholesale Society).If the authorities approve the acquisition on satisfactoryterms, SpareBank 1 Gruppen AS will be owned bySparebanken Nord-Norge, Sparebanken Midt-Norge,Sparebanken Vest, Sparebanken Rogaland andSamarbeidende Sparebanker AS with 13% each, whilethe Norwegian Federation of Trade Unions owns 10%and FöreningsSparbanken owns 25% (after exercisingthe option of increasing its interest by 1%).
Profit performanceThe SpareBank 1 SR-Bank group's profit performancewas very positive for all of 1999. The development withinboth the private and the corporate market was better thanexpected. This has to do with the fact that there wasconsiderably less of a decline in business activity thanfirst expected as well as better framework conditionsthrough lower interest rates. The positive developmentalso confirms that the group's strategy with a market-oriented organization with products and services adaptedto the customer is the right one. The group's profit of NOK654 million before losses and write-downs has been achievedas a result of good growth in interest income and otherincome, a high level of cost-effectiveness and few losses.Net interest income for the group rose by NOK 100million to NOK 895 million, an increase of 12%.Compared with the average total assets, net interestincome in 1999 constituted 2.63% as compared with2.73% in 1998. The fall in the interest margin reflectsmost of all the competition in the market. The interestmargin is also affected by the growth in credit to majorcustomer commitments.
The group's commission income increased in1999 to NOK 231 million. The underlying growthwithin payment services is in the order of 25%.
16.
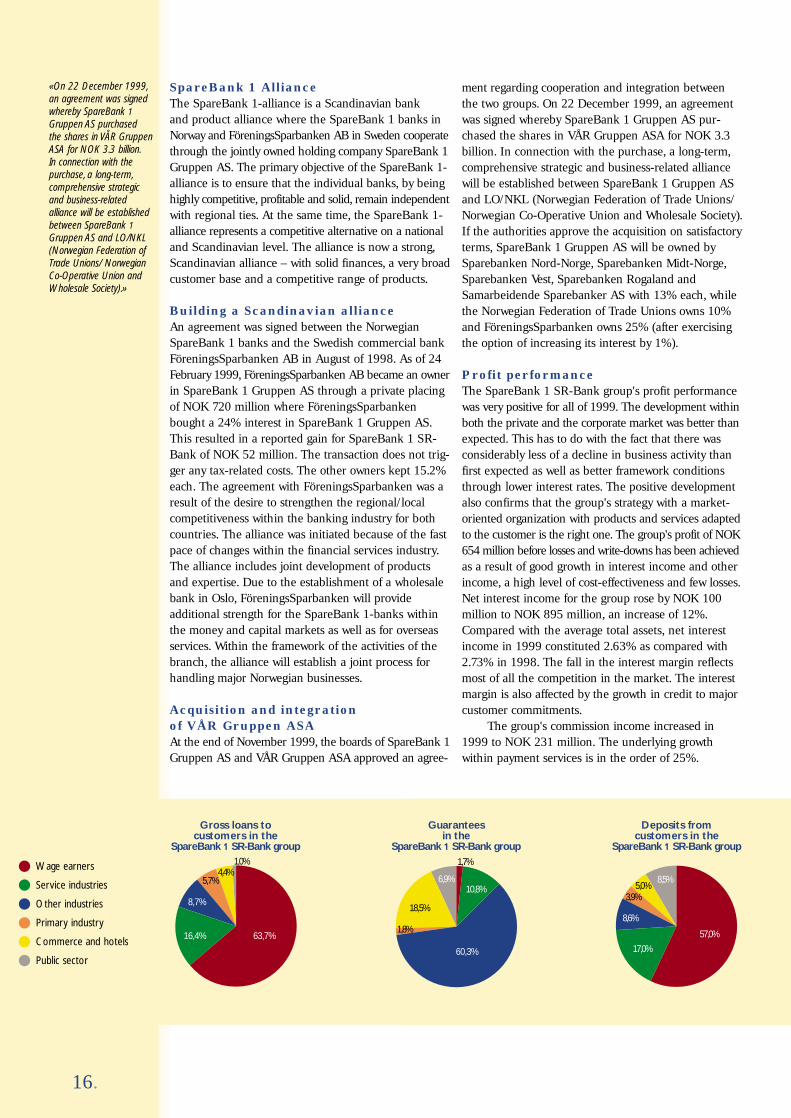
Primary industry
Other industries
Service industries
Public sector
Wage earners
Commerce and hotels
Gross loans to customers in the
SpareBank 1 SR-Bank group
63,7%16,4%
8,7%
5,7%4,4%
1,0% 1,7%
10,8%
60,3%
1,8%
18,5%
6,9%
Guarantees in the
SpareBank 1 SR-Bank group
57,0%
17,0%
8,6%
3,9%5,0%
8,5%
Deposits from customers in the
SpareBank 1 SR-Bank group
«On 22 December 1999,an agreement was signedwhereby SpareBank 1Gruppen AS purchased the shares in VÅR GruppenASA for NOK 3.3 billion.In connection with the purchase, a long-term,comprehensive strategicand business-relatedalliance will be establishedbetween SpareBank 1Gruppen AS and LO/NKL(Norwegian Federation ofTrade Unions/ NorwegianCo-Operative Union andWholesale Society).»

However, price reductions through the programs forpreferred customers, which includes giving full-servicecustomers free use of electronic payment services withincertain limits, reduced the growth for commission incometo 14%. The good economy and the development onthe stock exchange increased savings in securities andinsurance over the last half year. The group's total salesof alternative savings products were NOK 800 million.Sales of non-life insurance increased and providedcommission income in the amount of NOK 10 millionlast year.
At the end of the year the bank's holding of shares,primary capital certificates and securities were posted atNOK 269 million. The return of 50.8% including primarycapital certificates is 5.3 percent better than the total gainon the Oslo Stock Exchange and resulted in NOK 96 mil-lion in capital gains last year. The holding of certificatesand bonds valued at NOK 1,902 million, which coversthe liquidity requirement, provided capital gains in theamount of NOK 1.4 million. Currency trading, for cus-tomers and the bank, gave a gain of NOK 25 million in1999. Total other income accounted for 30% of the group'sincome compared with 18% in 1998.
Operating costs for the group in 1999 amountedto NOK 622 million, an increase of NOK 95 millioncompared with 1998. Measured in relation to thebank's total assets, this constituted 1.83%, the sameratio as for last year. Measured in relation to totaloperating income, the costs amounted to 49%. Thenominal increase in costs is mainly a result of wagesettlements and expertise, technology and processcosts. Costs associated with profit-oriented bonuses,including social security costs, have increased by NOK
18 million to NOK 34 million for the group. IT costshave increased by NOK 14 million due to in-
creased transaction volumes. Costs asso-ciated with business process engine-
ering is estimated to be NOK 10million. Investments in new
processes and technologyare necessary in order to
maintain the quality ofthe group's servicesand will provide ad-ditional capacity.The current level ofcost-effectivenesswill be maintained.
Default trends are still satisfactory. Net losses of NOK102 million include an increase in unspecified loss allo-cations of NOK 40 million. During the year, default over90 days increased by NOK 45 million to NOK 284 million.
Balance sheetThe group's total assets increased by 16.5% to NOK36.4 billion in 1999, while the increase for the bankwas 18.9% to NOK 34.8 billion. Over the course of theyear, lending to the private market increased by NOK3,412 million (19.5%) and to corporate and the publicsector by NOK 844 million (7.6%). This means an annualgrowth of 14.9% in the group's lending. Deposits fromcustomers in 1999 have increased by NOK 1,730 milliondivided between NOK 1,136 million for private customers(11.6%) and NOK 594 million for businesses (7.7%).This is equal to an overall annual growth of 10%.
Risk ManagementCredit risk is managed through the Board's guidelines forcredit policy, risk profile and authorizations. The guide-lines are managed through established procedures for creditratings, credit committees and reporting of risk classes.
The group's foreign exchange activities are con-ducted according to a policy with limited positions onits own books. The holding of bonds is adjusted to theauthorities' requirements regarding liquid reserves. The interest risk for the bank's bond portfolio is reported to the Board on a monthly basis. This risk hasbeen moderate throughout the past year. Investmentsin equity capital securities are at a moderate level inrelation to the bank's balance sheet figures.
SubsidiariesThe real estate agents in the SpareBank 1-alliance haveestablished a nationwide chain from 1999 under thename EiendomsMegler 1. SR-Eiendom A/S haschanged its name to EiendomsMegler 1 Rogaland A/Sin order to strengthen development of the brand name.EiendomsMegler 1 Rogaland A/S is Rogaland's largestreal estate agency in both the residential and corporatemarket and had a good year with more than 2000transactions at a total value of more than NOK 2 billion.Operating income increased to NOK 54 million, result-ing in a profit before tax of NOK 9.8 million.
Westbroker Finans AS is the leading finance com-pany in Rogaland and had total assets of NOK 2,450million at the end of the year. The company increased
17.
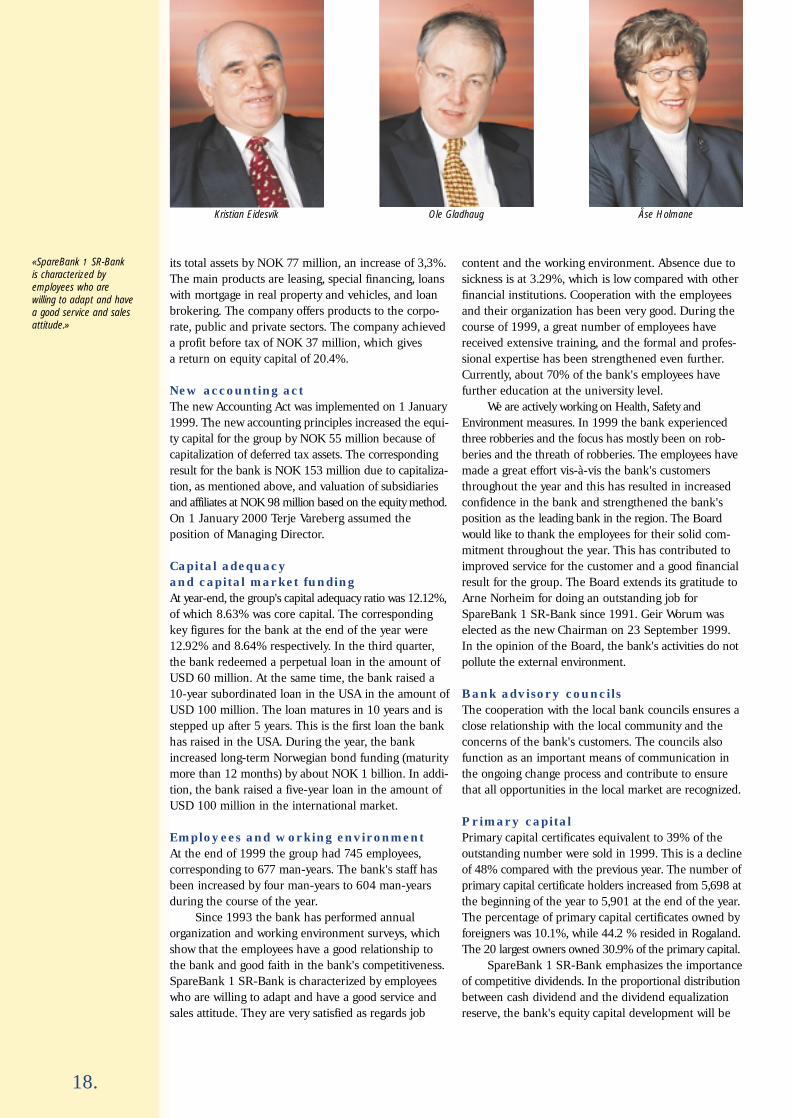
Geir WorumCHAIRMAN
Tor HaverVICE-CHAIRMAN
Dominikus N. Bjordal
«At the end of the yearthe bank's holding ofshares, primary capitalcertificates and securitieswere posted at NOK269 million.»
«The real estate agents inthe SpareBank 1-alliancehave established a nation-wide chain from 1999under the nameEiendomsMegler 1.»
18.
its total assets by NOK 77 million, an increase of 3,3%.The main products are leasing, special financing, loanswith mortgage in real property and vehicles, and loanbrokering. The company offers products to the corpo-rate, public and private sectors. The company achieveda profit before tax of NOK 37 million, which gives a return on equity capital of 20.4%.
New accounting actThe new Accounting Act was implemented on 1 January1999. The new accounting principles increased the equi-ty capital for the group by NOK 55 million because ofcapitalization of deferred tax assets. The correspondingresult for the bank is NOK 153 million due to capitaliza-tion, as mentioned above, and valuation of subsidiariesand affiliates at NOK 98 million based on the equity method. On 1 January 2000 Terje Vareberg assumed the position of Managing Director.
Capital adequacy and capital market fundingAt year-end, the group's capital adequacy ratio was 12.12%,of which 8.63% was core capital. The correspondingkey figures for the bank at the end of the year were12.92% and 8.64% respectively. In the third quarter,the bank redeemed a perpetual loan in the amount ofUSD 60 million. At the same time, the bank raised a10-year subordinated loan in the USA in the amount ofUSD 100 million. The loan matures in 10 years and isstepped up after 5 years. This is the first loan the bankhas raised in the USA. During the year, the bankincreased long-term Norwegian bond funding (maturitymore than 12 months) by about NOK 1 billion. In addi-tion, the bank raised a five-year loan in the amount ofUSD 100 million in the international market.
Employees and working environmentAt the end of 1999 the group had 745 employees, corresponding to 677 man-years. The bank's staff hasbeen increased by four man-years to 604 man-yearsduring the course of the year.
Since 1993 the bank has performed annualorganization and working environment surveys, whichshow that the employees have a good relationship tothe bank and good faith in the bank's competitiveness.SpareBank 1 SR-Bank is characterized by employeeswho are willing to adapt and have a good service andsales attitude. They are very satisfied as regards job
content and the working environment. Absence due tosickness is at 3.29%, which is low compared with otherfinancial institutions. Cooperation with the employeesand their organization has been very good. During thecourse of 1999, a great number of employees havereceived extensive training, and the formal and profes-sional expertise has been strengthened even further.Currently, about 70% of the bank's employees have further education at the university level.
We are actively working on Health, Safety andEnvironment measures. In 1999 the bank experiencedthree robberies and the focus has mostly been on rob-beries and the threath of robberies. The employees havemade a great effort vis-à-vis the bank's customersthroughout the year and this has resulted in increasedconfidence in the bank and strengthened the bank'sposition as the leading bank in the region. The Boardwould like to thank the employees for their solid com-mitment throughout the year. This has contributed toimproved service for the customer and a good financialresult for the group. The Board extends its gratitude toArne Norheim for doing an outstanding job forSpareBank 1 SR-Bank since 1991. Geir Worum waselected as the new Chairman on 23 September 1999.In the opinion of the Board, the bank's activities do notpollute the external environment.
Bank advisory councilsThe cooperation with the local bank councils ensures aclose relationship with the local community and theconcerns of the bank's customers. The councils alsofunction as an important means of communication inthe ongoing change process and contribute to ensurethat all opportunities in the local market are recognized.
Primary capitalPrimary capital certificates equivalent to 39% of theoutstanding number were sold in 1999. This is a declineof 48% compared with the previous year. The number ofprimary capital certificate holders increased from 5,698 atthe beginning of the year to 5,901 at the end of the year.The percentage of primary capital certificates owned byforeigners was 10.1%, while 44.2 % resided in Rogaland.The 20 largest owners owned 30.9% of the primary capital.
SpareBank 1 SR-Bank emphasizes the importanceof competitive dividends. In the proportional distributionbetween cash dividend and the dividend equalizationreserve, the bank's equity capital development will be
«SpareBank 1 SR-Bank is characterized byemployees who are willing to adapt and havea good service and salesattitude.»
Kristian Eidesvik Ole Gladhaug Åse Holmane

19.
given priority. In keeping with the bank's dividend policy,the results of the year and the core capital, the Boardproposes to pay NOK 19 in dividends, as well as to allocateNOK 21.40 to the equalization reserve per primary capitalcertificate for the 1999 accounting year. After thisappropriation, the equalization reserve will amount to NOK83.33 per certificate. The RISK amount as of 1 January1999 was stipulated at NOK 27.74 per primary capital certificate. The corresponding RISK amount as of 1January 2000 is provisionally estimated to be NOK 28.
Application of profit/dividendsThe Board proposes the following application ofSparebanken Rogaland's profit for the year of NOK 451 mill.:NOK millionProfit for the year 451Dividend, NOK 19 per certificate 141Equalization reserve 159Endowment fund 10The Savings Bank's reserve 137Dividend equalization reserve 4Total 451
Continued operationsThe annual report and accounts have been issuedbased on the assumption of continued operations.This assumption is based on profit projections for2000 and the group's long-term strategic projectionsfor the years ahead. The group has good solidity andcore capital and the capital adequacy ratio is goodseen in relation to the authorities' requirements.
Outlook for the futureThe Board expects a somewhat weaker economicdevelopment in the region in 2000. However, theactivity level at the beginning of the year provides a good foundation for good operations. In spite ofpossibly reduced employment as well as a reducedlevel of activity for the petroleum sector, the Board is of the opinion that the financial basis for the customers is satisfactory. The foundation for goodoperations in 2000 is good. The Board expects a satisfactory result for the SpareBank 1 SR-Bankgroup in 2000.
Magne Vathne Karl A. Naley Terje VarebergADM. DIREKTØR
Geir WorumChairman
Kristian Eidesvik
Magne Vathne
Tor HaverVice-chairman
Ole Gladhaug
Karl A. Naley
Dominikus N. Bjordal
Åse Holmane
Terje VarebergManaging director
«In keeping with the bank's dividend policy, theresults of the year and thecore capital, the Boardproposes to pay NOK 19in dividends, as well as toallocate NOK 21.40 tothe equalization reserveper primary capital certi-ficate for the 1999accounting year.»
Stavanger, 24 February 2000
The Board of Directors Sparebanken Rogaland
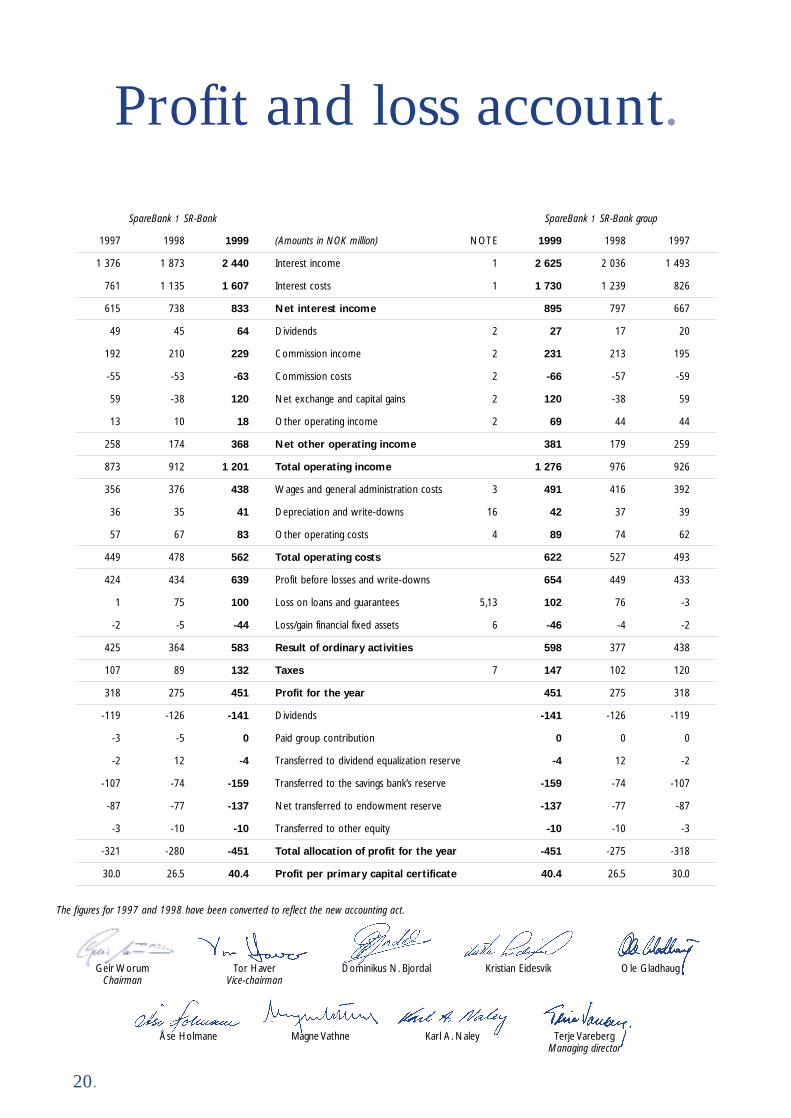
Profit and loss account.
1997 1998 1999 (Amounts in NOK million) NOTE 1999 1998 1997
1 376 1 873 2 440 Interest income 1 2 625 2 036 1 493
761 1 135 1 607 Interest costs 1 1 730 1 239 826
615 738 833 Net interest income 895 797 667
49 45 64 Dividends 2 27 17 20
192 210 229 Commission income 2 231 213 195
-55 -53 -63 Commission costs 2 -66 -57 -59
59 -38 120 Net exchange and capital gains 2 120 -38 59
13 10 18 Other operating income 2 69 44 44
258 174 368 Net other operating income 381 179 259
873 912 1 201 Total operating income 1 276 976 926
356 376 438 Wages and general administration costs 3 491 416 392
36 35 41 Depreciation and write-downs 16 42 37 39
57 67 83 Other operating costs 4 89 74 62
449 478 562 Total operating costs 622 527 493
424 434 639 Profit before losses and write-downs 654 449 433
1 75 100 Loss on loans and guarantees 5,13 102 76 -3
-2 -5 -44 Loss/gain financial fixed assets 6 -46 -4 -2
425 364 583 Result of ordinary activities 598 377 438
107 89 132 Taxes 7 147 102 120
318 275 451 Profit for the year 451 275 318
-119 -126 -141 Dividends -141 -126 -119
-3 -5 0 Paid group contribution 0 0 0
-2 12 -4 Transferred to dividend equalization reserve -4 12 -2
-107 -74 -159 Transferred to the savings bank’s reserve -159 -74 -107
-87 -77 -137 Net transferred to endowment reserve -137 -77 -87
-3 -10 -10 Transferred to other equity -10 -10 -3
-321 -280 -451 Total allocation of profit for the year -451 -275 -318
30.0 26.5 40.4 Profit per primary capital certificate 40.4 26.5 30.0
The figures for 1997 and 1998 have been converted to reflect the new accounting act.
SpareBank 1 SR-Bank SpareBank 1 SR-Bank group
20.
Geir WorumChairman
Tor HaverVice-chairman
Dominikus N. Bjordal Kristian Eidesvik Ole Gladhaug
Åse Holmane Magne Vathne Karl A. Naley Terje VarebergManaging director
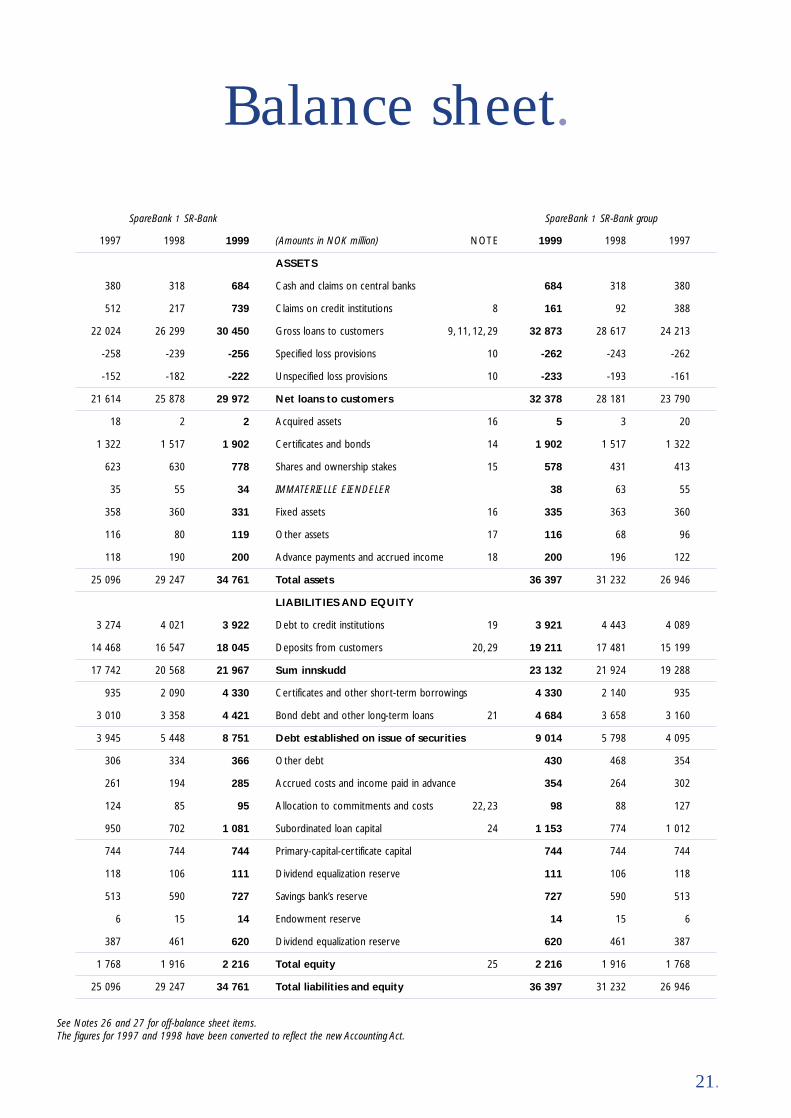
Balance sheet.
1997 1998 1999 (Amounts in NOK million) NOTE 1999 1998 1997
ASSETS
380 318 684 Cash and claims on central banks 684 318 380
512 217 739 Claims on credit institutions 8 161 92 388
22 024 26 299 30 450 Gross loans to customers 9, 11, 12, 29 32 873 28 617 24 213
-258 -239 -256 Specified loss provisions 10 -262 -243 -262
-152 -182 -222 Unspecified loss provisions 10 -233 -193 -161
21 614 25 878 29 972 Net loans to customers 32 378 28 181 23 790
18 2 2 Acquired assets 16 5 3 20
1 322 1 517 1 902 Certificates and bonds 14 1 902 1 517 1 322
623 630 778 Shares and ownership stakes 15 578 431 413
35 55 34 IMMATERIELLE EIENDELER 38 63 55
358 360 331 Fixed assets 16 335 363 360
116 80 119 Other assets 17 116 68 96
118 190 200 Advance payments and accrued income 18 200 196 122
25 096 29 247 34 761 Total assets 36 397 31 232 26 946
LIABILITIES AND EQUITY
3 274 4 021 3 922 Debt to credit institutions 19 3 921 4 443 4 089
14 468 16 547 18 045 Deposits from customers 20, 29 19 211 17 481 15 199
17 742 20 568 21 967 Sum innskudd 23 132 21 924 19 288
935 2 090 4 330 Certificates and other short-term borrowings 4 330 2 140 935
3 010 3 358 4 421 Bond debt and other long-term loans 21 4 684 3 658 3 160
3 945 5 448 8 751 Debt established on issue of securities 9 014 5 798 4 095
306 334 366 Other debt 430 468 354
261 194 285 Accrued costs and income paid in advance 354 264 302
124 85 95 Allocation to commitments and costs 22, 23 98 88 127
950 702 1 081 Subordinated loan capital 24 1 153 774 1 012
744 744 744 Primary-capital-certificate capital 744 744 744
118 106 111 Dividend equalization reserve 111 106 118
513 590 727 Savings bank’s reserve 727 590 513
6 15 14 Endowment reserve 14 15 6
387 461 620 Dividend equalization reserve 620 461 387
1 768 1 916 2 216 Total equity 25 2 216 1 916 1 768
25 096 29 247 34 761 Total liabilities and equity 36 397 31 232 26 946
See Notes 26 and 27 for off-balance sheet items.The figures for 1997 and 1998 have been converted to reflect the new Accounting Act.
SpareBank 1 SR-Bank groupSpareBank 1 SR-Bank
21.

22.
Accounting Principles.
GeneralThe annual accounts for 1999 have been prepared inaccordance with Accounting Act, regulations andgenerally accepted accounting principles. All figuresare stated in NOK million unless otherwise indicated.
The same accounting principles are applied to theparent bank's and the group's accounts.
The annual accounts for 1999 comply with the newAccounting Act, which entered into force on 1 January1999. The two preceding annual accounts have beenrevised correspondingly for comparison purposes.
ConsolidationSubsidiariesThe group accounts include SpareBank 1 SR-Bank andcompanies in which SpareBank 1 SR-Bank directlyand indirectly owns more than 50% of the shares orhas controlling influence on the company's operations.The investments in subsidiaries have been consolidatedaccording to the acquisition method in the group accountsand the equity method in the company's accounts.
Affiliated CompaniesAffiliated companies are defined as companies inwhich the bank has a long-term investment with anownership interest of 20 to 50 percent and in whichthe bank has significant influence. Such investmentsare appraised according to the equity method both inthe company's accounts and the group accounts.
Jointly Controlled OperationsJointly controlled operations are financial operationsgoverned by an agreement between the bank and oneor more participants, so that the bank and the partic-ipants have joint control of the operations. No partic-ipants have controlling influence alone.
The bank has established SpareBank 1 Gruppen ASin collaboration with SpareBank 1 Nord Norge,SpareBank 1 Midt Norge, SpareBank 1 Vest andSamarbeidende Sparebanker AS.
In 1999 FöreningsSparbanken purchased 24% ofSpareBank 1 Gruppen, leaving the other banks withan ownership interest of 15.2% each. The manage-ment structure of Sparebank 1 Gruppen is governedby a framework agreement between the owner banks.The ownership interest is regarded as jointly controlled operations.
In the accounts for SpareBank 1 SR-Bank the sharesin SpareBank 1 Gruppen have been appraisedaccording to the equity method, both in the company'saccounts and the group accounts, as the operations ofSpareBank 1 Gruppen are considerably different thanthe bank's other operations where the use of thegross method of depreciation would provide accounting information that is not easily accessible.
Entering Income and CostsInterest and fees are entered in the profit and lossaccount as they are earned as income or accrue ascosts. Fees that are a direct payment for services rendered are taken to income when they are paid.Arrangement fees are taken to income in accordancewith the costs that accrue for arranging loans.
The accruals principle is applied to prepaid incomeand accrued non-paid costs at the end of the year,which are entered as debt in the balance sheet.Accrued income is taken to income and entered asreceivables in the balance sheet.
Dividends are taken to income in the year they arereceived. Dividends and group contributions fromsubsidiaries, affiliated companies and jointly con-trolled businesses are entered directly against bookownership interest in the associated business.
Securities and SharesShares, primary capital certificates and shares in unittrusts that are traded on the stock exchange or in aregulated market and have good ownership diversifi-cation and liquidity, are included in the portfolio andare appraised at market value on the balance sheet date.Securities that are not listed on the stock exchange areappraised at the lower of original cost or market value.
Long-term shareholdings are appraised at original cost.If the real value is considerably lower the originalcost, and the decline in value is not deemed to be ofa temporary nature, the share is written down to thereal value. The write-down is reversed when there nolonger is a basis for the write-down.
Certificates and BondsCertificates and bonds classified as current assets areappraised at market value on the balance sheet date.Long-dated bonds that have been purchased to beheld until maturity have been entered at cost adjustedfor amortised premiums or discounts. Premiums
23.
and/or discounts are accrued linearly over theremaining life of the bond as a correction to thenominal interest rate.
Foreign CurrencyThe bank's assets and liabilities in foreign currencyare converted to middle rates as of 31 December.Income and costs in foreign currency are convertedto NOK at the rates at the time of the transaction.
The currency items are mainly hedged against corre-sponding items on the opposite side of the balancesheet or by off-balance sheet hedging transactions.
Financial InstrumentsFinancial instruments include negotiable financialasset and liability items plus financial derivatives.Financial instruments in the balance sheet includeshares, primary capital certificates, bonds and certifi-cates. Financial derivatives are agreements that areentered into with financial institutions or customersto set financial values in the form of interest terms,foreign exchange rates and the value of equity instru-ments for definite periods of time. These agreementsinclude forward exchange contracts, interest rate swaps(currency swaps), currency and interest rate options,and agreements to set future interest terms (FRAs).
A distinction is made between agreements that are astage in own-account transactions in order to achieveearnings through price differences and price changes(the trading portfolio) and agreements that are enteredinto in the ordinary business. Interest rate and mone-tary agreements are classified at the time they areentered into as part of the trading portfolio or bankingbusiness depending on the individual agreement. Thetrading portfolio consists of certificates and bonds,shares and primary capital certificates in the bank'sbalance sheet, plus currency, interest and equityinstruments not included in the balance sheet.
The off-balance sheet portfolios of transactions areappraised according to the market value method, andchanges in market values are entered in the profitand loss account under the item of net profit and losson exchange. Agreements that are entered into toreduce the bank's exposure to fluctuations in interestand/or exchange rates for items in the balance sheet,are defined as hedging transactions.
In order for monetary or interest rate agreements tode defined as hedging transactions, the expectedtrend in the value of the hedging transactions mustbe closely associated with the balance sheet item thatis hedged. Income and expenses related to the hedg-ing agreements and their respective balance sheetitems are entered in the accounts as accruals andclassified in the same way.
Losses on LoansLoans are appraised at nominal value with the exceptionof problem, non-performing and renegotiated loans.
Non-performing/Problem LoansA customer's aggregate loans are regarded as non-performing and included in the bank's overviews ofnon-performing loans when the installment or interestdue has not been paid within 90 days after the duedate or when the line of credit has been overdrawnfor 90 or more days.Loans and other commitments that are not non-per-forming, but where the customer's financial situationmakes it likely that the bank will incur a loss, areclassified as problem loans.
Specified loss provisionsWhen loans have been have been non-performing formore than 60 days or are classified as problem loans,credited interest is reversed and further crediting ishalted unless the loan is covered by underlying collateral. The difference between the loan's nominalvalue and the value of the securities plus the customer's assumed earning capacity is charged as an expense under losses on loans and guarantees.
There is generally a great deal of uncertainty associatedwith the appraisal of loans that are presumed to be problem loans, the value of securities and the customer's financial earning capacity.
Unspecified loss provisionsUnspecified loss provisions are to cover losses that,on the basis of conditions that prevail on the balancesheet date, are expected to come in addition to lossesthat have been identified and estimated for individualcustomers. Such provisions are estimated on the basisof appraisals of portfolios, experience and generaldevelopment trends. Changes in the size of the lending portfolio are taken into consideration.
Actual loan lossesWhen it is highly likely that the losses are final, thelosses are classified as actual loan losses. Actual loanlosses that are covered by specified loan provisionsthat have previously been made are charged againstthese provisions. Actual loan losses without coverageby loan loss provisions are charged to the results.
Acquired assetsAs part of the handling of non-performing loans andguarantees, the bank in some cases acquires assetsthat have been furnished as security for these com-mitments. At the time of acquisition, the assets areappraised at the assumed realisation value. Acquiredassets that are to be realised are classified as currentassets. Any losses and/or gains at the time of disposalor reappraisal of the value of these assets are enteredas a loss or reduction in the loss on the loan.

24.
LeasingThe leasing portfolio is classified for accounting purposes as leasing agreements under the main category of loans to and claims on customers. Leasingincome is entered as leasing income under interestincome and the expenditures as interest costs.
Tangible fixed assetsTangible fixed assets are entered in the accounts atcost with the addition of previous revaluation, andthe deduction of write-downs and ordinary accumu-lated depreciation. Ordinary depreciation is based on the cost price and the depreciation is distributedlinearly over the useful life of the assets.
If the actual value of a tangible fixed asset is considerablyless than the book value, and the decrease in valuecannot be expected to be temporary, the asset is writtendown to the actual value. The write-down is reversedwhen there no longer is a basis for the write-down.
Issued Bonds and Other LoansIssued bonds are entered in the balance sheet atnominal value with premiums added and discountsdeducted. Premiums are taken to income and discountsare charged against income according to a scheduleas an adjustment of the current interest costs untilthe bond matures or until the first time the interestrate is adjusted. Direct costs related to issuance ofbonds and other loans are charged against incomeaccording to a schedule as an adjustment to the current interest cost until the bond or loan matures.
Pension LiabilitiesIn the balance sheet net pension funds in the collec-tive plan are treated as fixed assets, whereas netunfunded pension liabilities are classified as long-term debt. The employer's National Insurance contri-butions that will accrue at the current rates are alsoincluded in the amount for unfunded pension liabili-ties. Net pension costs are classified under wage costsin the profit and loss account, and include the earnedpension for the period and interest costs on the liabilities minus the estimated return on the pensionfunds. The economic effects of changes in pensionplans are amortised over the average remaining earning time. Other changes and differences are evaluated in total against the highest value of thetotal pension liabilities and total pension funds. Iftotal changes and estimated differences representmore than 10 percent of this basis at the end of thefiscal year, the remaining amount will be amortisedover the remaining earning time.
TaxesThe annual tax expenditures in the profit and lossaccount consist of taxes payable on the income forthe year adjusted for surplus or deficit allocated fromprevious years plus changes in deferred taxes.
Deferred taxes are calculated on the basis of tempo-rary differences between accounting and tax values atthe close of the accounting year. The nominal taxrate is employed in the calculation. Positive and neg-ative differences are appraised against each other andare shown as net in the balance sheet. Deferred taxbenefits arise if there are temporary differences thatgive rise to tax deductions in the future.
LiabilitiesLiabilities are entered at original cost. Interest is con-tinuously carried to expense in the profit and loss account.
Business AreasSparebank 1 SR-Bank appraises business in the bankas an aggregate business area.
Individual TransactionsSpareBank 1 SR-Bank has reduced its shareholdingin Sparebank 1 Gruppen from 20% to 15% in thecourse of the year. This reduction resulted in anaccounting gain of NOK 52.6 million.
Changes in Accounting PrinciplesAs a result of the new Accounting Act, the bank madesome changes in the accounting principles with effectfrom 1 January 1999. The following changes have been made:Listed shares and bonds that are part of the tradingportfolio shall be appraised at their real value.Investments in subsidiaries, affiliated companies andjointly controlled businesses shall be appraisedaccording to the equity method in the parent bank.The difference between the investment's valueentered in the balance sheet according to the equitymethod and the original cost is transferred toreserves for appraisal differences.
Deferred tax benefits shall be appraised according tothe general appraisal rules. This means that deferredtax entered in the balance sheet is no longer anupper limit for balance sheet entry.
The comparison figures in the profit and loss account have been revised in accordance with thenew principles for the years 1998 and 1997.
The effect of the new principles on profit and equityin NOK million amounted to:
SpareBank 1 SpareBank 1
SR-Bank SR-Bank group
1997 1998 1997 1998
Profit for the year 305 314 312 309
Securities at actual value 19 -43 19 -43
Dividend - 1 -17 0 0
Tax -5 21 -13 9
Revised profit for the year 318 275 318 275
Equity – ref. Note 25
25.
Notes.
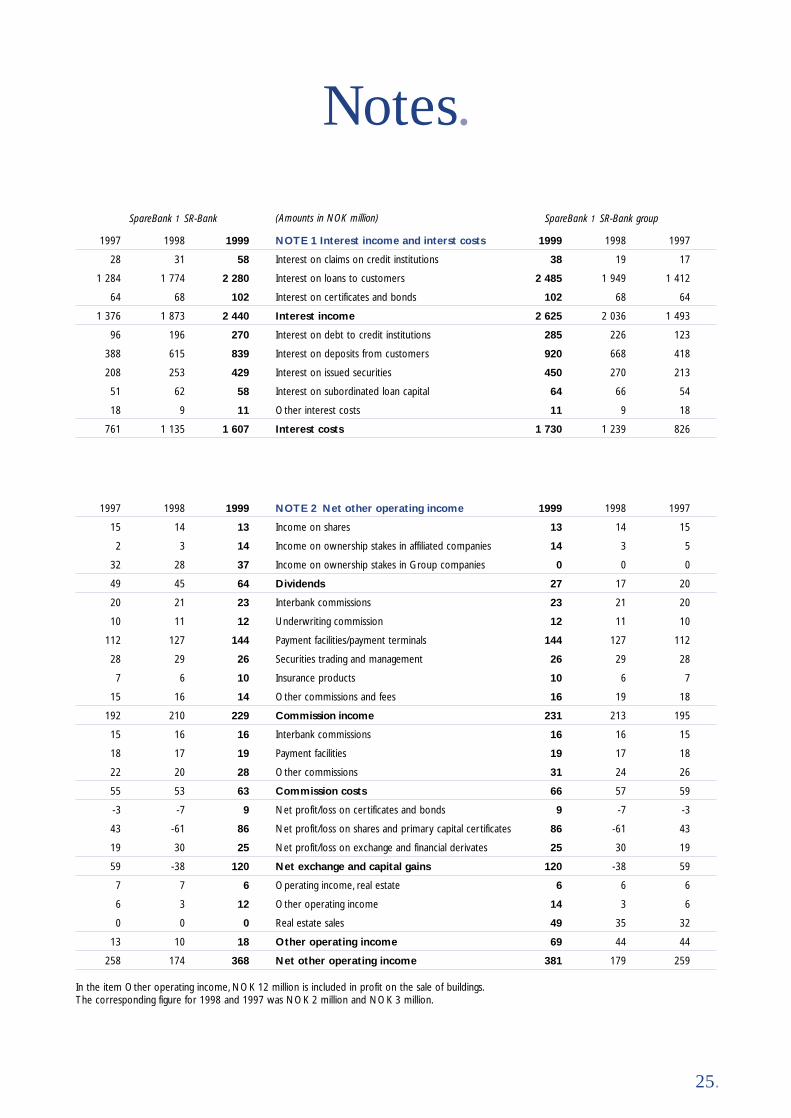
1997 1998 1999 NOTE 1 Interest income and interst costs 1999 1998 1997
28 31 58 Interest on claims on credit institutions 38 19 17
1 284 1 774 2 280 Interest on loans to customers 2 485 1 949 1 412
64 68 102 Interest on certificates and bonds 102 68 64
1 376 1 873 2 440 Interest income 2 625 2 036 1 493
96 196 270 Interest on debt to credit institutions 285 226 123
388 615 839 Interest on deposits from customers 920 668 418
208 253 429 Interest on issued securities 450 270 213
51 62 58 Interest on subordinated loan capital 64 66 54
18 9 11 Other interest costs 11 9 18
761 1 135 1 607 Interest costs 1 730 1 239 826
1997 1998 1999 NOTE 2 Net other operating income 1999 1998 1997
15 14 13 Income on shares 13 14 15
2 3 14 Income on ownership stakes in affiliated companies 14 3 5
32 28 37 Income on ownership stakes in Group companies 0 0 0
49 45 64 Dividends 27 17 20
20 21 23 Interbank commissions 23 21 20
10 11 12 Underwriting commission 12 11 10
112 127 144 Payment facilities/payment terminals 144 127 112
28 29 26 Securities trading and management 26 29 28
7 6 10 Insurance products 10 6 7
15 16 14 Other commissions and fees 16 19 18
192 210 229 Commission income 231 213 195
15 16 16 Interbank commissions 16 16 15
18 17 19 Payment facilities 19 17 18
22 20 28 Other commissions 31 24 26
55 53 63 Commission costs 66 57 59
-3 -7 9 Net profit/loss on certificates and bonds 9 -7 -3
43 -61 86 Net profit/loss on shares and primary capital certificates 86 -61 43
19 30 25 Net profit/loss on exchange and financial derivates 25 30 19
59 -38 120 Net exchange and capital gains 120 -38 59
7 7 6 Operating income, real estate 6 6 6
6 3 12 Other operating income 14 3 6
0 0 0 Real estate sales 49 35 32
13 10 18 Other operating income 69 44 44
258 174 368 Net other operating income 381 179 259
SpareBank 1 SR-Bank groupSpareBank 1 SR-Bank (Amounts in NOK million)
In the item Other operating income, NOK 12 million is included in profit on the sale of buildings.The corresponding figure for 1998 and 1997 was NOK 2 million and NOK 3 million.
26.
Notes.
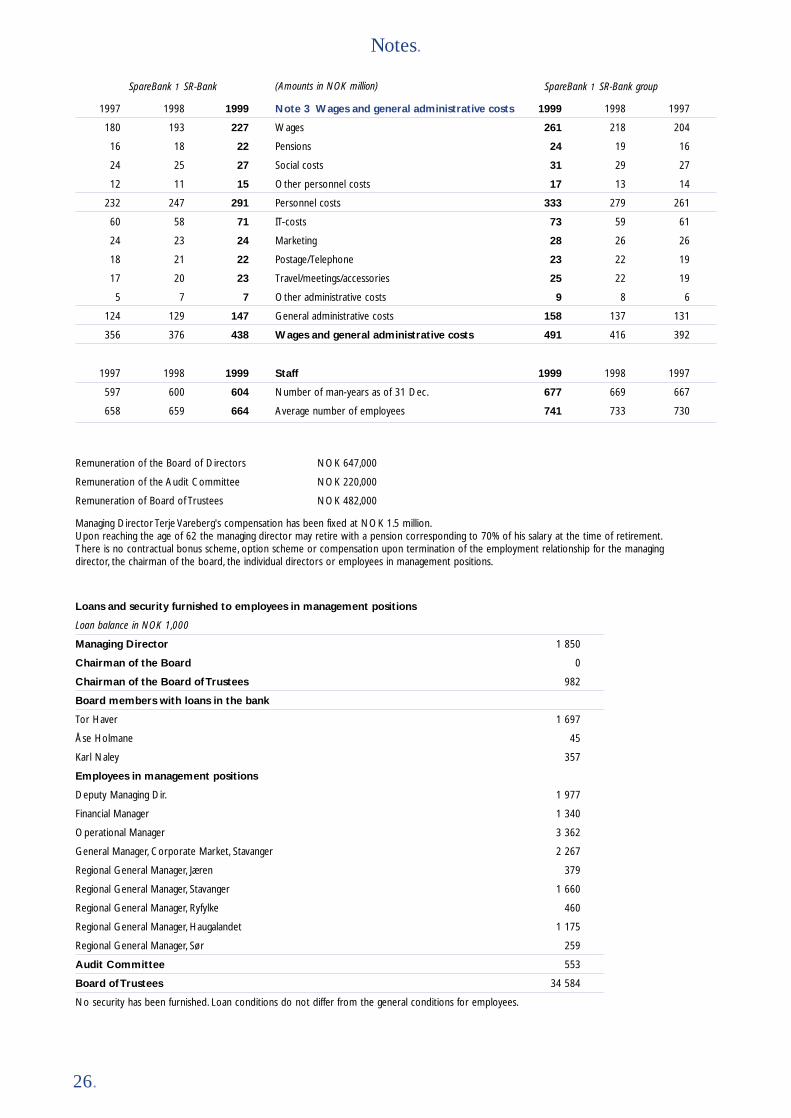
1997 1998 1999 Note 3 Wages and general administrative costs 1999 1998 1997
180 193 227 Wages 261 218 204
16 18 22 Pensions 24 19 16
24 25 27 Social costs 31 29 27
12 11 15 Other personnel costs 17 13 14
232 247 291 Personnel costs 333 279 261
60 58 71 IT-costs 73 59 61
24 23 24 Marketing 28 26 26
18 21 22 Postage/Telephone 23 22 19
17 20 23 Travel/meetings/accessories 25 22 19
5 7 7 Other administrative costs 9 8 6
124 129 147 General administrative costs 158 137 131
356 376 438 Wages and general administrative costs 491 416 392
Loans and security furnished to employees in management positions
Loan balance in NOK 1,000
Managing Director 1 850
Chairman of the Board 0
Chairman of the Board of Trustees 982
Board members with loans in the bank
Tor Haver 1 697
Åse Holmane 45
Karl Naley 357
Employees in management positions
Deputy Managing Dir. 1 977
Financial Manager 1 340
Operational Manager 3 362
General Manager, Corporate Market, Stavanger 2 267
Regional General Manager, Jæren 379
Regional General Manager, Stavanger 1 660
Regional General Manager, Ryfylke 460
Regional General Manager, Haugalandet 1 175
Regional General Manager, Sør 259
Audit Committee 553
Board of Trustees 34 584
No security has been furnished. Loan conditions do not differ from the general conditions for employees.
Remuneration of the Board of Directors NOK 647,000
Remuneration of the Audit Committee NOK 220,000
Remuneration of Board of Trustees NOK 482,000
Managing Director Terje Vareberg's compensation has been fixed at NOK 1.5 million.Upon reaching the age of 62 the managing director may retire with a pension corresponding to 70% of his salary at the time of retirement.There is no contractual bonus scheme, option scheme or compensation upon termination of the employment relationship for the managing director, the chairman of the board, the individual directors or employees in management positions.
1997 1998 1999 Staff 1999 1998 1997
597 600 604 Number of man-years as of 31 Dec. 677 669 667
658 659 664 Average number of employees 741 733 730
SpareBank 1 SR-Bank groupSpareBank 1 SR-Bank (Amounts in NOK million)
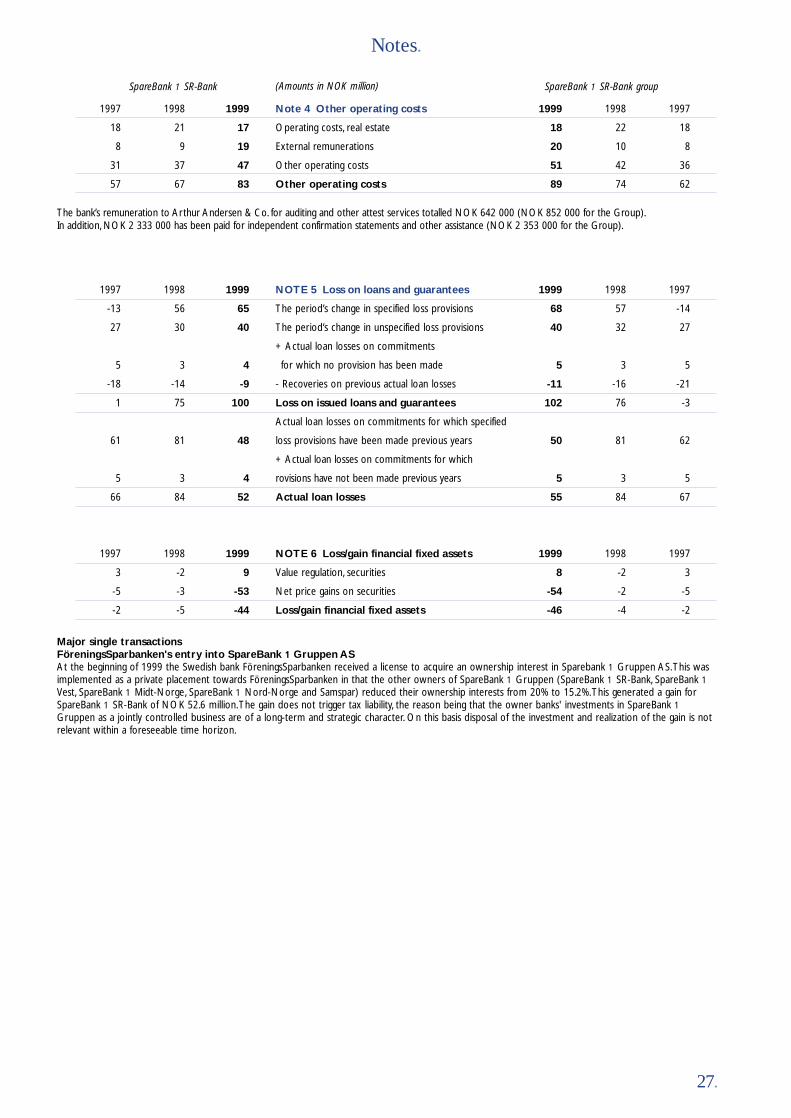
27.
Notes.
1997 1998 1999 Note 4 Other operating costs 1999 1998 1997
18 21 17 Operating costs, real estate 18 22 18
8 9 19 External remunerations 20 10 8
31 37 47 Other operating costs 51 42 36
57 67 83 Other operating costs 89 74 62
The bank’s remuneration to Arthur Andersen & Co. for auditing and other attest services totalled NOK 642 000 (NOK 852 000 for the Group).In addition, NOK 2 333 000 has been paid for independent confirmation statements and other assistance (NOK 2 353 000 for the Group).
1997 1998 1999 NOTE 5 Loss on loans and guarantees 1999 1998 1997
-13 56 65 The period’s change in specified loss provisions 68 57 -14
27 30 40 The period’s change in unspecified loss provisions 40 32 27
+ Actual loan losses on commitments
5 3 4 for which no provision has been made 5 3 5
-18 -14 -9 - Recoveries on previous actual loan losses -11 -16 -21
1 75 100 Loss on issued loans and guarantees 102 76 -3
Actual loan losses on commitments for which specified
61 81 48 loss provisions have been made previous years 50 81 62
+ Actual loan losses on commitments for which
5 3 4 rovisions have not been made previous years 5 3 5
66 84 52 Actual loan losses 55 84 67
SpareBank 1 SR-Bank groupSpareBank 1 SR-Bank (Amounts in NOK million)
1997 1998 1999 NOTE 6 Loss/gain financial fixed assets 1999 1998 1997
3 -2 9 Value regulation, securities 8 -2 3
-5 -3 -53 Net price gains on securities -54 -2 -5
-2 -5 -44 Loss/gain financial fixed assets -46 -4 -2
Major single transactionsFöreningsSparbanken's entry into SpareBank 1 Gruppen ASAt the beginning of 1999 the Swedish bank FöreningsSparbanken received a license to acquire an ownership interest in Sparebank 1 Gruppen AS.This wasimplemented as a private placement towards FöreningsSparbanken in that the other owners of SpareBank 1 Gruppen (SpareBank 1 SR-Bank, SpareBank 1Vest, SpareBank 1 Midt-Norge, SpareBank 1 Nord-Norge and Samspar) reduced their ownership interests from 20% to 15.2%.This generated a gain forSpareBank 1 SR-Bank of NOK 52.6 million.The gain does not trigger tax liability, the reason being that the owner banks' investments in SpareBank 1Gruppen as a jointly controlled business are of a long-term and strategic character. On this basis disposal of the investment and realization of the gain is notrelevant within a foreseeable time horizon.
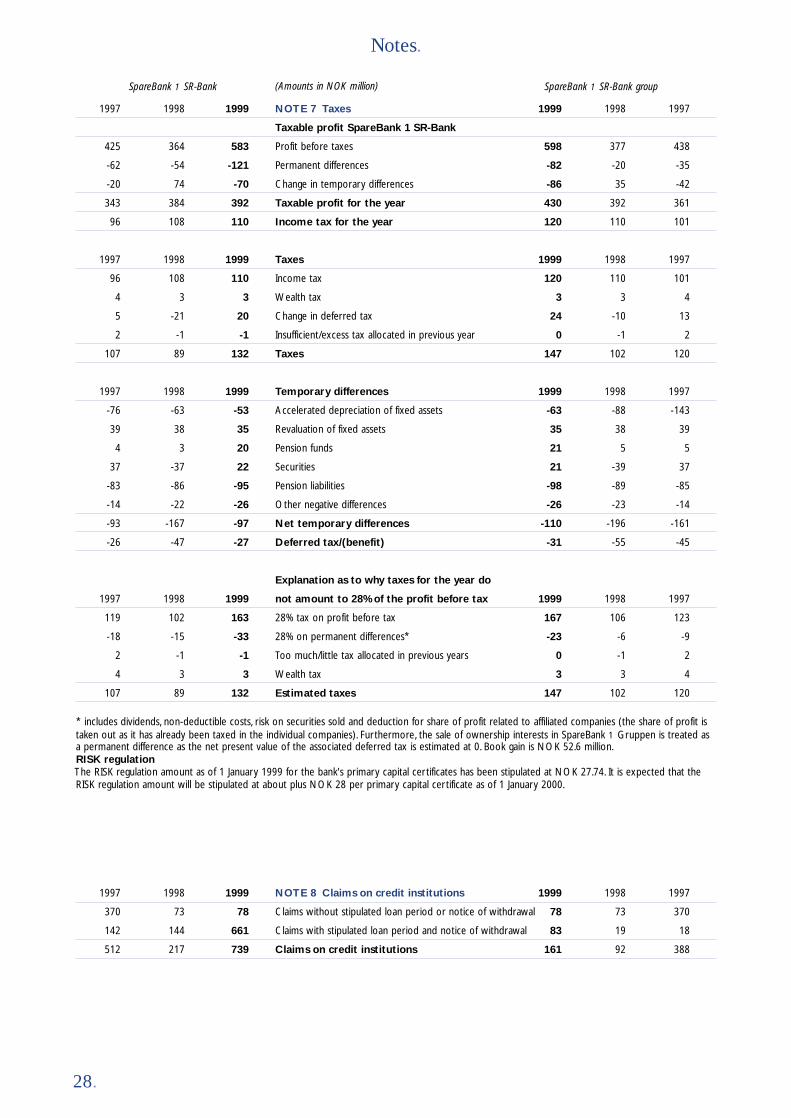
28.
Notes.
1997 1998 1999 NOTE 7 Taxes 1999 1998 1997
Taxable profit SpareBank 1 SR-Bank
425 364 583 Profit before taxes 598 377 438
-62 -54 -121 Permanent differences -82 -20 -35
-20 74 -70 Change in temporary differences -86 35 -42
343 384 392 Taxable profit for the year 430 392 361
96 108 110 Income tax for the year 120 110 101
1997 1998 1999 Taxes 1999 1998 1997
96 108 110 Income tax 120 110 101
4 3 3 Wealth tax 3 3 4
5 -21 20 Change in deferred tax 24 -10 13
2 -1 -1 Insufficient/excess tax allocated in previous year 0 -1 2
107 89 132 Taxes 147 102 120
1997 1998 1999 Temporary differences 1999 1998 1997
-76 -63 -53 Accelerated depreciation of fixed assets -63 -88 -143
39 38 35 Revaluation of fixed assets 35 38 39
4 3 20 Pension funds 21 5 5
37 -37 22 Securities 21 -39 37
-83 -86 -95 Pension liabilities -98 -89 -85
-14 -22 -26 Other negative differences -26 -23 -14
-93 -167 -97 Net temporary differences -110 -196 -161
-26 -47 -27 Deferred tax/(benefit) -31 -55 -45
Explanation as to why taxes for the year do
1997 1998 1999 not amount to 28% of the profit before tax 1999 1998 1997
119 102 163 28% tax on profit before tax 167 106 123
-18 -15 -33 28% on permanent differences* -23 -6 -9
2 -1 -1 Too much/little tax allocated in previous years 0 -1 2
4 3 3 Wealth tax 3 3 4
107 89 132 Estimated taxes 147 102 120
* includes dividends, non-deductible costs, risk on securities sold and deduction for share of profit related to affiliated companies (the share of profit istaken out as it has already been taxed in the individual companies). Furthermore, the sale of ownership interests in SpareBank 1 Gruppen is treated asa permanent difference as the net present value of the associated deferred tax is estimated at 0. Book gain is NOK 52.6 million.RISK regulationThe RISK regulation amount as of 1 January 1999 for the bank's primary capital certificates has been stipulated at NOK 27.74. It is expected that theRISK regulation amount will be stipulated at about plus NOK 28 per primary capital certificate as of 1 January 2000.
1997 1998 1999 NOTE 8 Claims on credit institutions 1999 1998 1997
370 73 78 Claims without stipulated loan period or notice of withdrawal 78 73 370
142 144 661 Claims with stipulated loan period and notice of withdrawal 83 19 18
512 217 739 Claims on credit institutions 161 92 388
SpareBank 1 SR-Bank groupSpareBank 1 SR-Bank (Amounts in NOK million)

29.
Notes.
1997 1998 1999 NOTE 9 Gross loans to customers 1999 1998 1997
1 580 1 830 2 007 Overdrafts 2 007 1 830 1 581
596 726 698 Building loans 698 726 596
19 848 23 743 27 745 Amortised loans 29 192 25 084 21 150
0 0 0 Leasing agreements 976 977 886
22 024 26 299 30 450 Gross loans to customers 32 873 28 617 24 213
Hereby subordinated loan capital
8 8 8 Subordinated loan capital in credit institutions 0 0 0
20 20 17 Subordinated loan capital in other financial institutions 17 20 20
4 0 0 Other subordinated loan capital 1 0 4
32 28 25 Subordinated loan capital posted under loans 18 20 24
1997 1998 1999 Loans to employees 1999 1998 1997
275 325 365 Loans to employees 401 361 304
2 7 11 Interest 12 8 3
There are no special terms for these loans beyond ordinary terms for employees.
1997 1998 1999 NOTE 10 Loss provisions 1999 1998 1997
Specified loss provisions:
332 258 239 Specified loss provisions, January 1 244 262 338
- Actual loan losses during the period for which
-61 -81 -48 specified loss provisions have been made previously -50 -81 -62
-13 62 65 +/- The period’s specified loss provisions 68 62 -14
258 239 256 Specified loss provisions, December 31 262 243 262
Unspecified loss provisions:
125 152 182 Unspecified loss provisions, January 1 193 161 134
+/- The period’s changes in
27 30 40 unspecified loss provisions 40 32 27
152 182 222 Unspecified loss provisions, December 31 233 193 161
SpareBank 1 SR-Bank groupSpareBank 1 SR-Bank (Amounts in NOK million)
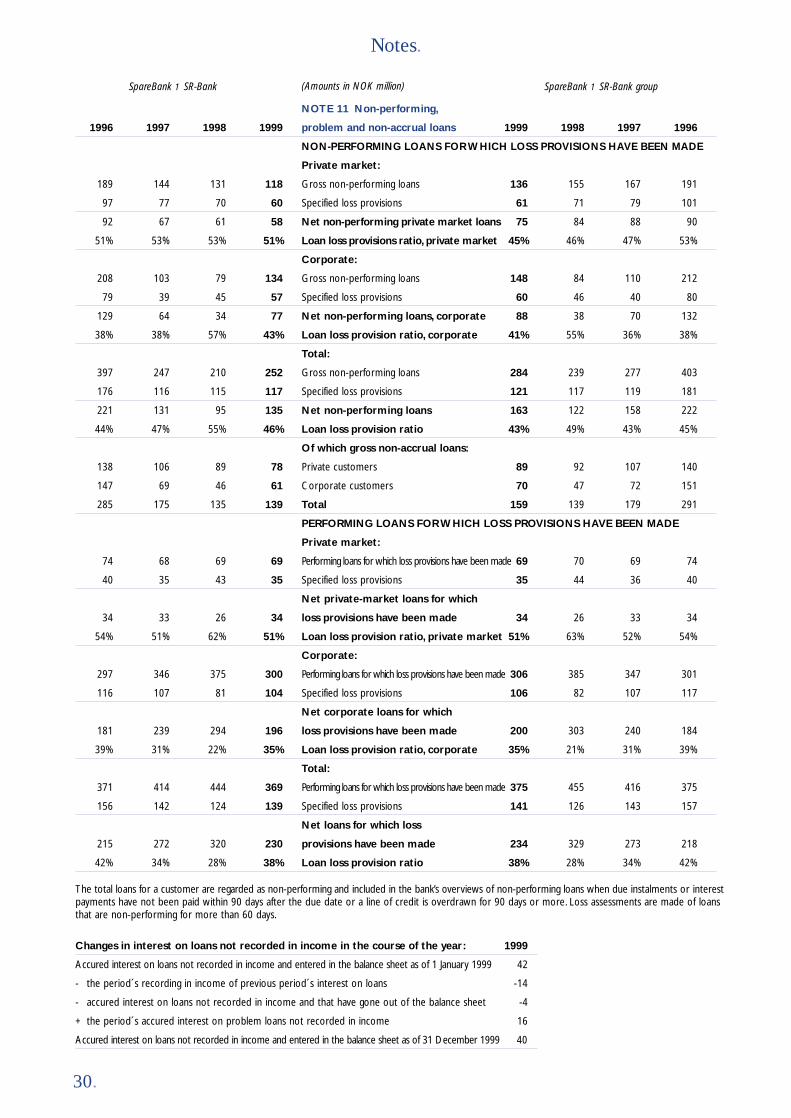
30.
Notes.
NOTE 11 Non-performing,
1996 1997 1998 1999 problem and non-accrual loans 1999 1998 1997 1996
NON-PERFORMING LOANS FOR WHICH LOSS PROVISIONS HAVE BEEN MADE
Private market:
189 144 131 118 Gross non-performing loans 136 155 167 191
97 77 70 60 Specified loss provisions 61 71 79 101
92 67 61 58 Net non-performing private market loans 75 84 88 90
51% 53% 53% 51% Loan loss provisions ratio, private market 45% 46% 47% 53%
Corporate:
208 103 79 134 Gross non-performing loans 148 84 110 212
79 39 45 57 Specified loss provisions 60 46 40 80
129 64 34 77 Net non-performing loans, corporate 88 38 70 132
38% 38% 57% 43% Loan loss provision ratio, corporate 41% 55% 36% 38%
Total:
397 247 210 252 Gross non-performing loans 284 239 277 403
176 116 115 117 Specified loss provisions 121 117 119 181
221 131 95 135 Net non-performing loans 163 122 158 222
44% 47% 55% 46% Loan loss provision ratio 43% 49% 43% 45%
Of which gross non-accrual loans:
138 106 89 78 Private customers 89 92 107 140
147 69 46 61 Corporate customers 70 47 72 151
285 175 135 139 Total 159 139 179 291
PERFORMING LOANS FOR WHICH LOSS PROVISIONS HAVE BEEN MADE
Private market:
74 68 69 69 Performing loans for which loss provisions have been made 69 70 69 74
40 35 43 35 Specified loss provisions 35 44 36 40
Net private-market loans for which
34 33 26 34 loss provisions have been made 34 26 33 34
54% 51% 62% 51% Loan loss provision ratio, private market 51% 63% 52% 54%
Corporate:
297 346 375 300 Performing loans for which loss provisions have been made 306 385 347 301
116 107 81 104 Specified loss provisions 106 82 107 117
Net corporate loans for which
181 239 294 196 loss provisions have been made 200 303 240 184
39% 31% 22% 35% Loan loss provision ratio, corporate 35% 21% 31% 39%
Total:
371 414 444 369 Performing loans for which loss provisions have been made 375 455 416 375
156 142 124 139 Specified loss provisions 141 126 143 157
Net loans for which loss
215 272 320 230 provisions have been made 234 329 273 218
42% 34% 28% 38% Loan loss provision ratio 38% 28% 34% 42%
SpareBank 1 SR-Bank groupSpareBank 1 SR-Bank (Amounts in NOK million)
The total loans for a customer are regarded as non-performing and included in the bank’s overviews of non-performing loans when due instalments or interest payments have not been paid within 90 days after the due date or a line of credit is overdrawn for 90 days or more. Loss assessments are made of loans that are non-performing for more than 60 days.
Changes in interest on loans not recorded in income in the course of the year: 1999
Accured interest on loans not recorded in income and entered in the balance sheet as of 1 January 1999 42
- the period´s recording in income of previous period´s interest on loans -14
- accured interest on loans not recorded in income and that have gone out of the balance sheet -4
+ the period´s accured interest on problem loans not recorded in income 16
Accured interest on loans not recorded in income and entered in the balance sheet as of 31 December 1999 40

31.
Notes.
A B C D E
1
2
3
4
5
Extract of the bank's risk classification system for corporate sector commitments of more than NOK 250,000 in 1998 and 1999.
Figures in NOK million 1998 1999 1998 1999Category Volume Volume % %
High risk 1 048 1 770 7.77% 11.81%
Normal risk 3 783 4 819 28.06% 32.15%
Low risk 8 653 8 402 64.17% 56.05%
Total 13 484 14 991 100.00% 100.00%
The risk matrix has had a growth in volume of a little over 11 percent in the last year.This growth has had a negative effect on the matrix in that a largerpart of the bank's commitments are in the high and normal risk categories.The main reason for this displacement is the implementation of more stringent routines and assessment requirements for calculation of security assets.
The bank endeavors to price its commitments on the basis of adopted risk classification. High-risk commitments have the highest pricing and a tighter follow-up routine that requires a total review of the commitments every quarter as a minimum.
Risk group specifications 1998 19991998 1999 1998 1999 1998 1999 Loan loss Loan lossLoan Loan Credit Credit Guarantees Guarantees provisions provisions
High 627 1 163 262 405 159 202 123 151Medium 2 213 3 069 1 241 1 615 329 135 3 10Low 4 727 4 628 2 941 2 604 985 1 170 0 0Total 7 567 8 860 4 444 4 624 1 473 1 507 126 161
Unspecified loan loss provisions have not been assigned to the individual risk groups.The bank's risk classification system places all corporate commitments in separate business areas.There are separate committees for most business areasthat follow up the market and structural development of the business area concerned.The business area committees are also a body for exchange of busi-ness area experience, both internally and within the SpareBank 1 alliance.
The bank's credit policy is derived from the bank's strategy and contains long-term objectives, annual guidelines and credit ceilings.The following businessarea categories are in the bank's risk classification system:
Distributed by business areas 1999 1999 1999 1999 1998 1999 1999Loan Credit Guarantee Total Total Default Loan loss prov.
Fish farming 281 200 13 494 310 0 0Fishing 196 115 17 328 323 1 8Fish processing 77 74 29 180 199 0 0Meat production 37 22 0 59 57 0 0Printing/publishing 75 72 5 152 106 0 0Industry 637 490 395 1 522 1 702 8 8Oil-related businesses 388 123 15 526 580 0 0Building and construction 431 380 427 1 238 1 082 17 11Commerce 623 640 152 1 415 1 338 25 26Hotels and restaurants 224 16 9 249 239 11 4Shipping 1 009 44 36 1 089 1 052 45 16Real estate 2 238 527 50 2 815 2 284 21 53Commercial service industry 848 399 43 1 290 974 0 0Transportation and storage 175 28 33 236 443 1 3Social/private service industry 334 172 25 531 343 3 7Agriculture 966 351 11 1 328 1 191 2 5Public sector 70 581 0 651 592 0 0Other 251 390 247 888 669 0 20Total 8 860 4 624 1 507 14 991 13 484 134 161
Note 12 Risk classification of loansCorporate sectorThe bank's risk classification system for corporate customers has been developed to control the bank's portfolio of commitments to the corporate sector in line with the strategy chosen by the bank and in accordance with the paramount guidelines laid down in the license regulations and credit policy.The riskclassification system stipulates clear requirements for processes and assessments to be applied to the work with corporate commitments.The bank hasresolved to divide corporate customers into the following groups: Low risk (green) – Normal risk (yellow) – High risk (red).
The risk classification systems differentiates the customers based on cash flow and financial strength in accordance with the latest audited accounts (A to E)and security (1 to 5). A commitment may contain the balance of the loan, the credit ceiling, the guarantee ceiling, accrued interest and credit exposure forforeign currency and interest rate futures. On the basis of the above-mentioned regulations, all corporate customers are placed in the following matrix:

32.
Notes.
NOTE 13 Loss on loans and guarantees in 1999 broken down into business areasLoans and Gross Net Loss
SpareBank 1 SR-Bank Group guarantees losses Recoveries losses percentage
Agriculture/forestry 1 216 2 0 2 0.2%
Fishing/fish farming 692 0 5 -5 -0.7%
Mining/extraction 373 0 0 0 0.0%
Industry 1 778 2 4 -2 -0.1%
Power and water supply/building and construction 1 415 4 1 3 0.2%
Commodity trade, hotel and restaurant business 1 663 24 7 17 1.0%
Foreign trade shipping, pipeline transport and other transport activities 1 487 26 0 26 1.8%
Real estate business 3 377 18 4 14 0.4%
Service industry 652 7 2 5 0.8%
Public sector and financial services 419 0 0 0 0.0%
Unspecified loss provisions 0 40 0 40
Total corporate sector 13 072 123 23 100 0.8%
Private customers 20 950 28 26 3 0.0%
Total 34 022 151 49 102 0.3%
Average annual expected loss level for corporate sectorThe bank has made calculations of the expected loss level for corporate customers.These calculations are based on empirical figures from Norwegian banks through a trade cycle of 12 years in addition to the regional correlation between the customer's business area and the quality and diversificationin the bank's portfolio.The calculations show that the bank does not expect a higher loss level for the corporate sector commitments over a trade cycle.
Private marketThe credit policy is to contribute towards strengthening the portfolio of private customer commitments in line with the strategy chosen by the bank and the guidelines stipulated.This entails that clearly set out requirements be stipulated for the processes and assessments to be used in work with private customer commitments. Granting of loans and credit shall be based on the customer's financial ability and determination to service their loans. Security is the bank's guarantee if the ability to service a loan should nevertheless fail.
The bank has resolved to divide private customer commitments into the following groups:Low risk (green) – Normal risk (yellow) – High risk (red).
Income, assets and determination are synthesized into financial ability expressed in A-D.The bank's security is expressed in 1-5.A commitment may contain the balance of the loan, the credit ceiling, the guarantee ceiling and accrued interest. On the basis of the above-mentioned regulations, all private customer commitments are placed in the following matrix:
A B C D
1
2
3
4
5
Extract of the bank's risk classification system for private customer commitments in 1998 and 1999.
Figures in NOK million 1998 1999 1998 1999Category Volume Volume % %
High risk 834 1 371 7.99% 8.45%
Normal risk 1 748 2 878 16.74% 17.74%
Low risk 7 857 11 976 75.27% 73.81%
Total 10 439 16 225 100.00% 100.00%
The risk classification system for the private market is in a development phase and contains 64% and 83% respectively of the loans to the private market for the years 1998 and 1999.The percentage distribution of the loans within the bank's defined risk areas has been almost stable despite substantial growth in classified lending.
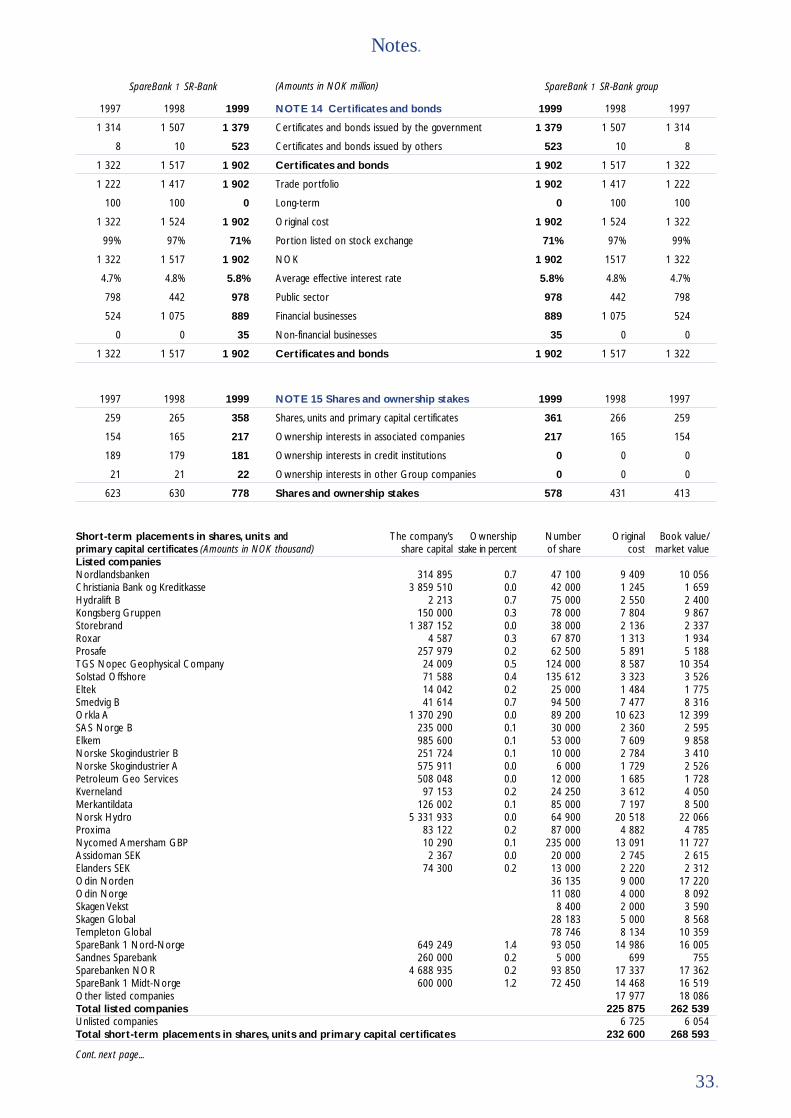
33.
Notes.
Short-term placements in shares, units and The company’s Ownership Number Original Book value/ primary capital certificates (Amounts in NOK thousand) share capital stake in percent of share cost market valueListed companiesNordlandsbanken 314 895 0.7 47 100 9 409 10 056Christiania Bank og Kreditkasse 3 859 510 0.0 42 000 1 245 1 659Hydralift B 2 213 0.7 75 000 2 550 2 400Kongsberg Gruppen 150 000 0.3 78 000 7 804 9 867Storebrand 1 387 152 0.0 38 000 2 136 2 337Roxar 4 587 0.3 67 870 1 313 1 934Prosafe 257 979 0.2 62 500 5 891 5 188TGS Nopec Geophysical Company 24 009 0.5 124 000 8 587 10 354Solstad Offshore 71 588 0.4 135 612 3 323 3 526Eltek 14 042 0.2 25 000 1 484 1 775Smedvig B 41 614 0.7 94 500 7 477 8 316Orkla A 1 370 290 0.0 89 200 10 623 12 399SAS Norge B 235 000 0.1 30 000 2 360 2 595Elkem 985 600 0.1 53 000 7 609 9 858Norske Skogindustrier B 251 724 0.1 10 000 2 784 3 410Norske Skogindustrier A 575 911 0.0 6 000 1 729 2 526Petroleum Geo Services 508 048 0.0 12 000 1 685 1 728Kverneland 97 153 0.2 24 250 3 612 4 050Merkantildata 126 002 0.1 85 000 7 197 8 500Norsk Hydro 5 331 933 0.0 64 900 20 518 22 066Proxima 83 122 0.2 87 000 4 882 4 785Nycomed Amersham GBP 10 290 0.1 235 000 13 091 11 727Assidoman SEK 2 367 0.0 20 000 2 745 2 615Elanders SEK 74 300 0.2 13 000 2 220 2 312Odin Norden 36 135 9 000 17 220Odin Norge 11 080 4 000 8 092Skagen Vekst 8 400 2 000 3 590Skagen Global 28 183 5 000 8 568Templeton Global 78 746 8 134 10 359SpareBank 1 Nord-Norge 649 249 1.4 93 050 14 986 16 005Sandnes Sparebank 260 000 0.2 5 000 699 755Sparebanken NOR 4 688 935 0.2 93 850 17 337 17 362SpareBank 1 Midt-Norge 600 000 1.2 72 450 14 468 16 519Other listed companies 17 977 18 086Total listed companies 225 875 262 539Unlisted companies 6 725 6 054Total short-term placements in shares, units and primary capital certificates 232 600 268 593
Cont. next page...
1997 1998 1999 NOTE 14 Certificates and bonds 1999 1998 1997
1 314 1 507 1 379 Certificates and bonds issued by the government 1 379 1 507 1 314
8 10 523 Certificates and bonds issued by others 523 10 8
1 322 1 517 1 902 Certificates and bonds 1 902 1 517 1 322
1 222 1 417 1 902 Trade portfolio 1 902 1 417 1 222
100 100 0 Long-term 0 100 100
1 322 1 524 1 902 Original cost 1 902 1 524 1 322
99% 97% 71% Portion listed on stock exchange 71% 97% 99%
1 322 1 517 1 902 NOK 1 902 1517 1 322
4.7% 4.8% 5.8% Average effective interest rate 5.8% 4.8% 4.7%
798 442 978 Public sector 978 442 798
524 1 075 889 Financial businesses 889 1 075 524
0 0 35 Non-financial businesses 35 0 0
1 322 1 517 1 902 Certificates and bonds 1 902 1 517 1 322
SpareBank 1 SR-Bank groupSpareBank 1 SR-Bank (Amounts in NOK million)
1997 1998 1999 NOTE 15 Shares and ownership stakes 1999 1998 1997
259 265 358 Shares, units and primary capital certificates 361 266 259
154 165 217 Ownership interests in associated companies 217 165 154
189 179 181 Ownership interests in credit institutions 0 0 0
21 21 22 Ownership interests in other Group companies 0 0 0
623 630 778 Shares and ownership stakes 578 431 413
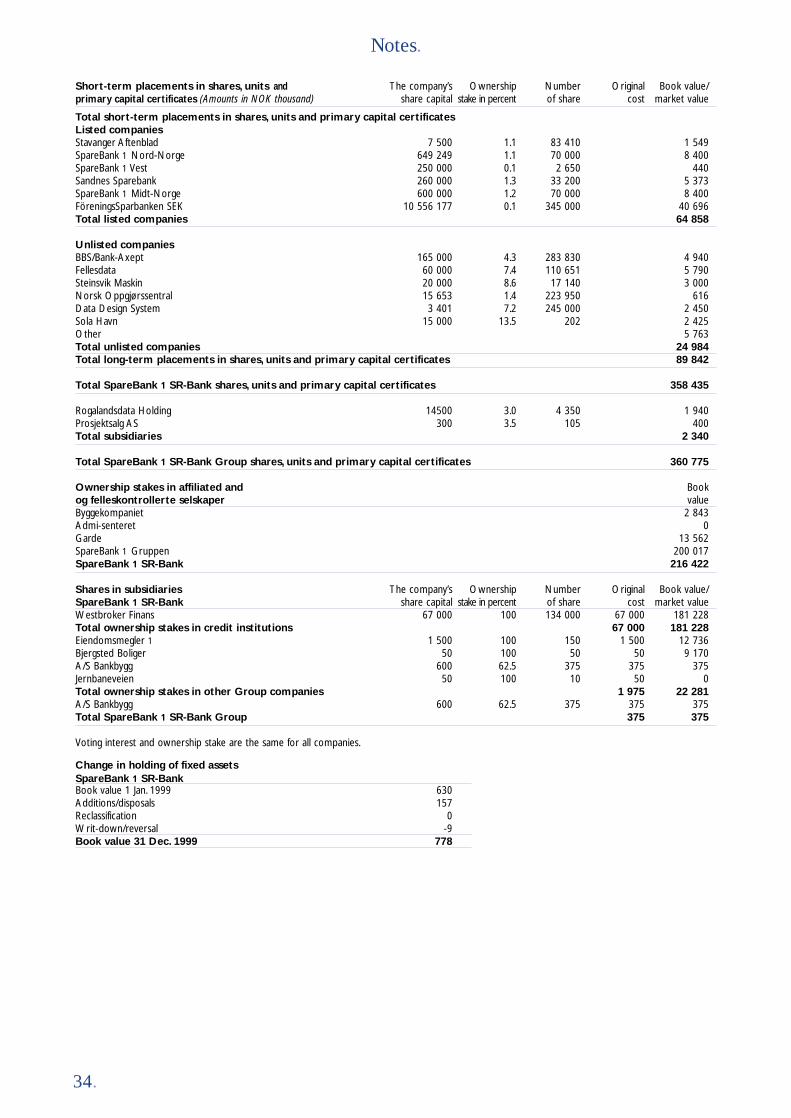
34.
Notes.
Short-term placements in shares, units and The company’s Ownership Number Original Book value/ primary capital certificates (Amounts in NOK thousand) share capital stake in percent of share cost market value
Total short-term placements in shares, units and primary capital certificatesListed companiesStavanger Aftenblad 7 500 1.1 83 410 1 549SpareBank 1 Nord-Norge 649 249 1.1 70 000 8 400SpareBank 1 Vest 250 000 0.1 2 650 440Sandnes Sparebank 260 000 1.3 33 200 5 373SpareBank 1 Midt-Norge 600 000 1.2 70 000 8 400FöreningsSparbanken SEK 10 556 177 0.1 345 000 40 696Total listed companies 64 858
Unlisted companiesBBS/Bank-Axept 165 000 4.3 283 830 4 940Fellesdata 60 000 7.4 110 651 5 790Steinsvik Maskin 20 000 8.6 17 140 3 000Norsk Oppgjørssentral 15 653 1.4 223 950 616Data Design System 3 401 7.2 245 000 2 450Sola Havn 15 000 13.5 202 2 425Other 5 763Total unlisted companies 24 984Total long-term placements in shares, units and primary capital certificates 89 842
Total SpareBank 1 SR-Bank shares, units and primary capital certificates 358 435
Rogalandsdata Holding 14500 3.0 4 350 1 940Prosjektsalg AS 300 3.5 105 400Total subsidiaries 2 340
Total SpareBank 1 SR-Bank Group shares, units and primary capital certificates 360 775
Ownership stakes in affiliated and Bookog felleskontrollerte selskaper valueByggekompaniet 2 843Admi-senteret 0Garde 13 562SpareBank 1 Gruppen 200 017SpareBank 1 SR-Bank 216 422
Shares in subsidiaries The company’s Ownership Number Original Book value/ SpareBank 1 SR-Bank share capital stake in percent of share cost market valueWestbroker Finans 67 000 100 134 000 67 000 181 228Total ownership stakes in credit institutions 67 000 181 228Eiendomsmegler 1 1 500 100 150 1 500 12 736Bjergsted Boliger 50 100 50 50 9 170A/S Bankbygg 600 62.5 375 375 375Jernbaneveien 50 100 10 50 0Total ownership stakes in other Group companies 1 975 22 281A/S Bankbygg 600 62.5 375 375 375Total SpareBank 1 SR-Bank Group 375 375
Voting interest and ownership stake are the same for all companies.
Change in holding of fixed assetsSpareBank 1 SR-BankBook value 1 Jan. 1999 630Additions/disposals 157Reclassification 0Writ-down/reversal -9Book value 31 Dec. 1999 778

35.
Notes.
Year of Registered OwnershipCompany acquisition office interst in %
Westbroker Finans 1 1987 Stavanger 100,00%
EiendomsMegler 1 Rogaland 1990 Stavanger 100,00%
Bjergsted Boliger 1990 Stavanger 100,00%
SpareBank 1 Gruppen 1996 Oslo 15,20%
Garde 1988 Stavanger 25,00%
Byggekompaniet 1992 Stavanger 33,33%
Admi-Senteret 1984 Jørpeland 50,00%
Investments in all companies are assessed according to the equity method.
Investments in subsidiaries Westbroker Eiendoms- BjergstedExcess value analysis Finans Megler 1 Boliger
Equity entered in balance sheet at time of purchase 53 400 8 000 50
Goodwill 40 000
Original cost 93 400 8 000 50
Calculation of value entered in balance sheet as of 31 Dec. 1999
Opening balance as of 1 Jan. 1999 181 170 9 741 10 772
Profit for the year 26 558 6 995 734
Transferred to/from companies (dividends/group contribution) -26 500 -4 000 -2 336
Closing balance as of 31 Dec. 1999 181 228 12 736 9 170
Investments in affiliated and jointly controlled businesses SpareBank 1 Bygge- Admi-Excess value analysis Gruppen Garde kompaniet Senteret
Equity entered in balance sheet at time of purchase 145 900 8 279 2 000 1 000
Goodwill 2 265
Original cost 145 900 10 544 2 000 1 000
Beregning av balanseført verdi pr. 31.12.99
Opening balance as of 1 Jan. 1999 146 387 16 086 3 036 0
Share of profit for the year 8 238 3 312 2 936 0
Depreciation of goodwill -453
Transferred from the company (dividends) -8 800 -3 434 -3 129
Changes in capital in the course of the year * 54 192 -1 949
Closing balance as of 31 Dec. 1999 200 017 13 562 2 843 0
Non-depreciated goodwill in Garde is NOK 113 000 as of 31 Dec. 1999.
* An option loss arose upon FöreningsSparbankens entry into SpareBank 1 Gruppen.This option loss was entered in the owner bank’s accounts as a deduction against gross profit this entry generated and not as a share of profit.This causes a difference between the group profit of SpareBank 1Gruppens and the owner banks’ entered share of profit from SpareBank 1 Gruppen equal to the said option loss.
Jointly controlled businessesSpareBank 1 SR-Bank owns SpareBank 1 Gruppen AS together with SpareBank 1 Nord-Norge, SpareBank 1 Midt-Norge, SpareBank 1 Vest andSamarbeidende Sparebanker As. Each of the parties owns 15.2 percent of the shares in the company. In addition, the Swedish bank FöreningsSparbankenowns 24% of the shares in the company.The management structure for the SpareBank 1-alliance is governed by en agreement between the owners.Theownership interest is regarded as participation in a jointly controlled business.
In the accounts for SpareBank 1 SR-Bank the shares in SpareBank 1 Gruppen As have been appraised according to the equity method, both in the compa-ny´s accounts and the group accounts, as the operations of SpareBank 1 Gruppen are considerably different than the bank´s other operations where theuse of the straight line method of depreciation would provide accounting information that is not easily accessible.
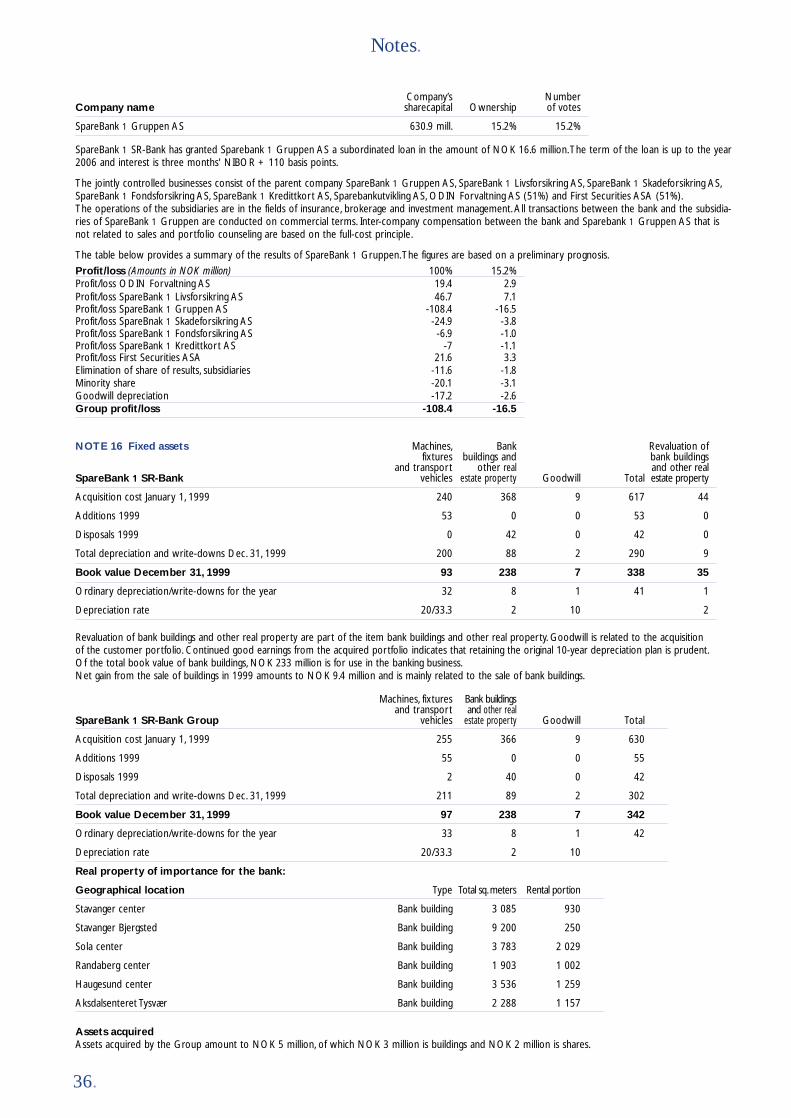
Profit/loss (Amounts in NOK million) 100% 15.2%Profit/loss ODIN Forvaltning AS 19.4 2.9Profit/loss SpareBank 1 Livsforsikring AS 46.7 7.1Profit/loss SpareBank 1 Gruppen AS -108.4 -16.5Profit/loss SpareBnak 1 Skadeforsikring AS -24.9 -3.8Profit/loss SpareBank 1 Fondsforsikring AS -6.9 -1.0Profit/loss SpareBank 1 Kredittkort AS -7 -1.1Profit/loss First Securities ASA 21.6 3.3Elimination of share of results, subsidiaries -11.6 -1.8Minority share -20.1 -3.1Goodwill depreciation -17.2 -2.6Group profit/loss -108.4 -16.5
36.
Notes.
Company’s NumberCompany name sharecapital Ownership of votes
SpareBank 1 Gruppen AS 630.9 mill. 15.2% 15.2%
SpareBank 1 SR-Bank has granted Sparebank 1 Gruppen AS a subordinated loan in the amount of NOK 16.6 million.The term of the loan is up to the year2006 and interest is three months' NIBOR + 110 basis points.
The jointly controlled businesses consist of the parent company SpareBank 1 Gruppen AS, SpareBank 1 Livsforsikring AS, SpareBank 1 Skadeforsikring AS,SpareBank 1 Fondsforsikring AS, SpareBank 1 Kredittkort AS, Sparebankutvikling AS, ODIN Forvaltning AS (51%) and First Securities ASA (51%).The operations of the subsidiaries are in the fields of insurance, brokerage and investment management. All transactions between the bank and the subsidia-ries of SpareBank 1 Gruppen are conducted on commercial terms. Inter-company compensation between the bank and Sparebank 1 Gruppen AS that isnot related to sales and portfolio counseling are based on the full-cost principle.
The table below provides a summary of the results of SpareBank 1 Gruppen.The figures are based on a preliminary prognosis.
NOTE 16 Fixed assets Machines, Bank Revaluation offixtures buildings and bank buildings
and transport other real and other real SpareBank 1 SR-Bank vehicles estate property Goodwill Total estate property
Acquisition cost January 1, 1999 240 368 9 617 44
Additions 1999 53 0 0 53 0
Disposals 1999 0 42 0 42 0
Total depreciation and write-downs Dec. 31, 1999 200 88 2 290 9
Book value December 31, 1999 93 238 7 338 35
Ordinary depreciation/write-downs for the year 32 8 1 41 1
Depreciation rate 20/33.3 2 10 2
Revaluation of bank buildings and other real property are part of the item bank buildings and other real property. Goodwill is related to the acquisition of the customer portfolio. Continued good earnings from the acquired portfolio indicates that retaining the original 10-year depreciation plan is prudent.Of the total book value of bank buildings, NOK 233 million is for use in the banking business.Net gain from the sale of buildings in 1999 amounts to NOK 9.4 million and is mainly related to the sale of bank buildings.
Machines, fixtures Bank buildingsand transport and other real
SpareBank 1 SR-Bank Group vehicles estate property Goodwill Total
Acquisition cost January 1, 1999 255 366 9 630
Additions 1999 55 0 0 55
Disposals 1999 2 40 0 42
Total depreciation and write-downs Dec. 31, 1999 211 89 2 302
Book value December 31, 1999 97 238 7 342
Ordinary depreciation/write-downs for the year 33 8 1 42
Depreciation rate 20/33.3 2 10
Real property of importance for the bank:
Geographical location Type Total sq.meters Rental portion
Stavanger center Bank building 3 085 930
Stavanger Bjergsted Bank building 9 200 250
Sola center Bank building 3 783 2 029
Randaberg center Bank building 1 903 1 002
Haugesund center Bank building 3 536 1 259
Aksdalsenteret Tysvær Bank building 2 288 1 157
Assets acquiredAssets acquired by the Group amount to NOK 5 million, of which NOK 3 million is buildings and NOK 2 million is shares.
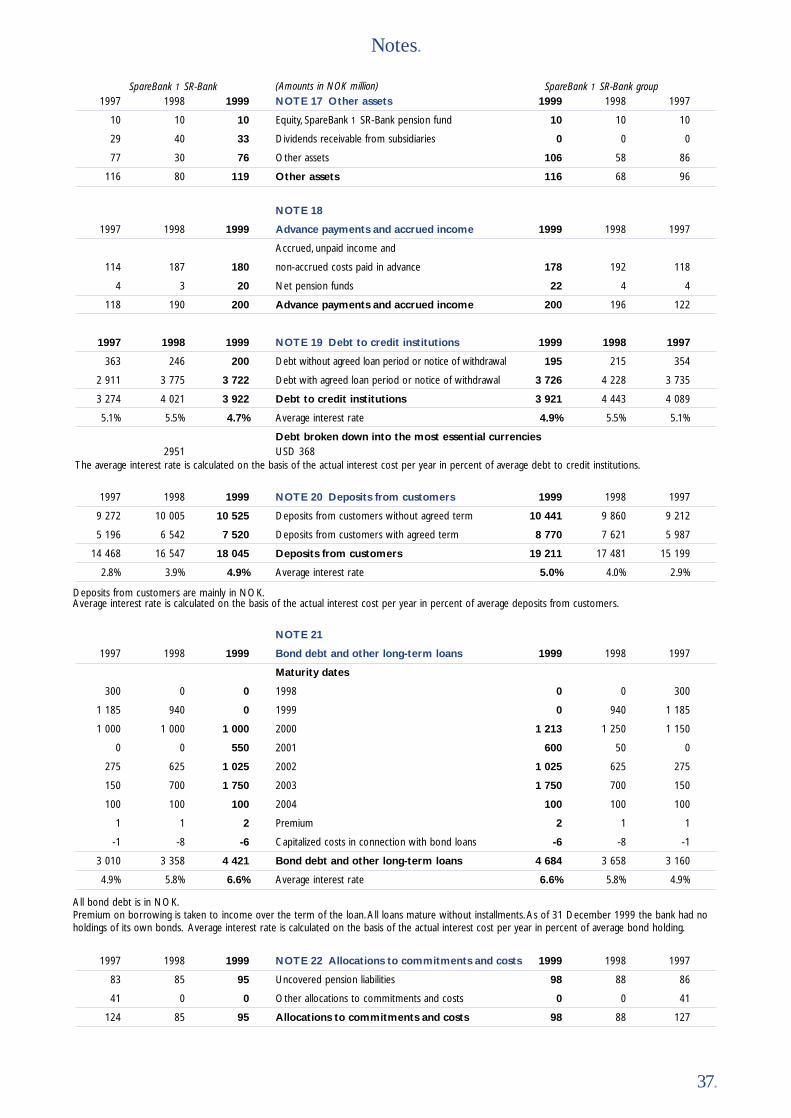
37.
Notes.
1997 1998 1999 NOTE 19 Debt to credit institutions 1999 1998 1997
363 246 200 Debt without agreed loan period or notice of withdrawal 195 215 354
2 911 3 775 3 722 Debt with agreed loan period or notice of withdrawal 3 726 4 228 3 735
3 274 4 021 3 922 Debt to credit institutions 3 921 4 443 4 089
5.1% 5.5% 4.7% Average interest rate 4.9% 5.5% 5.1%
Debt broken down into the most essential currencies2951 USD 368
The average interest rate is calculated on the basis of the actual interest cost per year in percent of average debt to credit institutions.
1997 1998 1999 NOTE 20 Deposits from customers 1999 1998 1997
9 272 10 005 10 525 Deposits from customers without agreed term 10 441 9 860 9 212
5 196 6 542 7 520 Deposits from customers with agreed term 8 770 7 621 5 987
14 468 16 547 18 045 Deposits from customers 19 211 17 481 15 199
2.8% 3.9% 4.9% Average interest rate 5.0% 4.0% 2.9%
Deposits from customers are mainly in NOK.Average interest rate is calculated on the basis of the actual interest cost per year in percent of average deposits from customers.
NOTE 21
1997 1998 1999 Bond debt and other long-term loans 1999 1998 1997
Maturity dates
300 0 0 1998 0 0 300
1 185 940 0 1999 0 940 1 185
1 000 1 000 1 000 2000 1 213 1 250 1 150
0 0 550 2001 600 50 0
275 625 1 025 2002 1 025 625 275
150 700 1 750 2003 1 750 700 150
100 100 100 2004 100 100 100
1 1 2 Premium 2 1 1
-1 -8 -6 Capitalized costs in connection with bond loans -6 -8 -1
3 010 3 358 4 421 Bond debt and other long-term loans 4 684 3 658 3 160
4.9% 5.8% 6.6% Average interest rate 6.6% 5.8% 4.9%
All bond debt is in NOK.Premium on borrowing is taken to income over the term of the loan. All loans mature without installments. As of 31 December 1999 the bank had no holdings of its own bonds. Average interest rate is calculated on the basis of the actual interest cost per year in percent of average bond holding.
1997 1998 1999 NOTE 22 Allocations to commitments and costs 1999 1998 1997
83 85 95 Uncovered pension liabilities 98 88 86
41 0 0 Other allocations to commitments and costs 0 0 41
124 85 95 Allocations to commitments and costs 98 88 127
1997 1998 1999 NOTE 17 Other assets 1999 1998 1997
10 10 10 Equity, SpareBank 1 SR-Bank pension fund 10 10 10
29 40 33 Dividends receivable from subsidiaries 0 0 0
77 30 76 Other assets 106 58 86
116 80 119 Other assets 116 68 96
NOTE 18
1997 1998 1999 Advance payments and accrued income 1999 1998 1997
Accrued, unpaid income and
114 187 180 non-accrued costs paid in advance 178 192 118
4 3 20 Net pension funds 22 4 4
118 190 200 Advance payments and accrued income 200 196 122
SpareBank 1 SR-Bank groupSpareBank 1 SR-Bank (Amounts in NOK million)
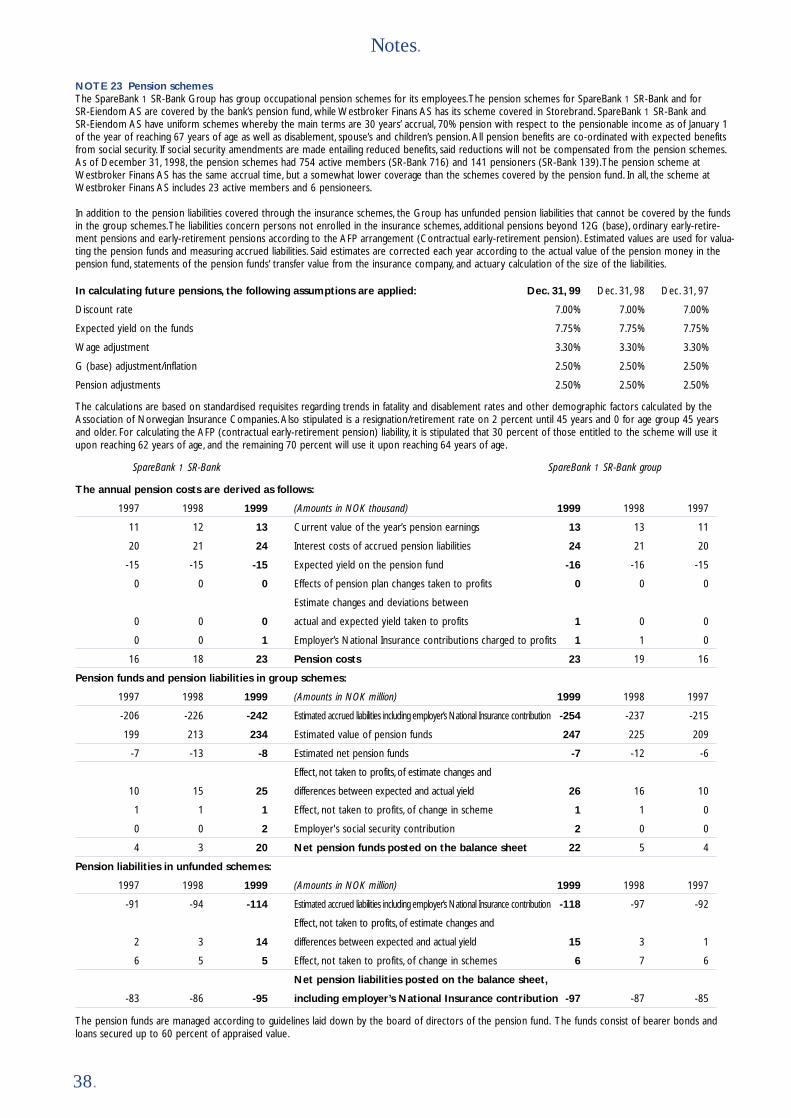
38.
Notes.
NOTE 23 Pension schemesThe SpareBank 1 SR-Bank Group has group occupational pension schemes for its employees.The pension schemes for SpareBank 1 SR-Bank and for SR-Eiendom AS are covered by the bank’s pension fund, while Westbroker Finans AS has its scheme covered in Storebrand. SpareBank 1 SR-Bank and SR-Eiendom AS have uniform schemes whereby the main terms are 30 years’ accrual, 70% pension with respect to the pensionable income as of January 1of the year of reaching 67 years of age as well as disablement, spouse’s and children’s pension. All pension benefits are co-ordinated with expected benefitsfrom social security. If social security amendments are made entailing reduced benefits, said reductions will not be compensated from the pension schemes.As of December 31, 1998, the pension schemes had 754 active members (SR-Bank 716) and 141 pensioners (SR-Bank 139).The pension scheme atWestbroker Finans AS has the same accrual time, but a somewhat lower coverage than the schemes covered by the pension fund. In all, the scheme atWestbroker Finans AS includes 23 active members and 6 pensioneers.
In addition to the pension liabilities covered through the insurance schemes, the Group has unfunded pension liabilities that cannot be covered by the fundsin the group schemes.The liabilities concern persons not enrolled in the insurance schemes, additional pensions beyond 12G (base), ordinary early-retire-ment pensions and early-retirement pensions according to the AFP arrangement (Contractual early-retirement pension). Estimated values are used for valua-ting the pension funds and measuring accrued liabilities. Said estimates are corrected each year according to the actual value of the pension money in thepension fund, statements of the pension funds’ transfer value from the insurance company, and actuary calculation of the size of the liabilities.
In calculating future pensions, the following assumptions are applied: Dec. 31, 99 Dec. 31, 98 Dec. 31, 97
Discount rate 7.00% 7.00% 7.00%
Expected yield on the funds 7.75% 7.75% 7.75%
Wage adjustment 3.30% 3.30% 3.30%
G (base) adjustment/inflation 2.50% 2.50% 2.50%
Pension adjustments 2.50% 2.50% 2.50%
The calculations are based on standardised requisites regarding trends in fatality and disablement rates and other demographic factors calculated by theAssociation of Norwegian Insurance Companies. Also stipulated is a resignation/retirement rate on 2 percent until 45 years and 0 for age group 45 yearsand older. For calculating the AFP (contractual early-retirement pension) liability, it is stipulated that 30 percent of those entitled to the scheme will use itupon reaching 62 years of age, and the remaining 70 percent will use it upon reaching 64 years of age.
The annual pension costs are derived as follows:
1997 1998 1999 (Amounts in NOK thousand) 1999 1998 1997
11 12 13 Current value of the year’s pension earnings 13 13 11
20 21 24 Interest costs of accrued pension liabilities 24 21 20
-15 -15 -15 Expected yield on the pension fund -16 -16 -15
0 0 0 Effects of pension plan changes taken to profits 0 0 0
Estimate changes and deviations between
0 0 0 actual and expected yield taken to profits 1 0 0
0 0 1 Employer’s National Insurance contributions charged to profits 1 1 0
16 18 23 Pension costs 23 19 16
Pension funds and pension liabilities in group schemes:
1997 1998 1999 (Amounts in NOK million) 1999 1998 1997
-206 -226 -242 Estimated accrued liabilities including employer’s National Insurance contribution -254 -237 -215
199 213 234 Estimated value of pension funds 247 225 209
-7 -13 -8 Estimated net pension funds -7 -12 -6
Effect, not taken to profits, of estimate changes and
10 15 25 differences between expected and actual yield 26 16 10
1 1 1 Effect, not taken to profits, of change in scheme 1 1 0
0 0 2 Employer's social security contribution 2 0 0
4 3 20 Net pension funds posted on the balance sheet 22 5 4
Pension liabilities in unfunded schemes:
1997 1998 1999 (Amounts in NOK million) 1999 1998 1997
-91 -94 -114 Estimated accrued liabilities including employer’s National Insurance contribution -118 -97 -92
Effect, not taken to profits, of estimate changes and
2 3 14 differences between expected and actual yield 15 3 1
6 5 5 Effect, not taken to profits, of change in schemes 6 7 6
Net pension liabilities posted on the balance sheet,
-83 -86 -95 including employer’s National Insurance contribution -97 -87 -85
The pension funds are managed according to guidelines laid down by the board of directors of the pension fund. The funds consist of bearer bonds andloans secured up to 60 percent of appraised value.
SpareBank 1 SR-Bank groupSpareBank 1 SR-Bank
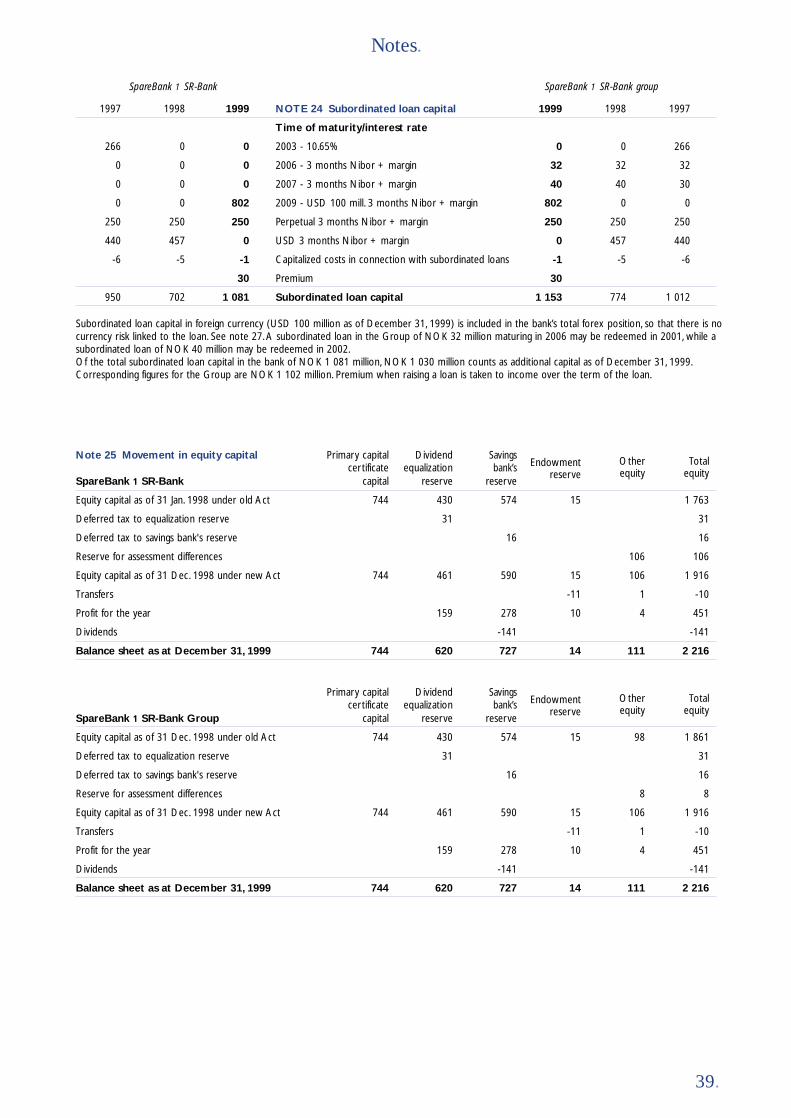
39.
Notes.
1997 1998 1999 NOTE 24 Subordinated loan capital 1999 1998 1997
Time of maturity/interest rate
266 0 0 2003 - 10.65% 0 0 266
0 0 0 2006 - 3 months Nibor + margin 32 32 32
0 0 0 2007 - 3 months Nibor + margin 40 40 30
0 0 802 2009 - USD 100 mill. 3 months Nibor + margin 802 0 0
250 250 250 Perpetual 3 months Nibor + margin 250 250 250
440 457 0 USD 3 months Nibor + margin 0 457 440
-6 -5 -1 Capitalized costs in connection with subordinated loans -1 -5 -6
30 Premium 30
950 702 1 081 Subordinated loan capital 1 153 774 1 012
Subordinated loan capital in foreign currency (USD 100 million as of December 31, 1999) is included in the bank’s total forex position, so that there is nocurrency risk linked to the loan. See note 27. A subordinated loan in the Group of NOK 32 million maturing in 2006 may be redeemed in 2001, while asubordinated loan of NOK 40 million may be redeemed in 2002.Of the total subordinated loan capital in the bank of NOK 1 081 million, NOK 1 030 million counts as additional capital as of December 31, 1999.Corresponding figures for the Group are NOK 1 102 million. Premium when raising a loan is taken to income over the term of the loan.
Note 25 Movement in equity capital Primary capital Dividend Savingscertificate equalization bank’s Endowment Other Total
SpareBank 1 SR-Bank capital reserve reservereserve equity equity
Equity capital as of 31 Jan. 1998 under old Act 744 430 574 15 1 763
Deferred tax to equalization reserve 31 31
Deferred tax to savings bank's reserve 16 16
Reserve for assessment differences 106 106
Equity capital as of 31 Dec. 1998 under new Act 744 461 590 15 106 1 916
Transfers -11 1 -10
Profit for the year 159 278 10 4 451
Dividends -141 -141
Balance sheet as at December 31, 1999 744 620 727 14 111 2 216
Primary capital Dividend Savingscertificate equalization bank’s Endowment Other Total
SpareBank 1 SR-Bank Group capital reserve reservereserve equity equity
Equity capital as of 31 Dec. 1998 under old Act 744 430 574 15 98 1 861
Deferred tax to equalization reserve 31 31
Deferred tax to savings bank's reserve 16 16
Reserve for assessment differences 8 8
Equity capital as of 31 Dec. 1998 under new Act 744 461 590 15 106 1 916
Transfers -11 1 -10
Profit for the year 159 278 10 4 451
Dividends -141 -141
Balance sheet as at December 31, 1999 744 620 727 14 111 2 216
SpareBank 1 SR-Bank groupSpareBank 1 SR-Bank
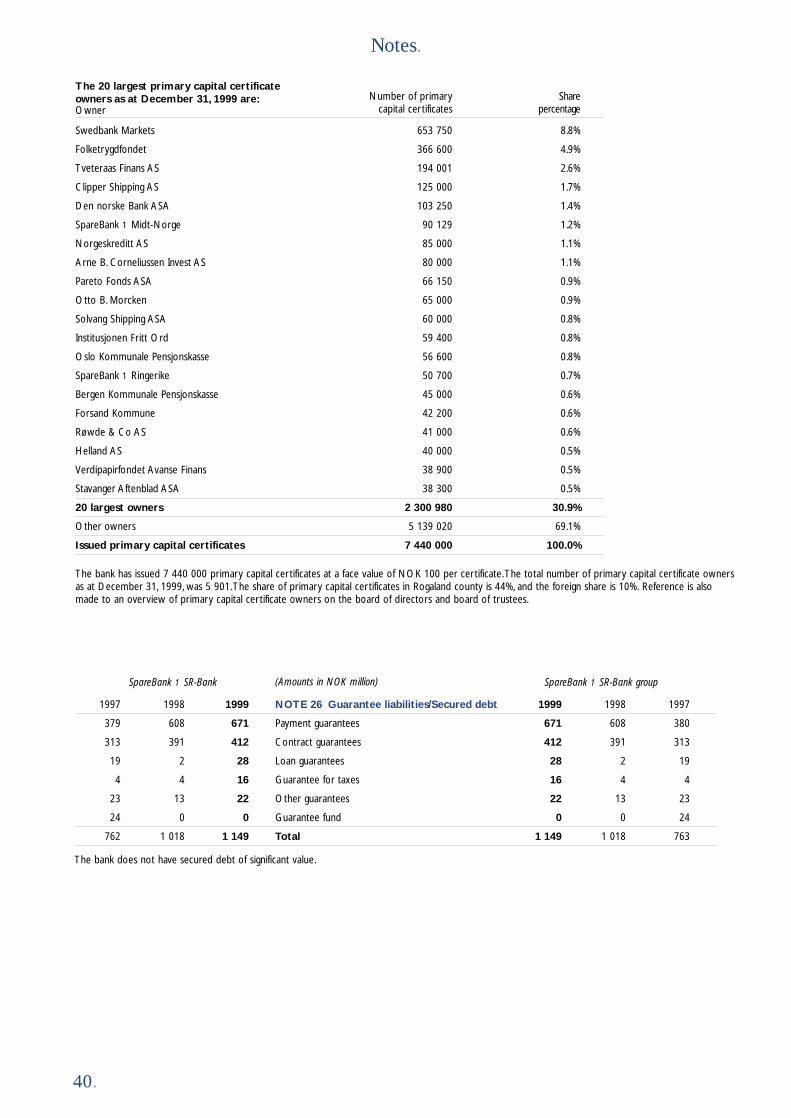
40.
Notes.
The 20 largest primary capital certificateowners as at December 31, 1999 are: Number of primary ShareOwner capital certificates percentage
Swedbank Markets 653 750 8.8%
Folketrygdfondet 366 600 4.9%
Tveteraas Finans AS 194 001 2.6%
Clipper Shipping AS 125 000 1.7%
Den norske Bank ASA 103 250 1.4%
SpareBank 1 Midt-Norge 90 129 1.2%
Norgeskreditt AS 85 000 1.1%
Arne B. Corneliussen Invest AS 80 000 1.1%
Pareto Fonds ASA 66 150 0.9%
Otto B. Morcken 65 000 0.9%
Solvang Shipping ASA 60 000 0.8%
Institusjonen Fritt Ord 59 400 0.8%
Oslo Kommunale Pensjonskasse 56 600 0.8%
SpareBank 1 Ringerike 50 700 0.7%
Bergen Kommunale Pensjonskasse 45 000 0.6%
Forsand Kommune 42 200 0.6%
Røwde & Co AS 41 000 0.6%
Helland AS 40 000 0.5%
Verdipapirfondet Avanse Finans 38 900 0.5%
Stavanger Aftenblad ASA 38 300 0.5%
20 largest owners 2 300 980 30.9%
Other owners 5 139 020 69.1%
Issued primary capital certificates 7 440 000 100.0%
The bank has issued 7 440 000 primary capital certificates at a face value of NOK 100 per certificate.The total number of primary capital certificate owners as at December 31, 1999, was 5 901.The share of primary capital certificates in Rogaland county is 44%, and the foreign share is 10%. Reference is alsomade to an overview of primary capital certificate owners on the board of directors and board of trustees.
1997 1998 1999 NOTE 26 Guarantee liabilities/Secured debt 1999 1998 1997
379 608 671 Payment guarantees 671 608 380
313 391 412 Contract guarantees 412 391 313
19 2 28 Loan guarantees 28 2 19
4 4 16 Guarantee for taxes 16 4 4
23 13 22 Other guarantees 22 13 23
24 0 0 Guarantee fund 0 0 24
762 1 018 1 149 Total 1 149 1 018 763
The bank does not have secured debt of significant value.
SpareBank 1 SR-Bank groupSpareBank 1 SR-Bank (Amounts in NOK million)
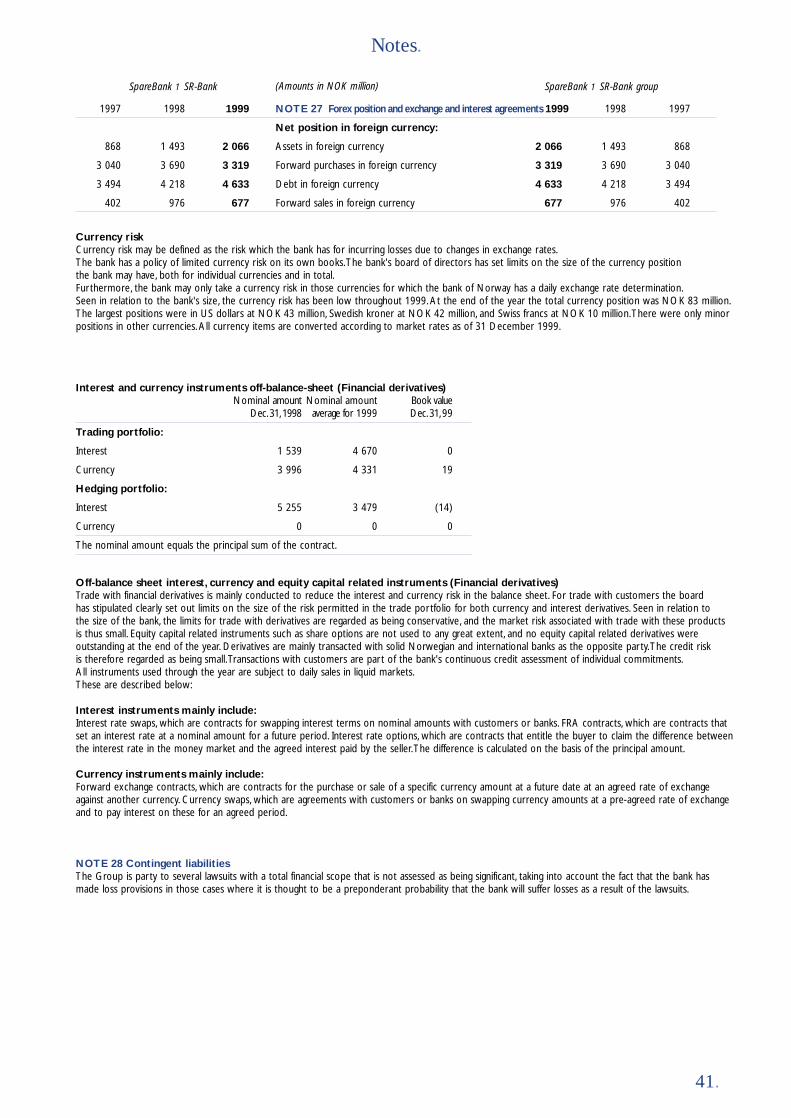
41.
Notes.
1997 1998 1999 NOTE 27 Forex position and exchange and interest agreements 1999 1998 1997
Net position in foreign currency:
868 1 493 2 066 Assets in foreign currency 2 066 1 493 868
3 040 3 690 3 319 Forward purchases in foreign currency 3 319 3 690 3 040
3 494 4 218 4 633 Debt in foreign currency 4 633 4 218 3 494
402 976 677 Forward sales in foreign currency 677 976 402
Currency riskCurrency risk may be defined as the risk which the bank has for incurring losses due to changes in exchange rates.The bank has a policy of limited currency risk on its own books.The bank's board of directors has set limits on the size of the currency position the bank may have, both for individual currencies and in total.Furthermore, the bank may only take a currency risk in those currencies for which the bank of Norway has a daily exchange rate determination.Seen in relation to the bank's size, the currency risk has been low throughout 1999. At the end of the year the total currency position was NOK 83 million.The largest positions were in US dollars at NOK 43 million, Swedish kroner at NOK 42 million, and Swiss francs at NOK 10 million.There were only minorpositions in other currencies. All currency items are converted according to market rates as of 31 December 1999.
Interest and currency instruments off-balance-sheet (Financial derivatives)Nominal amount Nominal amount Book value
Dec. 31, 1998 average for 1999 Dec. 31, 99
Trading portfolio:
Interest 1 539 4 670 0
Currency 3 996 4 331 19
Hedging portfolio:
Interest 5 255 3 479 (14)
Currency 0 0 0
The nominal amount equals the principal sum of the contract.
Off-balance sheet interest, currency and equity capital related instruments (Financial derivatives)Trade with financial derivatives is mainly conducted to reduce the interest and currency risk in the balance sheet. For trade with customers the board has stipulated clearly set out limits on the size of the risk permitted in the trade portfolio for both currency and interest derivatives. Seen in relation to the size of the bank, the limits for trade with derivatives are regarded as being conservative, and the market risk associated with trade with these products is thus small. Equity capital related instruments such as share options are not used to any great extent, and no equity capital related derivatives were outstanding at the end of the year. Derivatives are mainly transacted with solid Norwegian and international banks as the opposite party.The credit risk is therefore regarded as being small.Transactions with customers are part of the bank's continuous credit assessment of individual commitments.All instruments used through the year are subject to daily sales in liquid markets.These are described below:
Interest instruments mainly include:Interest rate swaps, which are contracts for swapping interest terms on nominal amounts with customers or banks. FRA contracts, which are contracts thatset an interest rate at a nominal amount for a future period. Interest rate options, which are contracts that entitle the buyer to claim the difference betweenthe interest rate in the money market and the agreed interest paid by the seller.The difference is calculated on the basis of the principal amount.
Currency instruments mainly include:Forward exchange contracts, which are contracts for the purchase or sale of a specific currency amount at a future date at an agreed rate of exchangeagainst another currency. Currency swaps, which are agreements with customers or banks on swapping currency amounts at a pre-agreed rate of exchangeand to pay interest on these for an agreed period.
NOTE 28 Contingent liabilitiesThe Group is party to several lawsuits with a total financial scope that is not assessed as being significant, taking into account the fact that the bank hasmade loss provisions in those cases where it is thought to be a preponderant probability that the bank will suffer losses as a result of the lawsuits.
SpareBank 1 SR-Bank groupSpareBank 1 SR-Bank (Amounts in NOK million)

42.
Notes.
NOTE 29 Distribution of loans, guarantees and deposits in business areas
SpareBank 1 SR-Bank Group (Amounts in NOK million) Utlån Garantier Innskudd
Agriculture/forestry 1 212 4 686
Fishing/fish farming 675 17 57
Mining/extraction 370 3 115
Industry 1 500 278 758
Construction and water supply/building and construction 1 003 412 779
Commodity trade, hotel and restaurant business 1 450 213 969
Foreign-trade shipping, pipeline transport and other transport activities 1 450 37 439
Real estate business 3 313 64 1 324
Service industry 629 23 1 501
Public sector and financial services 340 79 1 632
Total corporate sector 11 942 1 130 8 260
Private customers 20 931 19 10 951
Total 32 873 1 149 19 211
Distribution of loans, guarantees and deposits in geographical areas
SpareBank 1 SR-Bank Group Loans Guarantees Deposits
Greater Oslo area 1 984 155 553
Vest-Agder 584 6 485
Rogaland 28 499 937 17 366
Hordaland 1 097 41 415
Other domestic 487 10 183
Foreign countries 222 0 209
Total 32 873 1 149 19 211
NOTE 30 Transactions with subsidiaries
(Amounts in NOK million)
Income and expenses: 1999 1998 1997
Interest income from subsidiaries 20 13 11
Interest costs to subsidiaries 2 1 1
Commission income from subsidiaries 1 1 1
Other income from subsidiaries 1 1 1
Other costs to subsidiaries 1 0 1
Claims on subsidiaries:
Overdraft 2 0 5
Other loans 576 125 119
Other claims 37 40 33
Total claims 615 165 157
Debt to subsidiaries:
Deposits from subsidiaries 92 178 71
Other debts 0 0 3
Total liabilities 92 178 74
Claims on and debt to affiliated companies:
(Amounts in NOK million) Loans Deposits Guarantees
Byggekompaniet 0 9 1
Admi-Senteret AS 9 0 0
Garde ASA 0 27 51
SpareBank 1 Gruppen A/S 17 102 3
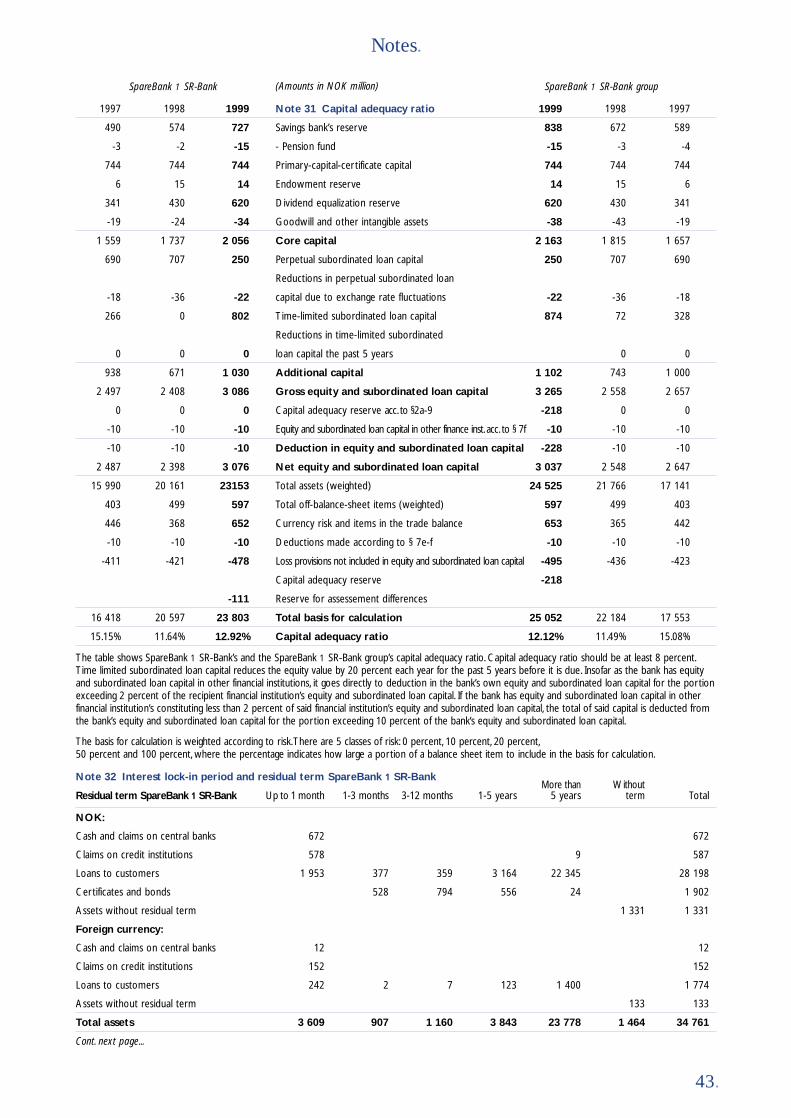
43.
Notes.
NOK:
Cash and claims on central banks 672 672
Claims on credit institutions 578 9 587
Loans to customers 1 953 377 359 3 164 22 345 28 198
Certificates and bonds 528 794 556 24 1 902
Assets without residual term 1 331 1 331
Foreign currency:
Cash and claims on central banks 12 12
Claims on credit institutions 152 152
Loans to customers 242 2 7 123 1 400 1 774
Assets without residual term 133 133
Total assets 3 609 907 1 160 3 843 23 778 1 464 34 761
Cont. next page...
Note 32 Interest lock-in period and residual term SpareBank 1 SR-BankMore than Without
Residual term SpareBank 1 SR-Bank Up to 1 month 1-3 months 3-12 months 1-5 years 5 years term Total
SpareBank 1 SR-Bank groupSpareBank 1 SR-Bank (Amounts in NOK million)
1997 1998 1999 Note 31 Capital adequacy ratio 1999 1998 1997
490 574 727 Savings bank’s reserve 838 672 589
-3 -2 -15 - Pension fund -15 -3 -4
744 744 744 Primary-capital-certificate capital 744 744 744
6 15 14 Endowment reserve 14 15 6
341 430 620 Dividend equalization reserve 620 430 341
-19 -24 -34 Goodwill and other intangible assets -38 -43 -19
1 559 1 737 2 056 Core capital 2 163 1 815 1 657
690 707 250 Perpetual subordinated loan capital 250 707 690
Reductions in perpetual subordinated loan
-18 -36 -22 capital due to exchange rate fluctuations -22 -36 -18
266 0 802 Time-limited subordinated loan capital 874 72 328
Reductions in time-limited subordinated
0 0 0 loan capital the past 5 years 0 0
938 671 1 030 Additional capital 1 102 743 1 000
2 497 2 408 3 086 Gross equity and subordinated loan capital 3 265 2 558 2 657
0 0 0 Capital adequacy reserve acc. to §2a-9 -218 0 0
-10 -10 -10 Equity and subordinated loan capital in other finance inst. acc. to § 7f -10 -10 -10
-10 -10 -10 Deduction in equity and subordinated loan capital -228 -10 -10
2 487 2 398 3 076 Net equity and subordinated loan capital 3 037 2 548 2 647
15 990 20 161 23153 Total assets (weighted) 24 525 21 766 17 141
403 499 597 Total off-balance-sheet items (weighted) 597 499 403
446 368 652 Currency risk and items in the trade balance 653 365 442
-10 -10 -10 Deductions made according to § 7e-f -10 -10 -10
-411 -421 -478 Loss provisions not included in equity and subordinated loan capital -495 -436 -423
Capital adequacy reserve -218
-111 Reserve for assessement differences
16 418 20 597 23 803 Total basis for calculation 25 052 22 184 17 553
15.15% 11.64% 12.92% Capital adequacy ratio 12.12% 11.49% 15.08%
The table shows SpareBank 1 SR-Bank’s and the SpareBank 1 SR-Bank group’s capital adequacy ratio. Capital adequacy ratio should be at least 8 percent.Time limited subordinated loan capital reduces the equity value by 20 percent each year for the past 5 years before it is due. Insofar as the bank has equity and subordinated loan capital in other financial institutions, it goes directly to deduction in the bank’s own equity and subordinated loan capital for the portionexceeding 2 percent of the recipient financial institution’s equity and subordinated loan capital. If the bank has equity and subordinated loan capital in other financial institution’s constituting less than 2 percent of said financial institution’s equity and subordinated loan capital, the total of said capital is deducted from the bank’s equity and subordinated loan capital for the portion exceeding 10 percent of the bank’s equity and subordinated loan capital.
The basis for calculation is weighted according to risk.There are 5 classes of risk: 0 percent, 10 percent, 20 percent,50 percent and 100 percent, where the percentage indicates how large a portion of a balance sheet item to include in the basis for calculation.
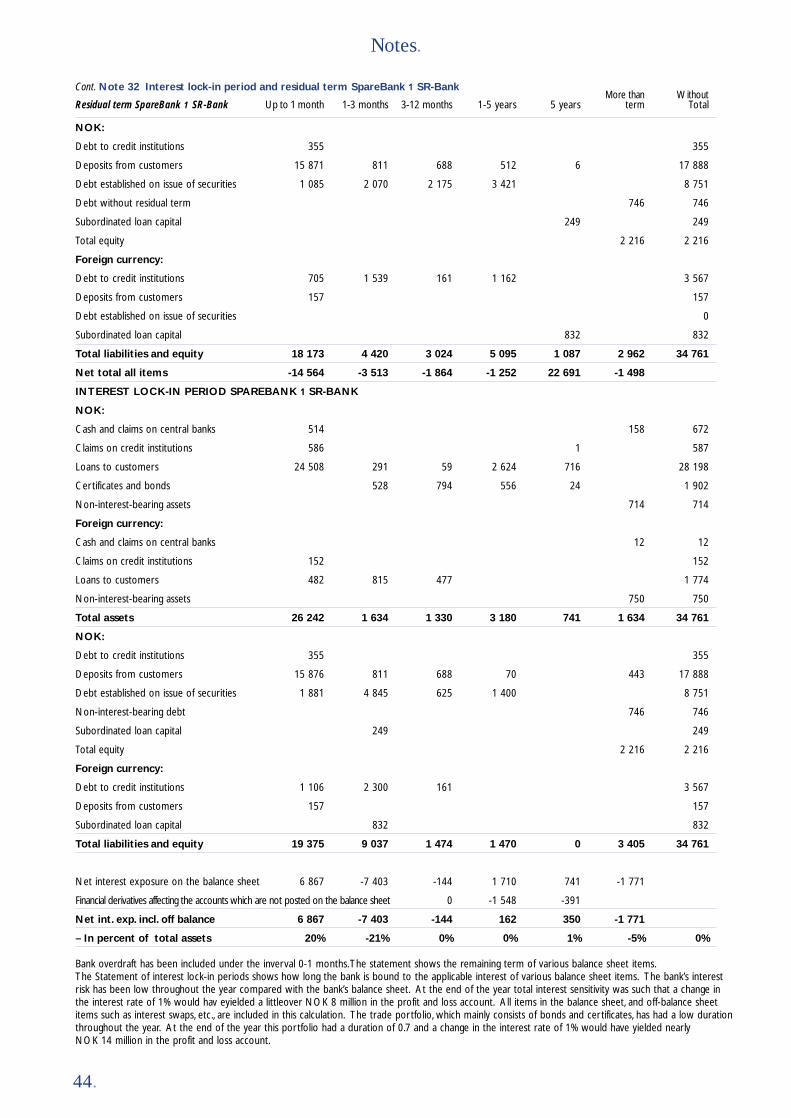
44.
Notes.
Cont. Note 32 Interest lock-in period and residual term SpareBank 1 SR-BankMore than Without
Residual term SpareBank 1 SR-Bank Up to 1 month 1-3 months 3-12 months 1-5 years 5 years term Total
NOK:
Debt to credit institutions 355 355
Deposits from customers 15 871 811 688 512 6 17 888
Debt established on issue of securities 1 085 2 070 2 175 3 421 8 751
Debt without residual term 746 746
Subordinated loan capital 249 249
Total equity 2 216 2 216
Foreign currency:
Debt to credit institutions 705 1 539 161 1 162 3 567
Deposits from customers 157 157
Debt established on issue of securities 0
Subordinated loan capital 832 832
Total liabilities and equity 18 173 4 420 3 024 5 095 1 087 2 962 34 761
Net total all items -14 564 -3 513 -1 864 -1 252 22 691 -1 498
INTEREST LOCK-IN PERIOD SPAREBANK 1 SR-BANK
NOK:
Cash and claims on central banks 514 158 672
Claims on credit institutions 586 1 587
Loans to customers 24 508 291 59 2 624 716 28 198
Certificates and bonds 528 794 556 24 1 902
Non-interest-bearing assets 714 714
Foreign currency:
Cash and claims on central banks 12 12
Claims on credit institutions 152 152
Loans to customers 482 815 477 1 774
Non-interest-bearing assets 750 750
Total assets 26 242 1 634 1 330 3 180 741 1 634 34 761
NOK:
Debt to credit institutions 355 355
Deposits from customers 15 876 811 688 70 443 17 888
Debt established on issue of securities 1 881 4 845 625 1 400 8 751
Non-interest-bearing debt 746 746
Subordinated loan capital 249 249
Total equity 2 216 2 216
Foreign currency:
Debt to credit institutions 1 106 2 300 161 3 567
Deposits from customers 157 157
Subordinated loan capital 832 832
Total liabilities and equity 19 375 9 037 1 474 1 470 0 3 405 34 761
Net interest exposure on the balance sheet 6 867 -7 403 -144 1 710 741 -1 771
Financial derivatives affecting the accounts which are not posted on the balance sheet 0 -1 548 -391
Net int. exp. incl. off balance 6 867 -7 403 -144 162 350 -1 771
– In percent of total assets 20% -21% 0% 0% 1% -5% 0%
Bank overdraft has been included under the inverval 0-1 months.The statement shows the remaining term of various balance sheet items.The Statement of interest lock-in periods shows how long the bank is bound to the applicable interest of various balance sheet items. The bank’s interestrisk has been low throughout the year compared with the bank’s balance sheet. At the end of the year total interest sensitivity was such that a change inthe interest rate of 1% would hav eyielded a littleover NOK 8 million in the profit and loss account. All items in the balance sheet, and off-balance sheetitems such as interest swaps, etc., are included in this calculation. The trade portfolio, which mainly consists of bonds and certificates, has had a low durationthroughout the year. At the end of the year this portfolio had a duration of 0.7 and a change in the interest rate of 1% would have yielded nearly NOK 14 million in the profit and loss account.
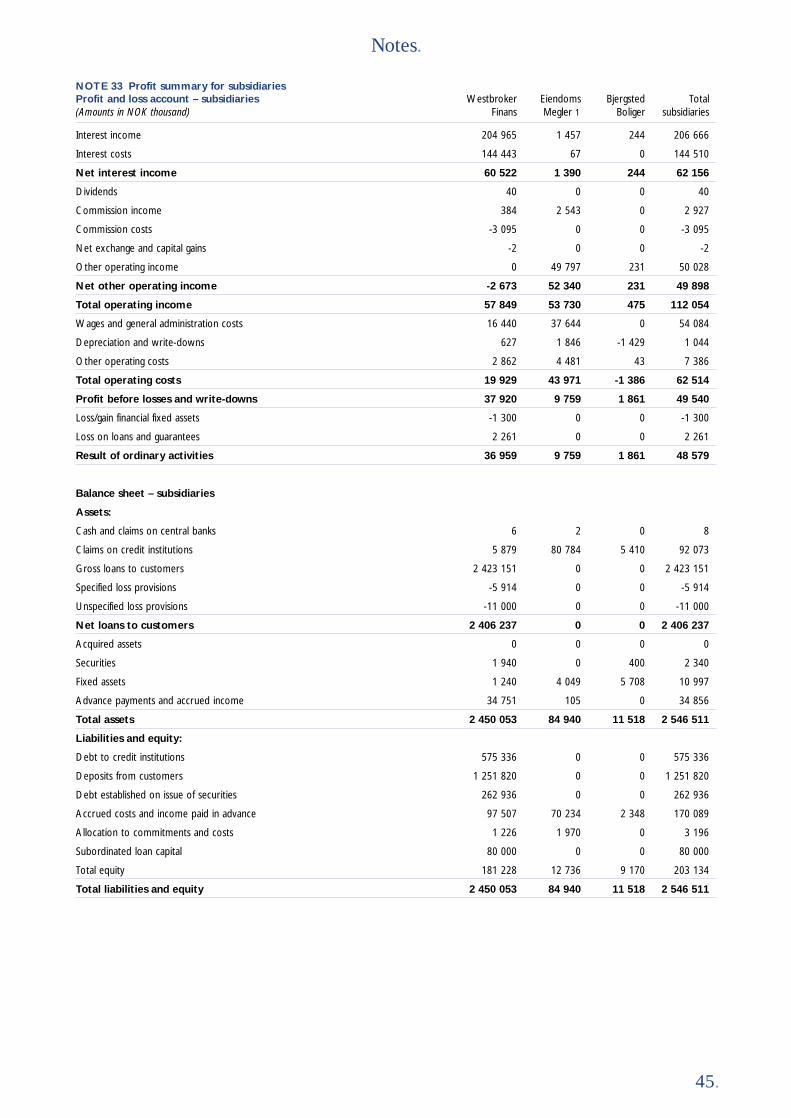
45.
Notes.
NOTE 33 Profit summary for subsidiariesProfit and loss account – subsidiaries Westbroker Eiendoms Bjergsted Total(Amounts in NOK thousand) Finans Megler 1 Boliger subsidiaries
Interest income 204 965 1 457 244 206 666
Interest costs 144 443 67 0 144 510
Net interest income 60 522 1 390 244 62 156
Dividends 40 0 0 40
Commission income 384 2 543 0 2 927
Commission costs -3 095 0 0 -3 095
Net exchange and capital gains -2 0 0 -2
Other operating income 0 49 797 231 50 028
Net other operating income -2 673 52 340 231 49 898
Total operating income 57 849 53 730 475 112 054
Wages and general administration costs 16 440 37 644 0 54 084
Depreciation and write-downs 627 1 846 -1 429 1 044
Other operating costs 2 862 4 481 43 7 386
Total operating costs 19 929 43 971 -1 386 62 514
Profit before losses and write-downs 37 920 9 759 1 861 49 540
Loss/gain financial fixed assets -1 300 0 0 -1 300
Loss on loans and guarantees 2 261 0 0 2 261
Result of ordinary activities 36 959 9 759 1 861 48 579
Balance sheet – subsidiaries
Assets:
Cash and claims on central banks 6 2 0 8
Claims on credit institutions 5 879 80 784 5 410 92 073
Gross loans to customers 2 423 151 0 0 2 423 151
Specified loss provisions -5 914 0 0 -5 914
Unspecified loss provisions -11 000 0 0 -11 000
Net loans to customers 2 406 237 0 0 2 406 237
Acquired assets 0 0 0 0
Securities 1 940 0 400 2 340
Fixed assets 1 240 4 049 5 708 10 997
Advance payments and accrued income 34 751 105 0 34 856
Total assets 2 450 053 84 940 11 518 2 546 511
Liabilities and equity:
Debt to credit institutions 575 336 0 0 575 336
Deposits from customers 1 251 820 0 0 1 251 820
Debt established on issue of securities 262 936 0 0 262 936
Accrued costs and income paid in advance 97 507 70 234 2 348 170 089
Allocation to commitments and costs 1 226 1 970 0 3 196
Subordinated loan capital 80 000 0 0 80 000
Total equity 181 228 12 736 9 170 203 134
Total liabilities and equity 2 450 053 84 940 11 518 2 546 511
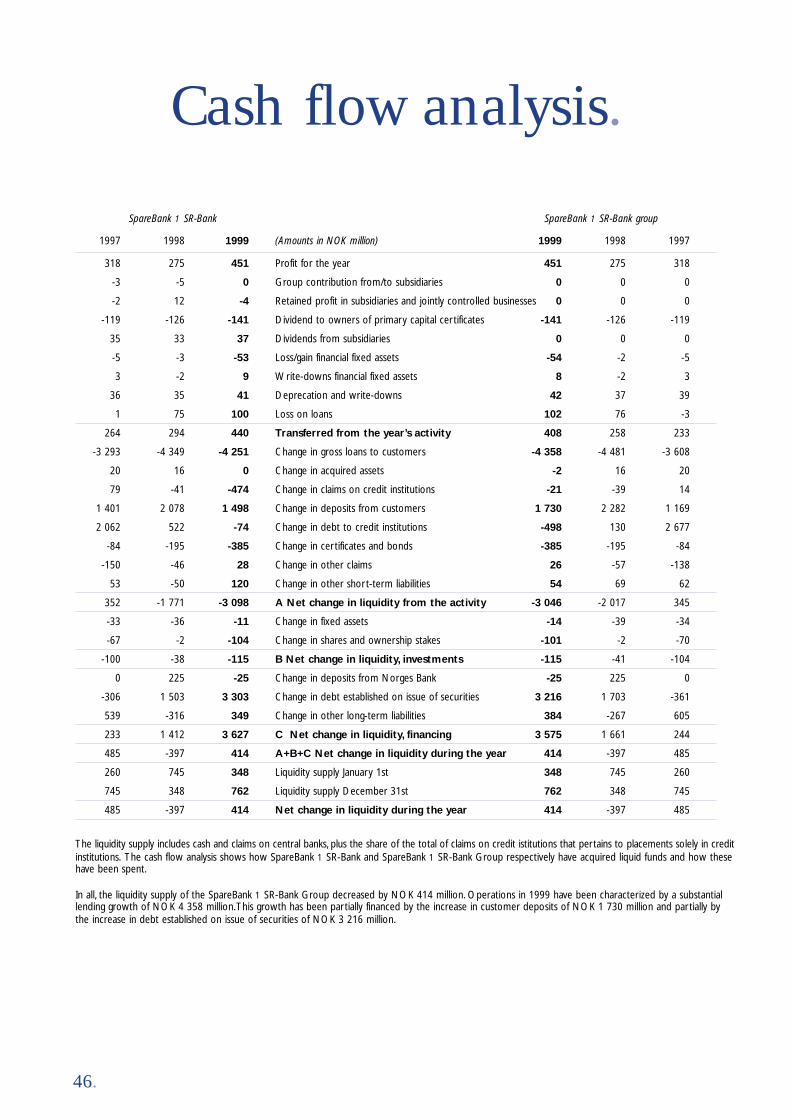
46.
Cash flow analysis.
1997 1998 1999 (Amounts in NOK million) 1999 1998 1997
SpareBank 1 SR-Bank SpareBank 1 SR-Bank group
318 275 451 Profit for the year 451 275 318
-3 -5 0 Group contribution from/to subsidiaries 0 0 0
-2 12 -4 Retained profit in subsidiaries and jointly controlled businesses 0 0 0
-119 -126 -141 Dividend to owners of primary capital certificates -141 -126 -119
35 33 37 Dividends from subsidiaries 0 0 0
-5 -3 -53 Loss/gain financial fixed assets -54 -2 -5
3 -2 9 Write-downs financial fixed assets 8 -2 3
36 35 41 Deprecation and write-downs 42 37 39
1 75 100 Loss on loans 102 76 -3
264 294 440 Transferred from the year’s activity 408 258 233
-3 293 -4 349 -4 251 Change in gross loans to customers -4 358 -4 481 -3 608
20 16 0 Change in acquired assets -2 16 20
79 -41 -474 Change in claims on credit institutions -21 -39 14
1 401 2 078 1 498 Change in deposits from customers 1 730 2 282 1 169
2 062 522 -74 Change in debt to credit institutions -498 130 2 677
-84 -195 -385 Change in certificates and bonds -385 -195 -84
-150 -46 28 Change in other claims 26 -57 -138
53 -50 120 Change in other short-term liabilities 54 69 62
352 -1 771 -3 098 A Net change in liquidity from the activity -3 046 -2 017 345
-33 -36 -11 Change in fixed assets -14 -39 -34
-67 -2 -104 Change in shares and ownership stakes -101 -2 -70
-100 -38 -115 B Net change in liquidity, investments -115 -41 -104
0 225 -25 Change in deposits from Norges Bank -25 225 0
-306 1 503 3 303 Change in debt established on issue of securities 3 216 1 703 -361
539 -316 349 Change in other long-term liabilities 384 -267 605
233 1 412 3 627 C Net change in liquidity, financing 3 575 1 661 244
485 -397 414 A+B+C Net change in liquidity during the year 414 -397 485
260 745 348 Liquidity supply January 1st 348 745 260
745 348 762 Liquidity supply December 31st 762 348 745
485 -397 414 Net change in liquidity during the year 414 -397 485
The liquidity supply includes cash and claims on central banks, plus the share of the total of claims on credit istitutions that pertains to placements solely in creditinstitutions. The cash flow analysis shows how SpareBank 1 SR-Bank and SpareBank 1 SR-Bank Group respectively have acquired liquid funds and how thesehave been spent.
In all, the liquidity supply of the SpareBank 1 SR-Bank Group decreased by NOK 414 million. Operations in 1999 have been characterized by a substantiallending growth of NOK 4 358 million.This growth has been partially financed by the increase in customer deposits of NOK 1 730 million and partially bythe increase in debt established on issue of securities of NOK 3 216 million.

47.
Auditors report for 1999.
To the Supervisory Board of Sparebanken RogalandWe have audited the annual financial statements ofSparebanken Rogaland as of 31 December 1999,showing a profit of NOK 451 millions for the parentcompany and a profit of NOK 451 millions for thegroup. We have also audited the information in theBoard of Directors' report concerning the financialstatements, the going concern assumption, and theproposal for the appropriation of the profit. Thefinancial statements comprise the balance sheet, thestatements of income and cash flows, the accompanyingnotes and the group accounts. These financial state-ments are the responsibility of the Company’s Boardof Directors and Managing Director. Our responsibilityis to express an opinion on these financial statementsand on other information according to the require-ments of the Norwegian Act on Auditing and Auditors.
We conducted our audit in accordance with the NorwegianAct on Auditing and Auditors and good auditing practice.Good auditing practice requires that we plan and per-form the audit to obtain reasonable assurance aboutwhether the financial statements are free of materialmisstatement. An audit includes examining, on a testbasis, evidence supporting the amounts and disclosures
in the financial statements. An audit also includesassessing the accounting principles used and significantestimates made by management, as well as evaluatingthe overall financial statement presentation. To theextent required by law and good auditing practice anaudit also comprises a review of the management ofthe Company's financial affairs and its accountingand internal control systems. We believe that ouraudit provides a reasonable basis for our opinion.
In our opinion• the financial statements have been prepared in
accordance with law and regulations and present thefinancial position of the Company and of the Groupas of 31 December 1999, and the results of itsoperations and its cash flows for the year thenended, in accordance with good accounting practice
• the Company's management has fulfilled its obliga-tion in respect of registration and documentation ofaccounting information as required by law andgood accounting practice
• the information in the Board of Directors' reportconcerning the financial statements, the going con-cern assumption, and the proposal for the appro-priation of the profit is consistent with the financialstatements and comply with law and regulations.
ARTHUR ANDERSEN & CO.
Finn KinserdalSTATE AUTHORISED PUBLIC ACCOUNTANT (NORWAY)
Stavanger, 24 February 2000
The audit committee has carried out its assignment in accordance with the Savings Banks Act and thecommittee’s instructions.
The bank’s activities in 1999 have complied with theSavings Banks Act, the bank’s articles of association andother rules that the bank is required to comply with.
The annual report and accounts have been submitted inaccordance with the provisions of the Savings Banks Actand the Banking Insurance and Securities Commission. Thesupervisory Board can approve the profit and loss accountand the balance sheet as the bank’s accounts for 1998.
Stavanger, 25 February 2000
Harald Ribland, formann
Odd W. Bøe Arnhild Skrunes
Odd Rune Torstrup Egil Bue
The audit committee’s report for 1999.
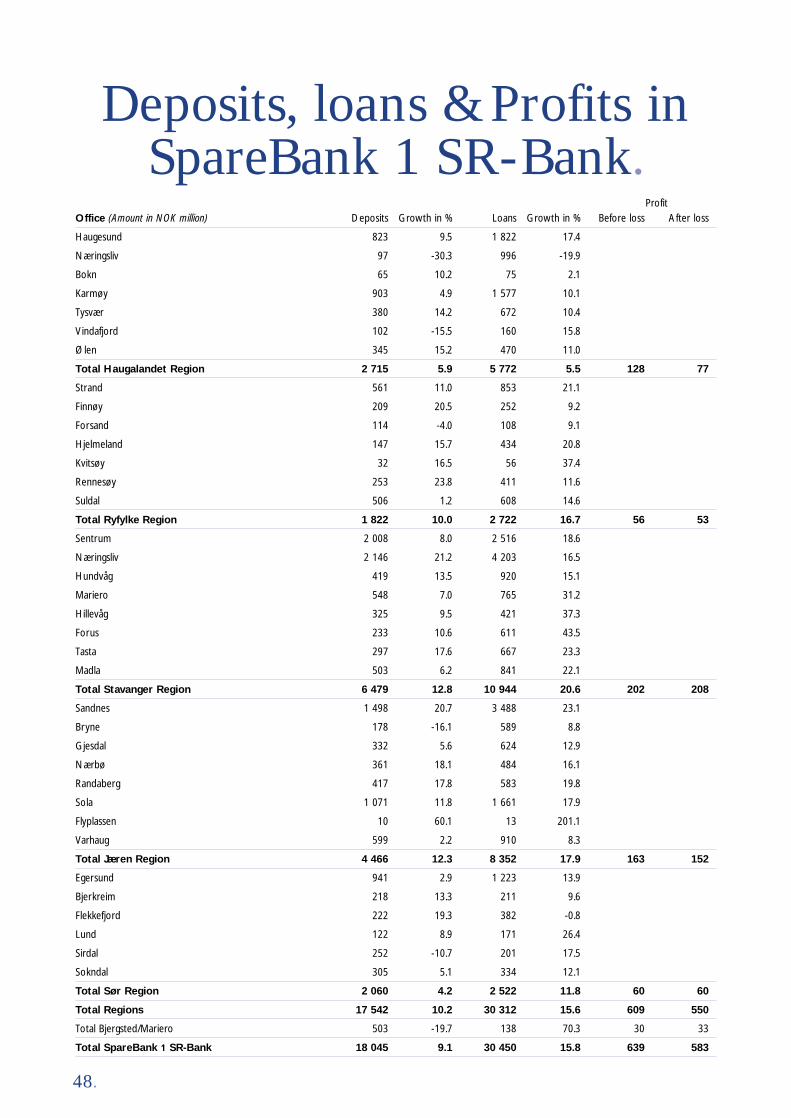
48.
Deposits, loans & Profits inSpareBank 1 SR-Bank.
Office (Amount in NOK million) Deposits Growth in % Loans Growth in % Before loss After lossProfit
Haugesund 823 9.5 1 822 17.4
Næringsliv 97 -30.3 996 -19.9
Bokn 65 10.2 75 2.1
Karmøy 903 4.9 1 577 10.1
Tysvær 380 14.2 672 10.4
Vindafjord 102 -15.5 160 15.8
Ølen 345 15.2 470 11.0
Total Haugalandet Region 2 715 5.9 5 772 5.5 128 77
Strand 561 11.0 853 21.1
Finnøy 209 20.5 252 9.2
Forsand 114 -4.0 108 9.1
Hjelmeland 147 15.7 434 20.8
Kvitsøy 32 16.5 56 37.4
Rennesøy 253 23.8 411 11.6
Suldal 506 1.2 608 14.6
Total Ryfylke Region 1 822 10.0 2 722 16.7 56 53
Sentrum 2 008 8.0 2 516 18.6
Næringsliv 2 146 21.2 4 203 16.5
Hundvåg 419 13.5 920 15.1
Mariero 548 7.0 765 31.2
Hillevåg 325 9.5 421 37.3
Forus 233 10.6 611 43.5
Tasta 297 17.6 667 23.3
Madla 503 6.2 841 22.1
Total Stavanger Region 6 479 12.8 10 944 20.6 202 208
Sandnes 1 498 20.7 3 488 23.1
Bryne 178 -16.1 589 8.8
Gjesdal 332 5.6 624 12.9
Nærbø 361 18.1 484 16.1
Randaberg 417 17.8 583 19.8
Sola 1 071 11.8 1 661 17.9
Flyplassen 10 60.1 13 201.1
Varhaug 599 2.2 910 8.3
Total Jæren Region 4 466 12.3 8 352 17.9 163 152
Egersund 941 2.9 1 223 13.9
Bjerkreim 218 13.3 211 9.6
Flekkefjord 222 19.3 382 -0.8
Lund 122 8.9 171 26.4
Sirdal 252 -10.7 201 17.5
Sokndal 305 5.1 334 12.1
Total Sør Region 2 060 4.2 2 522 11.8 60 60
Total Regions 17 542 10.2 30 312 15.6 609 550
Total Bjergsted/Mariero 503 -19.7 138 70.3 30 33
Total SpareBank 1 SR-Bank 18 045 9.1 30 450 15.8 639 583
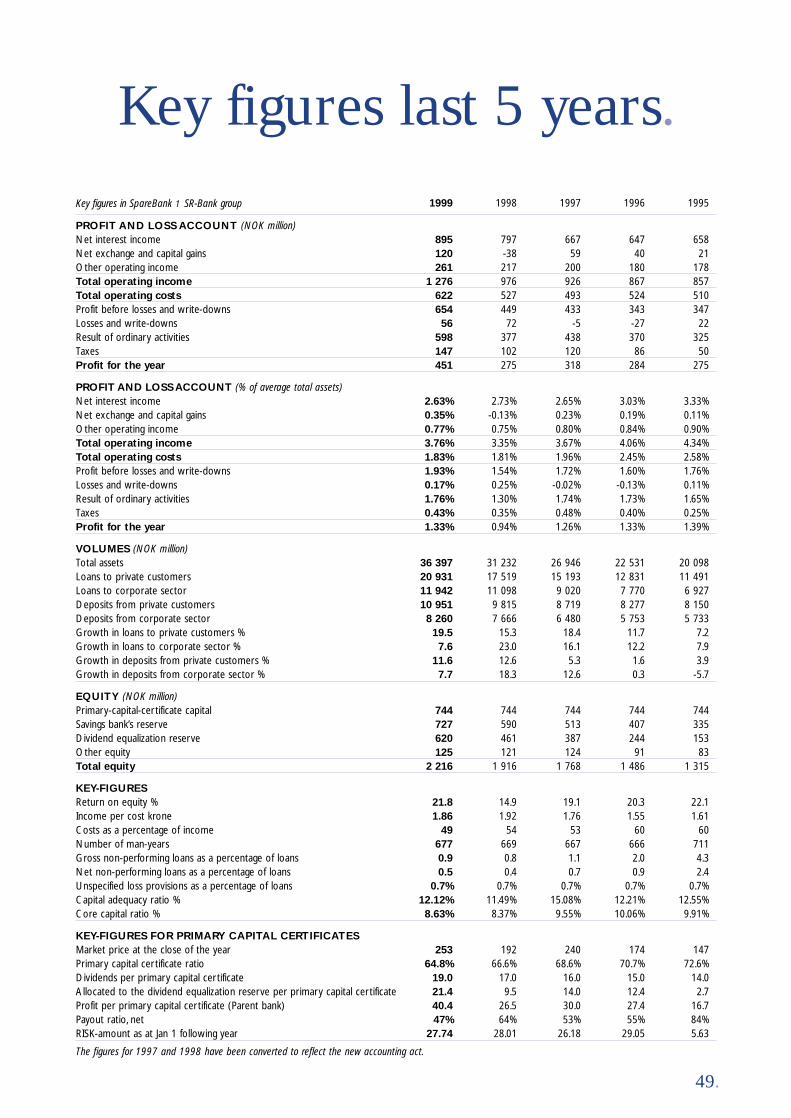
49.
Key figures last 5 years.1999 1998 1997 1996 1995Key figures in SpareBank 1 SR-Bank group
PROFIT AND LOSS ACCOUNT (NOK million)Net interest income 895 797 667 647 658Net exchange and capital gains 120 -38 59 40 21Other operating income 261 217 200 180 178Total operating income 1 276 976 926 867 857Total operating costs 622 527 493 524 510Profit before losses and write-downs 654 449 433 343 347Losses and write-downs 56 72 -5 -27 22Result of ordinary activities 598 377 438 370 325Taxes 147 102 120 86 50Profit for the year 451 275 318 284 275
PROFIT AND LOSS ACCOUNT (% of average total assets)Net interest income 2.63% 2.73% 2.65% 3.03% 3.33%Net exchange and capital gains 0.35% -0.13% 0.23% 0.19% 0.11%Other operating income 0.77% 0.75% 0.80% 0.84% 0.90%Total operating income 3.76% 3.35% 3.67% 4.06% 4.34%Total operating costs 1.83% 1.81% 1.96% 2.45% 2.58%Profit before losses and write-downs 1.93% 1.54% 1.72% 1.60% 1.76%Losses and write-downs 0.17% 0.25% -0.02% -0.13% 0.11%Result of ordinary activities 1.76% 1.30% 1.74% 1.73% 1.65%Taxes 0.43% 0.35% 0.48% 0.40% 0.25%Profit for the year 1.33% 0.94% 1.26% 1.33% 1.39%
VOLUMES (NOK million)Total assets 36 397 31 232 26 946 22 531 20 098Loans to private customers 20 931 17 519 15 193 12 831 11 491Loans to corporate sector 11 942 11 098 9 020 7 770 6 927Deposits from private customers 10 951 9 815 8 719 8 277 8 150Deposits from corporate sector 8 260 7 666 6 480 5 753 5 733Growth in loans to private customers % 19.5 15.3 18.4 11.7 7.2Growth in loans to corporate sector % 7.6 23.0 16.1 12.2 7.9Growth in deposits from private customers % 11.6 12.6 5.3 1.6 3.9Growth in deposits from corporate sector % 7.7 18.3 12.6 0.3 -5.7
EQUITY (NOK million)Primary-capital-certificate capital 744 744 744 744 744Savings bank’s reserve 727 590 513 407 335Dividend equalization reserve 620 461 387 244 153Other equity 125 121 124 91 83Total equity 2 216 1 916 1 768 1 486 1 315
KEY-FIGURESReturn on equity % 21.8 14.9 19.1 20.3 22.1Income per cost krone 1.86 1.92 1.76 1.55 1.61Costs as a percentage of income 49 54 53 60 60Number of man-years 677 669 667 666 711Gross non-performing loans as a percentage of loans 0.9 0.8 1.1 2.0 4.3Net non-performing loans as a percentage of loans 0.5 0.4 0.7 0.9 2.4Unspecified loss provisions as a percentage of loans 0.7% 0.7% 0.7% 0.7% 0.7%Capital adequacy ratio % 12.12% 11.49% 15.08% 12.21% 12.55%Core capital ratio % 8.63% 8.37% 9.55% 10.06% 9.91%
KEY-FIGURES FOR PRIMARY CAPITAL CERTIFICATESMarket price at the close of the year 253 192 240 174 147Primary capital certificate ratio 64.8% 66.6% 68.6% 70.7% 72.6%Dividends per primary capital certificate 19.0 17.0 16.0 15.0 14.0Allocated to the dividend equalization reserve per primary capital certificate 21.4 9.5 14.0 12.4 2.7Profit per primary capital certificate (Parent bank) 40.4 26.5 30.0 27.4 16.7Payout ratio, net 47% 64% 53% 55% 84%RISK-amount as at Jan 1 following year 27.74 28.01 26.18 29.05 5.63
The figures for 1997 and 1998 have been converted to reflect the new accounting act.
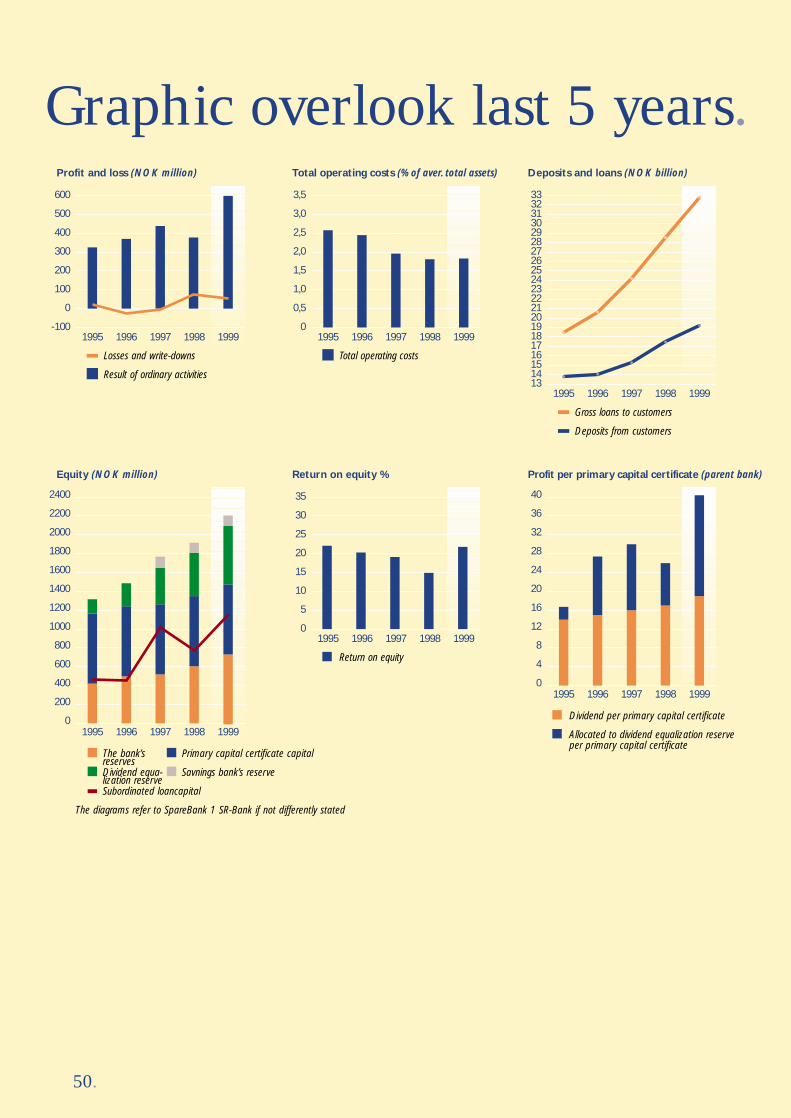
50.
Graphic overlook last 5 years.
40
36
32
28
24
20
16
12
8
4
0
Dividend per primary capital certificate
Allocated to dividend equalization reserve per primary capital certificate
1995 1996 1997 1998
Profit per primary capital certificate (parent bank)
1999
600
500
400
300
200
100
0
-100
Result of ordinary activities
Profit and loss (NOK million)
1995 1996 1997 1998 1999
Losses and write-downs
35
30
25
20
15
10
5
0
Return on equity
Return on equity %
1995 1996 1997 1998 1999
3,5
3,0
2,5
2,0
1,5
1,0
0,5
0
Total operating costs
Total operating costs (% of aver. total assets)
1995 1996 1997 1998 1999
Deposits and loans (NOK billion)
Gross loans to customers
Deposits from customers
2400
2200
2000
1800
1600
1400
1200
1000
800
600
400
200
0
Equity (NOK million)
333231302928272625242322212019181716151413
1995 1996 1997 1998 1999
The bank’s reserves
Primary capital certificate capital
Savnings bank’s reserveDividend equa-lization reserve
The diagrams refer to SpareBank 1 SR-Bank if not differently stated
1995 1996 1997 1998 1999
Subordinated loancapital

Primary capitalAt the end of 1999, SpareBank 1 SR-Bank's primary capital was NOK 744 million divided among7,440,000 primary capital certificates with a nominalvalue of NOK 100 each. The number of primary capital certificate owners was 5,901 as of 31December 1999, an increase of 203 compared with the same date last year.
Investor policyThe financial objective of SpareBank 1 SR-Bank'soperations is to achieve profits that yield a good andstabile return on the bank's total equity capital.
SpareBank 1 SR-Bank's aim is to divide the profitbetween the primary capital certificate owners andthe savings banks' reserve in proportion to theirrespective shares of the bank's equity capital.
SpareBank 1 SR-Bank will emphasis the importanceof a competitive cash dividend. In the proportionaldistribution between cash dividend and the dividendequalization reserve, variations may arise when con-sideration of the bank's equity capital developmentmust be given priority.
The primary capital certificate owners will be awardedNOK 40.40 per primary capital certificate in theyear-end appropriations. Of this amount, NOK 19 iscash dividend and NOK 21.40 is an allocation to theequalization fund. For the primary capital certificateowners this amounts to 66.6% of the bank's annualprofits of NOK 451 million. For the 2000 year-endappropriations the share will be 64.8%.
The bank places substantial emphasis on its information activities vis-à-vis the investor market.Presentations are held each quarter in Stavanger andOslo, as well as in the regions in Rogaland. Regularpresentations are held for foreign owners, mainly inLondon.
SpareBank 1 SR-Bank also makes information available via the Internet, covering investors, the broker business and the press.
Internet addresseswww.sr-bank.noSpareBank 1 SR-Bank's web sitewww.huginonline.no Hugin Online, financial information
OwnershipSpareBank 1 SR-Bank aims to achieve good liquidityin its primary capital certificates in addition to adiversification of the primary capital certificatesamong owners who represent the customer base,regional investors, as well as Norwegian and foreigninstitutions. The number of owners has increased by203 to 5,901 in 1999. The percentage of primarycapital certificates owned by investors in Rogalandnow amounts to 44% compared with 46% in 1998.Other Norwegian investors amount to 46% comparedwith 52% in 1998 and the percentage of foreign owners increased from 2% to 10% as of 31December 1999.
The liquidity of the primary capital certificates has been lower in 1999 than the year before, giventhat 39% of the outstanding certificates were sold on the Oslo Stock Exchange as compared with 48%last year.
he market price of the primary capital certificateswas NOK 253 at the end of the year compared withNOK 192 at the beginning of the year. The marketvalue of SpareBank 1 SR-Bank was NOK 1,9 billionas of 31 December 1999, and it is thus the fifthlargest bank on the Oslo Stock Exchange.
In order to avoid double taxation of the bank and theowners, the tax-related original value for Norwegianowners is adjusted every year. This is done in accor-dance with the RISK rules (adjustment of originalvalue with taxed capital). The RISK amount for 1999has been calculated at NOK 28 compared with NOK27.74 for 1998.
51.
Primary capital certificates
Financial calendar for 2000
1 quarter 28 April 2000
2 quarter 20 August 2000
3 quarter 28 October 2000

52.
260
250
240
230
220
210
200
190
180
170
1500
1250
1000
750
500
250
0
1999
Turnover of the bank’s primary capital certificates
1. Q 2. Q 3. Q 4. Q
1998
Market price trend in 1999
Jan31.12.98 Feb Mar Apr May Jun Jul Aug Sep Oct Nov Dec
KEY FIGURES 1999 1998
Market price at the close of the year 253 192
Dividend per primary capital certificate 19 17
Direct return (1) 7.5 % 8.9 %
Effective return (2) 41% -13%
Book equity per certificate – Group (3) 193 172
Earnings per certificate – Group (4) 40,4 26,5
Profit ratio per certificate – Parent bank (5) 60,6 37
Utdelingsforhold, netto (6) 47% 64%
Payout ratio, gross (7) 31% 46%
Primary certificate percentage (8) 64.8% 66.6%
(1) Dividend as a percentage of the market price at the close of the year(2) Market price rise for the whole year plus the paid out dividend as a percentage of the market price at the
begining of the year(3) The primary capital certificates’ percentage of the groups equity capital per certificate(4) The cash dividend + allocated to the equalization fund per certificate(5) The parents bank’s result after tax divided by number of certificate(6) The dividend per certificate as a percentage of the earnings per certificate(7) The dividend per certificate as a percentage of the profit ratio per certificate(8) The primary capital and the dividend equalization fund as a percentage of the parent bank’s equity
capital at the close of the year

THE SUPERVISORY BOARDChairman: Manager Ivar Kolnes, Stavanger ............................... (17 100)Vice-chairman: Mayor Randulf Skretting, Sokndal .................... (1 760)
ELECTED BY THE PRIMARY CAPITAL CERTIFICATE OWNERSBjarne Anderson, Oslo, ................................................................. (366 600)Printer Jan S. Aske, Stavanger .......................................................... (2 000)Marit Borgen, Stavanger ......................................................................... (600)Eivinn A. Enoksen, Stavanger ............................................................ (3 070)Manager Thor Arne Eng, Skudeneshavn .................................... (4 500)Alf Erevik, Hønefoss, (vararepr.) .................................................. (50 770)Ole Gabrielsen, Sandnes ........................................................................ (500)Marta Gudmestad, Stavanger .......................................................... (4 350)Manager Gunnar Hagen, Stavanger .............................................. (9 000)Managing Director Harald V. Hanssen, Stavanger ...................... (1 400)Managing Director Finn Haugan,Trondheim ............................ (91 729)Managing Director Per Hedberg, Stavanger .............................. (15 133)Anne Elise Hystad ................................................................................. (3 700)Erik Sture Larre, Oslo ....................................................................... (16 500)Birte Næsheim, Stavanger ................................................................. (3 600)Director Kåre Johan Osen, Bergen, ............................................. (13 600)Dep. Man. Dir. Harald Sig. Pedersen, Stavanger ................... (38 300)Bjarne Risa, Nærbø ............................................................................... (2 750) Einar Risa, Stavanger .......................................................................... (10 000)Managing Director Bjørn M. Stangeland, Sandnes .................... (2 450)Trygve Stangeland, Sola ................................................................... (36 700)Managing Director Jan Olav Steensland, Oslo ...................... (219 300)Arnstein Sunde, Jørpeland Ove Tveteraas, Stavanger ............................................................. (194 000)Martin Ølberg, Stavanger .................................................................. (1 400)
ELECTED BY THE DEPOSITORS:Engineer Sjur Bjørgo, SandnesOffice Manager Odd Broshaug, KarmøyController Egil Bue, SolaFarmer Berge Bustad,TysværManaging Director Rolf Ersdal, Strand ................................................ (600)Electrician Trygve Haraldseid,VatsOffice Clerck Lindy Haram, BoknController Dagfinn E. Helland, SuldalInsurer Odd Hovland, Egersund ...................................................... (4 750)Managing Director Helge Larsen, HaugesundSvein G. Larsen, FlekkefjordFarmer Sigmund Lindeland, Sirdal ...................................................... (900)Manager Johan Livastøl, HjelmelandFinn Nesvold, SokndalArne Otto, BrynePlatform Manager Bjarne Pedersen, Kvitsøy ............................... (1 000)Marketing Consultant Jørgen Risdal, HåSocial Security Officer Oddlaug Rødne, ØlenFarmer Sigmund Skjæveland, Bjerkreim Gunvald Surdal, Lund ............................................................................... (880)Educational officer Ingeborg Søyland, ForsandArild Sørheim, RennesøyKari Thu, Stavanger .................................................................................... (150)Gardener Helge Todnem, Randaberg ................................................ (100)Torgeir Undheim, GjesdalAccountant Karin Vik, Finnøy .................................................................. (200)
APPOINTED BY THE MUNICIPALITIESHeadmaster Arne Borgemyr, ØlenChief Dentist Asbjørn Dalsmo, SirdalPeder Eikeland, BjerkreimCo-ordinator Kjell H. Fredriksen, EgersundGardener Karl Johan Eie, Strand .......................................................... (392)Controller Magne Grøtteland, FlekkefjordEli Hellestø, SolaManager Svein Hodnefjell, Rennesøy
Farmer Kjell Hognestad, BrynePensioner Øystein Hognestad, LundArne Hosaas, BoknErling Haaland, KvitsøyElisabeth Sjo Jespersen, StavangerMagnhild Harbo Kleppe, HjelmelandDagny Matland, Avaldsnes ..................................................................... (900)Mayor Fridtjov Thorsen Norland, ForsandOttar Sandanger, Finnøy ............................................................................ (20)Team-leader Einar Simonsen, RandabergDentist Audun Skage, HaugesundFarmer Svein Skare,Vats ..................................................................... (1 000)Tormod Skeie, Suldal ........................................................................... (3 929)Berit Skjæveland, SandnesFarmer Arnhild Skrunes,Tysvær ...................................................... (2 000)Machinist Kåre Todnem, GjesdalOdd Øverby, Hå
ELECTED BY THE EMPLOYEESMarit Ask, Karmøy ..................................................................................... (100)Bertha Auestad, Bjerkreim .................................................................... (200)Rigmor Bø Austrått,VarhaugGyrid Bakka, Suldal ....................................................................................... (50)Bjørn Berland, StavangerLeif Bø, SandnesBørge Espeland, Sola ................................................................................ (209)Grete Frøyland, NærbøGeir Gundersen, StavangerHugo Hansen, Stavanger ........................................................................... (50)Margot O. Kristoffersen, Stavanger ................................................... (400)John Lervik, HaugesundKristin Gundersen Lund, StavangerGeir Olav Måland, StavangerJan M. Nilsen, StavangerKjell Rek, SokndalMette Skaugerud, StavangerBerly Sleire, Stavanger ................................................................................ (36)Arne Steinbru, Suldal ............................................................................... (117)Margareth Helle Storesund, Karmøy ............................................... (100)Eirik Thorsen, StavangerErling Trædal, ØlenTorodd Varhaug,VarhaugHelga Vinje, Egersund ............................................................................... (200)Eli Lunde Wells, Stavanger Birte Wereide, Stavanger .......................................................................... (30)
THE BOARD OF DIRECTORSManager Geir Worum, chairmanAdvokat Tor Haver, vice-chairmanFarmer Dominikus N. Bjordal ............................................................... (200)Shipowner Kristian Eidesvik ............................................................... (1 000)Managing Director Magne VathneBusiness Manager Åse Holmane ...................................................... (1 000)Chief Financial Officer Ole Gladhaug ................................................... (200)Managing Director Terje Vareberg .................................................. (3 088)Main Employee Representative Karl A. NaleyDept. Employee Representative Torstein Plener (regularly attending deputy board member for the employees)
AUDIT COMITTÉELocal Tax Officer Harald Ribland, chairmanController Egil BueLocal Tax Officer Odd W. BøeAttorney at Law Odd R.TorstrupFarmer Arnhild Skrunes
AUDITORArthur Andersen & Co. by Finn Kinserdal, State Authorised Public Accountant
Representatives.
(The numbers indicate how manyprimary capital certificates theperson in question owned inSparebanken Rogaland as per 31December 1999. Also included areprimary capital certificates belong-ing to the nearest kin and well-known companies in which theperson in question has decisiveinfluence, cf. the Companies Act’s § 1-2. Primary capital certificatesbelonging to the institution thatthe employee representative inquestion was chosen on behalf of are also included.)
53.

54.
Organisational chart.AUDITOR BOARD OF DIRECTORS
BOARD OF DIRECTORS
MANAGING DIRECTORTerje Vareberg
CORPORATE Group/StavangerTor Dahle
COMPANY SECRETARYRolf Simonsen
DEVELOPMENTHåkon Sivertsen
PROJECTSAud Inger Haugland
SERVICE CENTRE
PROCESSES
IT DIVISIONPetter Linaae
FD 2001Christina Lund
ANALYSIS
ACTIVE MANAGEMENTDag Sønsterud
BACK OFFICEHugo Hansen
COMMITMENTSHenry Bjørkelund
ACCOUNTINGKari H.Tollefsen
FOREIGN EXCHANGEPer Skibeli
CORPORATE Group Tore Medhus
CORPORATE StavangerRasmus Kvassheim/Kåre Idsøe
CORPORATE Special serviceKurt Helland
PERSONELL DIVISIONRolf Simonsen
PRIVATE MARKET/INFORMATIONBjørnar Jacobsen/Frode Midttun
CONTROLLERTorbjørn Vasstveit
PAYMENT SERVICESJan Friestad
VÅR B&FHans Petter Dyrseth
EiendomsMegler 1 Rogaland AS(100%)
Westbroker Finans AS(100%)
Garde ASA(25%)
SpareBank 1 Group AS(15%)
AUDIT COMMITTEE
FINANCESveinung Hestnes
DEPUTY MANAGING DIRECTORGunnar Dolven
EGERSUNDDag Sørensen
SOKNDALHenning Stålesen
BJERKREIMArne Geir Larsen
LUNDWenche Netland
FLEKKEFJORDTerje Johnsen
SIRDALRoger Abusland
SANDNES Lars Enevoldsen
GJESDAL Øyvind Sjøtrø
VARHAUG Mindor Jelsa
BRYNE Torvald Søiland
SOLA Bjørg Haarr
NÆRBØ Elin Garborg
RANDABERG Arild L. Johannessen
SENTRUM Lars Magne Markhus
FORUS Grete Eide
MARIERO Stig Bjørheim
MADLA Rune Bertelsen
TASTA Haakon Færaas
HUNDVÅG Geir Gundersen
STRAND Olav Strand
FORSAND Bendik Voll
KVITSØY Astrid Throndsen
RENNESØY Brit Jane Tolaas
FINNØY Reimund Flesjå
HJELMELAND Njål Skår
SULDAL Torfrid Baustad
HAUGALAND CORPORATEØyvind Rønnevik
HAUGESUND PMHalvor Urrang
KARMØY Anders Rundhaug
TYSVÆR Svein Hauge
BOKN Olav Lande Rossebø
VINDAFJORD Arne Gjerde
ØLEN Magne Kr. Haugland
REGION STAVANGER PMRolf Aarsheim
REGION RYFYLKEGunnar Fatland
REGION HAUGALANDBjarne Askevold
REGION JÆRENLars Enevoldsen
REGION SØRKnut Sirevåg
HILLEVÅG Kjetil Øygarden
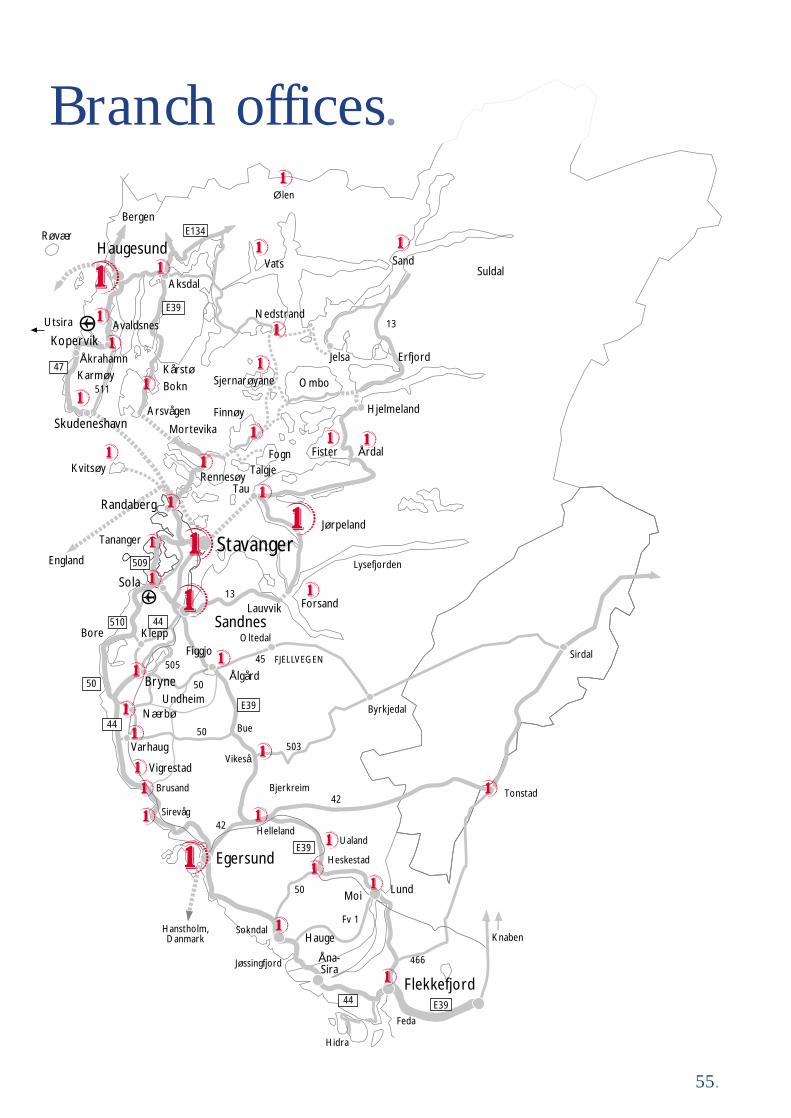
Arsvågen
Mortevika
Jørpeland
Aksdal
13
Tananger
50545
50
HellelandUaland
50
Heskestad
466
Moi
Feda
Hidra
Sokndal
Sirevåg
Brusand
Kvitsøy
Utsira
42
Jøssingfjord
Bokn
Bore
England
Talgje
Hanstholm,Danmark
42
Ombo
Fv 1
Røvær
47
509
44
510
E39
50
E134
E39
E39
E39
Åna- Sira
Nedstrand13
Kårstø
AvaldsnesKopervik
Karmøy511
Rennesøy
Fogn
SkudeneshavnFinnøy
Sjernarøyane
Stavanger
Åkrahamn
Haugesund
Sola
Tau
Årdal
Egersund
Byrkjedal
503Vikeså
50 Bue
FJELLVEGEN
Lauvvik
Oltedal
Forsand
Ålgård
Tonstad
Hauge
Flekkefjord
Knaben
Sandnes
Jelsa
Randaberg
Bryne
Bergen
Klepp
Undheim
Varhaug
Vigrestad
Nærbø
Sirdal
Lysefjorden
Bjerkreim
Fister
Ølen
Figgjo
Lund
Vats SandSuldal
Hjelmeland
Erfjord
44
44
55.
Branch offices.

56.
Addresses.SpareBank 1 SR-Bank GroupMAIN SWITHCBOARD+47 51 50 90 00
MAIN OFFICE:Bjergsted Terrasse 1P.O. box 218, 4001 StavangerTelefax +47 51 53 18 64Telex 33 016 SRBK NE-mail: [email protected] address: www.sr-bank.no
Management:Managing Director Terje VarebergDept. Managing Dir. Gunnar DolvenCompany Secretary Rolf Simonsen
Projects:Director Aud Inger HauglandService Centre:Langflåtveien 5, 4017 Stavanger
Development:Chief Information Officer :Håkon SivertsenIT-DIVISION: Petter LinaaeFD-2001: General Manager Christina Lund
Finance:Financial Director Sveinung HestnesAnalysis:Active Management:General Manager Dag SønsterudBack Office: Hugo HansenCommitments: Henry BjørkelundForeign exchange department:Chief Dealer : Per SkibeliAccounting: Kari Tollefsen
Controller:General Manager Torbjørn Vasstveit
Corporate Group/Stavanger:Regional General Manager Tor DahleCorporate Group General Manager Tore MedhusCorporate Stavanger :Kåre Idsøe/Rasmus KvassheimCorporate Special Service:General Manager Kurt Helland
Personell:General Manager Rolf SimonsenMarket PM:Marketing Manager Bjørnar JacobsenInformation:Public Relations Mngr. Frode Midttun
REGION HAUGALANDETRegional Gen. Mngr. Bjarne Askevold
HAUGESUNDTelefax +47 52 71 24 91Sørhauggata 150, P.O. box 4735501 HaugesundGeneral Manager Halvor UrrangCorporate market: General Manager Øyvind RønnevikBranch: Norheim/Oasen
BOKN5561 BoknBranch Manager Olav Lande Rossebø
KARMØYP.O. box 68, 4291 KopervikGeneral Manager Anders RundhaugBrancher: Avaldsnes - Skudeneshavn
TYSVÆRP.O. box 44,5570 GrindafjordGeneral Manager Svein HaugeBranch: Nedstrand
VINDAFJORD5576 Øvre VatsGeneral Manager Arne Gjerde
ØLENP.O. box 33, 5580 ØlenGeneral Manager Magne Kr. Haugland
REGION SØRRegional Gen. Mngr. Knut Sirevåg
EGERSUNDTelefax +47 51 49 29 97P.O. box 190, 4371 EgersundGeneral Manager Dag SørensenCorporate market:General Manager Per Ingve LeidlandBranches: Helleland - Heskestad -Ualand
BJERKREIMP.O. box 10, 4389 VikesåGeneral Manager Arne Geir Larsen
FLEKKEFJORDP.O. box 98, 4401 FlekkefjordGeneral Manager Terje Johnsen
LUNDP.O. box 94, 4460 MoiGeneral Manager Wenche NetlandBranch: Hovsherad
SIRDALP.O. box 25, 4440 TonstadGeneral Manager Roger Abusland
SOKNDALP.O. box 10, 4380 Hauge i DalaneGeneral Manager Henning Stålesen
REGION STAVANGERPrivate market:Regional Gen. Mngr. Rolf Aarsheim
SENTRUMTelefax +47 51 89 50 60Domkirkeplassen 1, P.O. box 2184001 StavangerGeneral Manager Lars Magne MarkhusBranches: Stokka - Østre bydel
FORUSPetroleumsvn. 6, 4033 ForusGeneral Manager Grete Eide
HUNDVÅGP.O. box 26, 4085 HundvågGeneral Manager Geir Gundersen
MADLAP.O. box 525, 4040 HafrsfjordGeneral Manager Rune Bertelsen
TASTAP.O. box 4052, 4004 StavangerGeneral Manager Håkon Færaas
MARIEROBreidablikkvn. 3a, 4017 StavangerGeneral Manager Stig BjørheimBranch: Hinna
HILLEVÅGKilden, Gartnerveien 164016 StavangerGeneral Manager Kjetil Øygarden
REGION RYFYLKERegional Gen. Mngr. Gunnar Fatland
STRANDTelefax +47 51 74 91 60P.O. box 8, 4100 JørpelandGeneral Manager Olav StrandCorporate market: General managerBørge OanesBranch:Tau
FINNØYP.O. box 25, 4160 JudabergGeneral Manager Reimund FlesjåBranch: Sjernarøy
FORSAND4110 ForsandGeneral Manager Bendik Voll
HJELMELANDP.O. box 55, 4137 Årdal i RyfylkeGeneral Manager Njål SkårBranch: Fister
SULDAL4230 SANDGeneral Manager Torfrid Baustad
RENNESØYP.O. Box 10, 4150 RennesøyGeneral Manager Brit Jane Tolaas
KVITSØY4090 KvitsøyGeneral Manager Astrid H.Throndsen
REGION JÆRENRegional Gen. Mngr. Lars Enevoldsen
SANDNESTelefax +47 51 62 52 25P.O. box 33, 4301 SandnesRegional Gen. Mngr: Lars EnevoldsenCorporate market:General Manager Carina Mossin SanneBranches: Ganddal - Kvadrat - Langgata
RANDABERGP.O. box 90, 4070 RandabergGeneral Manager Arild L. Johannesen
BRYNEP.O. box 413, 4341 BryneGeneral Manager Torvald Søiland
GJESDALP.O. box 55, 4330 ÅlgårdGeneral Manager Øyvind SjøtrøBranch: Gilja
NÆRBØP.O. box 205, 4350 NærbøGeneral Manager Elin Garborg
SOLAP.O. box 39, 4051 SolaGeneral Manager Bjørg HaarrCorporate market:Ass. General Manager Heinz GoldhahnBranch:Tananger
VARHAUGP.O. box 94, 4460 VarhaugGeneral Manager Mindor JelsaCorporate market: Lars VarhaugBrancher: Brusand - Sirevåg - Vigrestad
SUBSIDIARIESEiendomsMegler 1 Rogaland ASTelephone +47 51 50 90 00Telefax +47 51 89 50 44Domkirkeplassen 2P.O. box 167, 4001 StavangerManaging Director Johannes Vold Branches:Madla - Mariero - Sandnes - Kvadrat - Sola - Jæren - Egersund - Hau-gesund
WESTBROKER FINANS A/STelephone +47 51 50 92 00Telefax +47 51 50 92 01Bjergsted Terrasse 1, P.O. box 598,4001 StavangerManaging Director Arne Gravdal
PARTIALLY-OWNED COMPANIES GARDE A/STelephone +47 51 83 63 00Telefax +47 51 83 63 51Haakon VII'sgt. 8, P.O. box 163,N-4001 StavangerManaging Director Tor Egil Aanestad

Ann
ual
Rep
ort
1999
.

«SpareBank 1 SR-Bank shall be regarded
by the customer as the recommended
and leading bank within it’s market.»
Vision.

Idea and layout: Printers • Photo: Tom Haga • Print: Bryne Offset