sp fire research as -...
TRANSCRIPT

Droplet sizes from deluge nozzles
Are Opstad Sæbø, Ragnar Wighus
SPFR Report A15 107453:1
SP
Fire
Res
earc
h A
S

Droplet sizes from deluge nozzles
VERSION 1
DATE 2015-04-08
KEYWORDS:
Fire Extinguishing Droplet size Nozzle
AUTHOR(S) Are Opstad Sæbø Ragnar Wighus
CLIENT(S) StatoilHydro AS
CLIENT’S REF. Laila K. Rødsætre
PROJECT NO. 107453
NUMBER OF PAGES/APPENDICES: 33 + 2 Appendices
ABSTRACT
This report replaces report NBL F09117 of 2009-06-22. The only difference is that the current report is unrestricted.
PREPARED BY Ragnar Wighus
SIGNATURE
CHECKED BY Jan P. Stensaas
SIGNATURE
APPROVED BY Are W. Brandt
SIGNATURE
REPORT NO. A15 107453:1
ISBN
CLASSIFICATION Unrestricted
CLASSIFICATION THIS PAGE Unrestricted


2
TABLE OF CONTENTS 1 SUMMARY ..........................................................................................................................................................3
2 INTRODUCTION................................................................................................................................................3
3 TEST METHODS ................................................................................................................................................4 3.1 PHASE DOPPLER ANEMOMETRY (PDA) ........................................................................................................4 3.2 IMAGING TECHNIQUE ....................................................................................................................................5 3.3 DROPLET SIZE CALCULATIONS AND TERMINOLOGY.......................................................................................6
4 EXPERIMENTAL SET UP ................................................................................................................................6 4.1 THE NOZZLES AND TEST SETUP IN GENERAL ..................................................................................................6 4.2 TEST SET UP FOR THE PHOTOGRAPHIC TECHNIQUE USED AT TAG IN ENGLAND...........................................10 4.3 TEST SET UP FOR THE PDA MEASUREMENTS AT IDF IN GERMANY ..............................................................11
5 RESULTS ...........................................................................................................................................................12 5.1 HVK44 .......................................................................................................................................................12
5.1.1 Results from the photographic technique...............................................................................................12 5.1.2 Results from the PDA-technique ............................................................................................................17
5.2 MVK41.......................................................................................................................................................23 5.2.1 Results from the photographic technique...............................................................................................23 5.2.2 Results from the PDA technique ............................................................................................................25
6 DISCUSSION .....................................................................................................................................................29
7 CONCLUSIONS ................................................................................................................................................31
REFERENCES ............................................................................................................................................................32
A FLOW MEASUREMENTS CONDUCTED BEFORE THE PHOTOGRAPHIC MEASUREMENTS AT TAG IN ENGLAND ....................................................................................................................................................33
B THE EFFECT OF DIFFERENT LIMITS ON THE SPHERICITY FACTOR...........................................34

3
1 Summary The droplet size distributions from one high velocity nozzle (HVK44) and one medium velocity nozzle (MVK41) have been investigated by two different measurement techniques. Those are Phase Doppler Anemometry (PDA) and a photographic technique developed by Oxford Lasers. The project was initiated because earlier measurements using the PDA technique resulted in suspiciously small droplets. The present work indicates that this was partly because of the non-optimum optics that were chosen at that time. In this project the best optics available were chosen, resulting in measuring larger droplets than in the previous work. However, the PDA-method still seem to give too small droplets due to a too small measurable droplet size region. The imaging technique is capable to measure larger droplets than the PDA-technique (using the optics applied in this project), and hence it gives larger VMDs (Volume Median Diameters) in sprays where larger droplets than 1200 mμ are present. In the spray from the HVK44 nozzle, the largest droplet measured with the imaging technique was about 3700 mμ . The same technique gave VMDs from 600 to 1300 mμ , while the PDA-technique gave VMDs from 550 to 750 mμ at different locations in the spray pattern. In the spray from the MVK41-nozzle, the largest droplet measured with the imaging technique was about 1600 mμ . The same technique gave VMDs from about 200 – 800 mμ with most of the VMDs between 300 and 600 mμ . The PDA-technique gave VMDs from about 400 to 770 mμ at different locations in the MVK41 spray pattern. When the large droplets were not present, the VMDs from the two different techniques were more similar. For further conclusions, see chapter 7.
2 Introduction The droplet size distribution from nozzles used in deluge systems is important when it comes to fire calculations and modelling of droplets in the fire zone. The flow of droplets in air and the rain-out of droplets from air-borne droplets in a spray are highly dependent on size, and most important in the modelling and understanding of interaction between a spray of water and a fire source. The time of increasing the temperature of a water droplet from supply temperature to evaporation is of utmost importance in predicting and understanding the mechanisms of fire suppression. In earlier research projects on deluge systems, SINTEF NBL placed contracts at two independent laboratories using Phase Doppler Anemometry (PDA), also called Phase Doppler Particle Analysis (PDPA), to quantify the droplet size distribution in the spays from deluge nozzles, [1]. This information was used as an input to the CFD-modelling of spray characteristics, as well as in theoretical analysis of droplet behaviour in the presence of fire. The measured droplet sizes were observed to be quite small, in fact so small that the spray from these deluge nozzles might be qualified to be characterized as water mist, e.g. 90% of the mass of the water was measured with a diameter less than 1000 µm. This project was initiated because the PDA technique resulted in such suspiciously small droplets. Instead of comparing the results from two measurement series using the same technique, two measurements series using two different techniques have been conducted and the results have been compared. One of the measurement series used the same technique as in the previous project, so that the present work also could be compared with earlier results.

4
3 Test Methods A number of methods have been developed for measuring the droplet size, and many recent methods use laser –based instruments of which there are three main types. Those are Laser diffraction, Phase Doppler Anemometry (PDA) - also called Phase Doppler Particle Analysis (PDPA), and Particle imaging system: The laser diffraction method can be used for measuring the particle size only, while the two other techniques can measure both particle size and velocity. Instruments that take advantage of the laser diffraction technique are the Malvern instruments “Spraytec”, and the “Helos” and “Mytos” from Symbatec GmbH. PDA instruments are manufactured by Aerometrics Inc. and by Dantec Dynamics Ltd. Dantec Dynamics Ltd does also produce particle imaging systems. Another particle imaging system is the “VisiSizer” produced by Oxford Lasers (which was used in this project). In this project, two techniques have been used to measure the droplet size distribution from two nozzles. The two chosen techniques are Phase Doppler Anemometry and a particle imaging technique. These droplet size measurements were conducted at the Institut der Feuerwehr (IdF) in Germany, and at The Arable Group (TAG) in England, repectively. Both techniques are described in more detail in the following pages.
3.1 Phase Doppler Anemometry (PDA) Laser Doppler Anemometry (LDA) and Phase Doppler Anemometry are two optical techniques that can be used to measure droplet velocities and sizes, without disturbing the particle flow. The LDA can be used to measure the velocity of the particles while PDA is used to estimate the particle size. In this experiment, only size measurements were conducted. In Figure 3-2, a standard arrangement for the PDA measurement technique is shown. Two monochromatic laser beams are crossing each other in what is called the measurement volume. Particles passing this small volume will scatter the laser beam to the two detectors, which are positioned out of the plane of the incident beams with an angle , known as the off-angle axis angle. The detectors are also placed symmetrically out of the y-z plane by an angle . This angle is strongly overblown in the Figure compared to . The size measurement in PDA is based on the phase difference between the signals received by the two detectors. The phase difference depends on the respective path lengths through the droplet as illustrated in Figure 3-1. For spherical droplets the diameter is proportional to the phase difference.
Figure 3-1 Illustration of the ray path through the droplet. Both detectors are located inside
the receiver box.

5
Figure 3-2 Illustration of the PDA measurement technique.
3.2 Imaging Technique A short flash of light from a laser illuminates a screen, which acts as a bright background behind the subject spray. The short pulse from the laser freezes the motion, allowing blur-free visualization of droplet size and shape, as shown in Figure 3-3. Images from the digital camera are transferred to a computer, and a high-speed real-time particle sizing software analyses the images obtained in order to build up the diameter distribution.
Figure 3-3 Picture of the droplets obtained using the Oxford Lasers VisiSizer.
Every pixel in the image darker than a certain value, are considered to belong to a droplet. When a droplet is found, the diameter is calculated using both the area and the perimeter of the droplet [2]:
πACDa
4⋅= (1)
⎟⎠⎞
⎜⎝⎛⋅=πPCDp (2)
where Da is the diameter obtained using the area A, and Dp is the diameter obtained using the perimeter P. C is the microns/pixel calibration constant. All diameters presented in this report are based on the area of the image. The sphericity of the droplets is defined as:
2
⎟⎟⎠
⎞⎜⎜⎝
⎛
p
a
DD
(3)
Measurement volume

6
Because ap DD ≥ for all droplet shapes, the sphericity will have a value between 0 and 1. A perfectly spherical droplet will have a sphericity of 1. In the analysis only droplets with a sphericity larger than a certain value are counted.
3.3 Droplet size calculations and terminology From the droplet size distributions, the volume mean diameter 30D , the surface mean diameter 20D and the linear mean diameter 10D is calculated as follows:
3/1
1
330
1⎟⎠
⎞⎜⎝
⎛= ∑
=
N
iiD
ND (4)
2/1
1
220
1⎟⎠
⎞⎜⎝
⎛= ∑
=
N
iiD
ND (5)
∑=
=N
iiD
ND
110
1 (6)
The volume median diameter is termed DVXX, and is defined as the diameter in such a way that the collection of particles having that size or less, represents XX % of the total volume of droplets. Normally DV50 is used. In this report DV50 will be given the name Volume Median Diameter (VMD). The volume mean diameter 30D , the surface mean diameter 20D and the linear mean diameter 10D , are different kinds of means, meaning that they are related to the total number of droplets. 30D and 20D are more sensitive to droplets deviating from the mean diameter than the mean diameter, 10D , itself. This means than one large droplet will influence more on 30D than on 10D . The VMD is related to the total volume, and is also sensitive to a few large droplets. This is because the volume in one large droplet can be the same as the total volume in thousands of small droplets.
4 Experimental set up
4.1 The nozzles and test setup in general
Nozzles are caracterised by its K-factor, which is defined as follows:
pKQ Δ⋅=•
(7) •
Q , is the flow and pΔ is the gauge pressure.
Two nozzles named HVK44 (High Velocity nozzle with K-factor 44 litre/(min bar1/2)) and MVK41 (Medium Velocity nozzle with K-factor 41 litre/(min bar1/2)) were used in the experiments. The nozzle names where based on earlier measurements [1]. For MVK41, the expected pressure (given in the table below) was needed to get the correct flow, while for the HVK44 nozzle, a lower pressure was needed, indicating that the actual K-factor of the nozzle is higher than given in the nozzle name. However, the name HVK44 will be used throughout this

7
report. The pressure and flow rate used in the tests as well as the bore diameter and the engraved number on the nozzles are given in Table 4-1. Pictures of the nozzles are shown in Figure 4-1.
Table 4-1 Specifications for the two nozzles. During the experiments the flow was fixed, while the pressure was adjusted to give the right flow.
Nozzle
Gauge pressure
[bar]
K-factor [litre/(min
bar1/2)]
Flow
[litre/min]
Bore diameter
[mm]
Nozzle nr HVK44 2.75 49 81.6 9,9 1 MVK41 2.6 41 66.6 9,7 2
(a) (b)
Figure 4-1 (a) The HVK44 nozzle. (b) The MVK41 nozzle
The sprays from the two nozzles are shown in Figure 4-2.

8
(a) (b)
Figure 4-2 The spray from (a) HVK44, and (b) MVK41
An ideal, and intended test set up, is shown in Figure 4-3. The pressure measurements should ideally be conducted in a “dead end” where the water stands still, and the pressure transducer should be placed at the same height as the nozzle. The droplet size measurements were conducted 1 meter below the nozzles. From the measurement location to the floor there was 93.5 cm when the photographic method was used and more than 1.5 meter when the PDA method was used. This was necessary to avoid back splashing droplets from the floor. During the operation of the VisiSizer, an airflow was set up along the floor to reduce the accumulation of airborne droplets in the measurement zone.
Figure 4-3 A sketch of the nozzle-set-up. The pressure measurements should ideally be
measured in a “dead end” where the water stands still. The pressure transducer should also be placed at the same height as the nozzle. The droplet size measurements were conducted 1 meter below the nozzles. From the measurement location to the floor there was 93.5 cm when the photographic method was used and more than 1.5 meter when the PDA method was used.
9
(a) (b)
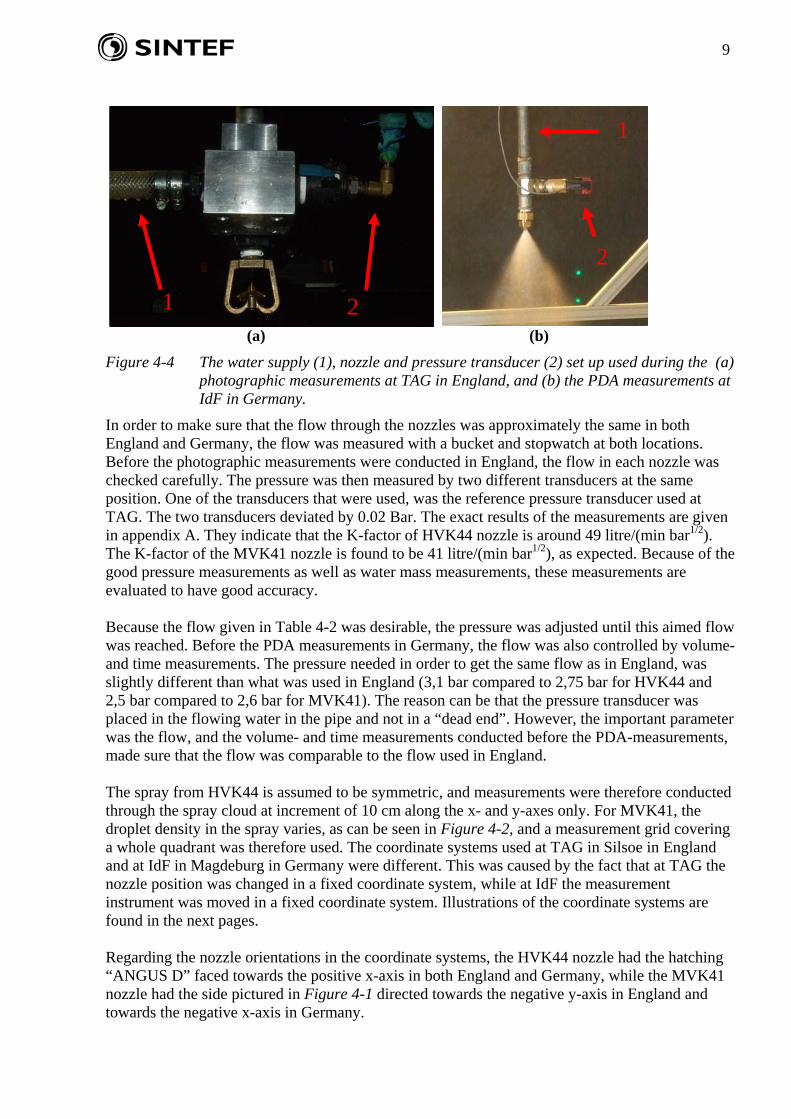
Figure 4-4 The water supply (1), nozzle and pressure transducer (2) set up used during the (a) photographic measurements at TAG in England, and (b) the PDA measurements at IdF in Germany.
In order to make sure that the flow through the nozzles was approximately the same in both England and Germany, the flow was measured with a bucket and stopwatch at both locations. Before the photographic measurements were conducted in England, the flow in each nozzle was checked carefully. The pressure was then measured by two different transducers at the same position. One of the transducers that were used, was the reference pressure transducer used at TAG. The two transducers deviated by 0.02 Bar. The exact results of the measurements are given in appendix A. They indicate that the K-factor of HVK44 nozzle is around 49 litre/(min bar1/2). The K-factor of the MVK41 nozzle is found to be 41 litre/(min bar1/2), as expected. Because of the good pressure measurements as well as water mass measurements, these measurements are evaluated to have good accuracy. Because the flow given in Table 4-2 was desirable, the pressure was adjusted until this aimed flow was reached. Before the PDA measurements in Germany, the flow was also controlled by volume- and time measurements. The pressure needed in order to get the same flow as in England, was slightly different than what was used in England (3,1 bar compared to 2,75 bar for HVK44 and 2,5 bar compared to 2,6 bar for MVK41). The reason can be that the pressure transducer was placed in the flowing water in the pipe and not in a “dead end”. However, the important parameter was the flow, and the volume- and time measurements conducted before the PDA-measurements, made sure that the flow was comparable to the flow used in England. The spray from HVK44 is assumed to be symmetric, and measurements were therefore conducted through the spray cloud at increment of 10 cm along the x- and y-axes only. For MVK41, the droplet density in the spray varies, as can be seen in Figure 4-2, and a measurement grid covering a whole quadrant was therefore used. The coordinate systems used at TAG in Silsoe in England and at IdF in Magdeburg in Germany were different. This was caused by the fact that at TAG the nozzle position was changed in a fixed coordinate system, while at IdF the measurement instrument was moved in a fixed coordinate system. Illustrations of the coordinate systems are found in the next pages. Regarding the nozzle orientations in the coordinate systems, the HVK44 nozzle had the hatching “ANGUS D” faced towards the positive x-axis in both England and Germany, while the MVK41 nozzle had the side pictured in Figure 4-1 directed towards the negative y-axis in England and towards the negative x-axis in Germany.
1 2
1
2

10
The two different coordinate systems and the different orientations of the nozzles, means that the data from the two measurements series need to be rearranged in order to get comparable results at each measurement position. In this project the main concern is to compare different measurement techniques to see if larger droplets than previously found can exist. Therefore the coordinates are not rearranged, and the coordinates used at TAG in England and at IdF in Germany are not directly comparable. Instead it is here focused on droplet sizes from the nozzles as a whole.
4.2 Test set up for the photographic technique used at TAG in England Each nozzle was mounted on the computer controlled x-y nozzle transporter in the spray chamber on the Silsoe site, operated by Silsoe Spray Applications Unit. The coordinate system used in the test is visualised in Figure 4-5. Nozzles were mounted 1.0 m above the sampling laser of the Oxford Lasers “VisiSizer” instrument, and were supplied with tap water from an electrically driven helical screw pump having a maximum flow capacity of between 9.0 and 14 m3/h and a maximum delivery head of up to 150 m of water gauge. This pump is normally used to provide wash-down water for the wind tunnel facility on the Silsoe site and the output capacity was larger than that required to operate the nozzles used in this work. The output from the pump was therefore divided with a pipe used to supply the nozzles via a control valve and a second pipe-line dumping flow back into the supply tank. This arrangement gave good control of the pressure/flow supply to the nozzle. The supply pressure was monitored using an electronic pressure transducer mounted in the supply line immediately up-stream of the nozzle, as shown in Figure 4-4.
(a) (b)
Figure 4-5 The coordinate systems used for (a) the HVK44 and (b) the MVK41 nozzle, during the measurements with the photographic technique. The coordinate systems and measurement positions (the VisiSizer) are fixed, while the nozzle moves. The frame around the coordinate system illustrates the wall of the spray chamber, including the door.
A set of initial measurements with the HVK 44 nozzle were made to determine the optical magnification, and hence the droplet size range, that should be used in the study. Magnification 1,0 giving a droplet size range of 33.5 to 2500μ m, and magnification 0,58 giving a droplet size range of 56,0 to 4100 μ m was used. Measurements were then made at all of the sampling points for the two nozzles as illustrated in Figure 4-7 (the measurement grids were similar in Germany

11
and in England) with analysis undertaken to assess the effect on the measured droplet sizes of using different sphericity factors in the image analysis. For complete results from this analysis see appendix B. The analysis showed that varying the minimum acceptable sphericity factor between 0,5 and 0,8 had no, or very small effect on the calculated VMD. Therefore all droplets with a sphericity factor higher than 0,65, which is the limit normally used by VisiSizer, were counted in all measurements in this report. In addition to have a sphericity factor higher than 0,65, the droplets had to be in focus in order to be counted. The focus depth of the instrument in the direction of the laser was 8,0mm at a distance of 86mm from the lens, meaning particles inside an area of length 8,0mm in front of the camera are in focus. All measurements were made in the spray chamber using the highest purge air flow setting to reduce the accumulation of small airborne droplets within the measurement zone. However, the spray chamber was small, and the possibility that some airborne droplets have been redirected into the measurement zone can not be rejected.
4.3 Test set up for the PDA measurements at IdF in Germany The test set up showing the laser beam, the laser, the recorder, the nozzle with pressure transducer, and positioning system for the measurements are shown in the below Figure.
Figure 4-6 The test set up at IdF in Germany.
Before the measurements were conducted, the water flow was checked using time- and volume measurements of the flow, and was adjusted to be approximately the same as in England. The PDA-instrument was mounted on the computer controlled x-y instrument transporter, meaning that the nozzle was fixed together with the coordinate system, while the PDA-instrument was moved to different locations in the coordinate system. An illustration of this is found in Figure 4-7.

12
It is possible to change the optics in the PDA-system in order to focus on the droplet size region of interest. The possible regions have a scale factor of 1:50 between the smallest and largest detectable droplet size. In other words, if the smallest detectable droplet is 20 mμ , then the largest detectable droplet size is 50 times larger, and thus 1000 mμ . In this project the large droplets were of interest, and therefore the best optics available for this purpose was chosen. With this setting the detectable droplets were between 30 and 1500 mμ . Optics focusing on even larger droplets may exist for the PDA-system, but were not available at IdF.
(a) (b)
Figure 4-7 Illustration of the measurement grids used at IdF in Germany for (a) HVK44, and (b) MVK41. The nozzle is fixed in the coordinate system, while the measurement instrument is moved in the coordinate system.
5 Results The results from the measurements are presented in this section. The first sub-section gives the results from the HVK44 nozzle, while the next sub-section presents the results from the MVK41 nozzle. In each sub-section the results from the photographic technique are presented before the results from the PDA-technique.
5.1 HVK44
5.1.1 Results from the photographic technique Results from the initial measurements with a diameter scan through the spray from the HVK 44 nozzle made with the two magnification settings are shown in Figure 5-1. The use of two magnifications showed good agreement, but with a higher VMD diameter in the centre using the smallest magnification. This may be because the largest droplets are not measured with the largest magnification. Because this project was motivated by the question about the existence of larger droplets, the smallest magnification (0,58, giving a size range of 56,0 to 4100 μ m) was chosen for the rest of the measurements at TAG in England.

13
Figure 5-1 Droplet sizes (as VMD in µm) measured along a diameter through the spray from the
HVK 44 nozzle with two magnification settings of the Oxford Lasers “VisiSizer” instrument.
In Figure 5-2, the volume median diameters from the measurements along the x- and y-axis are shown. A higher VMD is found in the centre of the nozzle. The spray is seen to be fairly symmetric with a VMD spanning from about 600 to 1300 mμ . In Figure 5-3 the number of measured droplets at each measurement position is given. It is seen that the number of measurements/counts is dramatically reduced in the end of the spray, indicating that the whole spray pattern is covered. The number of droplets counted at each location is of the order of tens of thousands, something which gives good statistical data. In Figure 5-4 the droplet size distribution for the HVK44 nozzle is given. All counts along the x-axis and y-axis are presented in the upper and middle plot, respectively. In the lower plot all counts along both x- and y-axis are presented. A bin size of 20 mμ is used in all plots. In this histogram the number of droplets in each bin has been corrected so that the number presented multiplied with the mean diameter in that bin, gives the correct total volume of the droplets counted in that bin. This may have a small effect as compared with no correction when the number of droplets in each bin is small. The data is presented in a logarithmic scale in order to catch the wide range of droplet counts in the different bins. It is seen that a large amount of droplets, and certainly most of the droplets, are small. However it is clear that also a significant amount of water is present in the larger droplets. Droplets larger than 1500 mμ are not rare. The largest measured droplet is around 3700 mμ . Since the volume of the droplets is proportional to the diameter cubed, it is clear that if some large droplets are present, they will contain a significant amount of the total volume flowing through the nozzle. To illustrate this, the percentage of the total volume (contained in all measured droplets) that is contained in the different droplet sizes, is plotted in Figure 5-5.

14
Figure 5-2 VMD values for HVK44 measured along the x and y axis with the imaging
technique.
Figure 5-3 Number of measurements with HVK44, conducted at different positions along the
x- and y-axis. The positions are named with reference to Figure 4-5 .

15
Figure 5-4 Measured droplet size distribution by number for the HVK44 nozzle. The upper and
middle plots include all measurements conducted along the x- and y- axis, respectively. The lower one includes all measurements conducted with the HVK44 nozzle.

16
Figure 5-5 Measured droplet size distribution by volume for the HVK44 nozze. The height of
each bin gives the accumulated volume of alldroplets in that bin, as percentage of the total volume of all droplets. The upper and middle plots include all measurements conducted along the x- and y- axis, respectively. The lower one includes all measurements conducted with the HVK44 nozzle.
17
5.1.2 Results from the PDA-technique In Figure 5-6 the volume median diameter from the measurements along the x- and y-axis are shown. The results from the PDA technique are not as fluctuating as the results from the imaging technique. The VMDs at various positions vary from about 550 to 750 mμ . In Figur 5-7, the VMD results from the imaging technique is plotted together with the VMD results from the PDA technique. In Figure 5-8, the number of droplets measured at various positions in the spray is presented. The number of droplets measured varies a lot and the number of counts is generally of the order of thousands, instead of tens of thousands. Thus, the PDA-technique did not give as good statistical data as the imaging technique did. Even if the statistical data are not that good as the data from the imaging technique, they give a good picture of the droplet size distribution. Histograms giving the droplet size distribution by number and by volume are given in Figure 5-9 and in Figure 5-10, respectively. They are produced in the same way as Figure 5-4 and Figure 5-5, except that no correction is made. It is seen that as compared to the imaging technique, a lot fewer small droplets are counted. It is also seen that droplets larger than 1200 mμ are seldom counted. The absence of a large amount of small droplets and also some large droplets in the droplet size distribution from the PDA-measurements, has the effect that the VMD is not deviating very much from what was found with the imaging technique. This is because the absence of a few large droplets compensate for the absence of many small droplets, when talking about volume. The droplet size distribution from the PDA-method may indicate that this method is good for a small region of droplet sizes. By choosing the optics you also choose the droplet sizes that you measure. This is also true for the imaging technique, but the latter method seem to capture a wider region of droplet sizes. Even if the PDA-technique should be capable to measure droplet sizes down to 30 mμ and up to 1500 mμ it seems to miss many of the droplets smaller than about 250 mμ and above 1200 mμ . In Figure 5-11, the calculated linear- surface and volume mean diameters are plotted at different positions in the spray.

18
Figure 5-6 VMD values for the HVK44 nozzle measured along the x and y axis measured with
PDA.
Figur 5-7 VMD values for the HVK44 nozzle measured along the x and y axis. Results from
the imaging technique and the PDA technique are shown in the same plot for comparison.

19
Figure 5-8 HVK44. Number of measurements conducted at different positions along the x- and
y-axis. The positions are named with reference to Figure 4-5 and Figure 4-7.

20
Figure 5-9 Measured droplet size distribution by number for the HVK44 nozzle using the
PDA-technique. The upper and middle plots include all measurements conducted along the x- and y- axis, respectively. The lower one includes all measurements conducted along both the x- and y-axis.

21
Figure 5-10 Measured droplet size distribution by volume for the HVK44 nozzle. The upper and
middle plots include all measurements conducted along the x- and y- axis, respectively The lower one includes all measurements conducted along both the x- and y-axis.

22
Figure 5-11 Linear- surface and volume mean diameters calculated from the PDA-
measurements, from the HVK44 nozzle.

23
5.2 MVK41
5.2.1 Results from the photographic technique In Figure 5-12, the VMD values at different positions in the measurement grid are plotted. The VMD values are found between approximately 200 and 800 mμ , with most of the VMDs between 300 and 600 mμ . In Figure 5-13 both the droplet size distribution by number and volume are given. All measurement positions are included. A larger number of small droplets are found as compared to the HVK44 nozzle, but no droplets larger than about 1600 mμ were measured. Figure 5-12 and Figure 5-13, thus indicate that the medium velocity nozzle MVK41 produces smaller droplets than the high velocity nozzle HVK44.
Figure 5-12 VMD values at various positions in the MVK41 spray pattern measured with the
imaging technique.

24
Figure 5-13 Measured droplet size distribution by number and volume for the MVK41 nozzle,
measured with the imaging technique. All measurement positions are included.

25
5.2.2 Results from the PDA technique In Figure 5-14, the VMD values at different positions in the measurement grid is plotted. The VMD values are found between approximately 400 and 770 mμ . This is in good agreement with the VMD values obtained by the imaging technique. It is also similar to the results obtained for the HVK44 nozzle using the PDA-technique. In Figure 5-15 the number of measurements/counts at each measurement position is presented. The number of measurements is of the order of thousands. In Figure 5-16 both the droplet size distribution by number and volume are given. All measurement positions are included. Comparing with Figure 5-9, no large differences in the droplet size distribution are found. This is in contrast to the results obtained with the imaging technique, which shows that the HVK44 nozzle produces larger droplets than the MVK41 nozzle. This indicates that the PDA technique focus on a too narrow range of droplets to capture important features of these nozzles. In Figure 5-17 the linear- surface and volume mean diameters are calculated from the PDA-measurements. This is included in order to be able to compare with the results reported by SINTEF NBL in 2006 [1].
Figure 5-14 VMD values at various positions in the MVK41 spray pattern, measured with the
PDA-technique.

26
Figure 5-15 The number of droplet measurements at various positions in the MVK41 spray
pattern using the PDA-technique.

27
Figure 5-16 Measured droplet size distribution by number and volume for the MVK41 nozzle, found with the PDA-method. All measurement positions are included.

28
Figure 5-17 Linear- surface and volume mean diameters calculated for the MVK41 nozzle using
the PDA-technique.

29
6 Discussion In the measurements reported in 2006 [1], it was found that 30D , 20D and 10D spanned over regions as given in the below table. The values were found by using the HVK44 nozzle at 2,4 bar. The values are the original data (no pvc-correction, see [1]), and they were obtained at the IdF laboratory. Another laboratory (TelTek, see [1]) reported even smaller diameters than IdF. The results obtained in this report (Figure 5-11), indicate that 30D , 20D and 10D all are mainly found between 400 and 600 mμ . Thus the diameters are found to be larger than what was reported in 2006, even if the same technique is used at the same laboratory.
Table 6-1 Values reported for 30D , 20D and 10D , in the year of 2006 [1]. The values were found with HVK44 using a pressure of 2,4 bar. The values are the original data (no pvc-correction, see[1]).
Mean Value [ mμ ]
30D 300 – 500
20D 250 – 450
10D 180 – 420 In Figure 6-1, the droplet size measurements from the experiments reported in 2006 [1] that were conducted at IdF, are plotted. The measurements were achieved with the MVK41 nozzle at 2,6 bar, meaning that these results are comparable with Figure 5-17. The table below summarises the results. It is clearly seen that the latest measurements give larger droplets, even if the same laboratory and nozzle is used.
Table 6-2 Values reported for 30D , 20D and 10D , in the year of 2006 [1] compared with corresponding values achieved in this report. The values from 2006 were found with MVK41 using a pressure of 2,6 bar. The values are the original data (no pvc-correction).
Mean Values reported in 2006 [ mμ ]
Values measured in 2008 [ mμ ]
30D 100 – 320 200 – 450
20D 100 – 380 250 – 500
10D 100 - 390 350 - 600 In the results from 2006 no droplets are reported to be larger than 1000 mμ . This can indicate that the optics used in the previous project could only detect droplets between 20 and 1000 mμ . This can have been done by a misunderstanding of the aim of the experiments, or simply because nobody from SINTEF NBL asked the question whether it was possible to choose the droplet size range. Anyway, the result of choosing this droplet size region would be that the measured droplet sizes are reported to be smaller than what they really are. In the latest measurements it was assured that the right configuration was used, and droplets up to about 1400 mμ were then found. This will of course give larger values for 30D , 20D and 10D as well as VMD.

30
Figure 6-1 The graphs show the linear, surface and volume mean diameter for the MVK41
nozzle, calculated from the measurements reported in 2006 [1]. The pressure used in this experiment was 2,6 bar.

31
The additional measurements with the imaging technique also indicate that the PDA- method has a too narrow range of detectable droplet sizes to be a good measurement technique for these kinds of nozzles. Compared to the imaging technique, the PDA- method misses a lot of droplets on each side of the measurable region. That is droplets smaller than about 250 mμ , and larger than about 1200 mμ (using the optics used in the latest measurements). This has the result that HVK44 and MVK41 seems to have the same droplet size distribution, but the imaging technique shows that this is not the case. Even if it seems like the PDA-technique is not appropriate to measure droplet size distributions from these nozzles, it can not be concluded that the imaging technique is able to give the correct droplet size distribution. An unclear aspect regarding the imaging technique is detailed information about the effects of rejecting droplets. It is known that droplets are rejected based on their shape. It is reasonable to believe that large droplets, more often than small droplets, become unspherical, and therefore that large droplets are rejected more often than small droplets. If this is true, the actual VMDs are even larger than the values reported here. In this study it has been shown that the effect of reducing the lower limit of acceptable sphericity factor from 0.8 to 0.5 had no effect on the calculated VMD. It would be interesting to know the effect of reducing it all the way down to zero. Based on Professor Miller’s (at TAG in England) experience with droplet size characterisation, he did not think that this effect was large. He is however mainly experienced with sprays containing much smaller droplets than the sprays from HVK44 and MVK41, and only new experiments can therefore say anything for sure. One thing that one should have in mind is that the spray chamber used at TAG was very small and not dimensioned for testing nozzles with such a high flow rate. Even if an air flow was set up along the floor, small air born droplets may have flown back into the measurement volume. This can explain the high amount of small droplets measured by the photographic technique, and it is therefore not for sure that the PDA-method does not capture the small droplets good enough. This effect would however not influence the large droplets. If the effect of the air borne droplets flowing back into the measuring volume is significant in this test, it would mean that the VMD is actually larger than reported here. It has earlier been mentioned the possibility that a large droplet (sometimes called the nose tip droplet) grows at the nozzle over time during operation of the nozzle. Once every minute or so, it falls down. This droplet will then be much larger than all other droplets, and does not really represent the spray. If such a “nose tip droplet” exists, it will contribute a lot to the volume mean diameter (VMD). However, the results from the particle imaging system show that the VMD increase as you get closer to the centre, and hence the increased VMD in the centre is probably not due to such a “nose tip droplet”.
7 Conclusions Based on the presented results and the discussion in the last section, the following conclusions are made:
• It is likely that wrong choice of optics in the measurements reported in 2006 [1] caused the droplet sizes to be measured too small. This can have been caused by a misunderstanding that the aim of the project was to detect water mist droplets. In the present project (2008) it was made sure that the configuration that causes the largest possible droplets to be

32
measured was chosen at IdF. For the HVK44 nozzle this resulted in VMDs (Volume Median Diameter) in the region 550 – 750 mμ , and 600 – 1300 mμ , using the PDA-technique and the imaging technique, respectively. For MVK41 the corresponding values were 400 – 770 mμ using the PDA technique, and 200 – 800 mμ with most of the VMDs between 300 and 600 mμ , using the imaging technique.
• Especially for the HVK44 nozzle, a significant amount of droplets larger than 1200 mμ were found with the imaging technique. These droplets were not detected by the PDA-technique, meaning that this method gives lower VMDs for the HVK44 nozzle. When the MVK41 nozzle was used, none of the methods detected larger droplets than about 1600 mμ . The PDA technique did therefore capture most of the largest droplets, and the VMDs achieved using the two techniques are because of that more similar.
• Unless it is possible to use an even larger measurable region (use another optics) in the PDA-instrument, it looks like the imaging technique is the most appropriate measuring technique for these sprays. It captures more of the droplets, and hence gives a more credible result.
• It may be possible to obtain more information about droplet size distributions with a wide range of sizes, if two or more measurements are carried out with the PDA-technique, using different optics and hence covering a broader range of droplet sizes.
• Even though this study concludes that larger droplets than reported in 2006 [1] exist in the sprays, and that the VMDs, as well as 30D , 20D and 10D , are larger than found last time in 2006, one still don’t know for sure whether the droplet size distributions are correct. Questions about the effects on how the droplets are rejected have not been answered properly. Especially the effect of reducing the lowest acceptable sphericity factor to zero is unclear. In order to answer these questions one need to do new experiments, and to really get into details about the imaging technique. When this is done, it is also possible and interesting to measure the droplet size distribution in the sprays as a function of the location in the spray.
With the above conclusions in mind, it is clear that this study has both answered many of the questions present before the study was initiated, but it also point out some new important questions.
Acknowledgement SINTEF NBL would like to thank Silsoe Spray Application unit at The Arable Group (TAG), and Institute der Feuerwehr (IdF) for cooperating in an excellent way, and making these studies possible. We would also like to thank StatoilHydro for supporting this work economically, and showing interest in this research topic.
References
[1] Wighus, R. : Droplet size, velocity and area distribution – Deluge nozzles (Restricted), NBL 10F03113; 2006; 158
[2] VisiSizer operation manual, April 2006.

33
A Flow measurements conducted before the photographic measurements at TAG in England
A bucket was filled with water from the nozzle for 10 or 15 seconds, as shown in Figure A-1. The amount of water was found using a balance.
Figure A-1 The bucket was filled with water for 10 or 15 second before the amount of water
was found using a balance.
Table A-1 Flow measurements of HVK44 at 3.51 Bar.
# m [kg] t [s] 1 15,41 10 2 15,27 10 3 15,07 10 4 15,78 10 5 15,82 10
This gives an average of 15,47 kg/min. Assuming the density of water is 0,998kg/litre, this gives an average flow of 93,0 litres/min, and a K-factor of 49,6 litre/(min bar1/2)

34
Table A-2 Flow measurements of MVK41 at 2.75 Bar.
# m [kg] t [s] 1 13.61 10 2 13,59 10 3 13,63 10 4 13,50 10 5 13,76 10
This gives an average of 13,62 kg/min. Assuming the density of water is 0,998kg/litre, this gives an average flow of 81,6 litres/min, and a K-factor of 49,4 litre/(min bar1/2)
Table A-3 Flow measurements of MVK41 at 2,80 Bar.
# m [kg] t [s] 1 17,07 15 2 17,58 15 3 17,19 15 4 17,40 15 5 17,01 15
This gives an average of 17,25 kg/min. Assuming the density of water is 0,998kg/litre, this gives an average flow of 66,1 litres/min, and a K-factor of 41,3 litre/(min bar1/2)
Table A-4 Flow measurements of MVK41 at 2,60 Bar.
# m [kg] t [s] 1 16,87 15 2 16,59 15 3 16,56 15 4 16,48 15 5 16,66 15
This gives an average of 16,63 kg/min. Assuming the density of water is 0,998kg/litre, this gives an average flow of 66,6 litres/min, and a K-factor of 41,3 litre/(min bar1/2)
B The effect of different limits on the sphericity factor In the imaging analyses performed by the VisiSizer, only the droplets with a spericity factor larger than a certain limit are counted. The limit normally used is 0,65. In order to see the effect of vary the limit a short analysis was conducted before the rest of the measurements. The results are presented in graphs below, and show that varying the limit between 0,5 and 0,85 influence the calculated VMD-value very little, but it decreases the number of counts.

35
Figur B-1 The number of counted droplets, the VMD, and the percent of the volume included in droplets smaller than 100μ m. The three graphs in each plot are explained in the legend in the upper plot.

SP Fire Research AS Box 4767 Sluppen, N-7465 Trondheim, NORWAY Telephone: +47 464 18 000 E-mail: [email protected], Internet: www.spfr.no www.spfr.no
SPFR Report A15 107453:1 ISBN
More information about publications published by SP: www.sp.se/publ
SP Technical Research Institute of Sweden Our work is concentrated on innovation and the development of value-adding technology. Using Sweden's most extensive and advanced resources for technical evaluation, measurement technology, research and development, we make an important contribution to the competitiveness and sustainable development of industry. Research is carried out in close conjunction with universities and institutes of technology, to the benefit of a customer base of about 10000 organisations, ranging from start-up companies developing new technologies or new ideas to international groups.