soy protein/cellulose nanofiber scaffolds mimicking skin...
TRANSCRIPT

www.advhealthmat.de
FULL PAPER
1701175 (1 of 13) © 2018 WILEY-VCH Verlag GmbH & Co. KGaA, Weinheim
Soy Protein/Cellulose Nanofiber Scaffolds Mimicking Skin Extracellular Matrix for Enhanced Wound Healing
Seungkuk Ahn, Christophe O. Chantre, Alanna R. Gannon, Johan U. Lind, Patrick H. Campbell, Thomas Grevesse, Blakely B. O’Connor, and Kevin Kit Parker*
DOI: 10.1002/adhm.201701175
1. Introduction
Soy protein is a dietary protein extracted from soy beans, which have received considerable attention in the last couple of decades for their potential health benefits. Epidemiological and clinical studies supporting this claim ultimately ena-bled U.S. Food and Drug Administration (FDA) approval in 1999 of soy protein for protective effects on coronary heart dis-ease.[1] Alternatively, soy protein has also been explored more recently as a “green” and renewable substitute for petroleum- or animal-derived polymers in biomedical applications.[2] It was found that soy protein has bioactive peptides similar to extracellular matrix (ECM) proteins, present in human
Historically, soy protein and extracts have been used extensively in foods due to their high protein and mineral content. More recently, soy protein has received attention for a variety of its potential health benefits, including enhanced skin regeneration. It has been reported that soy protein pos-sesses bioactive molecules similar to extracellular matrix (ECM) proteins and estrogen. In wound healing, oral and topical soy has been heralded as a safe and cost-effective alternative to animal protein and endogenous estrogen. However, engineering soy protein-based fibrous dressings, while recapitulating ECM microenvironment and maintaining a moist environment, remains a chal-lenge. Here, the development of an entirely plant-based nanofibrous dressing comprised of cellulose acetate (CA) and soy protein hydrolysate (SPH) using rotary jet spinning is described. The spun nanofibers successfully mimic physicochemical properties of the native skin ECM and exhibit a high water retaining capability. In vitro, CA/SPH nanofibers promote fibroblast prolifera-tion, migration, infiltration, and integrin β1 expression. In vivo, CA/SPH scaf-folds accelerate re-epithelialization and epidermal thinning as well as reduce scar formation and collagen anisotropy in a similar fashion to other fibrous scaffolds, but without the use of animal proteins or synthetic polymers. These results affirm the potential of CA/SPH nanofibers as a novel wound dressing.
S. Ahn, C. O. Chantre, Dr. A. R. Gannon, Dr. J. U. Lind, Dr. P. H. Campbell, Dr. T. Grevesse, B. B. O’Connor, Prof. K. K. ParkerDisease Biophysics GroupWyss Institute for Biologically Inspired EngineeringHarvard University29 Oxford St. Pierce Hall, Rm 321, Cambridge, MA 02138, USAE-mail: [email protected]
The ORCID identification number(s) for the author(s) of this article can be found under https://doi.org/10.1002/adhm.201701175.
Tissue Engineering
tissues.[3] These ECM-mimetic peptides can promote cell adhesion, proliferation, and migration critical for supporting tissue regeneration.[3,4] Furthermore, soy protein carries phytoestrogens that act as a structural and functional analogue to the female sex hormone estrogen,[5] which affects the regulation and devel-opment of various organs by binding to estrogen receptors (ERs).[6] Binding of estrogen to ERs forms dimers that per-form as co-activators to stimulate tran-scription of target gene expressions in various regions.[7] Interestingly, soy phy-toestrogens preferentially bind to an ER that has been shown to have positive effects on age-related diseases, including delayed wound healing.[8] In cutaneous wound healing, soy protein has attracted increased attention as a safe and cost-effective alternative to animal protein and endogenous estrogen.[3,8c,9] Previous studies have shown that cryptic peptides in soy protein improved wound healing by increasing dermal ECM synthesis
and stimulating re-epithelialization.[3,9b,c] Soy phytoestrogens have been demonstrated to accelerate the healing process via ER-mediated signaling pathways.[8b,c,10] They also pos-sess anti-bacterial,[2b,11] anti-inflammatory,[12] and anti-oxidant properties[13] that support and enhance wound healing. More-over, clinical trials have reported that oral intake of soy (both protein and phyto estrogens) accelerates skin regeneration in aged women and burn patients.[13b,14]
Nanofibrous scaffolds have emerged as a promosing approach for developing wound dressings,[15] as they can rep-licate the fibrous dermal ECM microenvironment that pro-vides structural support for wound healing and functional cues for directing tissue regeneration.[15,16] Biodegradable synthetic polymers such as polycaprolactone (PCL) have been widely used to produce nanofibers due to their versatile spin-ning capabilities.[15,16] Yet, they remain poorly suited building blocks for developing wound dressings as they are much stiffer than natural skin.[17] Furthermore, many of them are hydrophobic, limiting their ability to keep wounds hydrated.[17] Synthetic polymers also lack cell binding domains and there-fore cannot enhance cellular attachment or functionality.[18] Nanofibers spun from animal-sourced ECM proteins, such as gelatin and collagen in combination with synthetic polymers, have been previously reported in literature to contain bioactive
Adv. Healthcare Mater. 2018, 1701175

© 2018 WILEY-VCH Verlag GmbH & Co. KGaA, Weinheim1701175 (2 of 13)
www.advancedsciencenews.com www.advhealthmat.de
molecules which support healing.[15b,17b] While adding ECM proteins to a nanofibrous scaffold enhances its biological and mechanical properties, ECM proteins are costly and suscep-tible to common liabilities of animal-derived products: immu-nogenicity, antigenicity, disease transmission, and pathogen contamination.[2b,19] Furthermore, the utilization of collagen alone, the most common ECM protein used in wound dress-ings, has been shown to cause extensive wound contraction and scarring.[20]
Because of its pro-regenerative traits, soy protein-based nanofiber wound dressings have recently been devel-oped as an alternative to animal-derived ECM protein nanofibers.[2a,9c,21] By mimicking the fibrous dermal ECM microenvironment, they can provide potent structural and functional cues for directing tissue regeneration.[20,22] How-ever, current methods for engineering soy protein nanofibers require the use of synthetic polymers as carriers, due to the low molecular weight of soy protein that inhibits the produc-tion of nanofibers alone.[2a,21a,23] As described above, synthetic polymers are not ideal for developing wound dressings as they possess physicochemical properties different from the native skin.[17] Soy protein hydrogels necessitate additional crosslinking agents that can be toxic and can alter the orig-inal structure of soy peptides.[4,21b] As such, the development and validation of effective soy protein-based nanofiber scaf-folds for wound healing applications remain an essential challenge.
In this study, we report the fabrication of plant hybrid cel-lulose acetate (CA)/soy protein hydrolysate (SPH) nanofibers for wound healing applications. We hypothesized that CA/SPH nanofibers could recapitulate the dermal ECM micro-environment and maintain a moist environment while deliv-ering soy protein to potentiate skin regeneration. Cellulose acetate was selected as a co-spinning polymer because it readily dissolves in various solvents and self-assembles into nanofibers, enabling recapitulation of the native ECM fibrous structure and high water retention ability.[24] It is also abun-dant and exhibits low immunogenicity to humans because of its non-animal origins.[2b,9a,24a–c] Dermal ECM-mimetic CA and SPH nanofibers were manufactured via rotary jet spin-ning (RJS) system that utilizes centrifugal forces to extrude fibers in the nanometer range. We optimized physicochem-ical properties of the spun nanofibers by functionalizing the CA nanofibers with SPH. The RJS-spun CA/SPH nanofibers had higher production rate and better control of fiber mor-phology without an additional modification or high-voltage electric fields in the system, when compared to the existing electrospun soy-based nanofibers.[25] Finally, in vitro and in vivo functionalities of our dressings were tested by investi-gating dermal fibroblast behaviors, and further assessing wound closure rate and skin regeneration in an excisional wound splinting mice model, respectively. In comparison with the current fibrous scaffolds, the CA/SPH nanofibers had a healing ability similar to, or better than, other fibrous dressings, but our scaffolds were free of animal-derived pro-teins or synthetic polymers that are suboptimal. Our results underscored the potential of such soy-based nanofiber scaf-folds as potent and cost-effective alternative to existing pro-regenerative strategies.
2. Results and Discussion
2.1. Fabrication of Plant Hybrid Nanofibers
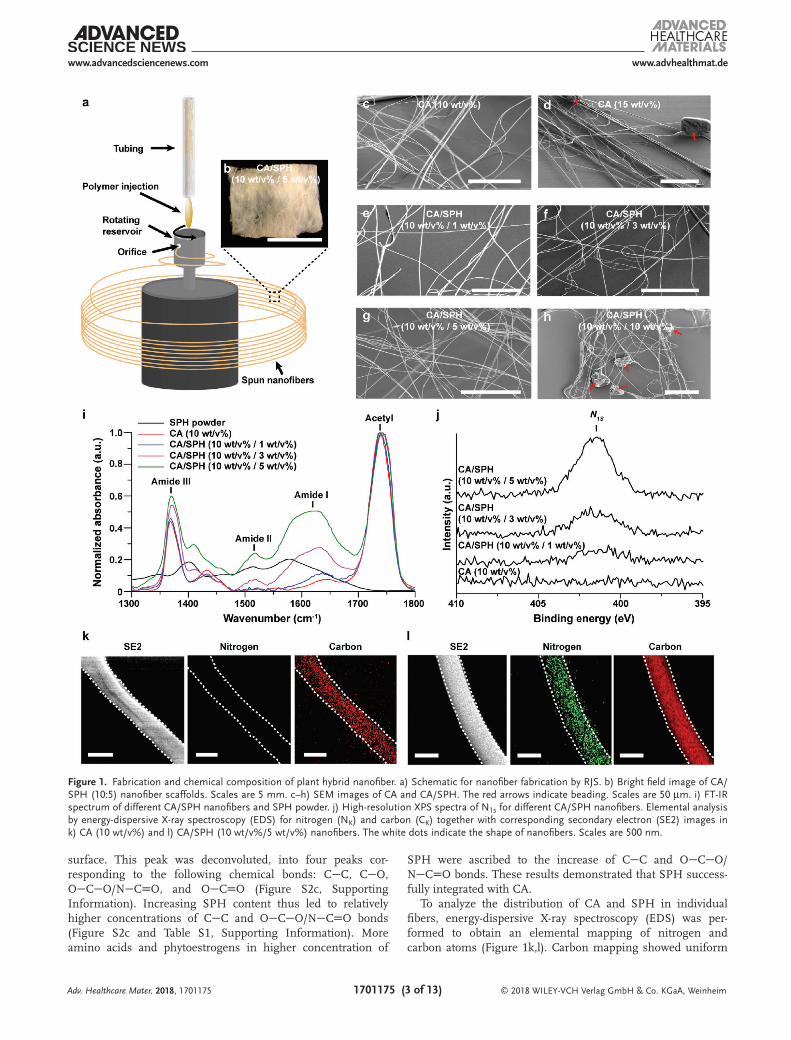
Plant-based hybrid nanofibers were fabricated by co-spinning CA and SPH in hexafluoroisopropanol (HFIP) using a RJS system, which produces defect-free nanofibers under centrifu-gally induced shear forces (Figure 1).[25,26] CA was chosen to supplement the low molecular weight of soy protein, while SPH was chosen as the soy protein source. SPH is a mixture of amino acids, peptides, phytoestrogens, and soy deriva-tives obtained by hydrolyzing soy protein isolate to minimize inorganic ions and to maximize protein content.[27] Contin-uous CA and CA/SPH nanofibers were spun at a centimeter scale by extruding polymer solution from a rotating reservoir (Figure 1a,b).
For the RJS system, the spinnability and beading of CA and SPH nanofibers were significantly influenced by their polymer concentrations (w/v%). Table 1 shows that SPH alone could not be spun into nanofibers because its molecular weight is too low. The short chains of SPH molecules cannot overlap and entangle, suggesting that SPH would require a co-spinning polymer with longer chains.[23b,25a] Experimentation with fixed rotation and injection speeds showed that adding 10 w/v% of CA to various concentrations of SPH (1, 3, 5 w/v%) resulted in continuous nanofiber formation without beading (Table 1, Figure S1, Supporting Information and Figure 1c,d). A higher concentration of SPH (10 w/v%) in contrast showed beading in fibers (Table 1 and Figure 1e–h). Moving forward, 10 w/v% of CA was therefore selected as the carrier polymer for SPH. The developed continuous nanofibers had an intercalated nanofibrous structure that resembles the native extracellular matrix. This morphological similarity supports cell–fiber inter-actions that promote wound healing.[20,22]
2.2. Chemical Structure of Plant Hybrid Nanofibers
To ensure a uniform structure, elements must be homog-enously dispersed at the nanofiber surface.[28] Attenuated total reflectance-Fourier transform infrared (ATR-FTIR) spectroscopy was performed to determine the relative amounts of proteins in the spun nanofibers. In the FTIR spectrum, amide I peaks (1600–1700 cm−1) are representative of the secondary structure of amino acids in SPH, and acetyl peaks (1700–1800 cm−1) are representative of CO stretching of acetyl groups in CA (Figure 1i). After subtracting background intensity from CA in the amide I peak, the peak area-to-peak area ratios (amide I peak over acetyl peak) were linearly related to the amounts of SPH (Figure S2a, Supporting Information), showing that SPH can be added into fibers in an amount up to 5 w/v% without causing the loss of soy protein molecules.
X-ray photoelectron spectroscopy (XPS) was performed to confirm the elemental composition of the nanofiber surfaces. The nitrogen content gradually increased as the concentra-tion of SPH increased (Figure 1j and Figure S2b, Supporting Information), confirming that SPH was incorporated into CA nanofibers. High-resolution analysis of the C1s peaks addition-ally confirmed the increasing protein content on the nanofiber
Adv. Healthcare Mater. 2018, 1701175
© 2018 WILEY-VCH Verlag GmbH & Co. KGaA, Weinheim1701175 (3 of 13)
www.advancedsciencenews.com www.advhealthmat.de
surface. This peak was deconvoluted, into four peaks cor-responding to the following chemical bonds: CC, CO, OCO/NCO, and OCO (Figure S2c, Supporting Information). Increasing SPH content thus led to relatively higher concentrations of CC and OCO/NCO bonds (Figure S2c and Table S1, Supporting Information). More amino acids and phytoestrogens in higher concentration of
SPH were ascribed to the increase of CC and OCO/NCO bonds. These results demonstrated that SPH success-fully integrated with CA.
To analyze the distribution of CA and SPH in individual fibers, energy-dispersive X-ray spectroscopy (EDS) was per-formed to obtain an elemental mapping of nitrogen and carbon atoms (Figure 1k,l). Carbon mapping showed uniform
Adv. Healthcare Mater. 2018, 1701175
Figure 1. Fabrication and chemical composition of plant hybrid nanofiber. a) Schematic for nanofiber fabrication by RJS. b) Bright field image of CA/SPH (10:5) nanofiber scaffolds. Scales are 5 mm. c–h) SEM images of CA and CA/SPH. The red arrows indicate beading. Scales are 50 µm. i) FT-IR spectrum of different CA/SPH nanofibers and SPH powder. j) High-resolution XPS spectra of N1s for different CA/SPH nanofibers. Elemental analysis by energy-dispersive X-ray spectroscopy (EDS) for nitrogen (NK) and carbon (CK) together with corresponding secondary electron (SE2) images in k) CA (10 wt/v%) and l) CA/SPH (10 wt/v%/5 wt/v%) nanofibers. The white dots indicate the shape of nanofibers. Scales are 500 nm.
© 2018 WILEY-VCH Verlag GmbH & Co. KGaA, Weinheim1701175 (4 of 13)
www.advancedsciencenews.com www.advhealthmat.de
distribution of carbon atoms on the spun nanofibers, matching the corresponding secondary electron (SE2) images. Nitrogen atoms appeared exclusively on CA/SPH nanofibers owing to the presence of SPH and were homogeneously distributed throughout individual fibers. This confirms and concludes that spinning CA at 10 w/v% and SPH at 5 w/v% improved fiber spinnability and yielded fibers with high concentrations of uniformly distributed protein. In the following studies, CA (10 w/v%) and CA/SPH (10 w/v% / 5 w/v%) nanofibers were selected as pure CA nanofibers and CA/SPH nanofibers, respectively.
2.3. Characterization of Mechanical Properties and Surface Chemistry
The physicomechanical properties of nanofibers—fiber diam-eter, pore diameter, and stiffness—influence wound healing. Recent studies have shown that fiber diameter (200–400 nm) and scaffold pore diameter (6–20 µm), similar to the native ECM, enhance adhesion, proliferation, and infiltration of human dermal fibroblasts, while minimizing bacterial infil-tration.[29] Fiber stiffness has also been shown to affect cell behavior.[30] To encourage assembly of new ECM, the stiffness of wound dressing materials should mimic the stiffness of the native ECM microenvironment (5–600 kPa),[31] however the stiffness of common synthetic polymer nanofiber scaffolds is usually one to several orders of magnitude higher.[17]
It was observed that fiber diameter ranges from 300.30 ± 0.76 nm in CA nanofibers and to 396.66 ± 0.90 nm in CA/SPH nanofibers (Figure 2a,b). In contrast, PCL nanofibers showed thicker fiber diameter (644.04 ± 5.20 nm) than CA-based nanofibers. Pore diameter ranges from 6.63 ± 0.14 µm in CA scaffolds to 6.13 ± 0.17 µm in CA/SPH scaffolds, while for PCL scaffold pore size decreased to 3.82 ± 0.38 µm. Next, scaffold thickness can be controlled by spinning a different amount of polymer solution (Figure S3a–c, Supporting Information).
Figure S3d (Supporting Information) showed that our system is able to produce fiber scaffolds with thickness ranging from a couple hundred micrometers to several millimeters. However, scaffold thickness does not significantly change pore diameters of nanofiber scaffolds (Figure S3e, Supporting Information). The stiffness of the CA and the CA/SPH nanofibers was between 100 and 600 kPa in the longitudinal and transverse directions, respectively (see Figure 2c and Table S2, Supporting Information). On the other hand, the stiffness of the PCL nanofibers was in a MPa range, much stiffer when compared to native skin or CA-based nanofibers. These results suggest that fiber and pore diameter of both CA and CA/SPH nanofibers are well suited to support growth and migration of human dermal fibroblasts and that their stiffness resembles that of human skin ECM.[31]
Next, we investigated the fiber surface roughness that affects cellular behaviors at both nano- and microscales since cells sense and react differently on various microtopogra-phies.[32] Current studies have reported that rough surfaces enhance cell adhesion, migration, and growth by triggering expression of integrin receptors and production of growth fac-tors and ECM proteins.[32] To estimate the effect of the addi-tion of SPH on the surface roughness of CA nanofibers, the average deviation (Ra) of the surface roughness was calculated from atomic force microscopy (AFM) images (Figure 2d,e). Figure 2f showed that the Ra value for the CA/SPH nanofibers (68.19 ± 4.13 nm) was significantly higher than that of the CA nanofibers (38.06 ± 7.98 nm). Several factors may account for the effect of SPH on fiber roughness: the distribution of proteins throughout the surface and inside the nanofibers (Figure 1i–l), the aggregation of different materials within the nanofibers, and the short peptides that SPH carries.
The incorporation of SPH introduces polar moieties such as hydroxyl, amino, and carboxylic groups into the fibers. This increases the hydrophilicity as well as improves cell attachment by providing cell-binding functional groups.[33,23b] High hydro-philicity and water retaining properties are vital for removing wound exudates and providing a moist environment for cell growth.[16,33] To evaluate the chemical composition influence on the hydrophilicity of the materials, we performed contact angle measurement of uniform cast films (Figure 2g). The contact angles were significantly reduced by raising the ratio of SPH in the films, indicative of increased hydrophilicity. A similar trend was seen for fibrous samples, though rapid diffusion of water into the samples was observed for all samples (Figure S4a–e, Supporting Information). The increased hydrophilicity was reflected by an increased water absorption capacity (Figure 2h). When CA was used as a backbone in nanofibers, their water-absorbing capabilities were significantly greater than that of hydrophobic PCL nanofibers which are frequently used as a backbone polymer to spin nanofiber scaffolds. The addition of SPH to the CA backbone further increased the water uptake.
An ideal nanofibrous scaffold should be highly biodegrad-able so that it is gradually replaced by natural tissues during wound healing.[34] Figure S4f (Supporting Information) shows that over a 15 d period CA/SPH nanofibers lost significantly more mass than CA or PCL nanofibers due to hydrolysis of soy proteins. The rate of soy protein hydrolysis within the hybrid nanofibers resulted in the degradation, which correlates with
Adv. Healthcare Mater. 2018, 1701175
Table 1. Spinnability of CA and SPH in HFIP.
Material
Carrier polymer
[w/v%]
Soy protein
[w/v%]
Morphology Corresponding image
CA (5) None No fiber N/A
CA (10) None Continuous fibers Figure 1c and Figure S1a
(Supporting Information)
CA (15) None Continuous fibers
with beads
Figure 1d and Figure S1b
(Supporting Information)
CA (10) SPH (1) Continuous fibers Figure 1e and Figure S1c
(Supporting Information)
CA (10) SPH (3) Continuous fibers Figure 1f and Figure S1d
(Supporting Information)
CA (10) SPH (5) Continuous fibers Figure 1g and Figure S1e
(Supporting Information)
CA (10) SPH (10) Continuous fibers
with beads
Figure 1h and Figure S1f
(Supporting Information)
None SPH (10) No fiber N/A

© 2018 WILEY-VCH Verlag GmbH & Co. KGaA, Weinheim1701175 (5 of 13)
www.advancedsciencenews.com www.advhealthmat.de
the rate of protein breakdown.[2a,34b] The lower mechanical strength and higher surface wettability of the hybrid nanofibers also contributed to their rate of degradation.[2a,34b] In addition,
the release kinetics of soy protein from CA/SPH nanofiber scaffolds resulted in a burst release of soy protein within 24 h due to the fast hydrolysis of soy protein and high hydrophilicity
Adv. Healthcare Mater. 2018, 1701175
Figure 2. Characterization of the mechanical properties and surface chemistry. a,b) Fiber diameter and pore diameter analysis for PCL (6 wt/v%), CA (10 wt/v%), and CA/SPH (10 wt/v%/5 wt/v%) nanofiber scaffolds. Bars represent standard error, n = 10 from three productions. c) Stiffness measure-ment for PCL (6 wt/v%), CA (10 wt/v%), and CA/SPH (10 wt/v%/5 wt/v%) nanofibers in the wet state on the longitudinal and transverse directions. Bars represent standard error, n = 5 from three productions, * indicates p < 0.05. AFM images of d) CA (10 wt/v%) and e) CA/SPH (10 wt/v%/5 wt/v%) nanofibers with f) roughness (Ra) of nanofibers (n = 3, FOV = 3 from three productions). g) Bright field images of water droplets on CA (10 wt/v%) and CA/SPH (10 wt/v%/5 wt/v%) cast films with contact angle analysis (n = 3 from three productions). Dots delimit water droplet and film. Scales are 5 mm. h) In vitro water absorption measurements by weight gain (n = 6 from three productions). Bars represent standard error, * indicates p < 0.05.

© 2018 WILEY-VCH Verlag GmbH & Co. KGaA, Weinheim1701175 (6 of 13)
www.advancedsciencenews.com www.advhealthmat.de
(Figure S4g, Supporting Information). After the initial burst release, a sustained soy release over two weeks was observed. The two phases of in vitro release (the initial burst and the sustained release over a long period) are typical release pro-files of nanofiber-loaded molecules.[35] Therefore, a dressing made from plant-based hybrid nanofibers could provide struc-tural cues until wound healing is completed and be naturally replaced by native tissue.
2.4. In Vitro Fibroblast Study
We hypothesized that the addition of SPH into CA nanofibers could promote wound healing—relevant cellular activity of human dermal fibroblasts (HNDF) via the presence of bioactive molecules, increased roughness, and enhanced water-retaining capabilities. In an effort to test this hypothesis, we began by analyzing several indicative markers for wound closure and tissue regeneration, including proliferation, surface coverage, migration, and infiltration of HNDFs (Figure 3, Figures S5 and S6, Supporting Information).[36] The behaviors of dermal fibro-blasts were tested in vitro because they are a critical skin cell type that remodels the dermal ECM, communicates with other skin cells (such as keratinocytes), and thus regulates dermal function.[36a,37] Cytotoxicity tests of the nanofiber scaffolds were likewise conducted as a standard preclinical experiment.[38] PCL nanofibers were used as a reference since it is one of the most common biocompatible and biodegradable synthetic polymers in nanofiber fabrication for biomedical applications.[28]
Immunostaining analysis with the Ki-67 antibody—a marker specific to proliferative nuclei[39]—showed that CA/SPH nanofibers induced higher cell proliferation than PCL or CA nanofibers (Figure S5a,b, Supporting Information). Nanofiber cytotoxicity was calculated by using a common LDH assay.[25b,38] Both CA and CA/SPH nanofiber scaffolds exhibited low cytoto-xicity, with similar values to PCL nanofibers (Figure S5c, Supporting Information). Furthermore, we observed that the cell surface coverage on the CA/SPH nanofibers was sig-nificantly higher than on the PCL and CA nanofibers after 5 d in culture (Figure 3a,b). The CA nanofibers showed greater cell coverage at day 5 and day 15 versus the PCL nanofibers. HNDFs migrated faster on CA-based nanofibers than on PCL nanofibers (Figure 3c,d), while the addition of bioac-tive SPH into CA nanofibers resulted in increased cell migra-tion compared to pure CA nanofibers. These results reflect the preferential properties of dermal ECM-mimetic CA-based nanofibers (fiber diameter, pore diameter, and stiffness as shown in Figure 2), and underscore the suboptimal properties of PCL. In addition, soy protein has been reported to trigger the expression of extracellular signal-regulated kinase (ERK), transforming growth factor (TGF β1), and integrin β1 that pro-mote cell migration.[2a,9b] In an effort to assess cell infiltration, cells were seeded on the surface of nanofiber scaffolds. Cells adhered to nanofibers and started to grow. At day 0, there is no significant difference in cell infiltration between different nanofibers (Figure S6, Supporting Information). After 15 d of cell culture, CA-based nanofibers showed an increase in cell infiltration depth compared to PCL nanofibers (Figure 3e,f and Figure S6, Supporting Information) which was again further
increased by functionalizing CA nanofibers with SPH. As CA-based nanofiber scaffolds have higher pore diameters than PCL nanofibers (Figure 2b), cells infiltrate faster on CA-based nanofibers.[29b] However, there is no significant difference in pore diameters between CA and CA/SPH nanofiber scaffolds, suggesting that the existence of SPH promoted cell migration (Figure 3c,d) and thus cells on CA/SPH nanofibers penetrated faster than CA nanofibers.
Next, immunocytochemical and Western blot analysis for integrin β1 were performed to understand the effect of SPH on cell growth and migration. The integrin β1 is an ECM pro-tein receptor which regulates the behavior of ECM proteins and cells.[40] It also enables crosstalk with other growth factors and plays a crucial role in tissue repair.[41] During wound healing, dermal fibroblasts migrate to the wound site and express inte-grin β1 to mature the developing matrix.[41] It has been found that decreased expression of integrin β1 reduces the ability of fibroblasts and keratinocytes to migrate, lay down a collagen matrix, and ultimately enable wound closure.[40] After 15 d of cell culture, immunocytochemical (Figure 4a) and Western blot (Figure 4b,c) analysis indicated that the integrin β1 expression was significantly increased on CA/SPH nanofibers, compared to CA nanofibers. These results indicate that soy protein in our scaffolds can trigger the expression of integrin β1 that in turn accelerates the cell migration and the production of new ECM proteins for wound closure. The increased integrin β1 expres-sion by functionalizing CA nanofibers with SPH is in line with previously published work that reported that soy protein pep-tides upregulated the expression of integrin β1 in fibroblasts.[2a]
In summary, our in vitro fibroblast study demonstrated that CA nanofibers supported stronger cell growth, prolifera-tion, migration, and infiltration than PCL nanofibers. These enhanced cellular activities occurred because CA provides a soft and hydrophilic backbone similar to that of a collagen matrix found in native dermal tissue. Further functionalization of CA nanofibers with SPH accelerated proliferation, growth, migra-tion, infiltration, and integrin β1 expression of HNDFs. Accord-ingly, it can be extrapolated that CA/SPH nanofibers should possess the ability to provide structural and biological cues to promote wound healing in vivo.
2.5. In Vivo Wound Healing Study in a Rodent Model
To investigate the potency of CA/SPH in vivo, we tested our nanofiber scaffolds on a mouse excisional wound splinting model.[42] Wound contraction was inhibited by suturing a sil-icon splint to the peripheral edge of the wound in an effort to study the healing process via re-epithelialization, thus improving recapitulation of the wound healing process in humans (Figure 5a and Figure S7, Supporting Information).[43] Nanofiber scaffolds were held in place with a Tegaderm film. The control group wounds received no nanofiber treatment and were only covered with the Tegaderm film. It was observed that CA/SPH nanofibers significantly accelerated wound closure (Figure 5b,c). On day 7 after surgery, CA nanofibers showed 42% faster wound closure than our control. The addition of SPH in the CA nanofibers further accelerated wound closure by 21% and showed an overall 72% increase when compared to
Adv. Healthcare Mater. 2018, 1701175

© 2018 WILEY-VCH Verlag GmbH & Co. KGaA, Weinheim1701175 (7 of 13)
www.advancedsciencenews.com www.advhealthmat.de
the nontreated control. After 14 d, the wounds treated with CA/SPH nanofibers were fully closed (Figure 5b,c). Moreover, the wound closure potentiated by CA/SPH nanofibers significantly higher than both the control and CA nanofibers.
In an effort to further assess the regenerative capacity of our treatment conditions, histological analysis of healed tissues was performed at day 14 post-surgery (Figure 6a). Restoration
of the dermal and epidermal layers are key parameters for evaluating wound healing and tissue regeneration.[42,44] It is commonly analyzed by quantifying the epithelial gap, epithe-lial thickness, and scar size.[42,44] Hematoxylin and eosin (H&E) staining confirmed our previous macroscopic observation that CA/SPH nanofiber-treated wounds were re-epithelialized at day 14 post-surgery. However, wounds from the control and
Adv. Healthcare Mater. 2018, 1701175
Figure 3. In vitro fibroblast coverage, migration, and infiltration. a) Representative confocal microscopy images of GFP-expressing human neonatal dermal fibroblasts (HNDF) on nanofibers with b) analysis of surface area covered by cells at day 0, 5, 10, and 15. Scales are 50 µm. Bars represent standard error, n = 5, FOV = 5 from three productions, * indicates p < 0.05. c) Representative binary images of tracking a single cell on nanofibers at day 0, 5, 10, and 15 for calculating d) migration speed of HNDF. Scales are 50 µm. Bars represent standard error, n = 5, FOV = 5 from three productions, * indicates p < 0.05. e) Representative 3D-recontructed confocal microscopy images of HNDF on nanofibers after 15 d of cell culture with f) quantita-tive analysis of cell infiltration depth. Bars represent standard error, n = 5 for PCL and n = 8 for CA and CA/SPH, FOV = 3 from three productions, * indicates p < 0.05.

© 2018 WILEY-VCH Verlag GmbH & Co. KGaA, Weinheim1701175 (8 of 13)
www.advancedsciencenews.com www.advhealthmat.de
CA nanofiber-treated groups remained open, resulting in epi-thelial gaps of a few hundred micrometers in diameter after 14 d of treatment (Figure 6b). In addition, the control or CA
nanofiber-treated wounds exhibited signifi-cantly thicker epidermises than CA/SPH nanofiber-treated wounds, indicating slower regeneration of the epidermis (Figure 6c). It should nonetheless be noted that the epi-dermal thicknesses of CA/SPH nanofiber-treated wounds were still higher than that of healthy tissues (Figure 6c and Figure S8, Supporting Information). We also measured the scar size using a quantitative scar index (Figure 6d),[44] which found that CA/SPH nanofibers significantly reduced the scar size compared to the control or CA nanofibers after 14 d treatment. Finally, the alignment of the newly synthesized collagen in the dermis was calculated (Figure 6e). The dermal col-lagen was significantly less aligned in CA/SPH nanofiber-treated wounds than control or CA nanofiber-treated wounds. However, the alignment of CA/SPH nanofiber-treated wounds was still higher than that of healthy tissues that possess typically basket-woven fiber organization. In line with our in vitro results, the in vivo data supported our hypoth-esis that both a nanofibrous architecture and bioactive soy protein accelerated wound closure and supported regeneration of the dermal and epidermal layers. These observa-tions also corroborate previously published results in which ECM-mimetic peptide[9c,13b] and phytoestrogens[8c,45] in soy protein pro-moted re-epithelialization and dermal tissue regeneration. When comparing our results to other reports of pro-regenerative fibrous scaf-folds that consist of natural materials (such
as ECM proteins, silk, and chitosan),[46] similar trends can be established for both wound closure rate and tissue regeneration (re-epithelialization, epidermal thinning, collagen alignment,
Adv. Healthcare Mater. 2018, 1701175
Figure 5. In vivo wound healing study with a mouse excisional wound splinting model. All wounds were covered with the Tegaderm film. Control wounds received no nanofibers. a) Schematic representation of in vivo wound healing experiment. b) Representative images of wounds from the study groups: untreated control, treated with CA nanofibers, and treated with CA/SPH nanofibers at day 0, 7, and 14. Scales are 5 mm. c) Analysis of wound closure. Fiber wound dressings were prepared from three productions for each condition. Bars represent standard error, n = 4 wounds and three mice for control, n = 5 wounds and three mice for CA and CA/SPH. * indicates p < 0.05.
Figure 4. In vitro integrin β1 expression by fibroblast. a) Representative immunostaining and b) Western blotting images for integrin β1 with c) quantitative analysis from Western blotting. Scales are 100 µm. Bars represent standard error, n = 6 for CA and n = 7 for CA/SPH from three productions, * indicates p < 0.05.

© 2018 WILEY-VCH Verlag GmbH & Co. KGaA, Weinheim1701175 (9 of 13)
www.advancedsciencenews.com www.advhealthmat.de
Adv. Healthcare Mater. 2018, 1701175
Figure 6. Histological analysis. a) H&E staining of wounds after 14 d post-surgery (untreated control, treated with CA nanofibers, and treated with CA/SPH nanofibers). In the top panel, the yellow arrows indicate the edge of the epidermal layer and the yellow dots outline the scar area. The yellow lines in the bottom panels of the zoom-in images delimit the epidermal layer in the skin tissue. Scales in the top and bottom panels are 500 and 200 µm, respectively. Quantitative analysis of b) epithelial gap, c) epithelial thickness, d) scar index, and e) collagen alignment from H&E staining images. Fiber wound dressings were prepared from three productions for each condition. Bars represent standard error, n = 3 wounds and three mice for control, n = 4 wounds and three mice for CA and CA/SPH nanofibers, n = 5 wounds and five mice for healthy tissue, at least three sections per wound, * indicates p < 0.05.

© 2018 WILEY-VCH Verlag GmbH & Co. KGaA, Weinheim1701175 (10 of 13)
www.advancedsciencenews.com www.advhealthmat.de
and scar formation). Yet, our scaffolds present a significant advantage gained by their inherent plant-based origin as they are free of animal-derived materials or synthetic carrier poly-mers that raise manufacturing cost, immunogenicity, and eth-ical concerns.
3. Conclusions
To the best of our knowledge, the present study reports the first fabrication and optimization of CA/SPH nanofibers produced using an RJS system. CA and SPH molecules were homoge-neously distributed along the nanofibers for equal functionality at the fiber surface. Using CA as a co-spinning polymer ena-bled recapitulation of fiber morphology, fiber diameter, pore diameter, and stiffness of the native ECM thus creating optimal conditions for dermal fibroblasts to thrive. Functionalization of CA nanofibers with SPH enhanced surface roughness, hydro-philicity, and water absorption capacity. The in vitro study indi-cated that CA/SPH nanofibers increased proliferation, growth, migration, and infiltration of fibroblasts and exhibited low cyto-toxicity, compared to both PCL and CA nanofibers. The addition of SPH into CA nanofibers further upregulated the expression of integrin β1, which has been attributed to enhanced cell migration and tissue regeneration. Finally, the in vivo mouse study revealed that CA/SPH nanofibers accelerated wound clo-sure and tissue regeneration in comparison to CA nanofibers or the nontreated control. Altogether, these findings confirmed the utility of CA/SPH nanofibers for enhanced wound healing. We envision that our one-step, cost-effective, and regenerative scaffolds comprised of plant-based materials will be the next generation of regenerative dressings to push the envelope of nanofiber technology and the wound care market.
4. Experimental SectionMaterials: PCL (Mn 70 000–90 000, Sigma-Aldrich), CA (Mn 50 000,
Sigma-Aldrich), SPH (Amisoy, Sigma-Aldrich), and HFIP (Oakwood Chemical) were used as received.
Fiber Fabrication by Rotary Jet Spinnings: Nanofibers were spun by using RJS system as described in previous studies.[25,26] Briefly, CA and CA/SPH with different compositions and concentrations (weight per volume percent, wt/v%) were dissolved in HFIP and stirred for overnight. As a reference group, PCL (6 wt/v%) was also dissolved in HFIP. After mixing, solutions were flowed to the rotating reservoir through polyfluoroalkoxy alkane tubing (Saint-Gobain) at 2 mL min−1 by using an automatic syringe pump (Harvard Apparatus). Then, the solutions (10 mL in total) were sprayed from the reservoir at 60 000 rpm for 5 min, elongating polymers into nanofibers and evaporating HFIP rapidly in the air from the orifice (diameter of 360 µm). The spun nanofibers were dried overnight in a desiccator to fully remove excess solvent. For cell culture, the spun nanofibers were collected on coverslips and sterilized overnight under UV light.
Scanning Electron Microscopy (SEM): Fiber samples were imaged by using a field emission scanning electron microscopy (FESEM, Carl Zeiss). The fiber samples were mounted on sample stubs, sputter-coated with 5 nm thickness of Pt/PD (Denton Vacuum), and imaged by using FESEM.
Characterization of Chemical Compositions: ATR-FTIR (Bruker) was used to obtain FTIR spectra of nanofibers over 600–4000 cm−1 at a resolution of 2 cm−1 with 16 scans. The samples were mounted on
sample stage and contacted with ATR-crystal for measurement. The FTIR spectra of the dried samples were measured and normalized from 0 to 1. For Gaussian curve fitting and area analysis, OriginPro 8.6 software (Origin Lab Corporation) was used. For statistical analysis, n = 3 from three productions for each condition. XPS (K-Alpha XPS system, Thermo Scientific) was used to further evaluate fiber surface composition. Fibrous test samples were prepared on silicon wafer substrates. Survey and high-resolution elemental spectra were obtained using monochromatized Al Kα radiation (pass energy 200 eV). An argon flood gun was applied to offset sample charging. Peak detection and high-resolution C1s peaks were deconvoluted using Lorentzian/Gaussian product mix (30% L) functions. For statistical analysis, n = 3 from three productions for each condition. EDS in FESEM was used to investigate elemental mapping of nitrogen (NK near 0.392 eV) and carbon (CK near 0.277 eV) atoms, together with corresponding SE2 images. The fiber sample was also sputter-coated with Pd/Pt on sample stub and imaged by using EDS.
Characterization of Fiber Diameter, Pore Diameter, and Fiber Thickness: Fiber diameter, pore diameter, and fiber thickness were analyzed by using SEM images of the nanofibers and ImageJ (NIH) with the plug-in DiameterJ.[47] For fiber thickness analysis, nanofiber scaffolds were prepared from different injection volume (10, 30, and 60 mL in total) and the cross-sectioned scaffolds were imaged and analyzed. DiameterJ was used to determine fiber and pore diameters by using algorithm as described in previous study.[47] Here, the pore diameters refer to the pores of the fibrous scaffolds (between fibers). For statistical analysis, n = 10 from three productions for each condition.
Biaxial Tensile Test for Stiffness Measurement: The stiffness in the wet state was determined by using biaxial tensile tester (CellScale). The spun fiber scaffolds were loaded by using clamps to hold the samples and immersed in phosphate buffered saline (PBS, ThermoFisher Scientific) at 37 °C. Sample was loaded equibiaxially at a strain rate of 5% s−1 to 20% strain. A built-in software (CellScale) was used to record force/displacement measurements and images at 15 Hz. By using these measurements and the thickness of the samples, stress–strain curves were then produced. Stiffness was determined by calculating the slope of the stress–strain curves. For statistical analysis, n = 5 from three productions for each condition.
AFM for Roughness Measurement: Roughness (average deviation, Ra) was calculated by using built-in software in AFM (MFP-3D, Asylum). The fiber samples were mounted on sample stage and imaged with tapping mode.[48] For statistical analysis, n = 3 (field of view (FOV) = 3) from three productions for each condition.
Contact Angle and Water Absorption Measurements: The cast film samples were prepared on coverslips using spin coater (at 2000 rpm for 1 min). The nanofiber samples were directly spun onto coverslips. A camera was used to record water droplet formation on the surfaces of the substrates. Contact angle was calculated by using ImageJ with the plug-in Drop Shape Analysis.[49] For statistical analysis, n = 3 from three productions for each condition. Water absorbency was measured as % mass gain like a standard method reported before.[50] First, dry weight of the samples was recorded. The samples were immersed in PBS for 24 h at 37 °C. The excess PBS on the wet samples was removed by placing it on a paper towel. Then, weight of the water-absorbing samples was measured. The water absorption ability was defined as described below
100 ( 2 1)/ 1A W W W= × − (1)
where A is the water absorption ability (%), W1 is the weight before wet, and W2 is the weight after wet. For statistical analysis, n = 3 from three productions for each condition.
Biodegradation Measurement: In vitro biodegradation was measured as % mass loss as detailed in previous studies.[2a,34b,51] The initial weight of the scaffold was measured, after which the samples were immersed in PBS at 37 °C and 5% CO2. At day 5, 10, and 15, the samples were washed three times with fresh PBS and dried in an oven at 60 °C overnight. After complete dehydration, the weight of the dried samples was measured. The in vitro biodegradation was defined as follows
Adv. Healthcare Mater. 2018, 1701175
© 2018 WILEY-VCH Verlag GmbH & Co. KGaA, Weinheim1701175 (11 of 13)
www.advancedsciencenews.com www.advhealthmat.de
Adv. Healthcare Mater. 2018, 1701175
100 ( 3 1)/ 1D W W W= × − (2)
where D is the in vitro biodegradation (%), W1 is the initial weight, and W3 is the final weight after degradation. For statistical analysis, n = 3 from three productions for each condition.
Soy Protein Release Kinetics: In vitro release profile of soy protein from the nanofibers was measured as % loss of amide I peaks. The samples were immersed in PBS at 37 °C and 5% CO2. At day 0, 3, 5, 7, and 15, the samples were washed three times with fresh PBS and freeze-dried. The FTIR spectra of the dried samples were measured and normalized from 0 to 1. The relative areas of amide I peaks were analyzed from the normalized spectrum to calculate the % release of soy protein from the scaffolds. For statistical analysis, n = 3 from three productions for each condition.
Cell Culture: Green fluorescent protein (GFP)-expressing HNDFs (Angio-Proteomie) were properly treated as described in protocol from the manufacturer (Angio-Proteomie) for cell culture. Briefly, HNDFs were delivered at passage 3 in a frozen vial and stored in a liquid nitrogen tank before use. Cells were subcultured to passage 7 with Dulbecco’s modified eagle medium (DMEM, ThermoFisher Scientific) containing fetal bovine serum (FBS, 5%) and antibiotics (penicillin-streptomycin, ThermoFisher Scientific, 1%) in a T25 flask at 37 °C incubator with 5% CO2 and 21% O2. Once the cells reach passage 7, trypsin/ ethylenediaminetetraacetic acid solution (trypsin/EDTA, Lonza, 2 mL) was added to the T25 flask. Seeding density was fixed at 30 000 cells per sample. Cell media was changed every 2 d before imaging and fixation.
Analysis of Growth, Migration, and Infiltration of Dermal Fibroblasts: GFP-expressing HDNFs on the fibers were imaged by using confocal microscopy (Zeiss LSM 5 LIVE) at 37 °C in a temperature-controlled chamber. 4-(2-Hydroxyethly)-1-piperazineethanesulfonic acid (HEPES, ThermoFisher Scientific, 2.5%) buffer was added to the media during imaging in an effort to keep the pH constant. For cellular growth study, the intensity of GFP-expressing HNDF per area was calculated from the confocal images by using ImageJ. For cellular migration study, the migration of GFP-expressing cells on fibers was tracked (1 frame/10 min for at least 40 frames). Once all images were collected, ImageJ plug-in StackReg was used to correct the center of each image.[52] For statistical analysis, n = 5 (FOV = 5) from three productions for each condition. Migration of each cell was analyzed by using the plug-in Mtrack2 in ImageJ.[53] The Mtrack2 calculates the total distance each cell has migrated. Migration speed of cells was calculated by dividing the total distance by total imaging time. For statistical analysis, n = 5 (FOV = 5) from three productions for each condition. In cellular infiltration study, z-stack confocal images of GFP-expressing cells on fibers were captured at 15 d of cell culture. The cell infiltration depth from the z-stack images was calculated using the z-axis profile function in ImageJ as previously reported.[26d] The cross-sectional view (in yz-plane) of cells was processed from ImageJ by using the orthogonal view function. For statistical analysis, n = 5 for PCL and n = 8 for CA and CA/SPH nanofibers (FOV = 3) from three productions for each condition.
Cytotoxicity Measurement: In vitro cytotoxicity of cells on the fibers was measured by using lactate dehydrogenase (LDH) cytotoxicity assay (Promega) as described previously.[25b,38] Briefly, HNDFs were cultured on nanofibers for 15 d and successively incubated with reaction solution and stop solution (1 m acetic acid) from the assay kit. A commercial plate reader was used to measure absorbance at 490 nm. The % cytotoxicity was defined as follows
%Cytotoxicity 100 /S C M C) )( (= × − − (3)
where S is the readout from the sample, C is the readout from the control (medium only without cell), and M is the readout from maximum LDH release.[25b,38] For statistical analysis, n = 17 in triplicate from three productions for each condition. For box plot in Figure S3 (Supporting Information), the box range is 25–75%, the whisker range is 10–90% using OriginPro 8.6 software.
Immunocytochemical Analysis: After 15 d of culture, HNDFs grown on nanofibers were fixed in paraformaldehyde (PFA, 4%) and Triton-X (0.05%) for 10 min. Following fixation, samples were incubated with primary antibody (rabbit polyclonal anti-Ki67 with 4′,6-diamidino-2-phenylindole dihydrochloride (DAPI) for proliferation study or rabbit monoclonal anti-integrin β1 antibody, Abcam) and with secondary antibody (goat anti-rabbit IgG (H+L) secondary antibody with Alexa fluor 546, Invitrogen) during 1 h at room temperature for both primary and secondary antibody incubation. Following immunostaining, samples were mounted on glass slides by using Prolong Gold anti-fade agent (Invitrogen) and imaged on the confocal microscopy. Cell proliferation was calculated by dividing the number of Ki-67 positive cells by the number of DAPI-positive cells. For statistical analysis, n = 5 for PCL and n = 6 for CA and CA/SPH (FOV = 25) from three productions for each condition.
Western Blot Analysis: HNDFs were cultured on nanofibers for 15 d and were lysed at 4 °C using radioimmunoprecipitation assay (RIPA) lysis buffer (SLBG8489, Sigma) with Complete Mini (11836153001, Roche Diagnostic) and Halt Protease and Phosphotase Inhibitor (1861281, ThermoFisher Scientific). A capillary-based Wes Simple Western (ProteinSimple) was used to detect and quantify the expression of integrin β1 in cell lysates following the manufacturer’s protocol. In brief, each capillary loaded 5 µg of sample lysates and separated proteins by size. The samples were incubated with primary antibodies for integrin β1 and glyceraldehyde 3-phosphate dehydrogenase (GAPDH) as a loading control (ab52971 and ab9485, respectively, ABCAM). Target proteins were labeled with secondary antibodies and chemiluminescent reagents provided by the manufacturer (ProteinSimple). Signals were detected and quantified using CompassSoftware (ProteinSimple). Expression of integrin β1 was normalized to GAPDH loading control and compared across sample conditions. For statistical analysis, n = 6 for CA and n = 7 for CA/SPH from three productions for each condition.
Mouse Excisional Wound Splinting Model: All mouse wound healing experiments were performed using IACUC approved protocols (Protocol ID 11-11). Based on the previous publications,[43] the mouse excisional splinting model was carried out in order to analyze cutaneous wound closure in murine skin by excluding wound contraction. Briefly, splinting rings were prepared by cutting 8 mm holes in a 0.5 mm thick silicon sheet (Grace Bio-Labs) using a sterile biopsy punch (Integra Miltex). The prepared rings were washed and made aseptic with ethanol (70% vol/vol), and then were air-dried in a sterile culture hood before surgery. C57BL/6NCrl male mice (Charles River Laboratories, 52 d old) were anesthetized with isoflurane through the duration of procedure. Once anesthesia was confirmed by a toe pinch test, the dorsal side of mice was shaved using electric and manual razor. After hair removal, the skin was cleaned with betadine (Santa Cruz Biotechnology) and ethanol (70% vol/vol). The full thickness excisional wounds were created on the midline by punching through the skin with a 6-mm-diameter sterile biopsy punch. The punched tissues were used for histological analysis of healthy skin (day 0). An instant-bonding adhesive (Krazy glue) was put on one side of a splint. The splints were fixed into place around the wound with instant bonding adhesive followed by suturing with nylon suture (Ethicon). Nanofiber wound dressings were applied to the wound and covered with Tegaderm (Nexcare) patches to keep the scaffolds in place and the surgical area clean. Control wounds received no nanofibers and were covered with Tegaderm patches only. Tegaderm is a clinical standard wound dressing.[43] The mice were monitored daily. Before tissue harvest on day 7 and 14, mice were sacrificed via IACUC approved methods.
In Vivo Wound Closure Analysis: Wound area was photographed with a digital camera on day 0, 7, and 14. The wound area was manually quantified using ImageJ. Wound closure was defined as described below[43a]
Wound closure % 100 /O A O)()( = × − (4)
where O is the area of the original wound and A is the area of the wound at a given time point. Fiber wound dressings were prepared from three productions for each condition. For statistical analysis, n = 4 wounds

© 2018 WILEY-VCH Verlag GmbH & Co. KGaA, Weinheim1701175 (12 of 13)
www.advancedsciencenews.com www.advhealthmat.de
Adv. Healthcare Mater. 2018, 1701175
and three mice for control, n = 5 wounds and three mice for CA and CA/SPH.
Histological Analysis: Histological analysis was preformed based on previously published methods.[43a] Tissues were harvested from day 0 and 14 and fixed with PFA (4%) at 4 °C overnight. The fixed tissue was washed using PBS five times for 30 min each. The tissue was incubated with sucrose (Sigma, 20 and 40% wt/vol) in PBS at room temperature for 2 h each. Then, the tissue was embedded in O.C.T. compound (Electron Microscopy Science) with cryomold (Tissue-Tek). The frozen wound tissues were sectioned with 10 µm thickness, stained with H&E, and imaged by slide scanner (Olympus VS120). Re-epithelialization was analyzed by manually calculating distance among the newly synthesized epithelial layers from H&E staining tissue sections (marked as yellow arrows in Figure 5a).[42] Epithelial thickness was also manually measured using ImageJ. Scar index was quantified by using a previously published method.[44] Briefly, scar area (yellow dotted area in Figure 5a) and dermal thickness were manually measured using ImageJ. Then, scar index was defined as described below[44]
Scar index /S D= (5)
where S is the scar area (µm2) and D is the average dermal thickness (µm). Dermal collagen alignment in the wounds was calculated by using OrientationJ in ImageJ as previously published.[54] The OrientationJ computes the coherency that is between 0 (isotropic) and 1 (anisotropic). Fiber wound dressings were prepared from three productions for each condition. For statistical analysis, n = 3 wounds and three mice for control, n = 4 wounds and three mice for CA and CA/SPH nanofibers, n = 5 wounds and five mice for healthy tissue, at least three sections per wound.
Statistical Analysis: All data are displayed as mean ± standard error of mean (SEM). One-way analysis of variance (ANOVA) with the post hoc Tukey’s test in OriginPro 8.6 software was used for statistical comparisons. Statistical significance was determined at *p < 0.05.
Supporting InformationSupporting Information is available from the Wiley Online Library or from the author.
AcknowledgementsThis work was funded by the Wyss Institute for Biologically Inspired Engineering at Harvard University. This research was supported by the Harvard University Materials Research Science and Engineering Center (MRSEC), NSF Award No. DMR-1420570. S.A. received Fulbright Scholarship (Fulbright Foreign Student Program for 2014–2015) from the U.S. Department of State to accomplish this research. This work was also in part conducted at Harvard Center for Nanoscale Systems (CNS), which is a member of the National Nanotechnology Infrastructure Network (NNIN), supported by the National Science Foundation under NSF Award No. 1541959. The authors thank Dana-Farber/Harvard Cancer Center in Boston, MA, for the use of the Rodent Histopathology Core, which provided tissue sectioning, embedding, and H&E staining services for histology analysis. Dana-Farber/Harvard Cancer Center was supported in part by a NCI Cancer Center Support Grant No. NIH 5 P30 CA06516. The authors acknowledge the Neurobiology Department and the Neurobiology Imaging Facility for consultation and instrument availability that supported this work. This facility was supported in part by the Neural Imaging Center as part of an NINDS P30 Core Center Grant No. NS072030. The content is solely the responsibility of the authors and does not necessarily represent the official views of the National Institutes of Health. The authors appreciate the graphic works provided by Grant Gonzalez.
Conflict of InterestThe authors declare no conflict of interest.
Keywordsbiomedical applications, composite materials, fibers, tissue engineering
Received: October 3, 2017Revised: December 22, 2017
Published online:
[1] a) F. M. Sacks, Circulation 2006, 113, 1034; b) S. M. Potter, J. A. Baum, H. Teng, R. J. Stillman, N. F. Shay, J. Erdman, Am. J. Clin. Nutr. 1998, 68, 1375S.
[2] a) L. Lin, A. Perets, Y.-E. Har-el, D. Varma, M. Li, P. Lazarovici, D. L. Woerdeman, P. I. Lelkes, J. Tissue Eng. Regener. Med. 2013, 7, 994; b) S. Tansaz, A. R. Boccaccini, J. Biomed. Mater. Res., Part A 2016, 104, 553.
[3] Y. Tokudome, K. Nakamura, M. Kage, H. Todo, K. Sugibayashi, F. Hashimoto, Int. J. Food Sci. Nutr. 2012, 63, 689.
[4] a) K. B. Chien, E. Makridakis, R. N. Shah, Tissue Eng., Part C 2013, 19, 417; b) K. B. Chien, R. N. Shah, Acta Biomater. 2012, 8, 694.
[5] a) K. D. R. Setchell, J. Am. Coll. Nutr. 2001, 20, 354S; b) C. R. Cederroth, S. Nef, Mol. Cell. Endocrinol. 2009, 304, 30.
[6] P. Ascenzi, A. Bocedi, M. Marino, Mol. Aspects Med. 2006, 27, 299.[7] M. E. Mendelsohn, R. H. Karas, N. Eng. J. Med. 1999, 340, 1801.[8] a) G. Hall, T. J. Phillips, J. Am. Acad. Dermatol. 2005, 53, 555;
b) G. S. Ashcroft, J. Dodsworth, E. V. Boxtel, R. W. Tarnuzzer, M. A. Horan, G. S. Schultz, M. W. Ferguson, Nat. Med. 1997, 3, 1209; c) E. Emmerson, L. Campbell, G. S. Ashcroft, M. J. Hardman, Mol. Cell. Endocrinol. 2010, 321, 184.
[9] a) M. Santin, L. Ambrosio, Expert Rev. Med. Devices 2008, 5, 349; b) J. Lee, K.-B. Roh, S.-C. Kim, J. Lee, D. Park, J. Nutr. Biochem. 2012, 23, 1341; c) Y.-E. Har-el, J. A. Gerstenhaber, R. Brodsky, R. B. Huneke, P. I. Lelkes, Wound Med. 2014, 5, 9.
[10] a) A. V. Sirotkin, A. H. Harrath, Eur. J. Pharmacol. 2014, 741, 230; b) S.-Y. Hsia, Y.-H. Hsiao, W.-T. Li, J.-F. Hsieh, Sci. Rep. 2016, 6, 35718.
[11] a) H. Hong, M. R. Landauer, M. A. Foriska, G. D. Ledney, J. Basic Microbiol. 2006, 46, 329; b) A. Ben Arfa, L. Preziosi-Belloy, P. Chalier, N. Gontard, J. Agric. Food. Chem. 2007, 55, 2155.
[12] B. K. Chacko, R. T. Chandler, A. Mundhekar, N. Khoo, H. M. Pruitt, D. F. Kucik, D. A. Parks, C. G. Kevil, S. Barnes, R. P. Patel, Am. J. Physiol. 2005, 289, H908.
[13] a) E. Penta-Ramos, Y. Xiong, J. Food Sci. 2002, 67, 2952; b) S. Babajafari, M. Akhlaghi, S. M. Mazloomi, M. Ayaz, A. Noorafshan, P. Jafari, A. Hojhabrimanesh, Burns 2017, S0305, 30310.
[14] a) G. Jenkins, L. J. Wainwright, R. Holland, K. E. Barrett, J. Casey, Int. J. Cosmet. Sci. 2014, 36, 22; b) T. Izumi, M. Saito, A. Obata, M. Arii, H. Yamaguchi, A. Matsuyama, J. Nutr. Sci. Vitaminol. 2007, 53, 57.
[15] a) K. A. Rieger, N. P. Birch, J. D. Schiffman, J. Mater. Chem. B 2013, 1, 4531; b) A. J. Hassiba, M. E. El Zowalaty, G. K. Nasrallah, T. J. Webster, A. S. Luyt, A. M. Abdullah, A. A. Elzatahry, Nanomedi-cine 2016, 11, 715.
[16] J. S. Boateng, K. H. Matthews, H. N. Stevens, G. M. Eccleston, J. Pharm. Sci. 2008, 97, 2892.
[17] a) S. G. Kumbar, R. James, S. P. Nukavarapu, C. T. Laurencin, Biomed. Mater. 2008, 3, 034002; b) S. A. Sell, P. S. Wolfe, K. Garg, J. M. McCool, I. A. Rodriguez, G. L. Bowlin, Polymers 2010, 2, 522.

© 2018 WILEY-VCH Verlag GmbH & Co. KGaA, Weinheim1701175 (13 of 13)
www.advancedsciencenews.com www.advhealthmat.de
Adv. Healthcare Mater. 2018, 1701175
[18] E. S. Place, J. H. George, C. K. Williams, M. M. Stevens, Chem. Soc. Rev. 2009, 38, 1139.
[19] a) Y. Y. Peng, V. Glattauer, J. A. Ramshaw, J. A. Werkmeister, J. Biomed. Mater. Res., Part A 2010, 93, 1235; b) W. Liu, J. A. Burdick, G. J. van Osch, Tissue Eng., Part A 2013, 19, 1489.
[20] S. Zhong, Y. Zhang, C. Lim, Wiley Interdiscip. Rev.: Nanomed. Nano-biotechnol. 2010, 2, 510.
[21] a) M. Thirugnanaselvam, N. Gobi, S. A. Karthick, Fibers Polym. 2013, 14, 965; b) S. Curt, M. Subirade, M. Rouabhia, Tissue Eng., Part A 2009, 15, 1223.
[22] W.-J. Li, C. T. Laurencin, E. J. Caterson, R. S. Tuan, F. K. Ko, J. Biomed. Mater. Res. 2002, 60, 613.
[23] a) S. Sinha-Ray, Y. Zhang, A. L. Yarin, S. C. Davis, B. Pourdeyhimi, Biomacromolecules 2011, 12, 2357; b) X. Xu, L. Jiang, Z. Zhou, X. Wu, Y. Wang, ACS Appl. Mater. Interfaces 2012, 4, 4331; c) S. Sett, M. W. Lee, M. Weith, B. Pourdeyhimi, A. L. Yarin, J. Mater. Chem. B 2015, 3, 2147.
[24] a) K. Y. Lee, L. Jeong, Y. O. Kang, S. J. Lee, W. H. Park, Adv. Drug Delivery Rev. 2009, 61, 1020; b) J. Miao, R. C. Pangule, E. E. Paskaleva, E. E. Hwang, R. S. Kane, R. J. Linhardt, J. S. Dordick, Biomaterials 2011, 32, 9557; c) K. Rodríguez, P. Gatenholm, S. Renneckar, Cellulose 2012, 19, 1583; d) R. Huang, W. Li, X. Lv, Z. Lei, Y. Bian, H. Deng, H. Wang, J. Li, X. Li, Biomaterials 2015, 53, 58.
[25] a) M. R. Badrossamay, H. A. McIlwee, J. A. Goss, K. K. Parker, Nano Lett. 2010, 10, 2257; b) M. R. Badrossamay, K. Balachandran, A. K. Capulli, H. M. Golecki, A. Agarwal, J. A. Goss, H. Kim, K. Shin, K. K. Parker, Biomaterials 2014, 35, 3188.
[26] a) P. Mellado, H. A. McIlwee, M. R. Badrossamay, J. A. Goss, L. Mahadevan, K. K. Parker, Appl. Phys. Lett. 2011, 99, 203107; b) H. M. Golecki, H. Yuan, C. Glavin, B. Potter, M. R. Badrossamay, J. A. Goss, M. D. Phillips, K. K. Parker, Langmuir 2014, 30, 13369; c) G. M. Gonzalez, L. A. MacQueen, J. U. Lind, S. A. Fitzgibbons, C. O. Chantre, I. Huggler, H. M. Golecki, J. A. Goss, K. K. Parker, Macromol. Mater. Eng. 2017, 302; d) A. K. Capulli, M. Y. Emmert, F. S. Pasqualini, D. Kehl, E. Caliskan, J. U. Lind, S. P. Sheehy, S. J. Park, S. Ahn, B. Weber, J. A. Goss, S. P. Hoerstrup, K. K. Parker, Biomaterials 2017, 133, 229.
[27] A. Achouri, W. Zhang, X. Shiying, Food Res. Int. 1998, 31, 617.[28] Q. P. Pham, U. Sharma, A. G. Mikos, Tissue Eng. 2006, 12, 1197.[29] a) T. Hodgkinson, X.-F. Yuan, A. Bayat, J. Tissue Eng. 2014, 5,
204173141455166; b) J. L. Lowery, N. Datta, G. C. Rutledge, Bio-materials 2010, 31, 491; c) Z.-M. Huang, Y.-Z. Zhang, M. Kotaki, S. Ramakrishna, Compos. Sci. Technol. 2003, 63, 2223.
[30] a) D. E. Discher, Science 2005, 310, 1139; b) R. G. Wells, Hepatology 2008, 47, 1394.
[31] a) P. G. Agache, C. Monneur, J. L. Leveque, J. De Rigal, Arch. Dermatol. Res. 1980, 269, 221; b) X. Liang, S. Boppart, IEEE Trans. Biomed. Eng. 2010, 57, 953; c) O. Kuwazuru, J. Saothong, N. Yoshikawa, Med. Eng. Phys. 2008, 30, 516; d) C. Pailler-Mattei, S. Bec, H. Zahouani, Med. Eng. Phys. 2008, 30, 599; e) J.-F. Pan, N.-H. Liu, H. Sun, F. Xu, PLoS One 2014, 9, e112885.
[32] a) T.-W. Chung, D.-Z. Liu, S.-Y. Wang, S.-S. Wang, Biomaterials 2003, 24, 4655; b) C. Xu, F. Yang, S. Wang, S. Ramakrishna, J. Biomed. Mater. Res. 2004, 71A, 154.
[33] G. Jin, M. P. Prabhakaran, D. Kai, S. K. Annamalai, K. D. Arunachalam, S. Ramakrishna, Biomaterials 2013, 34, 724.
[34] a) D. W. Hutmacher, Biomaterials 2000, 21, 2529; b) J. Xue, M. He, H. Liu, Y. Niu, A. Crawford, P. D. Coates, D. Chen, R. Shi, L. Zhang, Biomaterials 2014, 35, 9395.
[35] J. Hu, M. P. Prabhakaran, L. Tian, X. Ding, S. Ramakrishna, RSC Adv. 2015, 5, 100256.
[36] a) B. Eckes, P. Zigrino, D. Kessler, O. Holtkötter, P. Shephard, C. Mauch, T. Krieg, Matrix Biol. 2000, 19, 325; b) G. C. Gurtner, S. Werner, Y. Barrandon, M. T. Longaker, Nature 2008, 453, 314; c) A. K. Ekaputra, G. D. Prestwich, S. M. Cool, D. W. Hutmacher, Biomaterials 2011, 32, 8108; d) J. Jiang, Z. Li, H. Wang, Y. Wang, M. A. Carlson, M. J. Teusink, M. R. MacEwan, L. Gu, J. Xie, Adv. Healthcare Mater. 2016, 5, 2993.
[37] a) F. Grinnell, Trends Cell Biol. 2000, 10, 362; b) J. M. Sorrell, J. Cell Sci. 2004, 117, 667; c) G. Sriram, P. L. Bigliardi, M. Bigliardi-Qi, Eur. J. Cell Biol. 2015, 94, 483.
[38] F. K.-M. Chan, K. Moriwaki, M. J. De Rosa, Methods Mol. Biol. 2013, 979, 65.
[39] T. Scholzen, J. Gerdes, J. Cell. Physiol. 2000, 182, 311.[40] a) S. Liu, X. Shi-wen, K. Blumbach, M. Eastwood, C. P. Denton,
B. Eckes, T. Krieg, D. J. Abraham, A. Leask, J. Cell Sci. 2010, 123, 3674; b) C. Huang, X. Fu, J. Liu, Y. Qi, S. Li, H. Wang, Biomate-rials 2012, 33, 1791; c) R. Grose, C. Hutter, W. Bloch, I. Thorey, F. M. Watt, R. Fässler, C. Brakebusch, S. Werner, Development 2002, 129, 2303; d) J. Li, J. Chen, R. Kirsner, Clin. Dermatol. 2007, 25, 9.
[41] C. Margadant, A. Sonnenberg, EMBO Rep. 2010, 11, 97.[42] R. D. Galiano, J. Michaels V, M. Dobryansky, J. P. Levine,
G. C. Gurtner, Wound Repair Regener. 2004, 12, 485.[43] a) X. Wang, J. Ge, E. E. Tredget, Y. Wu, Nat. Protoc. 2013, 8, 302;
b) D. R. Griffin, W. M. Weaver, P. O. Scumpia, D. Di Carlo, T. Segura, Nat. Mater. 2015, 14, 737.
[44] H. Khorasani, Z. Zheng, C. Nguyen, J. Zara, X. Zhang, J. Wang, K. Ting, C. Soo, Am. J. Pathol. 2011, 178, 621.
[45] a) H. Marini, F. Polito, D. Altavilla, N. Irrera, L. Minutoli, M. Calò, E. Adamo, M. Vaccaro, F. Squadrito, A. Bitto, Br. J. Pharmacol. 2010, 160, 1185; b) E. Park, S. M. Lee, I.-K. Jung, Y. Lim, J.-H. Kim, Biochem. Biophys. Res. Commun. 2011, 410, 514; c) L. Tie, Y. An, J. Han, Y. Xiao, Y. Xiaokaiti, S. Fan, S. Liu, A. F. Chen, X. Li, J. Nutr. Biochem. 2013, 24, 88.
[46] a) K. Ma, S. Liao, L. He, J. Lu, S. Ramakrishna, C. K. Chan, Tissue Eng., Part A 2011, 17, 1413; b) E. S. Gil, B. Panilaitis, E. Bellas, D. L. Kaplan, Adv. Healthcare Mater. 2013, 2, 206; c) F. Anjum, N. A. Agabalyan, H. D. Sparks, N. L. Rosin, M. S. Kallos, J. Biernaskie, Sci. Rep. 2017, 7, 10291; d) S. L. Levengood, A. E. Erickson, F.-C. Chang, M. Zhang, J. Mater. Chem. B 2017, 5, 1822; e) H.-L. Xu, P.-P. Chen, D.-L. ZhuGe, Q.-Y. Zhu, B.-H. Jin, B.-X. Shen, J. Xiao, Y.-Z. Zhao, Adv. Healthcare Mater. 2017, 6, 1700344.
[47] N. A. Hotaling, K. Bharti, H. Kriel, C. G. Simon, Biomaterials 2015, 61, 327.
[48] L. F. Deravi, T. Su, J. A. Paten, J. W. Ruberti, K. Bertoldi, K. K. Parker, Nano Lett. 2012, 12, 5587.
[49] A. Stalder, G. Kulik, D. Sage, L. Barbieri, P. Hoffmann, Colloids Surf., A 2006, 286, 92.
[50] X. Liu, T. Lin, Y. Gao, Z. Xu, C. Huang, G. Yao, L. Jiang, Y. Tang, X. Wang, J. Biomed. Mater. Res., Part B 2012, 100B, 1556.
[51] J. Lin, C. Li, Y. Zhao, J. Hu, L.-M. Zhang, ACS Appl. Mater. Interfaces 2012, 4, 1050.
[52] P. Thevenaz, U. Ruttimann, M. Unser, IEEE Trans. Image Process. 1998, 7, 27.
[53] D. R. Klopfenstein, Mol. Biol. Cell 2004, 15, 3729.[54] R. Rezakhaniha, A. Agianniotis, J. T. C. Schrauwen, A. Griffa,
D. Sage, C. V. C. Bouten, F. N. van de Vosse, M. Unser, N. Stergiopulos, Biomech. Model. Mechanobiol. 2012, 11, 461.