sow longevity – its improvement and economic importance ken stalder department of animal science...
TRANSCRIPT

Sow Longevity – Its Improvement and Economic Importance
Ken Stalder
Department of Animal Science
Iowa State University

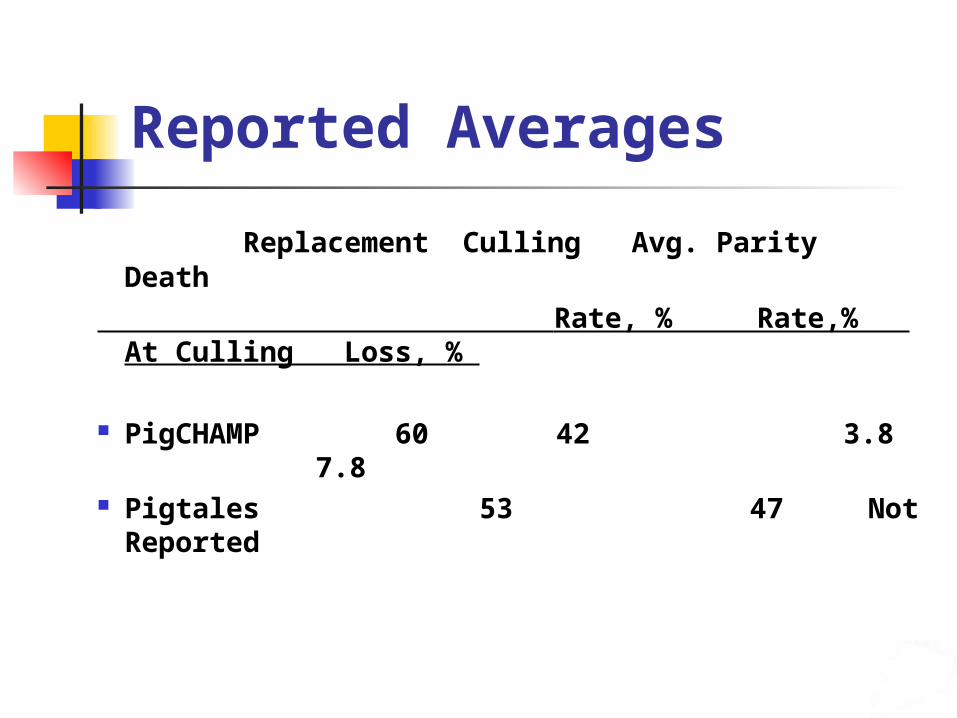
Replacement Culling Avg. Parity Death
Rate, % Rate,% At Culling Loss, %
PigCHAMP 60 42 3.8 7.8 Pigtales 53 47 Not Reported
Reported Averages

Worldwide Replacement Rates Australian average 63.8% replacement from
1992 through 2002 Brazil 2002 averaged 55% replacement rate,
43% culling rate, 5.5% death loss, and average parity of culled sows of 4.16.
Canada 2002 averaged 58% replacement rate, 39.5% culling rate, 6.5% death loss, and average parity of culled sows of 4.71.
Japan 2000 averaged 47.6% replacement rate, 28.6% culling rate, 5.3% death loss, and average parity of culled sows of 3.8.
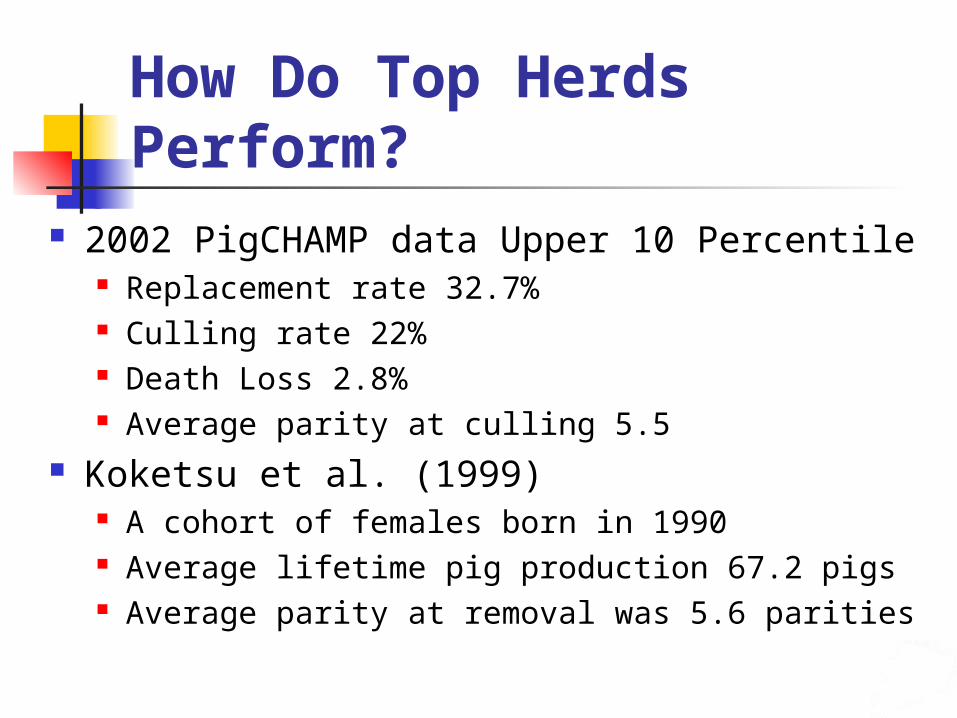
How Do Top Herds Perform?
2002 PigCHAMP data Upper 10 Percentile Replacement rate 32.7% Culling rate 22% Death Loss 2.8% Average parity at culling 5.5
Koketsu et al. (1999) A cohort of females born in 1990 Average lifetime pig production 67.2 pigs Average parity at removal was 5.6 parities
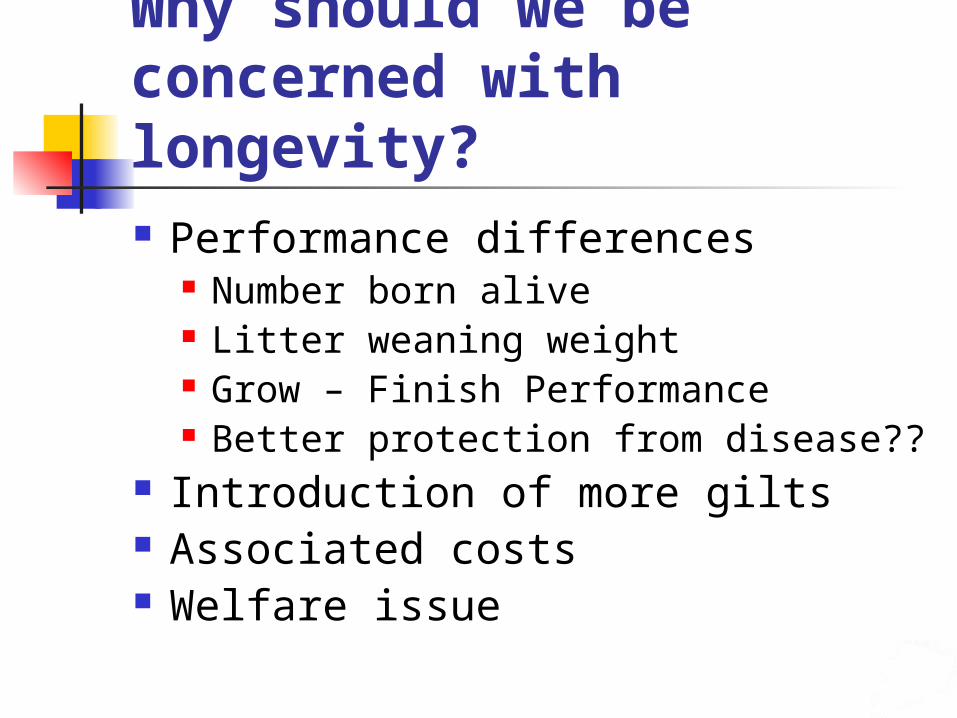
Why should we be concerned with longevity? Performance differences
Number born alive Litter weaning weight Grow – Finish Performance Better protection from disease??
Introduction of more gilts Associated costs Welfare issue
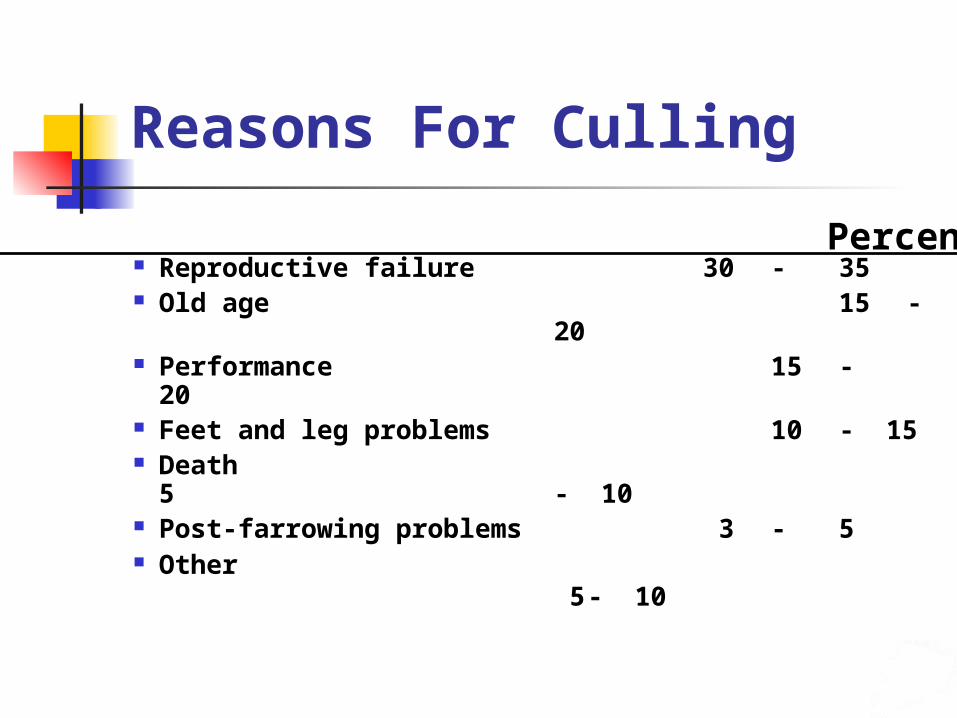
Reasons For Culling
Reproductive failure 30 - 35 Old age 15 - 20 Performance 15 - 20 Feet and leg problems 10 - 15 Death 5 - 10 Post-farrowing problems 3 - 5 Other 5 - 10
Reason Percentage Culled
Cost of Replacing a Sow
Replacement gilt Facility, feed, and labor during isolation and
acclimation Vaccination and other veterinary expenses Disease risk Opportunity cost (interest rate) Performance difference between a gilt and
mature sow.
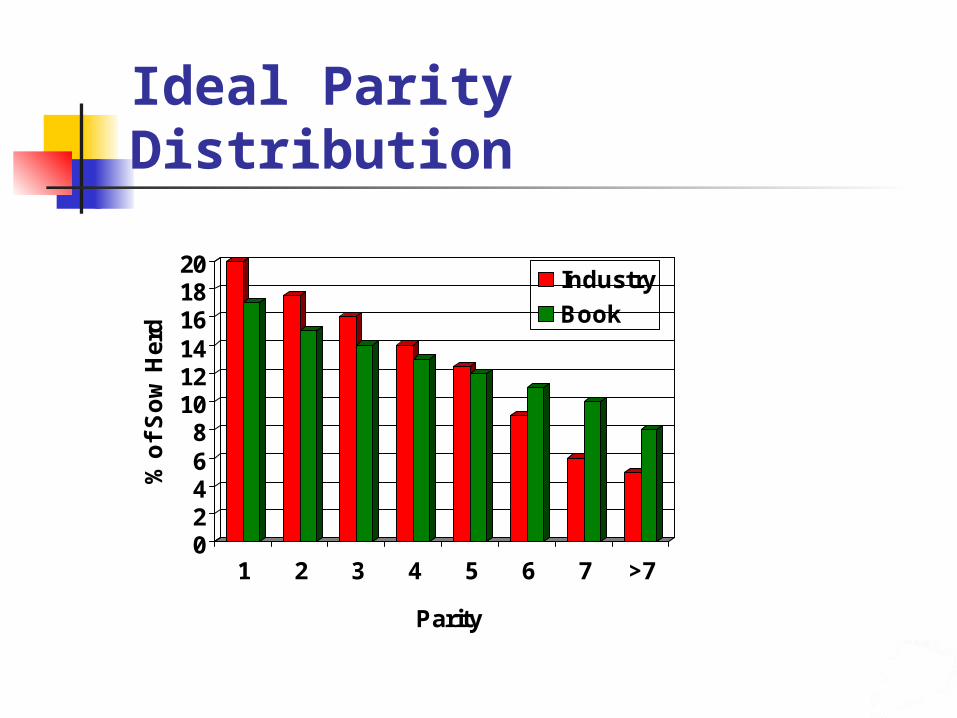
Ideal Parity Distribution
02468
101214161820
% o
f S
ow
Her
d
1 2 3 4 5 6 7 >7
Parity
Industry
Book
Impact of Distribution on Productivity
Average parity of sow herd 3.6 (industry) and 3.86 (book)
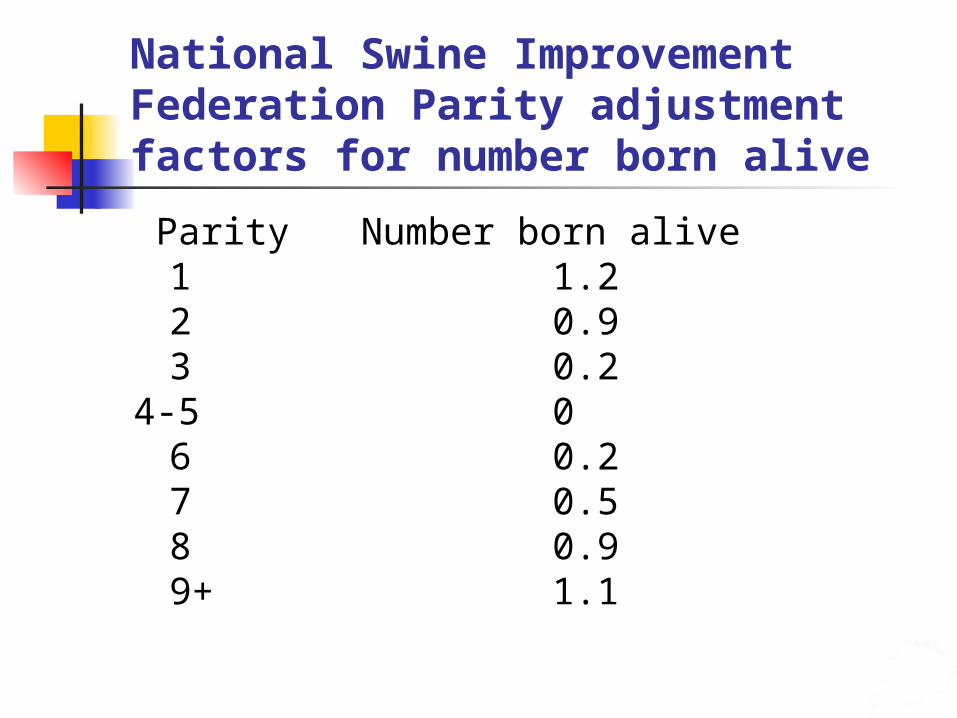
National Swine Improvement Federation Parity adjustment factors for number born alive
Parity Number born alive 1 1.22 0.93 0.2
4-5 06 0.27 0.58 0.99+ 1.1
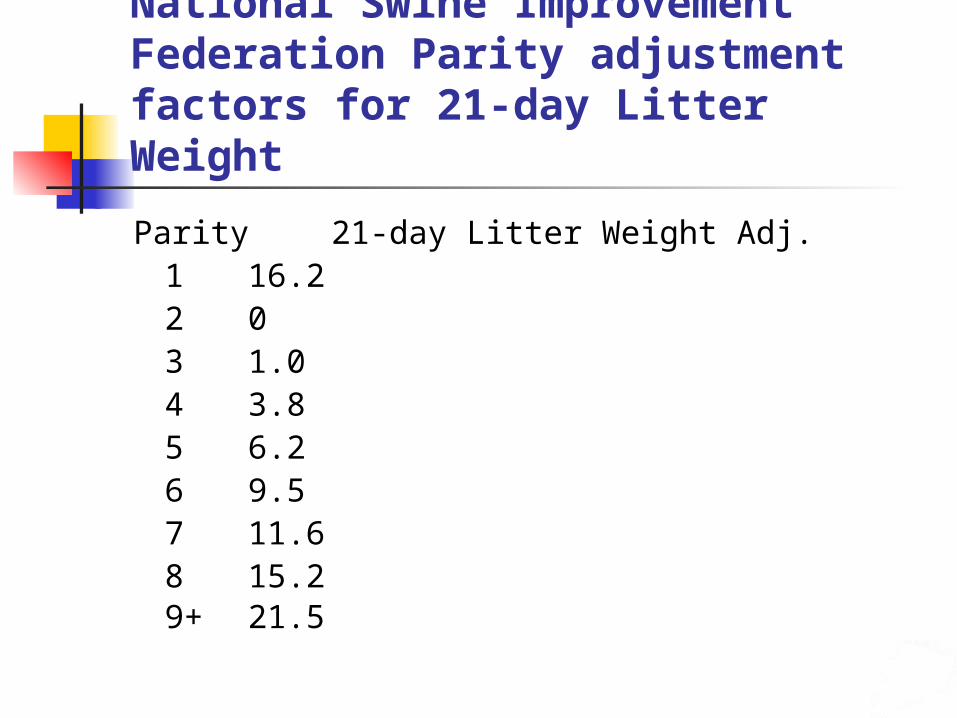
National Swine Improvement Federation Parity adjustment factors for 21-day Litter Weight
Parity 21-day Litter Weight Adj. 1 16.22 03 1.04 3.85 6.26 9.57 11.68 15.29+ 21.5
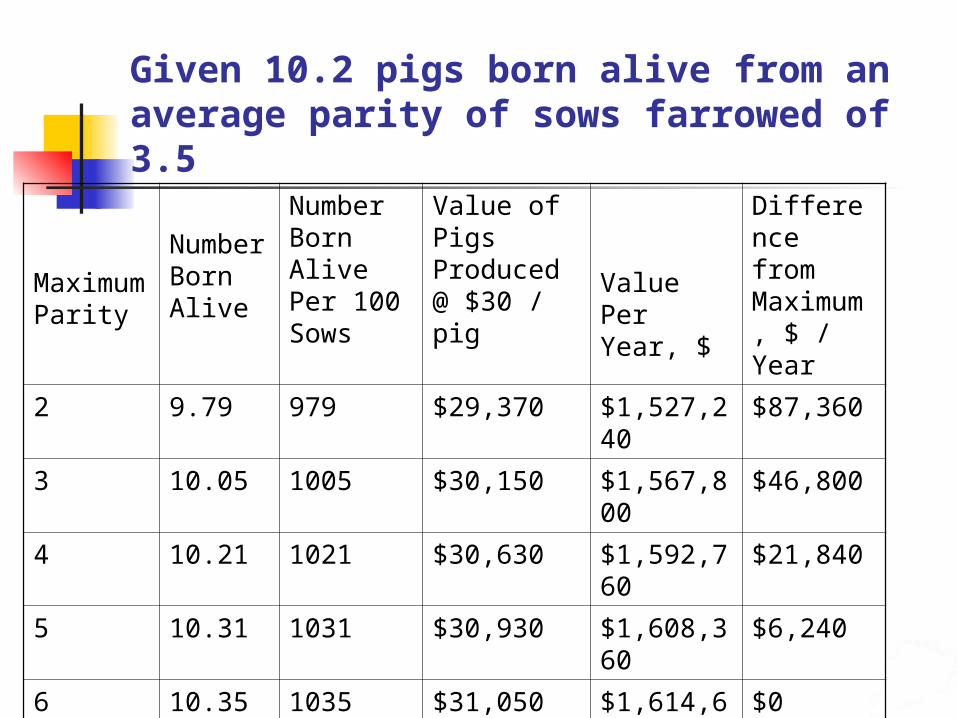
Given 10.2 pigs born alive from an average parity of sows farrowed of 3.5
Maximum Parity
Number Born Alive
Number Born Alive Per 100 Sows
Value of Pigs Produced @ $30 / pig
Value Per Year, $
Difference from Maximum, $ / Year
2 9.79 979 $29,370 $1,527,240
$87,360
3 10.05 1005 $30,150 $1,567,800
$46,800
4 10.21 1021 $30,630 $1,592,760
$21,840
5 10.31 1031 $30,930 $1,608,360
$6,240
6 10.35 1035 $31,050 $1,614,600
$0
7 10.35 1035 $31,050 $1,614,600
$0
8 10.33 1033 $30,990 $1,611,480
$3,120
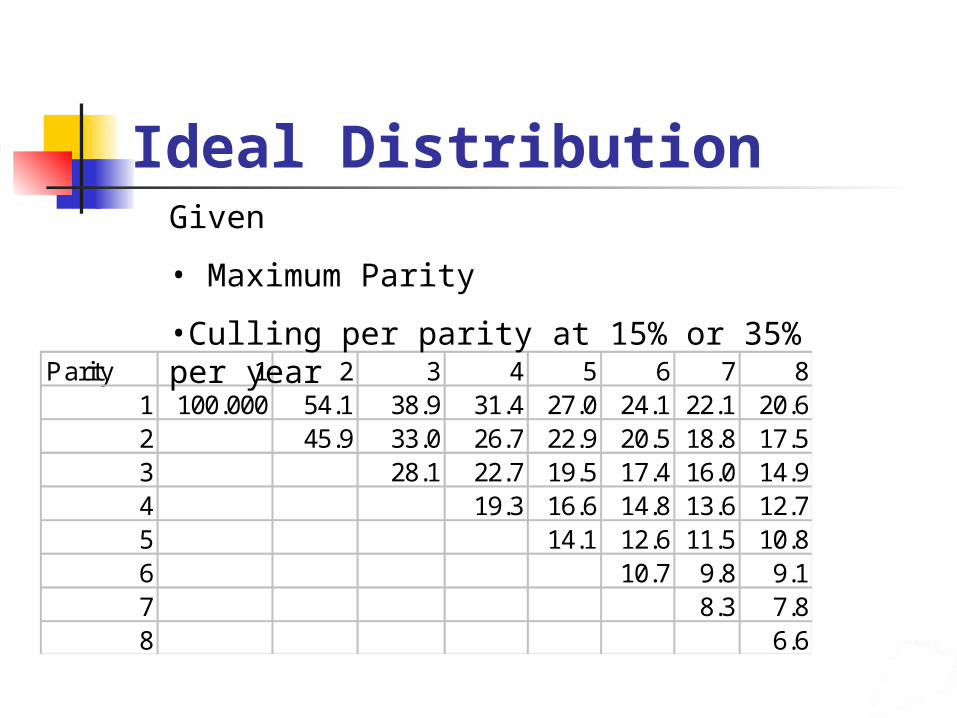
Ideal Distribution
Parity 1 2 3 4 5 6 7 81 100.000 54.1 38.9 31.4 27.0 24.1 22.1 20.62 45.9 33.0 26.7 22.9 20.5 18.8 17.53 28.1 22.7 19.5 17.4 16.0 14.94 19.3 16.6 14.8 13.6 12.75 14.1 12.6 11.5 10.86 10.7 9.8 9.17 8.3 7.88 6.6
Given
• Maximum Parity
•Culling per parity at 15% or 35% per year

Take Home Point: Economic Importance of Sow Longevity Reduced sow longevity (parity of sow
at culling) results in fewer litters in which a sow has an opportunity to be sufficiently productive in order for her purchase to be profitable.
Because of the cost of replacement females and short herd life, commercial swine producers should economically evaluate their replacement breeding herd decisions.
How do you evaluate how long a sow needs to remain in
the breeding herd to be a profitable investment?

Income Fixed and variable costs
Operation specific financial information
Herd specific production data
Development of the Sow Longevity Calculator
Farrow-to-Finish and Breed-to-Wean custom spreadsheets available
Uses Net Present Value analysis Version 2.0 Now Available
Producer supplies
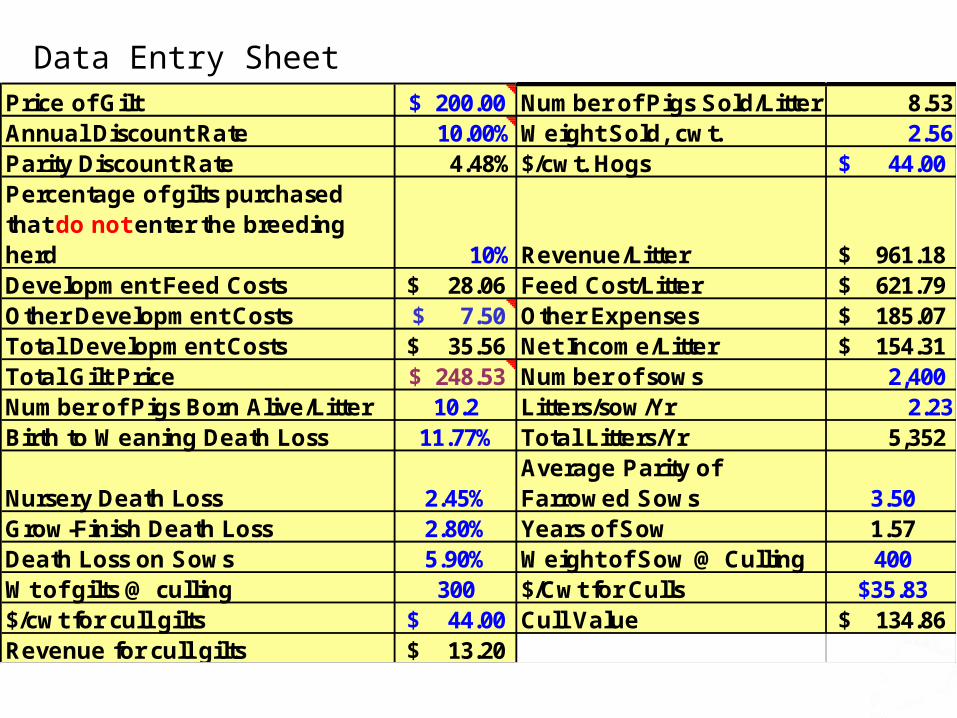
Data Entry SheetPrice of Gilt 200.00$ Number of Pigs Sold/Litter 8.53Annual Discount Rate 10.00% Weight Sold, cwt. 2.56Parity Discount Rate 4.48% $/cwt. Hogs 44.00$ Percentage of gilts purchased that do not enter the breeding herd 10% Revenue/Litter 961.18$ Development Feed Costs 28.06$ Feed Cost/Litter 621.79$ Other Development Costs 7.50$ Other Expenses 185.07$ Total Development Costs 35.56$ Net Income/Litter 154.31$ Total Gilt Price 248.53$ Number of sows 2,400 Number of Pigs Born Alive/Litter 10.2 Litters/sow/Yr 2.23Birth to Weaning Death Loss 11.77% Total Litters/Yr 5,352
Nursery Death Loss 2.45%Average Parity of Farrowed Sows 3.50
Grow-Finish Death Loss 2.80% Years of Sow 1.57Death Loss on Sows 5.90% Weight of Sow @ Culling 400Wt of gilts @ culling 300 $/Cwt for Culls $35.83$/cwt for cull gilts 44.00$ Cull Value 134.86$ Revenue for cull gilts 13.20$
Class Weight FeedFeed
(lbs/hd)No. of Head)
Total (tons)
Price ($/ton)
Feed Cost ($)
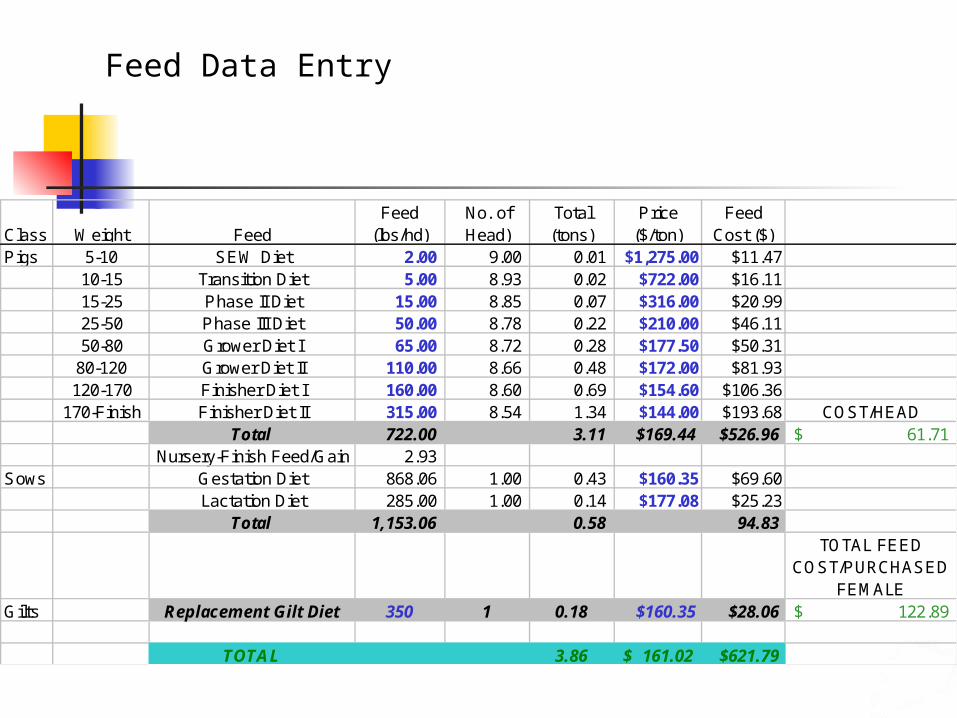
Pigs 5-10 SEW Diet 2.00 9.00 0.01 $1,275.00 $11.4710-15 Transition Diet 5.00 8.93 0.02 $722.00 $16.1115-25 Phase II Diet 15.00 8.85 0.07 $316.00 $20.9925-50 Phase III Diet 50.00 8.78 0.22 $210.00 $46.1150-80 Grower Diet I 65.00 8.72 0.28 $177.50 $50.31
80-120 Grower Diet II 110.00 8.66 0.48 $172.00 $81.93120-170 Finisher Diet I 160.00 8.60 0.69 $154.60 $106.36
170-Finish Finisher Diet II 315.00 8.54 1.34 $144.00 $193.68 COST/HEADTotal 722.00 3.11 $169.44 $526.96 61.71$
Nursery-Finish Feed/Gain 2.93 Sows Gestation Diet 868.06 1.00 0.43 $160.35 $69.60
Lactation Diet 285.00 1.00 0.14 $177.08 $25.23Total 1,153.06 0.58 94.83
TOTAL FEED COST/PURCHASED
FEMALEGilts Replacement Gilt Diet 350 1 0.18 $160.35 $28.06 122.89$
TOTAL 3.86 161.02$ $621.79
Feed Data Entry
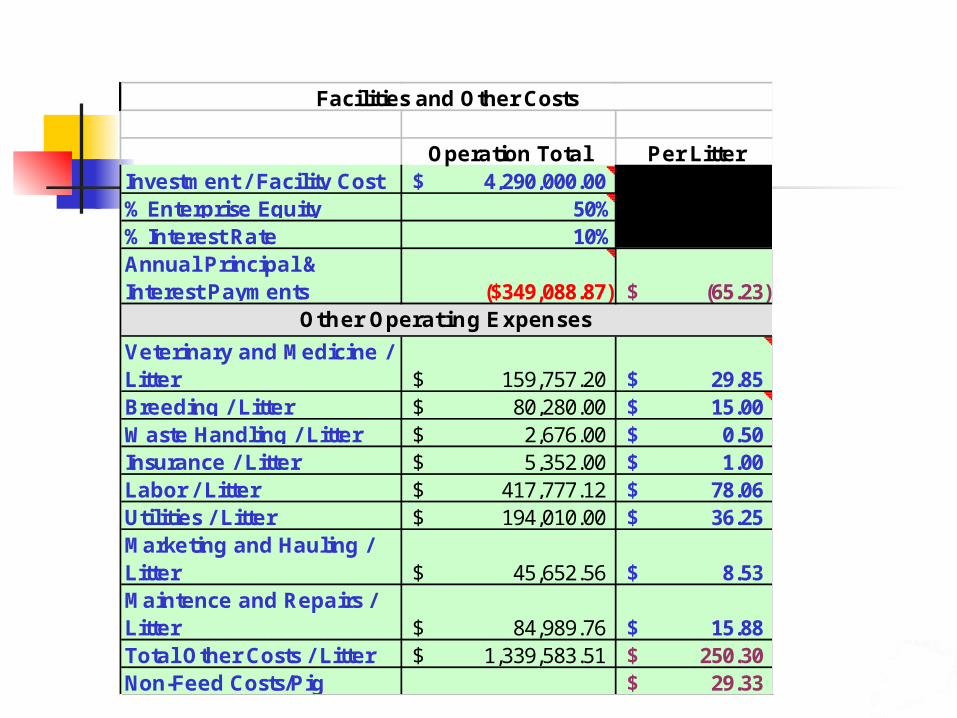
Operation Total Per LitterInvestment / Facility Cost 4,290,000.00$ % Enterprise Equity 50%% Interest Rate 10%Annual Principal & Interest Payments ($349,088.87) (65.23)$
Veterinary and Medicine / Litter 159,757.20$ 29.85$ Breeding / Litter 80,280.00$ 15.00$ Waste Handling / Litter 2,676.00$ 0.50$ Insurance / Litter 5,352.00$ 1.00$ Labor / Litter 417,777.12$ 78.06$ Utilities / Litter 194,010.00$ 36.25$ Marketing and Hauling / Litter 45,652.56$ 8.53$ Maintence and Repairs / Litter 84,989.76$ 15.88$ Total Other Costs / Litter 1,339,583.51$ 250.30$ Non-Feed Costs/Pig 29.33$
Other Operating Expenses
Facilities and Other Costs
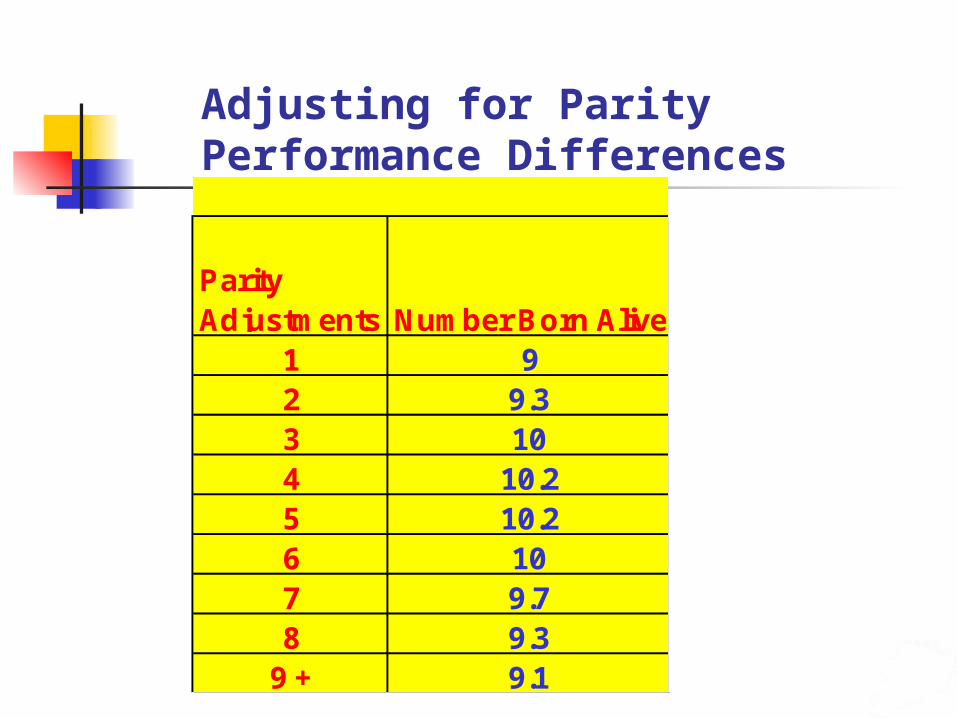
Parity Adjustments Number Born Alive
1 92 9.33 104 10.25 10.26 107 9.78 9.3
9 + 9.1
Adjusting for Parity Performance Differences
Parity Adjustment Caution Only make these adjustments if
you are extremely confident in the production numbers by parity.
Do not adjust if values from your herd are based on small numbers Within a parity Across all parities
What does all of this get you?
Net Present Value Analysis
What does the NPV number mean? > 0 means the investment is profitable in the long term. < 0 means the investment will lose money in the long
term.
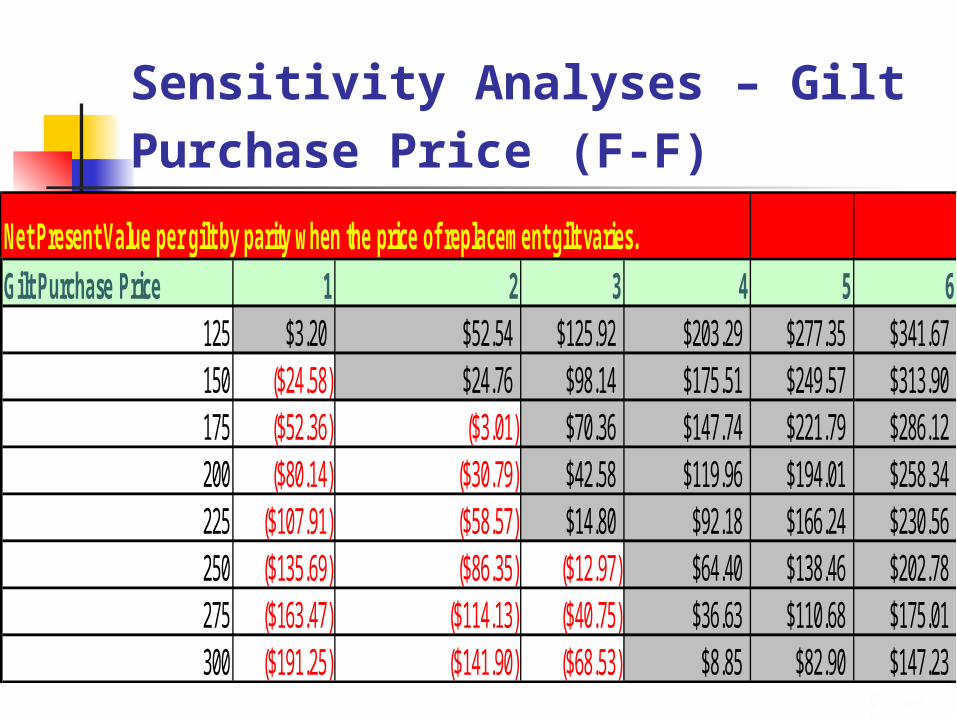
Sensitivity Analyses – Gilt Purchase Price (F-F)
Net Present Value per gilt by parity when the price of replacement gilt varies.Gilt Purchase Price 1 2 3 4 5 6
125 $3.20 $52.54 $125.92 $203.29 $277.35 $341.67150 ($24.58) $24.76 $98.14 $175.51 $249.57 $313.90175 ($52.36) ($3.01) $70.36 $147.74 $221.79 $286.12200 ($80.14) ($30.79) $42.58 $119.96 $194.01 $258.34225 ($107.91) ($58.57) $14.80 $92.18 $166.24 $230.56250 ($135.69) ($86.35) ($12.97) $64.40 $138.46 $202.78275 ($163.47) ($114.13) ($40.75) $36.63 $110.68 $175.01300 ($191.25) ($141.90) ($68.53) $8.85 $82.90 $147.23
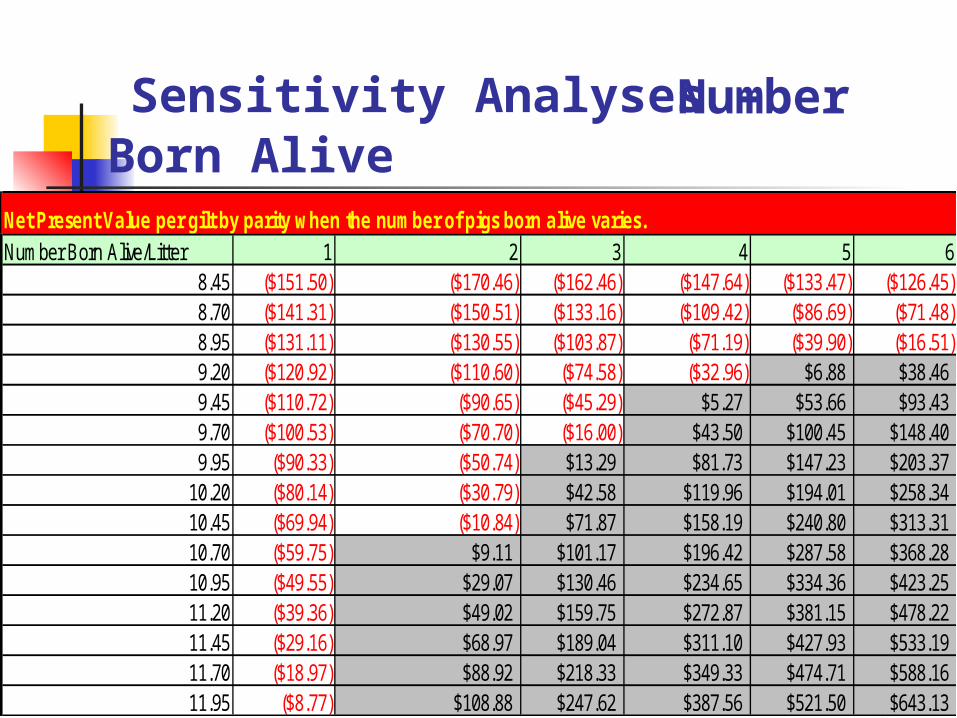
Sensitivity Analyses – Born Alive
Number
Net Present Value per gilt by parity when the number of pigs born alive varies.Number Born Alive/Litter 1 2 3 4 5 6
8.45 ($151.50) ($170.46) ($162.46) ($147.64) ($133.47) ($126.45)8.70 ($141.31) ($150.51) ($133.16) ($109.42) ($86.69) ($71.48)8.95 ($131.11) ($130.55) ($103.87) ($71.19) ($39.90) ($16.51)9.20 ($120.92) ($110.60) ($74.58) ($32.96) $6.88 $38.469.45 ($110.72) ($90.65) ($45.29) $5.27 $53.66 $93.439.70 ($100.53) ($70.70) ($16.00) $43.50 $100.45 $148.409.95 ($90.33) ($50.74) $13.29 $81.73 $147.23 $203.37
10.20 ($80.14) ($30.79) $42.58 $119.96 $194.01 $258.3410.45 ($69.94) ($10.84) $71.87 $158.19 $240.80 $313.3110.70 ($59.75) $9.11 $101.17 $196.42 $287.58 $368.2810.95 ($49.55) $29.07 $130.46 $234.65 $334.36 $423.2511.20 ($39.36) $49.02 $159.75 $272.87 $381.15 $478.2211.45 ($29.16) $68.97 $189.04 $311.10 $427.93 $533.1911.70 ($18.97) $88.92 $218.33 $349.33 $474.71 $588.1611.95 ($8.77) $108.88 $247.62 $387.56 $521.50 $643.13
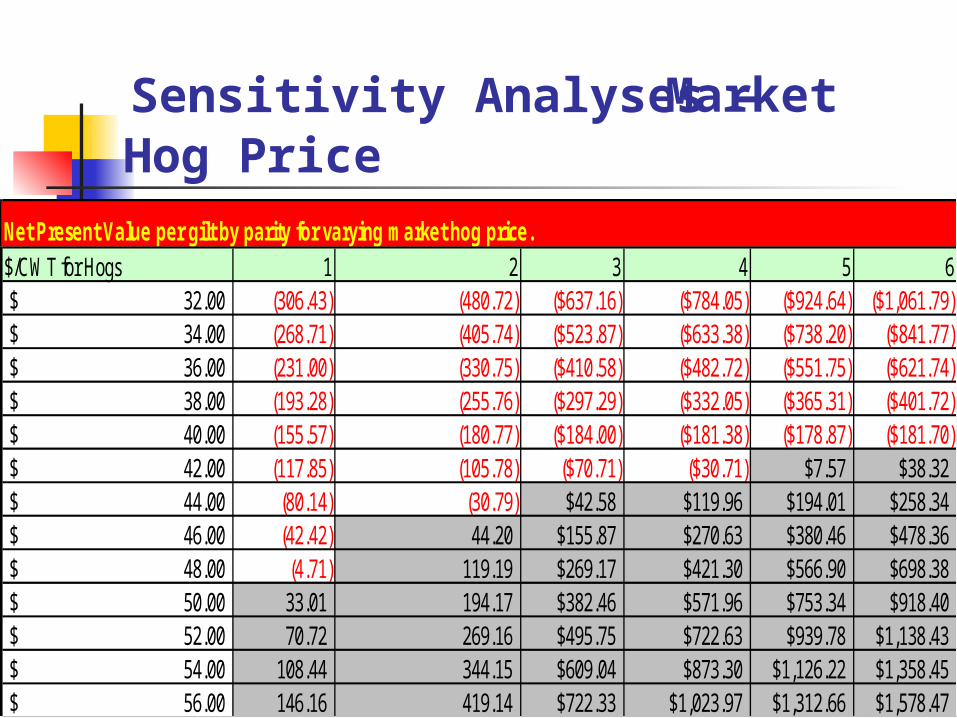
Sensitivity Analyses – Hog Price
Market
Net Present Value per gilt by parity for varying market hog price.$/CWT for Hogs 1 2 3 4 5 6
32.00$ (306.43) (480.72) ($637.16) ($784.05) ($924.64) ($1,061.79)34.00$ (268.71) (405.74) ($523.87) ($633.38) ($738.20) ($841.77)36.00$ (231.00) (330.75) ($410.58) ($482.72) ($551.75) ($621.74)38.00$ (193.28) (255.76) ($297.29) ($332.05) ($365.31) ($401.72)40.00$ (155.57) (180.77) ($184.00) ($181.38) ($178.87) ($181.70)42.00$ (117.85) (105.78) ($70.71) ($30.71) $7.57 $38.3244.00$ (80.14) (30.79) $42.58 $119.96 $194.01 $258.3446.00$ (42.42) 44.20 $155.87 $270.63 $380.46 $478.3648.00$ (4.71) 119.19 $269.17 $421.30 $566.90 $698.3850.00$ 33.01 194.17 $382.46 $571.96 $753.34 $918.4052.00$ 70.72 269.16 $495.75 $722.63 $939.78 $1,138.4354.00$ 108.44 344.15 $609.04 $873.30 $1,126.22 $1,358.4556.00$ 146.16 419.14 $722.33 $1,023.97 $1,312.66 $1,578.47
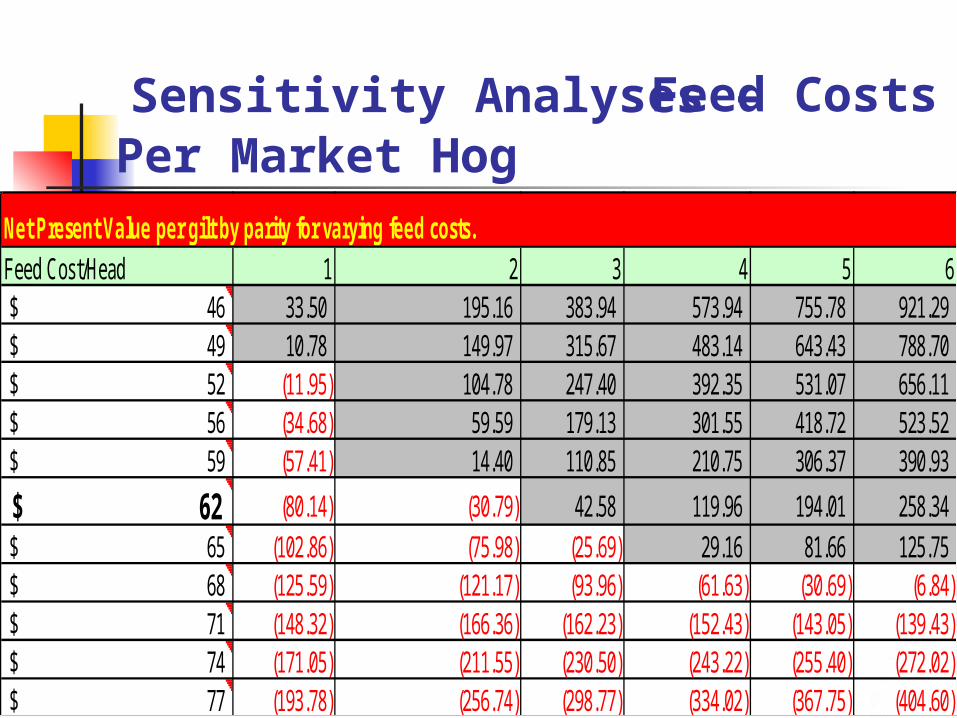
Sensitivity Analyses – Per Market Hog
Feed Costs
Net Present Value per gilt by parity for varying feed costs.Feed Cost/Head 1 2 3 4 5 6
46$ 33.50 195.16 383.94 573.94 755.78 921.2949$ 10.78 149.97 315.67 483.14 643.43 788.7052$ (11.95) 104.78 247.40 392.35 531.07 656.1156$ (34.68) 59.59 179.13 301.55 418.72 523.5259$ (57.41) 14.40 110.85 210.75 306.37 390.93
62$ (80.14) (30.79) 42.58 119.96 194.01 258.3465$ (102.86) (75.98) (25.69) 29.16 81.66 125.7568$ (125.59) (121.17) (93.96) (61.63) (30.69) (6.84)71$ (148.32) (166.36) (162.23) (152.43) (143.05) (139.43)74$ (171.05) (211.55) (230.50) (243.22) (255.40) (272.02)77$ (193.78) (256.74) (298.77) (334.02) (367.75) (404.60)
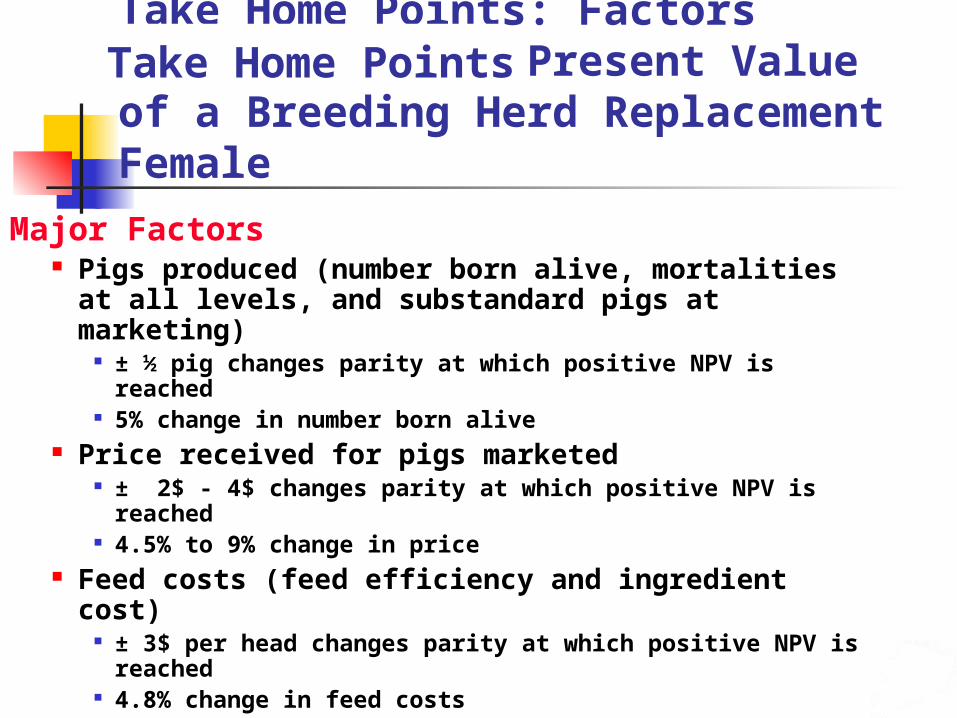
Take Home Points: Factors Influencing Net Present Value of a Breeding Herd Replacement Female
Major Factors Pigs produced (number born alive, mortalities
at all levels, and substandard pigs at marketing)
± ½ pig changes parity at which positive NPV is reached
5% change in number born alive Price received for pigs marketed
± 2$ - 4$ changes parity at which positive NPV is reached
4.5% to 9% change in price Feed costs (feed efficiency and ingredient cost)
± 3$ per head changes parity at which positive NPV is reached
4.8% change in feed costs
Take Home Points
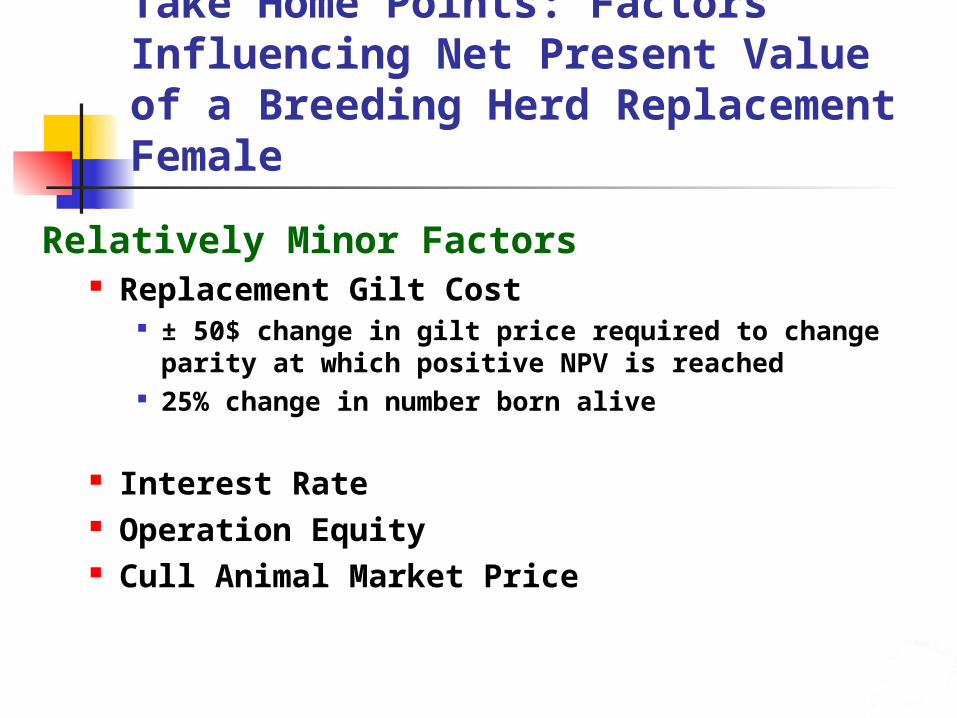
Take Home Points: Factors Influencing Net Present Value of a Breeding Herd Replacement Female
Relatively Minor Factors Replacement Gilt Cost
± 50$ change in gilt price required to change parity at which positive NPV is reached
25% change in number born alive
Interest Rate Operation Equity Cull Animal Market Price
Factors Influencing Sow Longevity
Factors under some genetic control Backfat of gilt at selection effects sow
longevity
Host of management effects feed intake, lactation length, gestation
housing, etc.

Summary Improved longevity can increase profitability Focus on management practices that
improve longevity More sows should be culled because of poor
performance rather than reproductive reasons.

Those Interested in The Spreadsheet
Spreadsheet designed to evaluate the investment in a replacement gilt available at:Iowa Pork Industry Center 515-294-4103Iowa Pork Industry Center Web Site:http://www.extension.iastate.edu/ipicPorkline (Iowa Only) 800-808-7675e-mail me at [email protected]

Thank You for Your Time and Attention
Are there any questions?