southern economic development region edr data packet... · naics description 2012 employment 2022...
TRANSCRIPT
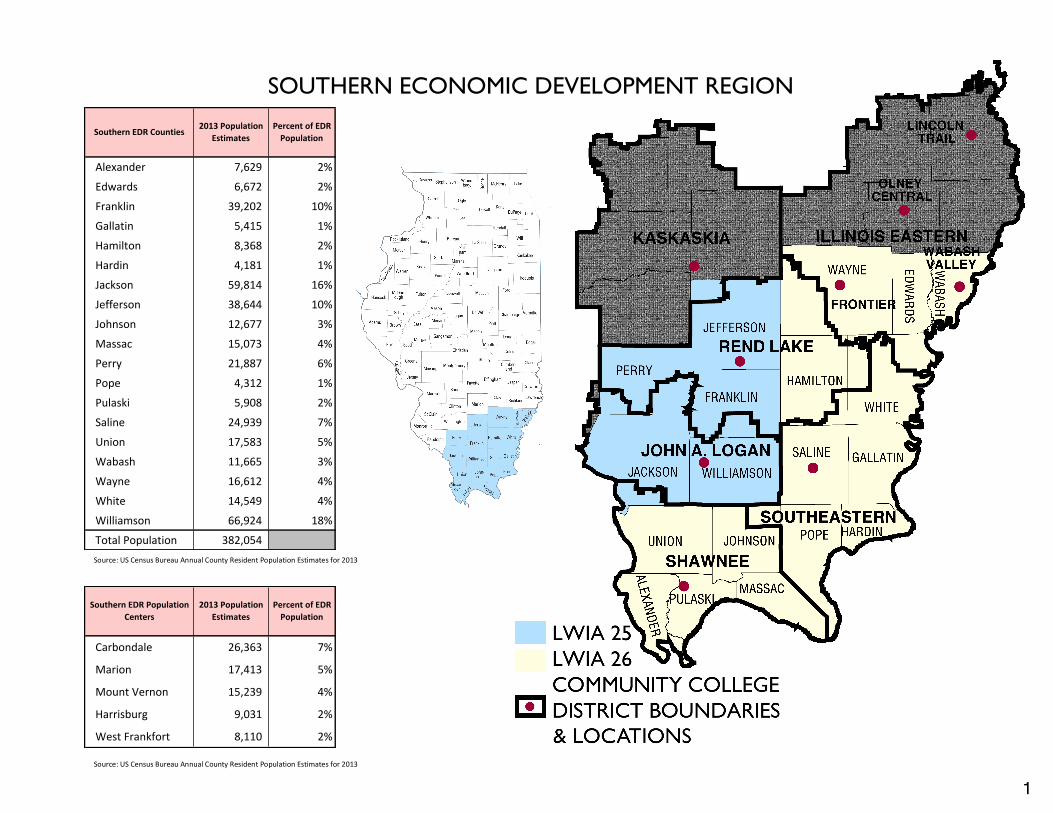
SOUTHERN ECONOMIC DEVELOPMENT REGION !!! !
Source:(US(Census(Bureau(Annual(County(Resident(Population(Estimates(for(2013(
Source:(US(Census(Bureau(Annual(County(Resident(Population(Estimates(for(2013(
Southern)EDR)Counties2013)Population)
EstimatesPercent)of)EDR)Population
Alexander 7,629............ 2%
Edwards 6,672............ 2%
Franklin 39,202.......... 10%
Gallatin 5,415............ 1%
Hamilton 8,368............ 2%
Hardin 4,181............ 1%
Jackson 59,814.......... 16%
Jefferson 38,644.......... 10%
Johnson 12,677.......... 3%
Massac 15,073.......... 4%
Perry 21,887.......... 6%
Pope 4,312............ 1%
Pulaski 5,908............ 2%
Saline 24,939.......... 7%
Union 17,583.......... 5%
Wabash 11,665.......... 3%
Wayne 16,612.......... 4%
White 14,549.......... 4%
Williamson 66,924.......... 18%
Total.Population 382,054........
Southern)EDR)Population)Centers
2013)Population)Estimates
Percent)of)EDR)Population
Carbondale 26,363.......... 7%
Marion 17,413.......... 5%
Mount.Vernon 15,239.......... 4%
Harrisburg 9,031............ 2%
West.Frankfort 8,110............ 2%
1

Cluster
2012 Em
ployment
2022 Em
ployment
Net
Employm
ent C
hange
Percent Em
ployment
Change
Concentration (Location Q
uotient)M
arketing & Sales45,112
48,282
3,170
7.0%
1.15
Hospitality & Tourism
37,182
40,237
3,055
8.2%1.20
Education & Training22,211
23,933
1,722
7.8%
1.58
Health C
are21,018
23,059
2,041
9.7%
1.02
Agriculture10,920
11,206
286
2.6%
4.71
Business Managem
ent7,101
7,951
850
12.0%
0.93
Manufacturing
7,874
7,722
152-
-1.9%1.11
Law & Public Safety
6,687
7,687
1,000
15.0%0.34
Transportation, Distribution & Logistics
7,165
7,656
491
6.9%0.82
Finance5,854
5,793
61
- -1.0%
0.64
Construction
5,096
5,517
421
8.3%0.64
Arts & Audio Visual1,236
1,274
38
3.1%
0.45
Energy1,000
951
49
- -4.9%
1.07
Reserarch & D
evelopment
600
644
44
7.3%0.37
Information Technology
292
384
92
31.5%0.15
SOUTHERN REG
ION
EMPLO
YMENT BY INDUSTRY / O
CCUPATIONAL CLUSTER
NAICS DESCRIPTION 2012
Employment 2022
Employment
Employment Change 2012-
22
% Change 2012-22 2014 LQ Class
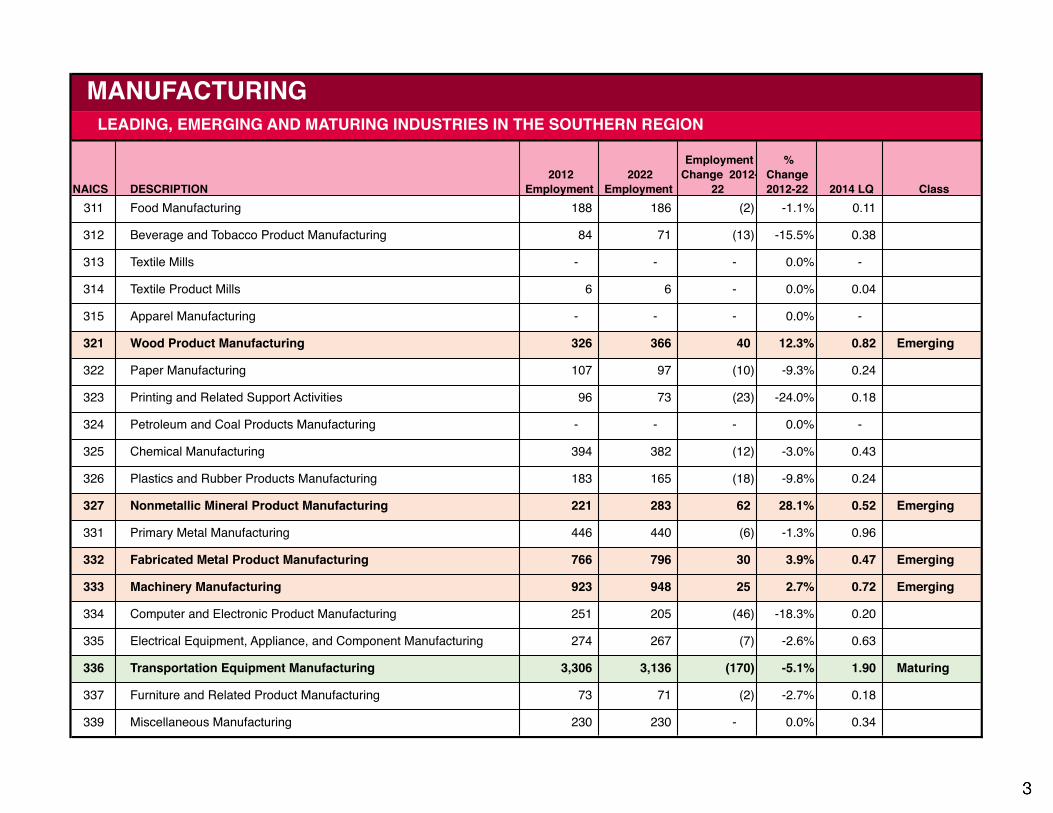
311 Food Manufacturing 188 186 (2) -1.1% 0.11
312 Beverage and Tobacco Product Manufacturing 84 71 (13) -15.5% 0.38
313 Textile Mills - - - 0.0% -
314 Textile Product Mills 6 6 - 0.0% 0.04
315 Apparel Manufacturing - - - 0.0% -
321 Wood Product Manufacturing 326 366 40 12.3% 0.82 Emerging
322 Paper Manufacturing 107 97 (10) -9.3% 0.24
323 Printing and Related Support Activities 96 73 (23) -24.0% 0.18
324 Petroleum and Coal Products Manufacturing - - - 0.0% -
325 Chemical Manufacturing 394 382 (12) -3.0% 0.43
326 Plastics and Rubber Products Manufacturing 183 165 (18) -9.8% 0.24
327 Nonmetallic Mineral Product Manufacturing 221 283 62 28.1% 0.52 Emerging
331 Primary Metal Manufacturing 446 440 (6) -1.3% 0.96
332 Fabricated Metal Product Manufacturing 766 796 30 3.9% 0.47 Emerging
333 Machinery Manufacturing 923 948 25 2.7% 0.72 Emerging
334 Computer and Electronic Product Manufacturing 251 205 (46) -18.3% 0.20
335 Electrical Equipment, Appliance, and Component Manufacturing 274 267 (7) -2.6% 0.63
336 Transportation Equipment Manufacturing 3,306 3,136 (170) -5.1% 1.90 Maturing
337 Furniture and Related Product Manufacturing 73 71 (2) -2.7% 0.18
339 Miscellaneous Manufacturing 230 230 - 0.0% 0.34
MANUFACTURINGLEADING, EMERGING AND MATURING INDUSTRIES IN THE SOUTHERN REGION
3

4
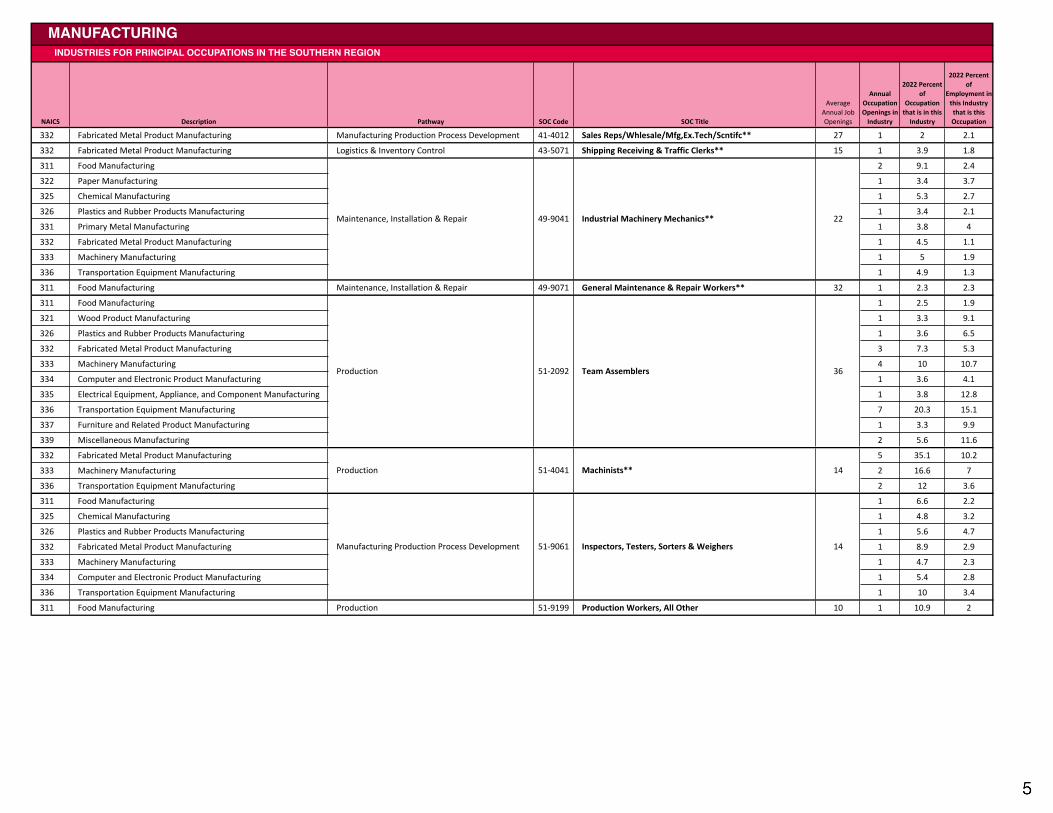
NAICS Description Pathway SOC6Code SOC6Title
Average'Annual'Job'Openings
Annual6Occupation6Openings6in6Industry
20226Percent6of6
Occupation6that6is6in6this6Industry
20226Percent6of6
Employment6in6this6Industry6that6is6this6Occupation
332 Fabricated'Metal'Product'Manufacturing Manufacturing'Production'Process'Development 41?4012 Sales6Reps/Whlesale/Mfg,Ex.Tech/Scntifc** 27 1 2 2.1
332 Fabricated'Metal'Product'Manufacturing Logistics'&'Inventory'Control 43?5071 Shipping6Receiving6&6Traffic6Clerks** 15 1 3.9 1.8
311 Food'Manufacturing 2 9.1 2.4
322 Paper'Manufacturing 1 3.4 3.7
325 Chemical'Manufacturing 1 5.3 2.7
326 Plastics'and'Rubber'Products'Manufacturing 1 3.4 2.1
331 Primary'Metal'Manufacturing 1 3.8 4
332 Fabricated'Metal'Product'Manufacturing 1 4.5 1.1
333 Machinery'Manufacturing 1 5 1.9
336 Transportation'Equipment'Manufacturing 1 4.9 1.3
311 Food'Manufacturing Maintenance,'Installation'&'Repair 49?9071 General6Maintenance6&6Repair6Workers** 32 1 2.3 2.3
311 Food'Manufacturing 1 2.5 1.9
321 Wood'Product'Manufacturing 1 3.3 9.1
326 Plastics'and'Rubber'Products'Manufacturing 1 3.6 6.5
332 Fabricated'Metal'Product'Manufacturing 3 7.3 5.3
333 Machinery'Manufacturing 4 10 10.7
334 Computer'and'Electronic'Product'Manufacturing 1 3.6 4.1
335 Electrical'Equipment,'Appliance,'and'Component'Manufacturing 1 3.8 12.8
336 Transportation'Equipment'Manufacturing 7 20.3 15.1
337 Furniture'and'Related'Product'Manufacturing 1 3.3 9.9
339 Miscellaneous'Manufacturing 2 5.6 11.6
332 Fabricated'Metal'Product'Manufacturing 5 35.1 10.2
333 Machinery'Manufacturing 2 16.6 7
336 Transportation'Equipment'Manufacturing 2 12 3.6
311 Food'Manufacturing 1 6.6 2.2
325 Chemical'Manufacturing 1 4.8 3.2
326 Plastics'and'Rubber'Products'Manufacturing 1 5.6 4.7
332 Fabricated'Metal'Product'Manufacturing 1 8.9 2.9
333 Machinery'Manufacturing 1 4.7 2.3
334 Computer'and'Electronic'Product'Manufacturing 1 5.4 2.8
336 Transportation'Equipment'Manufacturing 1 10 3.4
311 Food'Manufacturing Production 51?9199 Production6Workers,6All6Other 10 1 10.9 2
Industrial6Machinery6Mechanics**
Team6Assemblers
Machinists**
Inspectors,6Testers,6Sorters6&6Weighers
Maintenance,'Installation'&'Repair 49?9041
Production 51?2092
Production 51?4041
Manufacturing'Production'Process'Development 51?9061
22
36
14
14
MANUFACTURINGINDUSTRIES FOR PRINCIPAL OCCUPATIONS IN THE SOUTHERN REGION
5

Pathway SOC*Code SOC*TitleAverage'
Annual'Job'Annual*
Occupation*2022*Percent*
of*2022*Percent*
of* Median*Annual Education*Entry*Level Experience*Entry*Level Training*Entry*Level
Manufacturing'Production'Process'Development 41;4012 Sales*Reps/Whlesale/Mfg,Ex.Tech/Scntifc** 27 1 2 2.1 $46,670 High'school'diploma'or'equivalent None Moderate;term'on;the;job'training
Logistics'&'Inventory'Control 43;5071 Shipping*Receiving*&*Traffic*Clerks** 15 1 3.9 1.8 $25,657 High'school'diploma'or'equivalent None Short;term'on;the;job'training
2 9.1 2.4
1 3.4 3.7
1 5.3 2.7
1 3.4 2.1
1 3.8 4
1 4.5 1.1
1 5 1.9
1 4.9 1.3
Maintenance,'Installation'&'Repair 49;9071 General*Maintenance*&*Repair*Workers** 32 1 2.3 2.3 $40,312 High'school'diploma'or'equivalent None Moderate;term'on;the;job'training
1 2.5 1.9
1 3.3 9.1
1 3.6 6.5
3 7.3 5.3
4 10 10.7
1 3.6 4.1
1 3.8 12.8
7 20.3 15.1
1 3.3 9.9
2 5.6 11.6
5 35.1 10.2
2 16.6 7
2 12 3.6
1 6.6 2.2
1 4.8 3.2
1 5.6 4.7
1 8.9 2.9
1 4.7 2.3
1 5.4 2.8
1 10 3.4
Production 51;9199 Production*Workers,*All*Other 10 1 10.9 2 $33,364 High'school'diploma'or'equivalent None Moderate;term'on;the;job'training
Long;term'on;the;job'training
None Moderate;term'on;the;job'training
MANUFACTURINGINDUSTRIES FOR PRINCIPAL OCCUPATIONS IN THE SOUTHERN REGION
Production 51;2092 Team*Assemblers 36 $32,459 High'school'diploma'or'equivalent None Moderate;term'on;the;job'training
Production 51;4041 Machinists** 14 $32,452 High'school'diploma'or'equivalent None Long;term'on;the;job'training
Maintenance,'Installation'&'Repair 49;9041 Industrial*Machinery*Mechanics** 22 $47,008 High'school'diploma'or'equivalent None
Manufacturing'Production'Process'Development 51;9061 Inspectors,*Testers,*Sorters*&*Weighers 14 $35,491 High'school'diploma'or'equivalent
6
NAICS DESCRIPTION2012
Employment2022
Employment
Employment Change 2012-22
Growth Rate LQ Industry Class
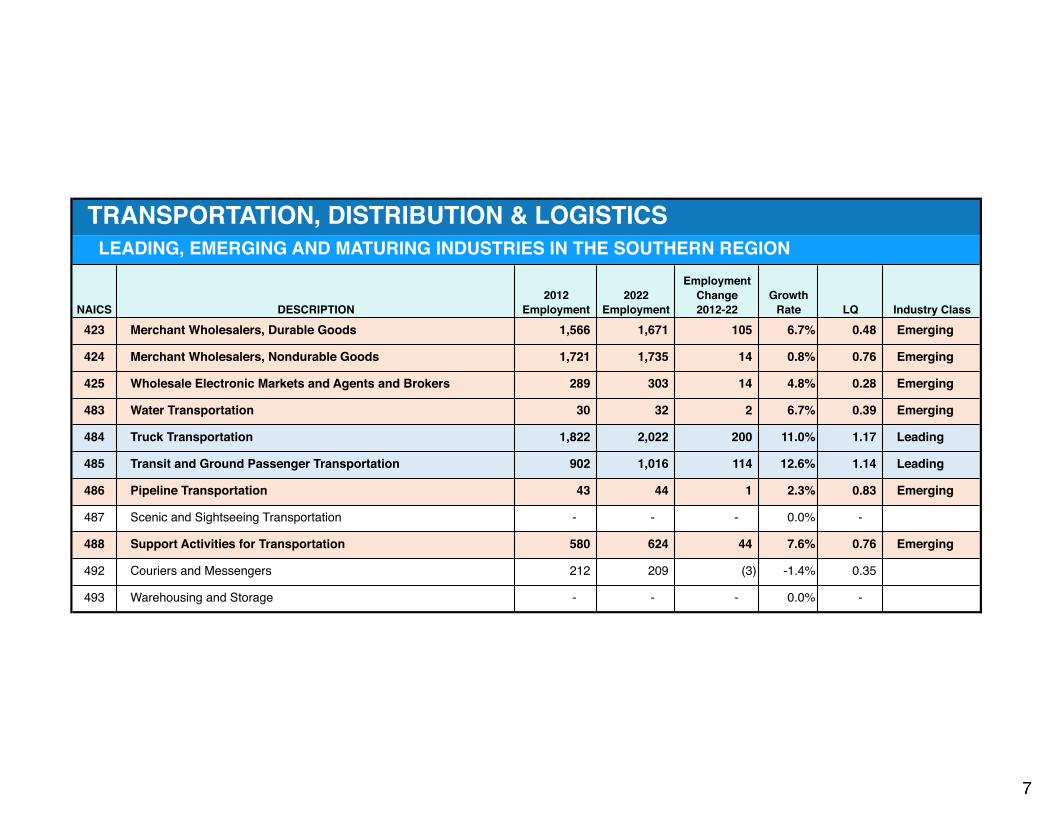
423 Merchant Wholesalers, Durable Goods 1,566 1,671 105 6.7% 0.48 Emerging
424 Merchant Wholesalers, Nondurable Goods 1,721 1,735 14 0.8% 0.76 Emerging
425 Wholesale Electronic Markets and Agents and Brokers 289 303 14 4.8% 0.28 Emerging
483 Water Transportation 30 32 2 6.7% 0.39 Emerging
484 Truck Transportation 1,822 2,022 200 11.0% 1.17 Leading
485 Transit and Ground Passenger Transportation 902 1,016 114 12.6% 1.14 Leading
486 Pipeline Transportation 43 44 1 2.3% 0.83 Emerging
487 Scenic and Sightseeing Transportation - - - 0.0% -
488 Support Activities for Transportation 580 624 44 7.6% 0.76 Emerging
492 Couriers and Messengers 212 209 (3) -1.4% 0.35
493 Warehousing and Storage - - - 0.0% -
TRANSPORTATION, DISTRIBUTION & LOGISTICSLEADING, EMERGING AND MATURING INDUSTRIES IN THE SOUTHERN REGION
7

8

NAICS DESCRIPTION Pathway SOC1Code SOC1Title
Average1Annual1Job1Openings
Annual1Occupational1Openings1in1Industry
20221Percent1of1occupation
20221Percent1of1industry
423 Merchant,Wholesalers,,Durable,Goods, Logistics,Planning,and,Management,Services 43>1011 1stELine1Supvrs/Mgrs,1Office1&1Adm.1Support1Wkrs** 27 1 2.5 1.3
488 Support,Activities,for,Transportation 3 63.6 8.4
488 Support,Activities,for,Transportation 3 63.6 8.4
484 Truck,Transportation Transportation,Operations 43>5032 Dispatchers** 6 1 17.9 2.6
423 Merchant,Wholesalers,,Durable,Goods, 2 13.5 3.2
424 Merchant,Wholesalers,,Nondurable,Goods, 1 7.8 2.7
492 Couriers,and,Messengers 1 5 7.2
493 Warehousing,and,Storage 1 4.7 4.1
423 Merchant,Wholesalers,,Durable,Goods, 1 10.6 1
484 Truck,Transportation 1 18.6 3.5
423 Merchant,Wholesalers,,Durable,Goods, 1 8.6 0.5
424 Merchant,Wholesalers,,Nondurable,Goods, 1 9.9 0.9
492 Couriers,and,Messengers 1 9.6 3.6
493 Warehousing,and,Storage 1 13.7 3.2
485 Transit,and,Ground,Passenger,Transportation Transportation,Operations 53>3021 Bus1Drivers,1Transit1&1Intercity 7 3 42.3 15.1
485 Transit,and,Ground,Passenger,Transportation Transportation,Operations 53>3022 School1Bus1Drivers 20 8 41.2 41.1
423 Merchant,Wholesalers,,Durable,Goods, 2 3.2 2
424 Merchant,Wholesalers,,Nondurable,Goods, 4 7.9 7.3
484 Truck,Transportation 24 46.3 59.7
488 Support,Activities,for,Transportation 2 3.1 8.5
492 Couriers,and,Messengers 1 1.5 5.6
493 Warehousing,and,Storage 1 2.2 5.3
423 Merchant,Wholesalers,,Durable,Goods, 2 8.4 2.5
424 Merchant,Wholesalers,,Nondurable,Goods, 1 7.6 3.2
484 Truck,Transportation 1 6.1 3.6
492 Couriers,and,Messengers 3 17.1 30.5
Cargo1&1Freight1Agents1(Route1Planners)
Shipping,1Receiving,1&1Traffic1Clerks**
Bus1&1Truck1Mechanics1&1Diesel1Eng.1Specialists**
1stELine1Supvrs/Mgrs,1Helpers1&1Laborers
Truck1Drivers,1Heavy1&1Tractor1Trailer**
Truck1Drivers,1Light1&1Delivery1Services
Health,,Safety,and,Environmental,Management 43>5011
Warehousing,and,Distribution,Center,Operations 43>5071
Facility,and,Mobile,Equipment,Maintenance 49>3031
Warehousing,and,Distribution,Center,Operations 53>1021
Transportation,Operations 53>3032
Transportation,Operations 53>3033
5
15
6
7
51
19
TRANSPORTATION, DISTRIBUTION & LOGISTICSINDUSTRIES FOR PRINCIPAL OCCUPATIONS IN THE SOUTHERN REGION
9
Pathway SOC*Code SOC*Title
Average*Annual*Job*Openings
Annual*Occupational*Openings*in*Industry
2022*Percent*of*occupation
2022*Percent*of*industry
Median'Annual Education'Entry'Level Experience'Entry'Level Training'Entry'Level
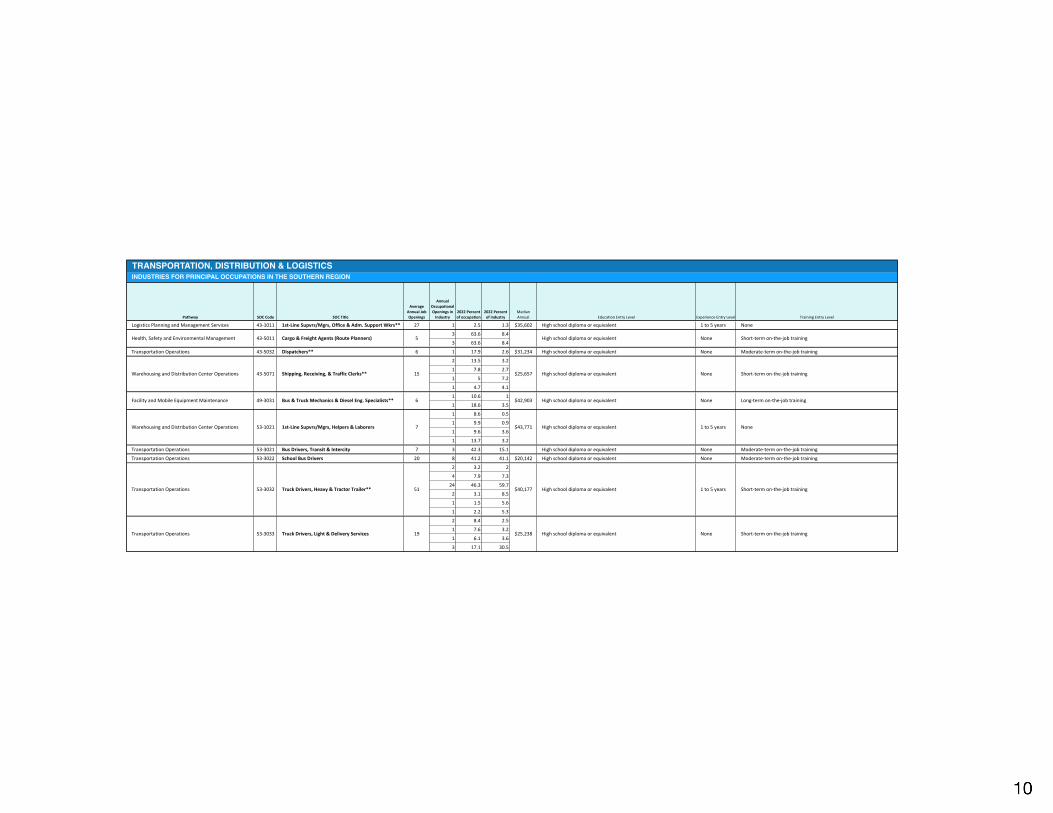
Logistics'Planning'and'Management'Services 43=1011 1stALine*Supvrs/Mgrs,*Office*&*Adm.*Support*Wkrs** 27 1 2.5 1.3 $35,602 High'school'diploma'or'equivalent 1'to'5'years None
3 63.6 8.4
3 63.6 8.4
Transportation'Operations 43=5032 Dispatchers** 6 1 17.9 2.6 $31,234 High'school'diploma'or'equivalent None Moderate=term'on=the=job'training
2 13.5 3.2
1 7.8 2.7
1 5 7.2
1 4.7 4.1
1 10.6 1
1 18.6 3.5
1 8.6 0.5
1 9.9 0.9
1 9.6 3.6
1 13.7 3.2
Transportation'Operations 53=3021 Bus*Drivers,*Transit*&*Intercity 7 3 42.3 15.1 High'school'diploma'or'equivalent None Moderate=term'on=the=job'training
Transportation'Operations 53=3022 School*Bus*Drivers 20 8 41.2 41.1 $20,142 High'school'diploma'or'equivalent None Moderate=term'on=the=job'training
2 3.2 2
4 7.9 7.3
24 46.3 59.7
2 3.1 8.5
1 1.5 5.6
1 2.2 5.3
2 8.4 2.5
1 7.6 3.2
1 6.1 3.6
3 17.1 30.5
Health,'Safety'and'Environmental'Management 43=5011 Cargo*&*Freight*Agents*(Route*Planners) 5 High'school'diploma'or'equivalent None Short=term'on=the=job'training
Warehousing'and'Distribution'Center'Operations 43=5071 Shipping,*Receiving,*&*Traffic*Clerks** 15 $25,657 High'school'diploma'or'equivalent None Short=term'on=the=job'training
Facility'and'Mobile'Equipment'Maintenance 49=3031 Bus*&*Truck*Mechanics*&*Diesel*Eng.*Specialists** 6 $42,903 High'school'diploma'or'equivalent None Long=term'on=the=job'training
Warehousing'and'Distribution'Center'Operations 53=1021 1stALine*Supvrs/Mgrs,*Helpers*&*Laborers 7 $43,771 High'school'diploma'or'equivalent 1'to'5'years None
Transportation'Operations 53=3032 Truck*Drivers,*Heavy*&*Tractor*Trailer** 51 $40,177 High'school'diploma'or'equivalent 1'to'5'years Short=term'on=the=job'training
Transportation'Operations 53=3033 Truck*Drivers,*Light*&*Delivery*Services 19 $25,238 High'school'diploma'or'equivalent None Short=term'on=the=job'training
TRANSPORTATION, DISTRIBUTION & LOGISTICSINDUSTRIES FOR PRINCIPAL OCCUPATIONS IN THE SOUTHERN REGION
10

NAICS DESCRIPTION 2012
Employment 2022
Employment
Employment Change 2012-
22
% Change 2012-22 2014 LQ Class
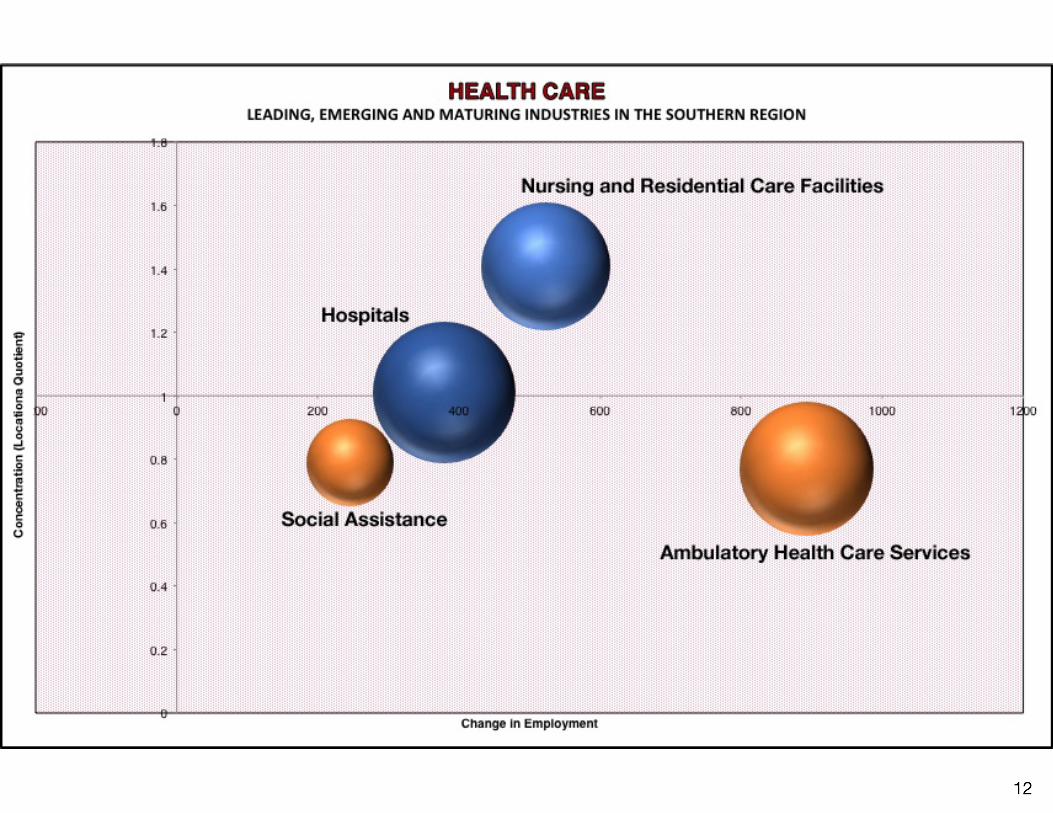
621 Ambulatory Health Care Services 5,757 6,650 893 15.5% 0.77 Emerging
622 Hospitals 7,096 7,475 379 5.3% 1.01 Leading
623 Nursing and Residential Care Facilities 5,574 6,097 523 9.4% 1.41 Leading
624 Social Assistance 2,591 2,837 246 9.5% 0.79 Emerging
HEALTH CARELEADING, EMERGING AND MATURING INDUSTRIES IN THE SOUTHERN REGION
11
12

NAICS
DescriptionPathw
aySO
C6CodeSO
C6Title
Average6Annual6Job6Openings
Annual6Occupation6
Openings6in6Industry
20226Percent6of6
Occupation6
that6is6in6this6Industry
20226Percent6of6
Employm
ent6in6this6Industry6that6is6this6Occupation
621
Ambulatory.Health
.Care.Service
s1
5.9
0.2
622
Hospita
ls1
60.3
621
Ambulatory.Health
.Care.Service
s3
30
1.3
622
Hospita
ls4
36.4
2.1
623
Nursin
g.and.Resid
entia
l.Care.Facilitie
s1
10.8
1.1
621
Ambulatory.Health
.Care.Service
s2
30.4
0.6
622
Hospita
ls1
10
0.3
623
Nursin
g.and.Resid
entia
l.Care.Facilitie
s1
17.6
0.7
624
Socia
l.Assista
nce
120.1
0.9
621
Ambulatory.Health
.Care.Service
s1
80.4
623
Nursin
g.and.Resid
entia
l.Care.Facilitie
s2
17.1
2
624
Socia
l.Assista
nce
440.7
5.1
622
Hospita
lsTherapeutic.S
ervice
s29H1051
Pharmacists
72
25.3
1.3
621
Ambulatory.Health
.Care.Service
s7
56.3
1.8
622
Hospita
ls3
25
1
623
Nursin
g.and.Resid
entia
l.Care.Facilitie
s1
6.7
0.5
621
Ambulatory.Health
.Care.Service
s2
28.4
0.5
622
Hospita
ls1
13.6
0.3
621
Ambulatory.Health
.Care.Service
s18
20.1
7.4
622
Hospita
ls52
59.2
28.9
623
Nursin
g.and.Resid
entia
l.Care.Facilitie
s6
75.8
624
Socia
l.Assista
nce
10.9
0.8
621
Ambulatory.Health
.Care.Service
s3
44.3
1.1
622
Hospita
ls2
41.4
1.3
621
Ambulatory.Health
.Care.Service
s10
55
1.8
622
Hospita
ls3
15.2
0.7
622
Hospita
lsTherapeutic.S
ervice
s29H2052
Pharmacy6Technicians
71
16.2
1
621
Ambulatory.Health
.Care.Service
s8
28.9
3
622
Hospita
ls4
16.3
2.3
623
Nursin
g.and.Resid
entia
l.Care.Facilitie
s11
39.1
9.1
621
Ambulatory.Health
.Care.Service
s3
35.4
0.9
622
Hospita
ls3
37.6
1.3
623
Nursin
g.and.Resid
entia
l.Care.Facilitie
s1
8.9
0.5
621
Ambulatory.Health
.Care.Service
s5
91.8
622
Hospita
ls13
24.4
6.6
623
Nursin
g.and.Resid
entia
l.Care.Facilitie
s30
53.9
24.4
624
Socia
l.Assista
nce
11.9
1
621
Ambulatory.Health
.Care.Service
s13
79.7
6.6
622
Hospita
ls2
12.4
1.4
621
Ambulatory.Health
.Care.Service
s2
22.5
0.3
622
Hospita
ls3
33.9
0.6
623
Nursin
g.and.Resid
entia
l.Care.Facilitie
s1
8.5
0.3
623
Nursin
g.and.Resid
entia
l.Care.Facilitie
s1
2.7
0.7
623
Nursin
g.and.Resid
entia
l.Care.Facilitie
s1
2.7
0.7
621
Ambulatory.Health
.Care.Service
sHealth
.Inform
atics
43H3011
Bill6and6Account6Collectors**8
111.8
0.6
621
Ambulatory.Health
.Care.Service
s10
40.6
5.3
622
Hospita
ls1
3.7
0.6
623
Nursin
g.and.Resid
entia
l.Care.Facilitie
s1
2.9
0.8
Health
.Inform
atics
29H2071
SpeechFLanguage6Pathologists
Registered6Nurses
Medical6&
6Clinical6Lab6Technicians
Emergency6M
edical6Techs6&6Param
edics
Licensed6Practical6Nurses
Med6Records6&
6Health6Info6Technicians
Nursing6Assistants
Medical6Assistants
Healthcare6Support6Workers,6All6O
ther
Administrative6Services6M
anagers6**
Medical6&
6Health6Services6Managers
Mental6Health6Counselors**
Social6&6Hum
an6Services6Assistants**
Physical6Therapists
911611
13
Therapeutic.S
ervice
s31H1014
Health
.Inform
atics
31H9092
Health
.Inform
atics
31H9099
Health
.Inform
atics
35H1012
Health
.Inform
atics
43H4171
1stFLine6Svrs/Mgrs,6Food6Prep/Serv6**
Receptionists6&6Inform
ation6Clerks6**
Health
.Inform
atics
11H3011
Health
.Inform
atics
11H9111
Support.S
ervice
s21H1014
Support.S
ervice
s21H1093
Therapeutic.S
ervice
s29H1123
Therapeutic.S
ervice
s29H1127
Therapeutic.S
ervice
s29H1141
Diagnostic.S
ervice
s29H2012
Therapeutic.S
ervice
s29H2041
Therapeutic.S
ervice
s29H2061
30
24 788618
27955
169
HEALTH CAREINDUSTRIES FO
R PRINCIPAL OCCUPATIO
NS IN THE SOUTHERN REG
ION
Pathway
SOC*Code
SOC*Title
Average*Annual*Job*Openings
Annual*Occupation*
Openings*in*Industry
2022*Percent*of*
Occupation*
that*is*in*this*Industry
2022*Percent*of*
Employm
ent*in*this*Industry*that*is*this*Occupation
Median*Annual
Education*Entry*LevelExperience*Entry*
LevelTraining*Entry*Level
15.9
0.2
16
0.3
330
1.3
436.4
2.1
110.8
1.1
230.4
0.6
110
0.3
117.6
0.7
120.1
0.9
18
0.4
217.1
2
440.7
5.1
Therapeutic6Services29:1051
Pharmacists
72
25.31.3
$123,425Doctoral6or6professional6degree
None
None
756.3
1.8
325
1
16.7
0.5
228.4
0.5
113.6
0.3
1820.1
7.4
5259.2
28.9
67
5.8
10.9
0.8
344.3
1.1
241.4
1.3
1055
1.8
315.2
0.7
Therapeutic6Services29:2052
Pharmacy*Technicians
71
16.21
$27,517High6school6diplom
a6or6equivalentNone
Moderate:term
6on:the:job6training
828.9
3
416.3
2.3
1139.1
9.1
335.4
0.9
337.6
1.3
18.9
0.5
59
1.8
1324.4
6.6
3053.9
24.4
11.9
1
1379.7
6.6
212.4
1.4
222.5
0.3
333.9
0.6
18.5
0.3
12.7
0.7
12.7
0.7
Health6Informatics
43:3011Bill*and*Account*Collectors**
81
11.80.6
$29,429High6school6diplom
a6or6equivalentNone
Moderate:term
6on:the:job6training
1040.6
5.3
13.7
0.6
12.9
0.8
Support6Services21:1014
Mental*Health*Counselors**
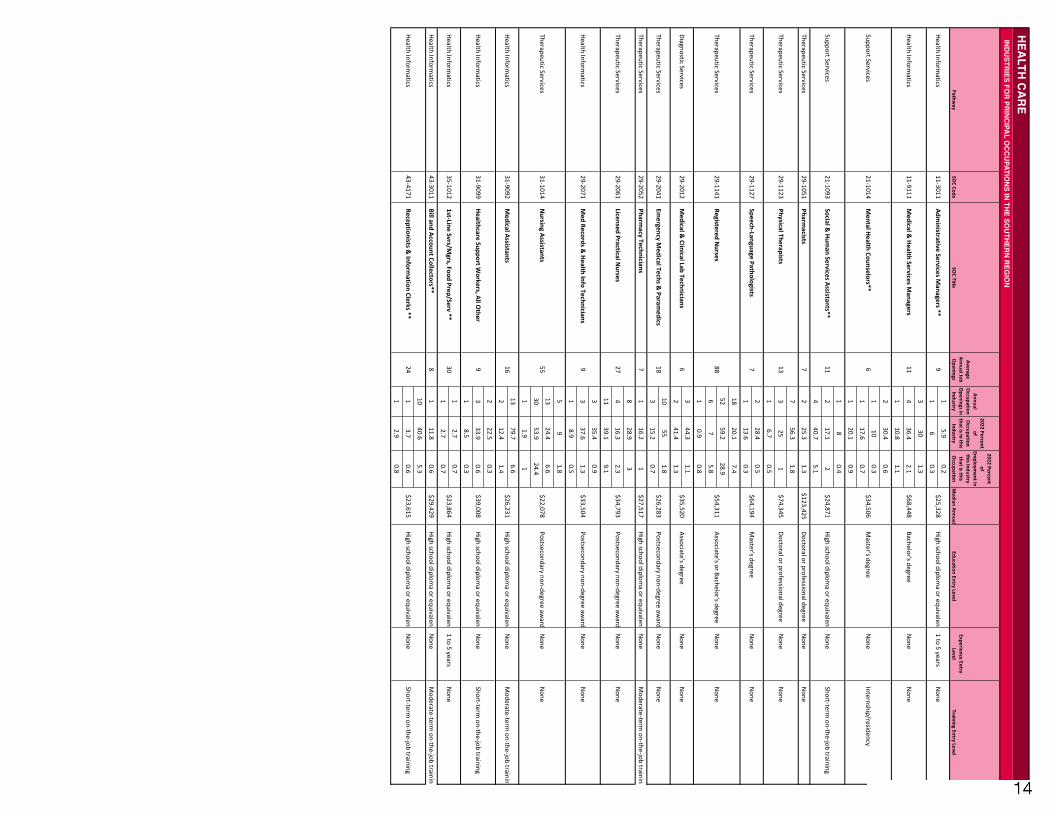
6$34,506
Master's6degree
None
Internship/residency
Support6Services21:1093
Social*&*Hum
an*Services*Assistants**11
$24,871High6school6diplom
a6or6equivalentNone
Short:term6on:the:job6training
Health6Informatics
11:3011Adm
inistrative*Services*Managers***
9$25,328
High6school6diploma6or6equivalent
16to656yearsNone
Health6Informatics
11:9111Medical*&
*Health*Services*Managers
11$68,448
Bachelor's6degreeNone
None
Therapeutic6Services29:1141
Registered*Nurses
88$54,311
Associate's6or6Bachelor's6degreeNone
None
Diagnostic6Services29:2012
Medical*&
*Clinical*Lab*Technicians6
$35,520Associate's6degree
None
None
Therapeutic6Services29:1123
Physical*Therapists13
$74,345Doctoral6or6professional6degree
None
None
Therapeutic6Services29:1127
SpeechKLanguage*Pathologists7
$64,194Master's6degree
None
None
Health6Informatics
29:2071Med*Records*&
*Health*Info*Technicians9
$33,504Postsecondary6non:degree6aw
ardNone
None
Therapeutic6Services31:1014
Nursing*Assistants
55$22,078
Postsecondary6non:degree6award
None
None
Therapeutic6Services29:2041
Emergency*M
edical*Techs*&*Param
edics18
$26,283Postsecondary6non:degree6aw
ardNone
None
Therapeutic6Services29:2061
Licensed*Practical*Nurses
27$34,793
Postsecondary6non:degree6award
None
None
16to656yearsNone
Health6Informatics
43:4171Receptionists*&
*Information*Clerks***
24$23,615
High6school6diploma6or6equivalent
None
Short:term6on:the:job6training
Health6Informatics
31:9092Medical*Assistants
16$26,231
High6school6diploma6or6equivalent
None
Moderate:term
6on:the:job6training
Health6Informatics
31:9099Healthcare*Support*W
orkers,*All*Other
9$39,008
High6school6diploma6or6equivalent
None
Short:term6on:the:job6training
HEALTH CAREINDUSTRIES FO
R PRINCIPAL OCCUPATIO
NS IN THE SOUTHERN REG
ION
Health6Informatics
35:10121stKLine*Svrs/M
grs,*Food*Prep/Serv***30
$23,864High6school6diplom
a6or6equivalent
SOC$Code
SOC$Title
Average$Annual$Job$Openings
NAICS
DESCRIPTION
Annual$Occupational$Openings$in$Industry
2022$Percent$of$occupation
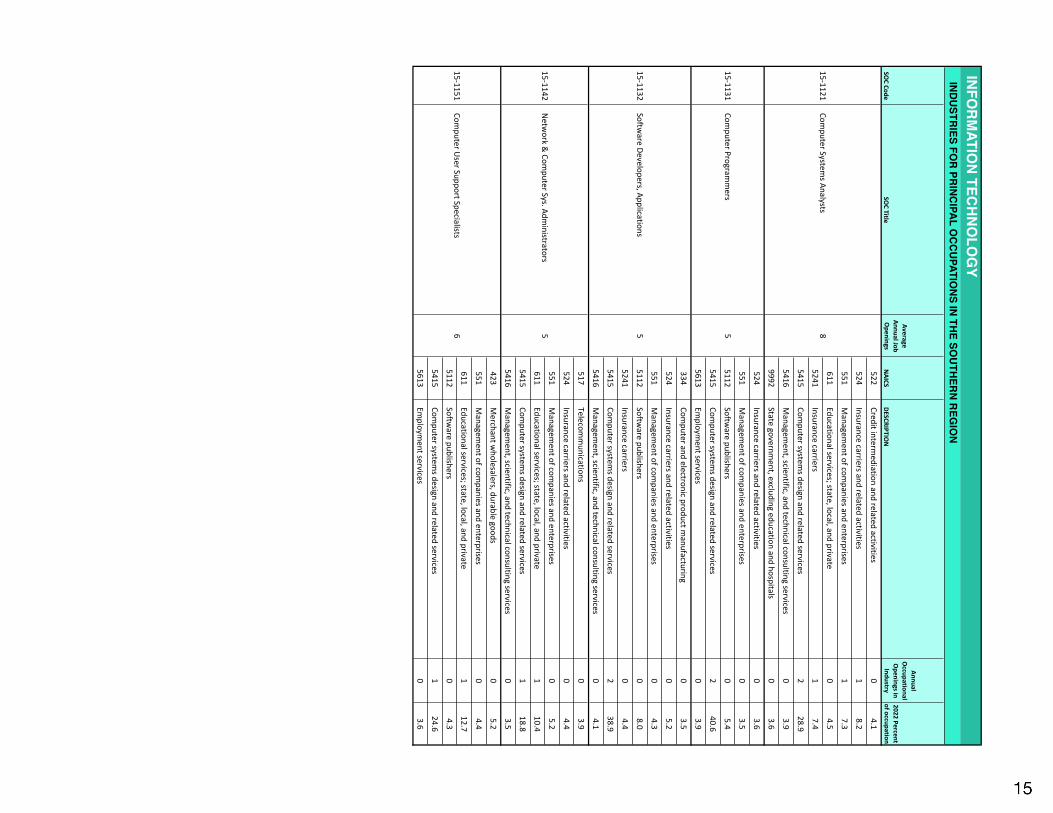
522Credit)interm
ediation)and)related)activities0
4.1
524Insurance)carriers)and)related)activities
18.2
551Managem
ent)of)companies)and)enterprises
17.3
611Educational)services;)state,)local,)and)private
04.5
5241Insurance)carriers
17.4
5415Com
puter)systems)design)and)related)services
228.9
5416Managem
ent,)scientific,)and)technical)consulting)services0
3.9
9992State)governm
ent,)excluding)education)and)hospitals0
3.6
524Insurance)carriers)and)related)activities
03.6
551Managem
ent)of)companies)and)enterprises
03.5
5112Softw
are)publishers0
5.4
5415Com
puter)systems)design)and)related)services
240.6
5613Em
ployment)services
03.9
334Com
puter)and)electronic)product)manufacturing
03.5
524Insurance)carriers)and)related)activities
05.2
551Managem
ent)of)companies)and)enterprises
04.3
5112Softw
are)publishers0
8.0
5241Insurance)carriers
04.4
5415Com
puter)systems)design)and)related)services
238.9
5416Managem
ent,)scientific,)and)technical)consulting)services0
4.1
517Telecom
munications
03.9
524Insurance)carriers)and)related)activities
04.4
551Managem
ent)of)companies)and)enterprises
05.2
611Educational)services;)state,)local,)and)private
110.4
5415Com
puter)systems)design)and)related)services
118.8
5416Managem
ent,)scientific,)and)technical)consulting)services0
3.5
423Merchant)w
holesalers,)durable)goods0
5.2
551Managem
ent)of)companies)and)enterprises
04.4
611Educational)services;)state,)local,)and)private
112.7
5112Softw
are)publishers0
4.3
5415Com
puter)systems)design)and)related)services
124.6
5613Em
ployment)services
03.6
5556
Computer)Program
mers
Software)D
evelopers,)Applications
Netw
ork)&)Com
puter)Sys.)Adm
inistrators
Computer)U
ser)Support)Specialists
15R1121
15R1131
15R1132
15R1142
15R1151
INFORM
ATION TECHNO
LOG
YINDUSTRIES FO
R PRINCIPAL OCCUPATIO
NS IN THE SOUTHERN REG
ION
Computer)System
s)Analysts
8
SOUTHERN REG
ION EDUCATIO
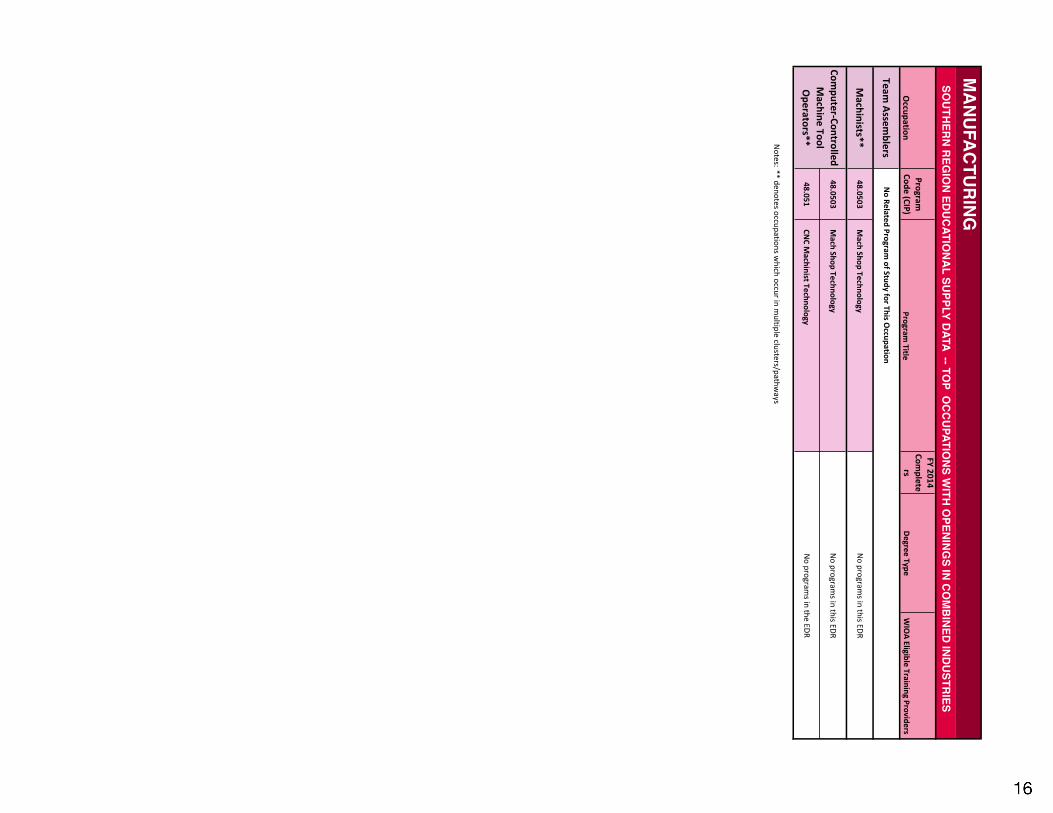
NAL SUPPLY DATA -- TOP O
CCUPATIONS W
ITH OPENING
S IN COM
BINED INDUSTRIES
Occupation
Program.
Code.(CIP)Program
.Title
FY.2014.Com
pleters
Degree.TypeWIOA.Eligible.Training.Providers
Team.Assem
blers
Machinists**
48.0503Mach.Shop.Technology
48.0503Mach.Shop.Technology
48.051CN
C.Machinist.Technology
Notes:**(denotes(occupations(w
hich(occur(in(multiple(clusters/pathw
ays
MANUFACTURING
No.Related.Program
.of.Study.for.This.Occupation
No(program
s(in(this(EDR
No(program
s(in(this(EDR
No(program
s(in(the(EDR
ComputerPControlled.Machine.Tool.
Operators**

Occu
patio
n
Program
.Code.(C
IP)
Program
.Title
FY.2014.
Complete
rsDegree.Typ
eWIOA.Eligib
le.Training.P
rovid
ers
49.0205
IL#Eastern#CC,Wabash#Valley
9<#1#Yr#Cert
IL#Eastern#CC,Wabash#Valley
Bus.D
rivers,.Transit.&
.
Intercity
Rend#Lake#College13
<#1#Yr#CertRend#Lake#College
Shawnee#CC
17<#1#Yr#Cert
Shawnee#CC
Southeastern#IL#College
TRANSPORTATIO
N, DISTRIBUTION & LO
GISTICS
SOUTHERN REG
ION EDUCATIO
NAL SUPPLY DATA -- TOP O
CCUPATIONS W
ITH OPENING
S IN COM
BINED INDUSTRIES
Community#
Colleges
School.B
us.D
rivers
Truck.D
rivers,.Heavy.
&.Tracto
r.Trailer**
Truck/B
us.D
river/Comm'l.V
ehicle.O
per
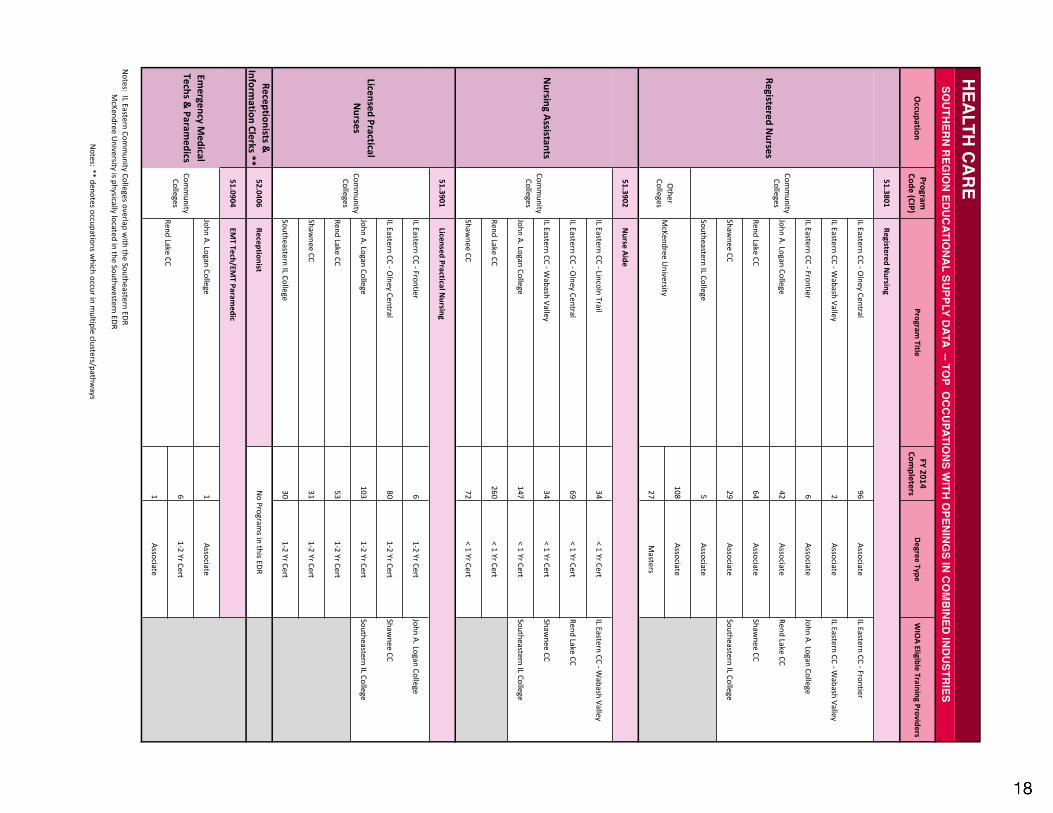
Occupation
Program.
Code.(CIP)Program
.TitleFY.2014.
Completers
Degree.TypeWIOA.Eligible.Training.Providers
51.3801
IL#Eastern#CC#,#Olney#Central
96Associate
IL#Eastern#CC#,#Frontier
IL#Eastern#CC#,#Wabash#Valley
2Associate
IL#Eastern#CC#,#Wabash#Valley
IL#Eastern#CC#,#Frontier6
AssociateJohn#A.#Logan#College
John#A.#Logan#College42
AssociateRend#Lake#CC
Rend#Lake#CC64
AssociateShaw
nee#CC
Shawnee#CC
29Associate
Southeastern#IL#College
Southeastern#IL#College5
Associate
108Associate
27Masters
51.3902
IL#Eastern#CC#,#Lincoln#Trail34
<#1#Yr#CertIL#Eastern#CC#,#W
abash#Valley
IL#Eastern#CC#,#Olney#Central
69<#1#Yr#Cert
Rend#Lake#CC
IL#Eastern#CC#,#Wabash#Valley
34<#1#Yr#Cert
Shawnee#CC
John#A.#Logan#College147
<#1#Yr#CertSoutheastern#IL#College
Rend#Lake#CC260
<#1#Yr#Cert
Shawnee#CC
72<#1#Yr#Cert
51.3901
IL#Eastern#CC#,#Frontier6
1,2#Yr#CertJohn#A.#Logan#College
IL#Eastern#CC#,#Olney#Central
801,2#Yr#Cert
Shawnee#CC
John#A.#Logan#College103
1,2#Yr#CertSoutheastern#IL#College
Rend#Lake#CC53
1,2#Yr#Cert
Shawnee#CC
311,2#Yr#Cert
Southeastern#IL#College30
1,2#Yr#Cert
Receptionists.&.
Information.Clerks.**
52.0406Receptionist
51.0904
John#A.#Logan#College1
Associate
61,2#Yr#Cert
1Associate
Notes:##IL#Eastern#Com
munity#Colleges#overlap#w
ith#the#Southeastern#EDR#############M
cKendree#University#is#physically#located#in#the#Southw
estern#EDR
Notes:**#denotes#occupations#w
hich#occur#in#multiple#clusters/pathw
ays
Licensed.Practical.Nurses
Registered.Nursing
Nurse.Aide
Community#
Colleges
Licensed.Practical.Nursing
Community#
Colleges
No#Program
s#in#this#EDR
EMT.Tech/EM
T.Paramedic
Emergency.M
edical.Techs.&
.Paramedics
HEALTH CARESO
UTHERN REGIO
N EDUCATIONAL SUPPLY DATA -- TO
P OCCUPATIO
NS WITH O
PENINGS IN CO
MBINED INDUSTRIES
McKendree#U
niversity
Rend#Lake#CC
Other#
Colleges
Community#
CollegesRegistered.N
urses
Nursing.Assistants
Community#
Colleges
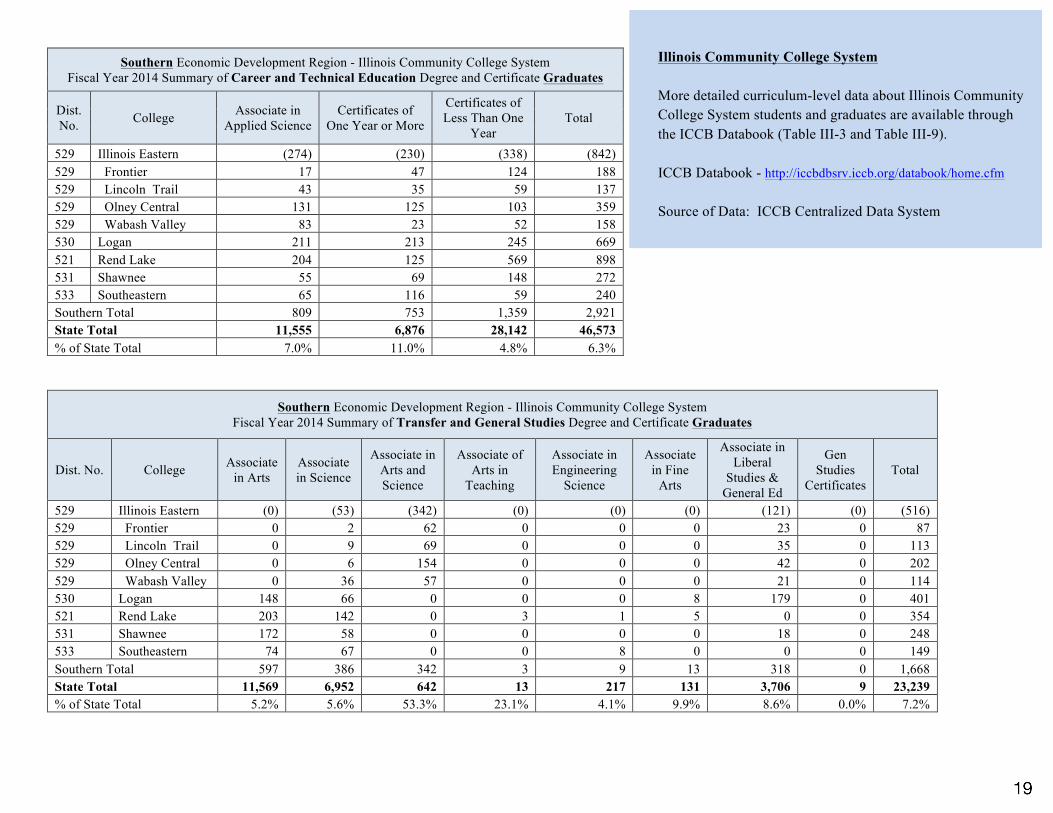
Southern Economic Development Region - Illinois Community College System Fiscal Year 2014 Summary of Career and Technical Education Degree and Certificate Graduates
Dist. No. College Associate in
Applied Science Certificates of
One Year or More
Certificates of Less Than One
Year Total
529 Illinois Eastern (274) (230) (338) (842) 529 Frontier 17 47 124 188 529 Lincoln Trail 43 35 59 137 529 Olney Central 131 125 103 359 529 Wabash Valley 83 23 52 158 530 Logan 211 213 245 669 521 Rend Lake 204 125 569 898 531 Shawnee 55 69 148 272 533 Southeastern 65 116 59 240 Southern Total 809 753 1,359 2,921 State Total 11,555 6,876 28,142 46,573 % of State Total 7.0% 11.0% 4.8% 6.3% !
Southern Economic Development Region - Illinois Community College System Fiscal Year 2014 Summary of Transfer and General Studies Degree and Certificate Graduates
Dist. No. College Associate in Arts
Associate in Science
Associate in Arts and Science
Associate of Arts in
Teaching
Associate in Engineering
Science
Associate in Fine
Arts
Associate in Liberal
Studies & General Ed
Gen Studies
Certificates Total
529 Illinois Eastern (0) (53) (342) (0) (0) (0) (121) (0) (516) 529 Frontier 0 2 62 0 0 0 23 0 87 529 Lincoln Trail 0 9 69 0 0 0 35 0 113 529 Olney Central 0 6 154 0 0 0 42 0 202 529 Wabash Valley 0 36 57 0 0 0 21 0 114 530 Logan 148 66 0 0 0 8 179 0 401 521 Rend Lake 203 142 0 3 1 5 0 0 354 531 Shawnee 172 58 0 0 0 0 18 0 248 533 Southeastern 74 67 0 0 8 0 0 0 149 Southern Total 597 386 342 3 9 13 318 0 1,668 State Total 11,569 6,952 642 13 217 131 3,706 9 23,239 % of State Total 5.2% 5.6% 53.3% 23.1% 4.1% 9.9% 8.6% 0.0% 7.2% !
!
Illinois Community College System More detailed curriculum-level data about Illinois Community College System students and graduates are available through the ICCB Databook (Table III-3 and Table III-9). ICCB Databook - http://iccbdbsrv.iccb.org/databook/home.cfm Source of Data: ICCB Centralized Data System !
19
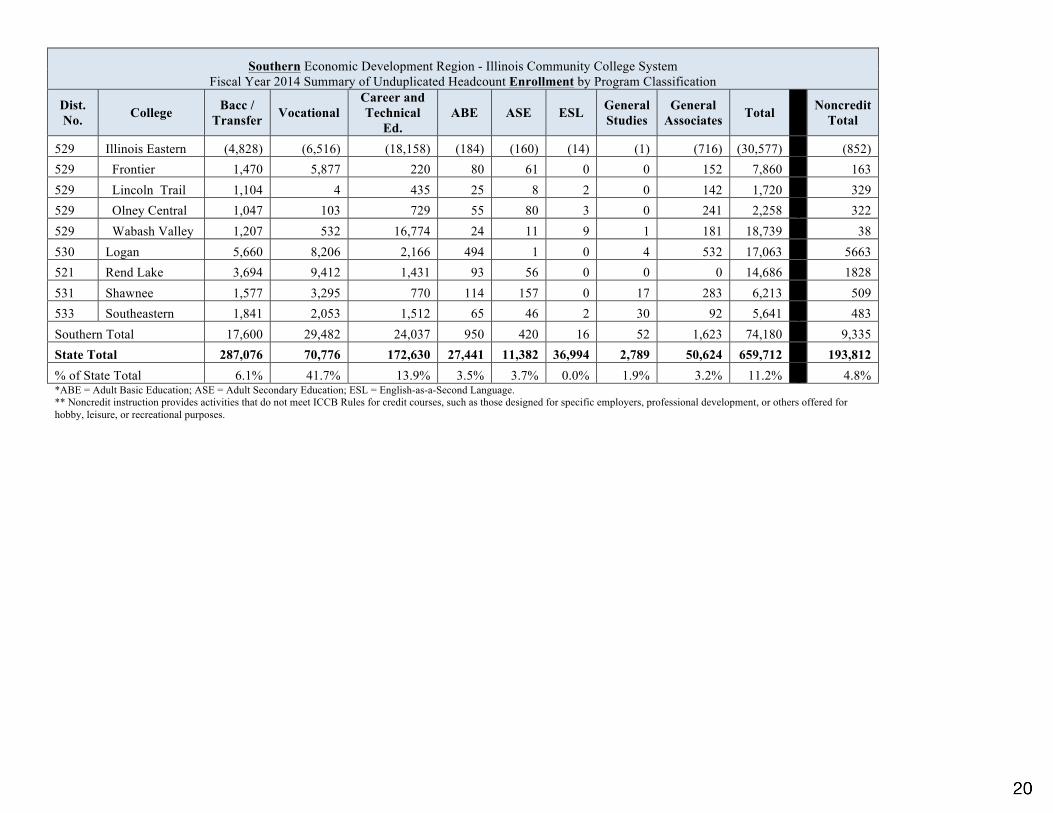
Southern Economic Development Region - Illinois Community College System Fiscal Year 2014 Summary of Unduplicated Headcount Enrollment by Program Classification
Dist. No. College Bacc /
Transfer Vocational Career and Technical
Ed. ABE ASE ESL General
Studies General
Associates Total Noncredit Total
529 Illinois Eastern (4,828) (6,516) (18,158) (184) (160) (14) (1) (716) (30,577) (852) 529 Frontier 1,470 5,877 220 80 61 0 0 152 7,860 163 529 Lincoln Trail 1,104 4 435 25 8 2 0 142 1,720 329 529 Olney Central 1,047 103 729 55 80 3 0 241 2,258 322 529 Wabash Valley 1,207 532 16,774 24 11 9 1 181 18,739 38 530 Logan 5,660 8,206 2,166 494 1 0 4 532 17,063 5663 521 Rend Lake 3,694 9,412 1,431 93 56 0 0 0 14,686 1828 531 Shawnee 1,577 3,295 770 114 157 0 17 283 6,213 509 533 Southeastern 1,841 2,053 1,512 65 46 2 30 92 5,641 483 Southern Total 17,600 29,482 24,037 950 420 16 52 1,623 74,180 9,335 State Total 287,076 70,776 172,630 27,441 11,382 36,994 2,789 50,624 659,712 193,812
% of State Total 6.1% 41.7% 13.9% 3.5% 3.7% 0.0% 1.9% 3.2% 11.2% 4.8% *ABE = Adult Basic Education; ASE = Adult Secondary Education; ESL = English-as-a-Second Language. ** Noncredit instruction provides activities that do not meet ICCB Rules for credit courses, such as those designed for specific employers, professional development, or others offered for hobby, leisure, or recreational purposes.
20

Southern Economic Development Region - Illinois Community College System Fiscal Year 2014 Summary of Graduates by Career Cluster
Dist. No. College A
gric
ultu
re, F
ood,
& N
atur
al R
esou
rces
Arc
hite
ctur
e &
Con
stru
ctio
n
Arts
, A/V
Tec
hnol
ogy
& C
omm
unic
atio
ns
Bus
ines
s Man
agem
ent &
Adm
inis
tratio
n
Educ
atio
n &
Tra
inin
g
Fina
nce
Gov
ernm
ent &
Pub
lic A
dmin
istra
tion
Hea
lth S
cien
ce
Hos
pita
lity
& T
ouris
m
Hum
an S
ervi
ces
Info
rmat
ion
Tech
nolo
gy
Law
, Pub
lic S
afet
y, C
orre
ctio
ns &
Sec
urity
Man
ufac
turin
g
Mar
ketin
g
Scie
nce,
Tec
hnol
ogy,
Eng
inee
ring
& M
athe
mat
ics
Tran
spor
tatio
n, D
istri
butio
n &
Log
istic
s
Oth
er
Tota
l*
529 Illinois Eastern (38) (20) (1) (15) (468) (0) (0) (508) (0) (19) (23) (16) (113) (18) (53) (34) (0) (1,326) 529 Frontier 0 18 0 1 86 0 0 118 0 0 13 0 2 0 2 9 0 249 529 Lincoln Trail 0 0 0 0 107 0 0 62 0 0 10 0 57 0 9 0 0 245 529 Olney Central 0 0 0 14 196 0 0 292 0 12 0 11 24 0 6 5 0 560
529 Wabash Valley 38 2 1 0 79 0 0 36 0 7 0 5 30 18 36 20 0 272
530 Logan 0 51 3 25 331 0 0 395 0 49 4 32 56 2 65 24 0 1,037 521 Rend Lake 72 14 15 10 205 0 0 446 30 43 11 9 104 0 141 81 0 1,181 531 Shawnee 1 1 1 3 190 0 0 199 0 13 5 7 24 0 58 18 0 520 533 Southeastern 12 12 1 10 75 0 0 68 0 55 8 12 20 0 75 15 0 363 Southern Total 123 98 21 63 1,269 0 0 1,616 30 179 51 76 317 20 392 172 0 4,427 State Total 935 2,893 815 3,098 16,744 27 0 18,294 1,729 2,109 2,396 2,918 2,799 331 6,691 5,964 18 67,761 %!of!State!Total! 13.2%! 3.4%! 2.6%! 2.0%! 7.6%! 0.0%! 0.0%! 8.8%! 1.7%! 8.5%! 2.1%! 2.6%! 11.3%! 6.0%! 5.9%! 2.9%! 0.0%! 6.5%!
*Career!Cluster!graduates!limited!to!three!credentials!within!fiscal!year!2014.!!Thus,!Career!Cluster!graduate!totals!may!be!slightly!less!than!previous!graduate!table!totals.!!!!
21

! !
Source'for'all'Information'on'this'Page:'US'Census'Bureau'Annual'County'Resident'Population'Estimates'for'2013'
!385,253!!
!389,777!!
385,371!
382,054!
3.37%!
3.14%!
3.00%! 2.97%!
2.80%&
3.00%&
3.20%&
3.40%&
&380,000&&
&385,000&&
&390,000&&
&395,000&&
1990& 2000& 2010& 2013&
Share&of&Illin
ois&P
opula<
on&
Popu
la<o
n&
Year&
Southern&EDR&Popula<on:&1990&C&2013&
Popula<on& Share&of&Illinois&Popula<on&
<"5"Years"Old"6.2%"
<"5"Years"Old"5.6%"
Ages"5218"17.3%"
Ages"5218"15.4%"
Ages"19264"63.0%"
Ages"19264"61.3%"
65+"Years"Old"13.5%"
65+"Years"Old"17.6%"
Illinois"
Southern"EDR"
Southern"EDR"vs."Illinois"PopulaIon"by"Age:"2013"
Foreign(Born*
Persons*2.1%*
Southern*EDR*Percent*Foreign(Born:*2013*
*
Illinois:*13.9%*
Language'Other'Than'English'
Spoken'At'Home'3.6%'
Southern'EDR'Percent'with'Language'Other'Than'English'Spoken'At'Home:'2013'
'
Illinois:'21.0%'
22

!!!!!!!!!!!!!!!!
!!
Source'for'all'Information'on'this'Page:'US'Census'Bureau'Annual'County'Resident'Population'Estimates'for'2013'
Veterans((33,618((8.8%(
Southern(EDR(Veterans:(2013(
(
Illinois:(5.7%(Not$HS$Grad$
12.7%$
Not$HS$Grad$14.4%$
HS$Grad$55.9%$
HS$Grad$66.5%$
Bachelor's$or$Higher$31.4%$
Bachelor's$or$Higher$19.1%$
Illinois$
Southern$EDR$
Southern$EDR$vs.$Illinois$Age$25+$PopulaIon$by$EducaIonal$ALainment:$2013$$
$57,792'$39,730'
$0# $10,000# $20,000# $30,000# $40,000# $50,000# $60,000#
Southern'EDR'vs.'Illinois'Median'Household'Income:'2013'
Southern'EDR' Illinois'
Persons'Below'Poverty'Level''73,508''19.2%'
Southern'EDR'Percent'Below'Poverty'Level:'2013'
'
Illinois:'14.1%'
23
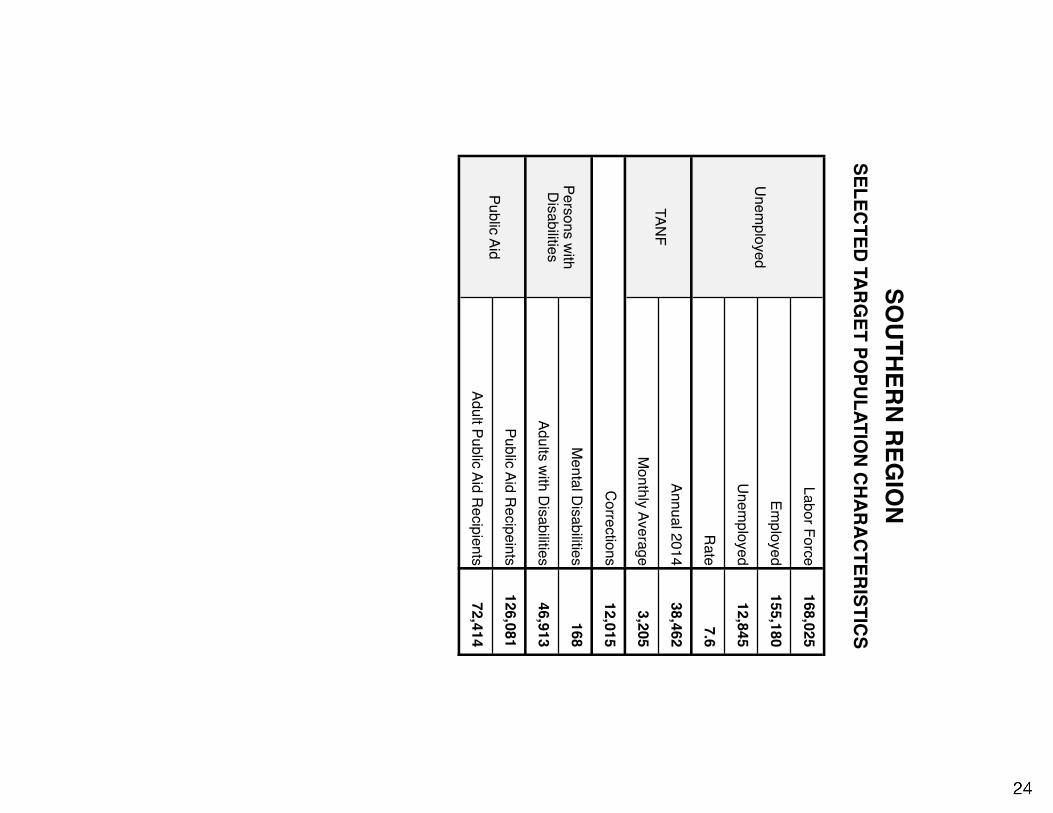
Labor Force168,025
Employed
155,180
Unem
ployed12,845
Rate
7.6
Annual 201438,462
Monthly Average
3,205 12,015
Mental D
isabilities168
Adults with D
isabilities46,913
Public Aid Recipeints
126,081
Adult Public Aid Recipients
72,414
Persons with
Disabilities
Public Aid
SOUTHERN REG
ION
SELECTED TARGET PO
PULATION CHARACTERISTICS
Unem
ployed
TANF
Corrections