southeast asian mathematics education journal
TRANSCRIPT
SOUTHEAST ASIAN
MATHEMATICS EDUCATION
JOURNAL
VOLUME 2, NO. 2 NOVEMBER 2012 ISSN 2089-4716
Southeast Asian Ministers of Education Organization (SEAMEO)
Regional Centre for Quality Improvement of Teachers and Education Personnel (QITEP) in Mathematics
Yogyakarta, Indonesia
i

Southeast Asian Mathematics Education Journal (SEAMEJ) is anacademic journal devoted to reflect a variety of research ideas andmethods in the field of mathematics education. SEAMEJ aims tostimulate discussions at all levels of mathematics education throughsignificant and innovative research studies. The Journal welcomesarticles highlighting empirical as well as theoretical researchstudies, which have a perspective wider than local or nationalinterest.All papers submitted to the Journal are peer reviewed beforepublication.
The SEAMEJ (ISSN: 2089-4716) is the official journal ofSEAMEO QITEP in Mathematics and published yearly inDecember. Readers wishing to submit manuscripts for publicationshould refer to instruction notes which can be found on the insideback cover.
All correspondence including comments, suggestions,contributions or other related inquiries should be addressed to:
The DirectorSEAMEO QITEP in Mathematics
Jl. Kaliurang Km. 6, Sambisari, Condongcatur, DepokSleman, Yogyakarta, Indonesia.
Phone: +62(274)889987Fax: +62(274)887222
Email: [email protected]
Southeast Asian Mathematics Education Journal
2012, Vol. 2 No. 2
iii

Southeast Asian Mathematics Education Journal 2012, Vol.2 No.2
v
Editorial Board Members
Subanar SEAMEO QITEP in Mathematics Widodo PPPPTK Matematika Yogyakarta Ganung Anggraeni PPPPTK Matematika Yogyakarta Wahyudi SEAMEO QITEP in Mathematics Pujiati SEAMEO QITEP in Mathematics Sahid SEAMEO QITEP in Mathematics Anna Tri Lestari SEAMEO QITEP in Mathematics Punang Amaripuja SEAMEO QITEP in Mathematics Manuscript Editors
Sriyanti SEAMEO QITEP in Mathematics Siti Khamimah SEAMEO QITEP in Mathematics Rachma Noviani SEAMEO QITEP in Mathematics Marfuah SEAMEO QITEP in Mathematics Luqmanul Hakim SEAMEO QITEP in Mathematics Mutiatul Hasanah SEAMEO QITEP in MathematicsTri Budi Wijayanto SEAMEO QITEP in Mathematics Wahyu Kharina Praptiwi SEAMEO QITEP in Mathematics Administrative Assistants Rina Kusumayanti SEAMEO QITEP in Mathematics Rini Handayani SEAMEO QITEP in Mathematics Cover Design & Typesetting
Joko Setiyono SEAMEO QITEP in Mathematics Suhananto SEAMEO QITEP in Mathematics Eko Nugroho SEAMEO QITEP in Mathematics Tika Setyawati SEAMEO QITEP in Mathematics Febriarto Cahyo Nugroho SEAMEO QITEP in Mathematics
International Advisory Panels
Mohan Chinnapan University of South Australia Philip Clarkson Australian Catholic University Lim Chap Sam Universiti Sains Malaysia Cheah Ui Hock SEAMEO RECSAM Malaysia Noraini Idris Universiti Pendidikan Sultan Idris, Malaysia Paul White Australian Catholic University Parmjit Singh Universiti Technology Mara Malaysia Michael Cavanagh MacQuarie University Australia Jaguthsingh Dindyal Nanyang University Singapore Chair Fadjar Shadiq SEAMEO QITEP in Mathematics Chief Reviewer Allan Leslie White University of Western Sydney, Australia

Southeast Asian Mathematics Education Journal
2012, Vol. 2 No. 2
Wahyudi & Allan Leslie White 1 Editorial
Xingfeng Huang, Jinglei Yang,
Bingxing Tang, Lingmei Gong, ZhongTian
3 An Experienced Chinese Teacher’s
Strategies In Teaching Mathematics:Translation of Quadratic Functions
Paul White, Sue Wilson, & Michael
Mitchelmore
11 Teaching for Abstraction: Teacher
Learning
Catherine Attard 31 Transition from Primary to Secondary
School Mathematics: Students’
Perceptions
Sue Wilson & Steve Thornton 45 Bibliotherapy: A Framework forUnderstanding Pre-Service Primary
Teachers’ Affective Responses to
Learning and Teaching Mathematics
S. Kanageswari Suppiah Shanmugam
&LeongChee Kin
61 IntroducingComputer Adaptive Testing
to a Cohort of Mathematics Teachers:The Case of Concerto
Allan Leslie White 75 What Does Brain Research Say aboutTeaching and Learning Mathematics?
Ida Karnasih & Wahyudi 89 Exploring Student Perceptions on
Teacher-Students Interactionand Classrooms Learning Environments
in Indonesian Mathematics Classrooms
CONTENTS
ISSN 2089-4716
vii

Southeast Asian Mathematics Education Journal 2012, Vol. 2 No. 2
1
Editorial This is the second edition of the South East Asia Mathematics Education Journal
(SEAMEJ) which is an academic journal devoted to publishing a variety of research studies and theoretical papers in the field of mathematics education. SEAMEJ seeks to stimulate discussion at all levels of the mathematics education community. SEAMEJ aims to eventually publish an edition twice a year, in June and December.
SEAMEJ is supported by the Southeast Asian Ministers of Education Organization (SEAMEO), Centre for Quality Improvement of Teachers and Education Personnel (QITEP) in Mathematics situated in Yogyakarta Indonesia. Launched on July 13, 2009, there are now three QITEP SEAMEO Centres for Quality Improvement of Teachers and Education Personnel in Indonesia. One centre is in Mathematics (Yogyakarta), one in Science (Bandung) and one in Languages (English - Jakarta).
The first edition was produced using revised papers from the first International Symposium of QITEP Mathematics in November 2011, where a number of paper presenters were approached to submit their reworked papers to this journal. In this issue we are proud to state, there are papers that have been submitted by researchers from a number of countries. We hope that trend this will continue and swell as the journal becomes widely read and enable us to meet our aim of two editions in one year.
In this issue we begin with a paper that provides some insights into the mathematics teaching in Shanghai China. The paper describes the struggle of a teacher and tends to concentrate more upon the teaching issues and less upon the research issues. While researchers may not find all the information they would like, nevertheless, as this journal seeks to serve both teachers and researchers, this paper deserves to be widely read. The papers that follow cover a wide range of issues and perspectives and include research into: translating concrete understanding to the abstract by students and how to help teacher achieve this end; a further elaboration of a longitudinal study of Australian transition years and school student engagement; a further elaboration of bibliotherapy with a framework for use with pre-service teachers; a report on a professional learning workshop using a computer adaptive assessment program; the implications that brain research has for the teaching and learning of mathematics, and finishing with a study exploring on psychosocial learning environment in Indonesian mathematics classrooms. We are very thankful for this early support.
As this is only the second edition we are still refining our processes and so we wish to apologise if we have made errors or omissions. We welcome feedback and suggestions for improvement, but most of all, we welcome paper contributions.
The Journal seeks articles highlighting empirical as well as theoretical research studies, particularly those that have a perspective wider than local or national interests. All contributions to SEAMEJ will be peer reviewed and we are indebted to those on the International Advisory Panel for their support.
Wahyudi
Allan L White

Southeast Asian Mathematics Education Journal 2012, Vol. 2 No. 2, 3 - 10
3
An Experienced Chinese Teacher’s Strategies In Teaching Mathematics: Translation of Quadratic Functions
Xingfeng Huang, Jinglei Yang, Bingxing Tang, Lingmei Gong, Zhong Tian Department of Mathematics, Changshu Institute of Technology, Jiangsu, China.
Abstract
The study selected the topic of translation of quadratic functions. In order to explore some effective instructional strategies to help students understand this topic, an experienced teacher was chosen for a case study. Based on lesson observation and semi-structure interviews, this study found that the teacher employed various strategies to facilitate students understanding of translations of quadratic functions.
Keywords experienced Chinese teacher; strategies; translation of quadratic function
Introduction
With the background of Chinese curriculum innovation, how do mathematics teachers apply teaching strategies to classroom practice? This issue aroused researchers’ interest. A lot of mathematics public lessons (in Chinese公开课) attracted their research (Huang, 2009; Huang & Fan, 2009; Li & Li, 2009, Huang & Li, 2009). The purposes of these studies were not only to promote policy-makers to understand the implementation of curriculum innovation, but also to encourage teachers to have opportunities to learn while reflecting on their own teaching (Yu, 2002; Wong, 2009). However, there has been criticism of the model lessons. Some people argued that public lessons looked like certain shows which are pretty but not practical and that these lessons did not represent the real matter (Qian, 2007). With this in mind, it became important to pay special attention to teachers’ strategies in their routine classroom practice. This study focuses on a junior school teacher with 10 years of teaching experience, and explores his teaching strategies in his routine classroom.
Focus On A Challenging Topic
As the evaluation of the teacher, as well as the evaluation of classroom teaching
strategies, it is often rewarding if he completes a challenging task. It is a good opportunity for the teacher to exhibit his instructional wisdom, when he is given challenging tasks.
For secondary students, function is a difficult mathematics concept (Leinhardt, Zaslavsky, & Stein, 1990; Sajka, 2003; Vinner & Dreyfus, 1989). From grade 7 to 9, the curriculum introduces the specific function of three types: linear function, inverse function and quadratic function (Ministry of Education, 2001). The results show that students encounter a lot of cognitive obstacles in learning quadratic functions (Zaslavsky, 1997). Textbooks of grade 7 to 9 often include this topic, which is finally introduced in the algebraic field. In the chapter of quadratic function, translation of y=ax2 graph is an important
An Experienced Chinese Teacher’s Strategies In Teaching Mathematics: Translation of Quadratic Functions
4
component. The translation of quadratic functions includes vertical, horizontal and compound ones. In order to understand translation of quadratic function, first we must understand the concept of quadratic function. Because any translation of quadratic function is, by nature, an operation, students should think of quadratic function as an operational object. The order of instruction also brings obstacles to students’ learning because they are usually taught vertical translation ahead of horizontal translation (Zazics, Liljedahl, & Gadowsky, 2003). Vertical translation of quadratic functions coincides with students’ intuition. For example, students are asked to translate y=x2 to y=x2+1. Comparing the two function expressions, if they add a positive one to x2, the graph of y=x2 will be moved up one unit in the positive direction along axis y. However, horizontal translation is against intuition. If y=x2 is supposed to be translated to y=(x+1)2, x in the former expression is also added into a positive one, then the graph moved left toward in the negative direction along the axis x. Since it is so different from vertical translation, it would be quite difficult for students to understand the concept of horizontal translation. A study by Eisenberg and Dreyfus (1994) shows it would be hard for students to understand horizontal translation. Baker, Hemenway, and Trigueros (2000) used APOS theory to explain students’ learning difficulty. The vertical action is operated directly on a quadratic function, while the actions in horizontal are different, in which two operations are included, first on the variable, and then on the function.
Research Question
Recently some studies began to investigate Chinese curriculum innovation influences on mathematics classroom teaching (Huang, 2009; Huang & Fan, 2009; Li & Li, 2009, Huang & Li, 2009). The main concern of these studies was to observe some excellent mathematics lessons, which were usually isolated, in which teachers were not observed in a structured way. In order to overcome the deficiencies of these studies, this study was grounded in curriculum innovation and conducted a series of successive observations of routine lessons, in which the focus was on the experienced teacher’s strategies. In order to promote an understanding of the teacher’s strategies, we chose a challenging topic of translation of quadratic functions. The research question was: What strategies does the experienced teacher use to help students understand the concept of translation of quadratic functions?
Methodology
Participant
Mr S graduated from the Department of Mathematics of a Normal university in 1999. He has 10 years teaching experience in Qin Chuan Junior School. He studied part-time for his Education Master Degree, and now he is preparing his dissertation. Qin Chuan Junior School covers about 66 acres, located in the west of Yucheng, which is a small city in the southern
Xingfeng Huang, Jinglei Yang, Bingxing Tang, Lingmei Gong, Zhong, Tian
5
region of Jiangsu. This school has about 2,500 students divided into three grades from seven to nine. Each grade has 16 classes, and each class has 45 to 50 students mostly from local families.
We invited Mr S to participate in this study, because on the one hand he is an experienced teacher, and on the other hand, he and the researchers have a good relationship so as he can help us to complete the study successfully.
Data collection
From October to November 2009, Mr S’s class of grade 9 was studied. The content of translation of quadratic functions was divided into three lessons, each of which has about 40minutes. In each mathematics classroom, a researcher videoed, and another wrote field notes. After each lesson, the lesson plan was copied, and the teacher was interviewed by the researcher using a semi-structured process where the researcher wrote notes. At the same time, the researcher who had videoed the lesson also recorded the whole process of the interview. Videos of the lessons and interviews were translated into scripts by four assistants.
In the next section a description is presented of how the experienced teacher used effective strategies to help students understand vertical translation of quadratic functions. His strategies have been identified to be similar with the other two lessons, the result of which is set aside for an appropriate occasion.
Results
Review and foreshadowing (in Chinese铺垫) Before the lesson, Mr S copied a mathematics task on the blackboard. The task was: If
the quadratic function y=ax2 and the line y=x-1 have only one common point, then how many points of intersection do the function y=4ax2 and the line y=x+3 have?
Mr S pointed out that the quadratic function could be denoted by an algebraic expression, but also could be represented by a graph. Therefore students could access solutions using two perspectives. He said: “We have learned features of function graph for some days, so I hope that you can use the graph features to solve this problem.” Next, the problem solving process was completed under the control of him. He asked his students to draw the two possible graphs of the quadratic function y=ax2. At the same time he drew the two graphs of concave up and down on the blackboard.
The following are the teacher-student interactions. On the blackboard Mr S drew the graph, in which y = ax2 and y = x-1have only one common point. Then Mr S asked students to stretch the graph of y = ax2, and translate the graph of y = x-1 in the same system, so that they constructed the graph of y = 4ax2 and y = x+3. Finally, the teacher guided his students to solve this problem by setting up an equation system.
In this teaching episode, based on the task, the class reviewed the relation between the opening direction and size of a parabola and its coefficient ‘a’ contained in the expression. On
An Experienced Chinese Teacher’s Strategies In Teaching Mathematics: Translation of Quadratic Functions
6
the other hand, translation of the linear function was employed to foreshadow the translation of the quadratic function.
Actually the teacher attempted to highlight the importance of the graph solution, although he guided his students to solve this problem by algebraic solution later. In the lesson, he gave a cue to his students: "We have learned the graph of a function, so I hope you can use graph features to solve this problem first of all." In the interviews, Mr S emphasized repeatedly that students lacked the idea of combining figures with graph (in Chinese数形结合). It is hard for students to associate the features of a function graph with its algebraic expression, and they felt it was difficult to learn quadratic functions. He also made it clear that he would always stress the idea of combining figures with graphs in teaching quadratic functions. He is convinced that if students generated this idea, they would be assured of understanding the content of quadratic functions, and be able to solve the problems related to it.
Transition
Mr S made a transit to the theme of this lesson, vertical translation of quadratic functions. He asked: "What is the relationship between the quadratic functions y = ax2 and
y = ax2+bx+c?" After a moment in silence, he told the students: “Special versus General". Then, Mr S asked his students to classify y = ax2+bx+c according to its coefficients whether it is zero or not. Then, he raised a question: "What is the relationship between the graph of y = ax2 and y = ax2+bx+c?"
In fact, it was found that the classification of the quadratic function was too difficult for the students. Although he gave his students a lot of cues, and gave them time to explore it, they did not finally succeed. The students’ performance in the lesson surprised the teacher. After the lesson he said:
I have spent too much time dealing with classification, which should not be stressed in this lesson. My intention was to enable students to realize the algebraic relation between y = ax2 and y = ax2 +c, and pilot them to consider the graph relation between them.
His comment implies that he dealt with the classification of quadratic functions because of two points. Firstly, considering the pedagogy, he wanted to strengthen the coherence of the classroom instruction. Secondly, he emphasized the connection among y=ax2+bx+c, y=ax2 and y=ax2+c, in order to encourage his students to understand the concept of quadratic functions.
Core concept
Conjecture. The instruction focuses on the core concept of the lesson. Mr S posed the problem which should be solved in the lesson. He said: “We have learned the function of y=ax2. Today we will explore the features of the function y=ax2+c. These look quite alike. As to how obtain y=ax2+c, just add c to y=ax2. What changes on the graph?” His students
Xingfeng Huang, Jinglei Yang, Bingxing Tang, Lingmei Gong, Zhong, Tian
7
answered in unison: “Translate it upward or downward”. It looked like a very obvious matter for them. Mr S invited a student to make the explanation. He asked: “Yun, can you explain?”
Yun: Just like the translation on linear function. Mr S: Can you give us an example? Yun: y=2x, y=2x+1
Yun made an analogy translation of linear function to translation of a quadratic one. Perhaps, the foreshadowing at the beginning of the lesson had an effect on their thinking. So the student could easily connect two type of translation with. Mr S said would like to hear other different answers.
Feng: Take a point on y=ax2. Its abscissa is x, while its ordinate is ax2. Mr S: Let(x1, y1). Feng: Substitute x1in y=ax2+c, then get y1+c. Mr S: What is the position relation between the points of (x1, y1)and(x1, y1+c)? Feng: Translate upward or downward.
In fact, the teacher emphasized the explanation of the graphical features on the algebraic perspective. In the previous lesson, he had always taken the trouble to lead his students to use point-coordinates to interpret the symmetry of y=ax2. In the interview, he said:
Algebraic explanation is the most powerful. When we see a function expression, we should think of its graphical features; when looking at function graph, we should explain it on the algebraic perspective.
It also shows that Mr S always highlighted the idea of combining figures with graphs. In this episode, he first attempted to give students an overall impression on the
translation of quadratic function. He expected that students would preliminarily perceive the translation of a parabola before accessing details. This strategy which is consistent with the view of Gestalt could facilitate students to connect existing cognitive conceptions (translation of linear function) with the overall impression so as to establish the structure which can assimilate specific knowledge.
Depicting points to draw a parabola. Mr S requested his students to complete the
mathematical task: Depicting points to draw parabolas of y = ½ x2, 21 +12
y x= , and 21 -12
y x=
at the same coordinate system, then discussing their features. In the first step, the teacher listed a table on the blackboard, took x =- 3, -2, -1, 0, 1, 2,
3symmetrically, and found the corresponding value of 212
y x= in order. He said: “Do you
think the value of 21 +12
y x= must be calculated in this way? ... Yes, don’t calculate any
longer, as long as the latter’s corresponding value of the 212
y x= plus one.” When they were
An Experienced Chinese Teacher’s Strategies In Teaching Mathematics: Translation of Quadratic Functions
8
to find the corresponding value of function 21 -12
y x= , he also asked the students to focus
their attention on the feature: as long as the last function’s value is same from the function21
2y x= but add negative one.
In the tabulation process, Mr S asked his students repeatedly to pay attention to the numerical relation among the three functions’ values, in which the same number was taken from. In this way, he intended to help his students to understand the relation among the function graphs.
The teacher required each student to depict the graphs of 212
y x= , 21 +12
y x= , and
21 -12
y x= on the cross-section paper. A few students drew exotic graphs: (1) The three
parabolas’ vertices coincided at the origin; (2) Parabolas intersected; (3) Parabolas extended in different directions, but did not intersect. Mr S saw several students drawing intersected parabolas, then required all students to watch the parabolas which he had drawn on the blackboard. He explained: “It is impossible for these parabolas to intersect, because each
point on the graph of 212
y x= is moved upward one unit, so as to get the graph of 21 +12
y x= .
Can the original graph intersect with the new one? No, they cannot.” After the lesson, we told Mr S the other errors in drawing the parabolas. He felt
surprised that these students drew the three parabolas with the same vertex. He said:
If so, students still have no idea of translation? I already elicited students to conjecture. The purpose is to promote them to generate a overall impression on the translation. And I stressed repeatedly the change of the values in the table. Perhaps their impression on the graph of 2y ax= is too deep -vertex must be at the origin.
Mr S had confidence that what he had done could enhance students’ understanding of translation. He just contributed a few students’ errors to their prior experience. So we can understand why the teacher employed similar strategies in the other two lessons on translation.
Because the teacher did not consider these errors in drawing before the lesson, his interpretation was confusing. In fact, a graph may intersect with the moved one. For example, a circle may intersect with the moved one. It was hard for him to make effective strategies to deal with unexpected accidents in classroom.
Depicting points in order to draw a parabola can be seen as the first stage of learning as Bruner (1967), namely the enactive mode. With concrete operations, students can take a quadratic function as an object, and construct the concept of translation based on their understanding.
Xingfeng Huang, Jinglei Yang, Bingxing Tang, Lingmei Gong, Zhong, Tian
9
Sketch. The teacher required the students to sketch graphs of 21-2
y x= , 21- +12
y x= ,
and 21- -12
y x= . As far as the teaching arrangement was involved, he explained:
At first, students can familiarize with the knowledge that they have just learned. At second, they have learned the parabolas of up-opening, and now they do an exercise on down-opening. Furthermore, in solving problems we usually sketch rather than depict points.
The teacher’s intention was obvious. On the one hand, he tried to make students understand the concept of translation with variation. On the other hand, he trained students’ sketch skills, which could be used to solve problems. The teacher has a further understanding of the sketch value. He believed that conceiving a graph in the mind is more important than depicting points to draw it. Here, the former means the graph of a quadratic function operated in the mind, which is the second stage of Bruner’s iconic mode, semi-concrete operation. The stage of iconic operation is important for students to understand the abstract concept of translation, the symbolic mode, which is the third learning stage defined by Brunner.
Summary
In classroom interactions, students observed similarities and differences between the
graphs of y = ax2 and y = ax2+ c, and then generalized the relation between them, so that they completed the third learning stage of symbolic mode.
In the instructional process of the core concept, the teacher firstly gave his students an overall impression of the translation process, and then accessed details. Students experienced the specific--semi-specific and semi-abstract-- abstract stage, in which they depicted points to draw a graph, or sketch, and generalized vertical translation of quadratic functions.
After that, there was no time to do other exercises in the class. However, the teacher’s plan had not been completed. His intention before the lesson was to consolidate students’ concept of the translation with some mathematics exercises.
Conclusion
In the lesson, the teacher emphasized the idea of combining figures with graphs, and
highlighted the strategy of connecting algebraic representation with visualization. To be specific: (1) A mathematical task was selected to review what the students have learned, and prepare for learning new conception; (2) Foreshadowing and transit ion added to the lesson fluency, and different mathematics structures were connected; (3) the teacher gave students an overall impression of the core concept first, then accessed details; (4) The students learned the conception in a specific--semi-specific and semi-abstract-- abstract process; (5) The teacher intended to consolidate the concept with some mathematics exercises.
An Experienced Chinese Teacher’s Strategies In Teaching Mathematics: Translation of Quadratic Functions
10
Acknowledgement This research was supported by Ministry of Education (China) under GOA107014.
Reference
Baker, B., Hemenway, C., & Trigueros, M. (2000). On transformations of basic functions. In: H. Chick, K. Stacey, & J. Vincent (Eds.), Proceedings of the 12th ICMI Study Conference on the Future of the Teaching and Learning of Algebra (pp. 41-47). University of Melbourne.
Bruner, J. S. (1966). Toward a theory of instruction. Cambridge, MA: Harvard University Press.
Huang, X. F. (2009). Research on Mathematics Classroom in Shanghai. Nanning: Guangxi Education Publishing House.
Huang, X. F., & Fan, L. H. (2009). Instructional practice in mathematics classroom driven by curriculum reform: a case study of model lesson from the Shanghai Two Round Curriculum Reform. Journal of Mathematics Education, 3, 25-30.
Huang, R., & Li, Y. (2009).Pursuing excellence in mathematics classroom instruction through exemplary lesson development in China: a case study.ZDM-The International Journal on Mathematics Education, 41, 297-309.
Eisenberg, T., & Dreyfus, T. (1994). On understanding how students learn to visualize function transformations. In: E. Dubinsky, A. Schoenfeld, & J. Kaput (Eds.), Research in collegiate mathematics education 1, (pp. 45-68). Providence, RI: American Mathematical Society.
Leinhardt, G., Zaslavsky, O., & Stein, M. K. (1990). Function, graphs, and graphing: Tasks, learning, and teaching. Review of educational Research, 60, 1-64.
Li, Y., &Li, J. (2009). Mathematics classroom instruction excellence through the platform of teaching contests. ZDM-The International Journal on Mathematics Education, 41, 263-277.
Ministry of Education. (2001). Mathematics Curriculum Standards in Compulsory Education. Beijing: Beijing Normal University publishing House.
Qian, W. W. (2007). Commentary of several contentious issues about open class.Shanghai Research On Education, 7, 34-37.
Sajka, M. (2003). A secondary school students’ understanding of the concept of function: a case study. Educational Studies in Mathematic, 53, 229-254.
Vinner, S., & Dreyfus, T. (1989). Images and definitions for the concept of function.Journal for Research in Mathematics Education, 20, 356-366.
Wong, N. (2009). Exemplary mathematics lessons: What lessons we can learn from them? ZDM-The International Journal on Mathematics Education, 41, 379-384.
Yu, P. (2002). Briefly on dual-function of publicly-given class. Shanghai Research On Education1, 31-33.
Zaslavsky, O. (1997). Conceptual obstacles in the learning of quadratic functions.Focus on Learning Problems in Mathematics, 19, 20–44.
Zazics, R., Liljedahl, P., & Gadowsky, K. (2003). Conceptions of function translation: obstacles, intuitions, and rerouting. Journal of Mathematical Behavior, 22, 437-450.
Southeast Asian Mathematics Education Journal 2012, Vol. 2 No. 2, 11 - 30
11
Teaching for Abstraction: Teacher Learning
Paul White, Sue Wilson Australian Catholic University
<[email protected]; [email protected]>
Michael Mitchelmore Macquarie University
Working collaboratively with the researchers, a small team of teachers developed and taught two Grade 6 mathematics lessons based on the Teaching for Abstraction model (White & Mitchelmore, 2010). This paper reports how one teacher learned about the model and implemented it in practice. It was found that she assimilated several key features of the model, such as starting with several embodiments of the target concept and guiding students to look for similarities between them. However, it was more difficult for her to help students abstract and reify the target concept and link it to other mathematical concepts. It was concluded that teachers also need to abstract Teaching for Abstraction, and need more embodiments of it before they can reify and implement an effective model.
Keywords: learning by abstraction, Lesson Study, primary school education, professional growth, teacher learning
Over the past decade, the first and last author have been developing a mathematics
teaching model called Teaching for Abstraction which is based on a specific theory of
learning mathematics. However, we have repeatedly found that teachers’ ability to
comprehend the underlying theory has been a barrier to effective implementation. This paper
represents an attempt to identify more closely what aspects of the Teaching for Abstraction
model teachers find particularly difficult and to design more effective professional
development.
Background and Rationale
Learning by abstraction
One theory of mathematics learning (Dienes, 1963) holds that all elementary concepts
are the result of abstraction and generalisation from common experiences. For example,
children experience many objects that are basically linear such as the edge of a table and a
line drawn with a ruler. They see that two edges of a table top meet at a corner and they mark
points on a drawn line to indicate a particular length. However, they also experience objects
that are too wide, curved or indistinct to be called a line (such as a path across a field) and
other lines that do not meet at a point (such as railway tracks). By recognising the underlying
similarity among the first category of experiences, and differences with the second category,
Teaching for Abstraction: Teacher Learning
12
children may abstract the concepts of line, point and intersection and generalise that two lines
never meet in more than one point.
The role of abstraction in this theory of learning was well described by Skemp (1986)
as follows:
Abstracting is an activity by which we become aware of similarities ... among our experiences. Classifying means collecting together our experiences on the basis of these similarities. An abstraction is some kind of lasting change, the result of abstracting, which enables us to recognise new experiences as having the similarities of an already formed class. ... To distinguish between abstracting as an activity and abstraction as its end-product, we shall ... call the latter a concept. (p. 21, italics in original)
We call the formation of basic mathematical concepts in this manner empirical
abstraction because it is based on experience.
Empirical abstraction occurs both inside and outside the classroom. For example,
parents often help young children recognise similarities in their everyday experiences (e.g.,
by teaching them the names of particular classes of objects) and school children frequently
look for patterns that could simplify their learning (“Just tell us the rule, miss!”). Such
empirical abstraction is almost always superficial. Everyday concepts such as “red” and
“building” are based on surface appearances anyway, so they are necessarily superficial. But
mathematical concepts are based on deeper similarities and it is important that these deeper
similarities be learned (Mitchelmore, 2000). For example, students must go beyond thinking
that a fraction is “one number over another”.
Empirical abstraction is to be contrasted with theoretical abstraction, which is the
construction of concepts to fit into a specific mathematical theory (Davidov, 1990). For
example, the mathematical concepts of line and point are theoretical abstractions; their only
existence is in terms of axioms (such as “two lines never meet in more than one point”) that
define relations between them and other geometrical concepts. Reasoning about theoretical
points and lines must be based on such precise axioms, and no appeal can be made to the
imprecise points and lines of experience. Theoretical abstraction plays an extremely
important role in mathematics.
We have argued (Mitchelmore & White, 2004) that most abstract mathematical theories
are constructed to model empirical abstractions. For example, theoretical lines and points
only represent real linear objects and points⎯there is no such things in our world as a
perfectly straight line or a dimensionless dot. It is not until one reaches the refined
atmosphere of research mathematics that theories are invented for their own sake, but even
they can be traced back through a succession of theories to some aspect of our experience.
Paul White, Sue Wilson, & Michael Mitchelmore
13
Therefore, if students are to appreciate the value of theoretical mathematics and be able to
apply abstract theory to concrete situations, they need to have a sound understanding of the
empirical abstractions on which the theoretical abstractions are based.
Teaching For Abstraction
Teaching for Abstraction (White & Mitchelmore, 2010) attempts to build on children’s
natural tendency to seek similarities and make rules in order to assist them to abstract
mathematical concepts. The Teaching for Abstraction model consists of four phases:
1. Familiarity. Students explore a variety of contexts where a concept arises, in
order to form generalisations about individual contexts and thus become familiar
with the underlying structure of each context.
2. Similarity. Teaching then focuses on helping students recognise the similarities
and differences between the underlying structures of these various contexts.
3. Reification. The general principles underpinning the identified similarities are
drawn out, and students are supported to abstract the desired concept into a
mental object that can be operated on in its own right.
4. Application. Students are then directed to new situations where they can use the
concept.
In this model, teachers start by carefully selecting situations known to the students
that embody a significant mathematical concept and ensure that students understand the
mathematics within each situation. They then deliberately focus students’ attention on the
underlying similarity between those situations and help them formulate that similarity in
abstract terms. Finally, they help students learn how to operate with those abstract concepts
and apply them to solve problems in other situations that embody that concept. Several
examples of specific skills and understandings at each level of the model are given in White
and Mitchelmore (2010).
The model is the reverse of the traditional ABC (Abstract Before Concrete) method of
teaching mathematics (Mitchelmore & White, 2000). As one teacher put it, “It is the opposite
of what we’re doing in school now. It is starting with the blurred and being revealed.
Backwards. Not doing specific instructions first, more a thinking thing.”The model has many
similarities to several approaches advanced in the mathematics education literature over the
past 20 years (encapsulated in such slogans as realistic learning, communities of discourse,
and teaching for understanding) in its emphasis on drawing mathematics out of familiar
contexts through teacher-guided exploration and reflection. The major difference lies in the
Teaching for Abstraction: Teacher Learning
14
relation posited between abstract ideas and familiar experience: Concepts are seen as
representing what is common among several experiences, rather than as ideas that can be
explained or justified through specific experiences. As a result, Teaching for Abstraction uses
multiple contexts for each concept, focuses on the relation between them, and constantly
links abstract ideas to the several contexts from which they were derived.
Our earliest experiments with the Teaching for Abstraction model involved teaching
the concept of angle in Years 3 and 4 (Mitchelmore & White, 2002a, 2002b). Familiar
contexts included corners, scissors, body joints, doors, clock hands, and slopes. The first
lessons concentrated on ensuring that students understood each of these contexts to the extent
that they could represent them graphically (Phase 1: Familiarity). The next lessons involved a
variety of matching exercises, both within and between contexts, leading students to
recognise that an angle (wherever it occurred) had two arms meeting at a point and that each
angle had a particular size (Phase 2: Similarity). Students then completed various activities to
develop facility in interpreting and using abstract angle diagrams (Stage 3: Reification) and
using them in new situations (Phase 4: Application). There was evidence that many students
developed a quite sophisticated concept of angle by as early as age 10.
Subsequent experiments have investigated the teaching of decimals, percentage and
ratio by abstraction. Summaries of these experiments and their effectiveness are given in
White and Mitchelmore (2010). The investigations have confirmed our conviction that the
Teaching for Abstraction model has promise in terms of student learning of key concepts and
generalisations. They have also consistently shown the vital significance of teacher learning.
Teacher learning
In the teaching studies we have undertaken, we have provided teachers with detailed
lesson outlines but many teachers have found it difficult to implement the Teaching for
Abstraction model. Because the model is so different from common teaching practice, we
have found it difficult to communicate to teachers despite revising the professional learning
activities several times. As a result, many teachers have either followed the materials
provided to the letter, not being in a position to adapt them to their particular classroom
situation, or they have subverted the whole process and reverted to the ABC method. As a
result, the model was not implemented faithfully in several of the classrooms we studied.
Nevertheless, most teachers have spoken favourably of the results in their classrooms, and
some have expressed the wish for further materials.
Paul White, Sue Wilson, & Michael Mitchelmore
15
A possible reason for the poor implementation of the model in previous studies is that
the teachers were not involved in planning the unit or developing the teaching materials. The
literature on teacher learning repeatedly cites the importance of active teacher involvement if
innovative ideas are to be accepted (Pegg & Panizzon, 2008). In our investigations, the
researchers did all the development and simply presented lesson plans to the teachers.
Consequently, the teachers had no real ownership of the experiments. They may even have
considered us as outsiders with no knowledge of classroom realities (Jaworski, 2004).
We therefore decided to investigate a different method of implementing Teaching for
Abstraction, one in which, instead of presenting teachers with completed teaching materials,
we would work collaboratively with teachers to develop Teaching for Abstraction lessons
that would better fit their own classroom situations. We hypothesised that such a procedure
would lead to greater ownership and thus more faithful implementation, deeper student
learning and, most importantly, greater teacher learning than the previous method.
The present study
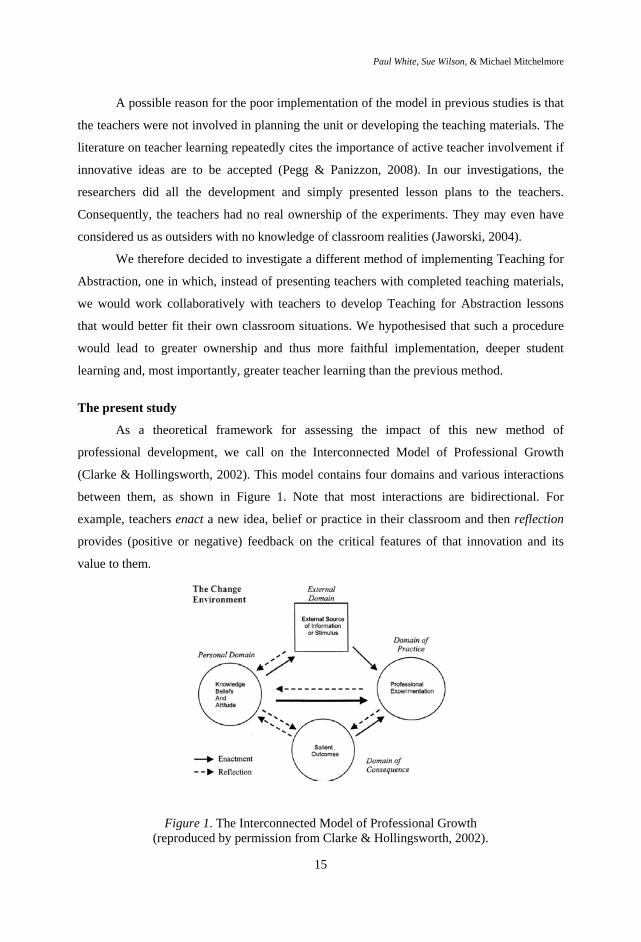
As a theoretical framework for assessing the impact of this new method of
professional development, we call on the Interconnected Model of Professional Growth
(Clarke & Hollingsworth, 2002). This model contains four domains and various interactions
between them, as shown in Figure 1. Note that most interactions are bidirectional. For
example, teachers enact a new idea, belief or practice in their classroom and then reflection
provides (positive or negative) feedback on the critical features of that innovation and its
value to them.
Figure 1. The Interconnected Model of Professional Growth (reproduced by permission from Clarke & Hollingsworth, 2002).
Teaching for Abstraction: Teacher Learning
16
As an initial exploratory study, we worked with a small group of teachers in a small
regional town to prepare two unconnected lessons. The teachers then taught these lessons in a
kind of lesson study mode (Hart, Alston, & Murata, 2011). In terms of Figure 1, the External
Domain was the collaborative lesson preparation and study, the Personal Domain was
teachers’ knowledge and acceptance of Teaching for Abstraction, the Domain of Practice was
the lessons taught, and the Domain of Consequence consisted of student outcomes from the
lessons taught.
Our research question was: Can collaborative lesson development lead to faithful
implementation of the Teaching for Abstraction model?
More specifically: Which parts of the model are easier or more difficult for teachers to
implement? Can student learning be linked to the parts of the model that are implemented?
To provide answers to these questions, data were collected on all four components of
the model in Figure 1. We report a case study of one of the teachers involved.
Method
Participants
The study took place in Grade 6 at St Joseph’s1, a small primary school in regional
New South Wales. Initially, three teachers volunteered to participate: David, Bridget, and
Uarda. However, David was unwell during our visits and only participated marginally. Also,
Bridget was a part-time teacher and had several other calls on her time. Only Uarda
participated fully, and she is therefore the focus of this paper. Uarda had been teaching for 5
years, and was enrolled in a master’s degree at the time.
Procedures
The authors paid two 2-day visits to St Joseph’s. Both visits followed the same
pattern: The research team (the authors, Uarda, and whichever of the other teachers were
available) met for an initial discussion on the afternoon of Day 1 to decide on the aims for the
following day. Early on Day 2, the team developed a lesson and prepared the necessary
materials. Both sessions were guided by the principle that each participant should contribute
their particular expertise in the lesson design. Thus, the authors shared their knowledge of the
Teaching for Abstraction Model and their experience of its previous implementations while
the teachers contributed their knowledge of the school curriculum and their students.
Paul White, Sue Wilson, & Michael Mitchelmore
17
Later in Day 2, Uarda taught the experimental lesson while the others observed, after
which the team discussed the lesson and modified it as they felt appropriate. Bridget then
taught the revised lesson while the others observed. On the second visit, an additional team
session was devoted to identifying the strengths and weaknesses of the Teaching for
Abstraction model and reflecting on the teacher learning that had occurred.
After the second visit, Uarda indicated that she would attempt to apply the model to
her teaching about angles in the following month. After teaching this unit, which we did not
observe, she provided the authors with written feedback.
Data collection and analysis
The research team’s discussion sessions were audio recorded and transcribed, but no
recordings were made of the lessons. Instead, one member of the research team acted as a
lesson recorder, taking detailed notes of the lessons that included time markers for the major
transitions. The other members subsequently added their individual observations to these
notes.
Because student outcomes have a significant feedback effect on teacher learning
(Clusky, 2002), an attempt was also made to assess short-term student learning. The recorder
noted students’ comments during the face-to-face teaching and all members of the team
circulated and observed students during the small group work, occasionally interacting with
them to clarify what they were attempting to do. In addition, the teachers administered a short
quiz at the end of the first visit and a short questionnaire at the end of the second visit.
The analysis of how Uarda interpreted and applied the Teaching for Abstraction
model, as well as its resulting effectiveness and potential, focussed on the four components
shown in Figure 1. Firstly, each author formed an interpretation of each of these components
on the basis of their own observations, notes and informal discussions during the site visits.
The three authors then cross-validated and synthesised their separate interpretations during
extensive discussions, frequently re-examining transcripts and field notes to reach consensus.
Results
The first visit
Initial discussions. At the first meeting of the research team, the authors outlined the
Teaching for Abstraction model and gave some examples from their previous research. In
particular, they provided the teachers with copies of the instructional materials developed for
a previous Grade 6 percentages investigation (White, Mitchelmore, Wilson, & Faragher,
Teaching for Abstraction: Teacher Learning
18
2008). They also explained the purpose of the study, and asked teachers for their reaction to
the model and its potential in their situation.
The teachers expressed interest in experimenting with the model. Uarda indicated that
she regularly trialled novel activities and approaches that she believed might be beneficial to
her students. Teaching for Abstraction had a definite resonance for her because she was
particularly keen on the use of realistic scenarios and always tried to embed the mathematics
she was teaching in contexts that she felt would be familiar to students.
The teachers then outlined a number of topics where they felt their students were
having most difficulty, and it was agreed that the next day’s lesson would focus on place
value in decimals. It was also agreed that Uarda and Bridget would both teach the same
lesson with their own classes, in that order, with time for discussion and revision between the
two lessons.
Lesson planning. The teachers reported that students had been taught about decimals
but some students were still having difficulty deciding, for example, whether 0.65 was bigger
than 0.8. It was decided to focus the lesson on this topic, restricting the content to 1- and 2-
place decimals. It was considered that this topic was sufficiently narrow for a single lesson,
but that it could nevertheless be of significant value to students. The teachers could extend
students’ understanding to other decimals later.
Having decided on this topic, that next task was to identify a small number of familiar
contexts involving one- or two-place decimals, which could then be compared to identify and
abstract the underlying similarity. The teachers initially had some difficulty with this task but,
after some suggestions from the authors, the team agreed on four contexts: money ($0.65 vs
$0.8), length (0.65 cm vs 0.8 cm), fractions of a box of 100 lollies (0.65 vs 0.8), and fractions
of a 10 × 10 square of chocolate (0.65 vs 0.8). It was decided to write four scenarios and to
break each class into four groups that would (after an initial introduction) circulate around the
four tasks, spending no more than 5 minutes on each. This would leave time for a final
discussion of students’ responses in which generalisations about decimal place value could be
abstracted.
It was agreed that the planned lesson included the first three phases of the Teaching
for Abstraction model applied to the concept of decimal place value: Students were already
familiar with the four contexts, they would be prompted to identify the underlying similarities
between them, and generalisation would initiate reification. Application would occur in
subsequent lessons.
Paul White, Sue Wilson, & Michael Mitchelmore
19
The teachers then left to collect or create materials for the lesson (counters for money
and lollies, rulers and butcher paper for measurement, and grids for the chocolate). After they
returned, discussion continued on the phrasing of the actual tasks to be used. The entire
planning session took just under an hour.
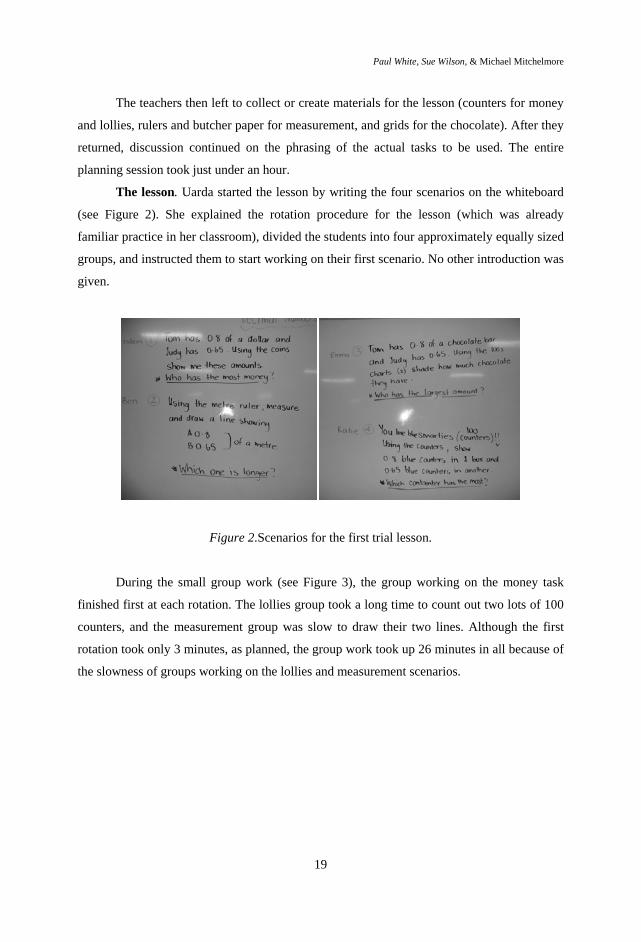
The lesson. Uarda started the lesson by writing the four scenarios on the whiteboard
(see Figure 2). She explained the rotation procedure for the lesson (which was already
familiar practice in her classroom), divided the students into four approximately equally sized
groups, and instructed them to start working on their first scenario. No other introduction was
given.
Figure 2.Scenarios for the first trial lesson.
During the small group work (see Figure 3), the group working on the money task
finished first at each rotation. The lollies group took a long time to count out two lots of 100
counters, and the measurement group was slow to draw their two lines. Although the first
rotation took only 3 minutes, as planned, the group work took up 26 minutes in all because of
the slowness of groups working on the lollies and measurement scenarios.
Teaching for Abstraction: Teacher Learning
20
(1) Money task (2) Measurement task
(3) Chocolate bar task (4) Lollies task
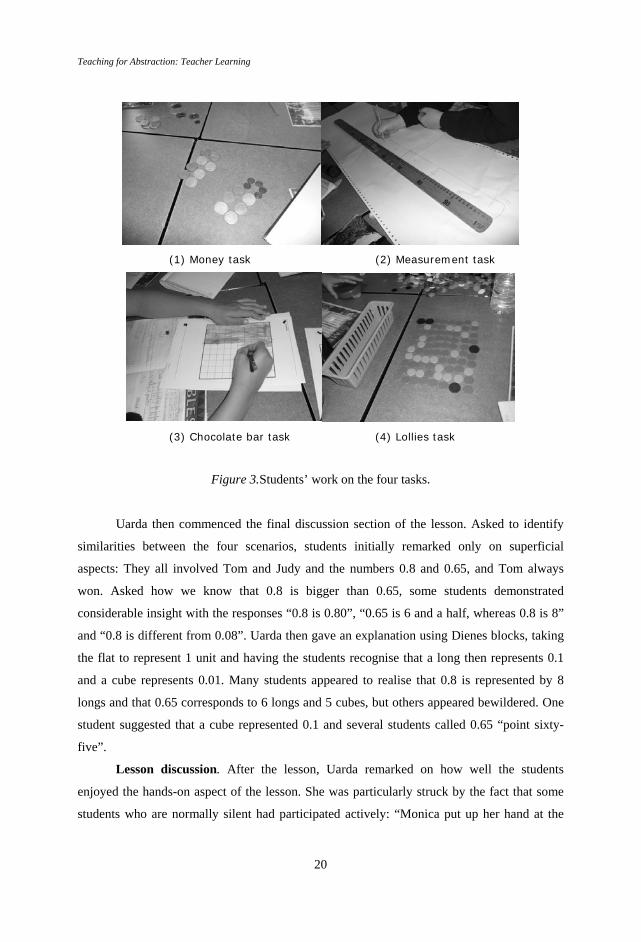
Figure 3.Students’ work on the four tasks.
Uarda then commenced the final discussion section of the lesson. Asked to identify
similarities between the four scenarios, students initially remarked only on superficial
aspects: They all involved Tom and Judy and the numbers 0.8 and 0.65, and Tom always
won. Asked how we know that 0.8 is bigger than 0.65, some students demonstrated
considerable insight with the responses “0.8 is 0.80”, “0.65 is 6 and a half, whereas 0.8 is 8”
and “0.8 is different from 0.08”. Uarda then gave an explanation using Dienes blocks, taking
the flat to represent 1 unit and having the students recognise that a long then represents 0.1
and a cube represents 0.01. Many students appeared to realise that 0.8 is represented by 8
longs and that 0.65 corresponds to 6 longs and 5 cubes, but others appeared bewildered. One
student suggested that a cube represented 0.1 and several students called 0.65 “point sixty-
five”.
Lesson discussion. After the lesson, Uarda remarked on how well the students
enjoyed the hands-on aspect of the lesson. She was particularly struck by the fact that some
students who are normally silent had participated actively: “Monica put up her hand at the
Paul White, Sue Wilson, & Michael Mitchelmore
21
back a few times. She’s somebody that generally has no idea. And she was hands up
confidence. … She was the one that was explaining when the boy beside her wasn’t sure.”
Students’ tendency to notice irrelevant similarities was noted, and the authors recalled
Dienes’s (1963) dictum that “all variables need to be varied if the full generality of the
concept is to be achieved” (p. 158). It was decided for the second trial lesson to vary the
children’s names and to ask alternately for the larger or smaller number. It was also decided
to compare 0.4 and 0.25 in order to make the lollies and measurement tasks more
manageable. Bridget left to write the revised scenarios on the whiteboard in her classroom in
preparation for the second lesson.
Discussion then turned to the question of how general students’ understanding of
place value was. In particular, it was felt that the approach taken had tended to reinforce
whole number thinking (e.g., treating 0.8 as 80 out of 100 rather than a fraction of the flat).
It was decided to put more emphasis on decimals as fractions of a whole rather than numbers
of parts of the whole, even by including questions such as “What is 0.8 of a student’s pony
tail?” Ideas were canvassed on how to question students in order to take them beyond the
specific insights they had shown, by focussing more strongly on the similarities between the
four scenarios. The plan for the repeat lesson (not reported here) was modified accordingly.
As a measure of how much students had learned from the lesson, Uarda suggested a
short quiz in which students would be asked to identify the smaller of two decimals; the team
then constructed this quiz jointly. Figure 4 shows the resulting quiz.
Circle the smaller number:
(1) 0.8 (2) 0.52 (3) 0.6 (4) 0.8 (5) 1.6534 (6) 2 0.65 0.7 0.298 0.09 1.72 2.2
Figure 4.Short quiz questions.
Assessment. Shortly after the lesson discussion, Uarda administered the quiz to a total
of 24 students in her class. About 70% answered Items 1, 2 and 6 correctly, while Items 3, 4
and 5 were only answered correctly by just over 50% of the students. However, it was noted
that five students marked all the larger numbers correctly. It could be argued that they
understood how to find the larger or smaller of two decimals, but had not read the
Teaching for Abstraction: Teacher Learning
22
instructions carefully and had proceeded as in the scenarios they had just experienced. On
this assumption, the percentages correct would have been about 20% greater.
If this assumption is correct, the result for Item 2 would suggest that the majority of
Uarda’s students had generalised their knowledge of 2-place decimals to numbers other than
the ones in the given scenarios. However, the zero in Item 4 seems to have introduced
problems for several students. Most students appeared to be able to cope with numbers with
no decimal places, as in Item 6, but it was clear from Items 3 and 4 that more work needed to
be done on decimals with more than 2 places.
In general, the assessment results confirm the post-lesson discussion that greater
emphasis needed to be put on bringing out the underlying structure of the decimal notation
system.
The second visit
Initial discussions. The teachers had decided that on this occasion they wanted the
lesson to focus on percentages, where students were demonstrating continued difficulties.
The team brainstormed some typical percentage problems and possible scenarios, gradually
honing in on discounts and the generalisation “a percentage must be a percentage of
something”. After some discussion of how to approach this generalisation, it was agreed to
present two scenarios that consisted of specific calculations from which the generalisation
could be abstracted and two applications of the generalisation where no calculation was
specified. Students would be asked to predict the answers before doing the calculation in the
first type of scenario, and the two types of scenario would be separated by a brief discussion.
It was agreed that this lesson followed the Teaching for Abstraction model. Students
would learn the percentage generalisation by recognising the similarity between the two
initial scenarios, which would have to be chosen to be familiar. They would then be prompted
to apply the generalisation to two different contexts.
Uarda also suggested a “cognitive closure” exercise at the end of the lesson, to check
student understanding. Apart from this, it was agreed to follow the same procedure as on the
previous visit.
Lesson planning. Four scenarios were composed; ensuring that Scenarios 1 and 2
gave contrasting results. Figure 5 shows the four scenarios. Each scenario was written on an
A5 card (two copies of each), and the words “Don’t forget to predict which will be the better
deal before calculating” were written in capitals on each card for Scenarios 1 and 2. No
Paul White, Sue Wilson, & Michael Mitchelmore
23
materials were required for this lesson, but David created an A3 illustration to motivate each
scenario.
1. There are 2 telephone plans and your parents are going to give you a % (percentage) of money
towards your plan. In which plan do your parents give YOU more money? (a) 15% on $50 plan (b) 10% on $60 plan
2. Electronic Store A is having their 50% mid year sale. Your favourite game is usually $110. How
much will you pay now? At Electronic Store B, the full price for your favourite game is usually $90. Their discount is
40%. How much will you now pay? Which shop is offering the better price?
3. Pizzas Galore have a 10% surcharge on all of their purchases on a Sunday. You want 3 pizzas. Is
it cheaper to buy the 3 at once or one at a time? 4. The top 2 basketball teams of the local basketball league have a success rate at goal shooting of
80% and 50%. Which team has shot the most goals in the season?
Figure 5.Scenarios for the second trial lesson.
The lesson. Uarda began the lesson by teaching students how to use a calculator,
writing the examples in Figure 6 on the whiteboard and giving students three examples of
each type to work out. However, some students seemed to be working out the percentages
mentally, and many found the resulting price by subtracting the discount from the original
price instead of using the second procedure.
5 0 x 2 5 % = [gives a 25% discount on $50]
5 0 x 2 5 % - = [gives the resulting price]
Figure 6.Uarda’s examples of using a calculator for percentages.
Fifteen minutes into the lesson, Uarda introduced the first two scenarios and explained
the rotation procedure. In one group, students’ predictions appeared to be mere guesses.
Calculation difficulties (which button to press) seemed to distract from understanding, and
several students did not seem to realise the difference between discount and discounted price.
In one group, two students showed the others how to do the calculations and told them the
answers. After 13 minutes on these scenarios, Uarda’s question “What surprised you?” led to
Teaching for Abstraction: Teacher Learning
24
vigorous discussion and general agreement that the bigger percentage does not always give
the bigger amount.
Thirty-three minutes into the lesson, students started on the second pair of scenarios.
Scenario 3 seemed rather difficult, the idea of checking a prediction by choosing values being
clearly unfamiliar to the students. The term “surcharge” was also unfamiliar to several
students. Scenario 4 seemed to be much easier, even though it also requires the choice of
specific values to test a generalisation.
There was only time at the end of this lesson to check students’ answers and discuss
how to test general predictions. Several students successfully argued in Scenario 3 that “it
doesn’t matter”, but one student was adamant that buying three separate pizzas would be
cheaper and could not be dissuaded from this view.
Lesson discussion. It was generally agreed that, in this lesson, students had been
absorbed with the procedure for using a calculator and that this had interfered with the
cognitive process of generalisation. Uarda said that, in future, she would break down the
content into several lessons⎯perhaps mastering the method of calculation and a lesson on
discounts and surcharges before posing the problems in Scenarios 1 and 2. She would then
take a whole lesson on Scenarios 3 and 4.
A number of minor points were also identified. For example, it was agreed that
including the instruction “Give an example to illustrate your thinking” would help students in
responding to Scenarios 3 and 4. Minor changes were made for the repeat lesson (not
reported here).
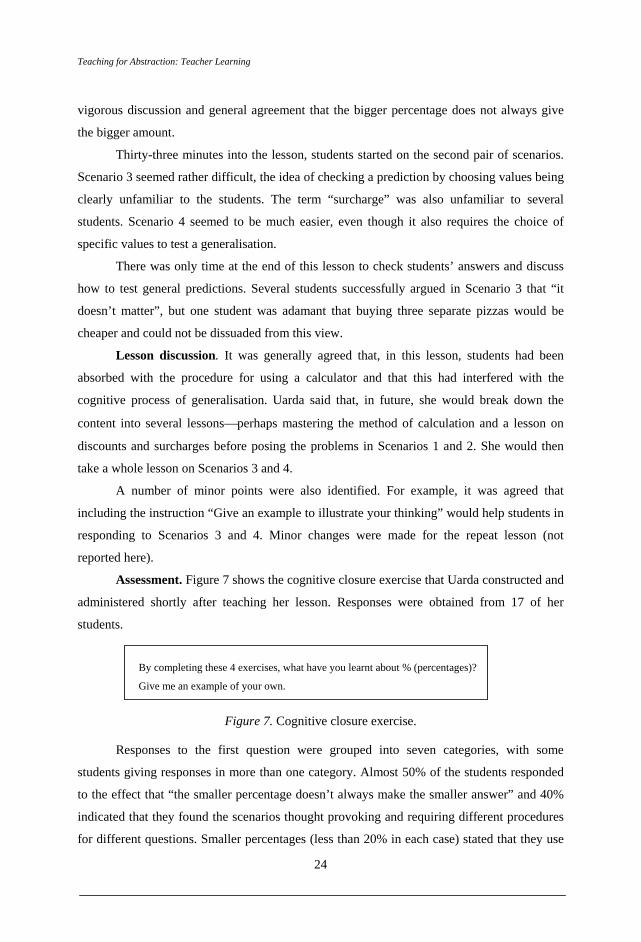
Assessment. Figure 7 shows the cognitive closure exercise that Uarda constructed and
administered shortly after teaching her lesson. Responses were obtained from 17 of her
students.
By completing these 4 exercises, what have you learnt about % (percentages)?
Give me an example of your own.
Figure 7. Cognitive closure exercise.
Responses to the first question were grouped into seven categories, with some
students giving responses in more than one category. Almost 50% of the students responded
to the effect that “the smaller percentage doesn’t always make the smaller answer” and 40%
indicated that they found the scenarios thought provoking and requiring different procedures
for different questions. Smaller percentages (less than 20% in each case) stated that they use
Paul White, Sue Wilson, & Michael Mitchelmore
25
percentages every day or that they had learnt nothing new, or gave a small number of other
responses.
Students’ examples were categorised as direct or open, contextual or abstract, and
calculation or comparison. Nearly 50% fell into the direct contextual comparison category
similar to Scenarios 1 and 2 and less than 25% involved an open contextual comparison as in
Scenarios 3 and 4.
These results were considered encouraging, the categories of examples proposed by
students apparently reflecting their greater familiarity with the style of Scenarios 1 and 2.
Follow-up
About a month after our second visit, Uarda taught an angles unit which she had
designed following the principles she had learnt during our earlier visits. The key ideas
addressed over four lessons were as follows (quoting from the unit outline she provided):
Angles are found everywhere; angles can be measured using a protractor; parallel lines have
equal angles; and each type of angle is useful. Apart from angle measurement, where Uarda
first showed students how to use a protractor, the lesson plans showed a similar procedure to
the earlier trial lessons: Activities in small rotational groups were followed by class
discussion and some follow-up tasks. For example, the four activities used in the first lesson
were as follows:
1. Find angles around the room.
2. Make as many angles with scissors.
3. Make as many angles with straws.
4. Draw as many different angles as you can using a ruler.
The follow-up task was:
Draw 6 different angles in your books. How are they different? When are they used?
Where do you think you could find these angles at home?
Uarda made the following comments on this unit:
I think the program worked well. I used the small group work again and immersed them in different contexts wherever I could. The planning was probably slightly quicker as I didn’t need to spend time with the explicitly teaching section as such, but more so on thinking about questions to ask to find generalisations of their findings and more [on] the context and content I wanted to teach. I gave them a standard angles test and the only area they struggled in was accurately measuring the angles using a protractor. We still find that the discussion taking place with this set-up is very positive and it also seems to cater for the differing abilities in the class. … This kind of context allows the children to extend themselves and “think outside the square” and make connections to the real world.
Teaching for Abstraction: Teacher Learning
26
Uarda’s approach shows several features of the Teaching for Abstraction model: She
started with several familiar contexts that incorporated the ideas she wanted to teach and used
discussion to draw out underlying generalisations. The follow-up tasks definitely tested
children’s understanding of the abstract ideas that had been discussed. However, one feature
of Teaching for Abstraction did not seem to be present: the search for underlying similarities
between the contexts studied. The concepts students learned were common to all the contexts
studied; but there was no sign that Uarda had addressed this point in the same way as, for
example, is done in the angles unit distributed by the New South Wales Department of
Education and Training (2003), which is based on our earlier experiments.
Discussion
We discuss the results in terms of the four components of the Integrated Model of
Teacher Professional Development (Figure 1).
The Domain of Practice: Implementation of the Teaching for Abstraction model
The two lessons certainly incorporated major elements of the Teaching for
Abstraction model. Most obvious was the emphasis on exploring a variety of contexts where
a concept arises (Phase 1 of the model). Both lessons were the result of careful planning,
firstly to clearly identify a focus concept or generalisation and secondly to select scenarios
that embodied this abstraction and would be familiar to the students. However, although
students did indeed seem to be quite familiar with all the contexts chosen, in the second
lesson calculator difficulties meant that several students could not operate fluently within the
discount context.
Similarity recognition (Phase 2) was also present. In the first lesson, students showed
a strong tendency to focus on superficial similarities, and it was difficult for Uarda to bring
students’ attention to mathematical similarities. However, in the second lesson, the question
“What surprised you?” did seem to focus students’ attention on a generalisation that was
implicit in the two scenarios investigated⎯in this case, the result of recognising a difference
rather than a similarity.
Neither lesson proceeded very far with Reification (Phase 3), where the underlying
structure could have been laid bare, explained, and formalised. The attempt to use Dienes
blocks to explain place value in the first lesson did not seem to relate well to the similarities
that students had observed previously. In the second lesson, pressure of time prevented a
Paul White, Sue Wilson, & Michael Mitchelmore
27
proper exploration of the target generalisation that could have extended it from the specific
context of discounts to the general context of abstract percentages.
Phase 4 of the model, Application, was deliberately avoided in the first lesson but did
occur in the second lesson (see Figure 5, Items 3 and 4). However, as Uarda noted, it would
have been better to give more time to elucidating the percentage generalisation before
attempting to apply it.
The Domain of Consequence: Student outcomes
The assessment of student outcomes for the first lesson suggested that most students
had achieved the narrow objective of ordering one- and two-place decimals. However,
understanding was not deep enough to allow many students to extend this knowledge to
decimals with more than two places or containing zeros after the decimal point. We attribute
this finding to shortcomings in the Similarity and Reification phases of the lesson.
The second lesson did not appear to be so successful in terms of student learning, but
the results of the cognitive closure exercise showed that many students had learnt the target
generalisation.
The two lessons had some other positive outcomes. The realistic nature of the
activities in the first lesson appeared to engage students more than usual, and many students
appreciated the challenging nature of the second lesson. Throughout, there was clear evidence
that students were responding well to the chance to think for themselves and were learning
some significant ideas.
The Personal Domain: Teacher learning
Uarda emphasised right from the first meeting her belief in the importance of
embedding mathematics in realistic, familiar contexts. However, the idea of using more than
one context for each concept was clearly new to her, and in the initial discussion sessions the
authors had to repeatedly stress the importance of similarity recognition in the Teaching for
Abstraction model. Consequently, she put a lot of thought and effort into the process of
identifying and selecting appropriate contexts for the two trial lessons and used the same
principle in her follow-up lesson on angles. Our observations showed that she was skilled in
managing a classroom so that students could work on several contexts in one lesson. We
conclude that Uarda had successively learned to implement the Familiarity phase of the
Teaching for Abstraction model.
Teaching for Abstraction: Teacher Learning
28
Uarda also attempted to implement the Similarity phase in that she challenged
students to identify similarities in, and make generalisations from the exploratory activities
they had just carried out. However, she did not clearly distinguish superficial and
mathematical similarities and did not probe for explanations or forge meaningful links to
students’ existing knowledge. For a similar reason, Uarda did not effectively address the
Reification phase in either lesson. The little evidence we have from her follow-up lesson
confirms that she had formed no clear concept of the content and purpose of these two
phases.
Uarda tended to adopt a didactic mode by presenting her own explanations or
procedures. For example, neither the use of Dienes blocks in the first lesson nor the use of
calculators in the second lesson had been discussed in the lesson planning sessions. These
were honest attempts to address known student difficulties, but they only served to disrupt the
structure of the Teaching for Abstraction lesson. In this respect, Uarda’s modifications were
similar to the way teachers in earlier studies had subverted the model by returning to a more
familiar lesson structure (White & Mitchelmore, 2010).
For time reasons, it was not possible to judge how Uarda would have treated the
Application phase.
The External Domain: Collaborative lesson planning
The collaborative lesson planning went according to plan, although it would certainly
have been more effective had all the teachers been able to participate to the extent that Uarda
did. There is no doubt that she had ownership of the plan for her lessons.
However, it is now clear that the professional development we provided for Uarda and
her colleagues did not stress strongly enough the significance of the crucial steps of similarity
recognition and reification. It is clear in hindsight that the teachers needed to spend more time
reflecting on mathematical similarities⎯how to distinguish them from superficial
similarities, how to draw them out through careful questioning, how to derive adequate
explanations, how to link students’ learning to their previous knowledge, and how to reify
similarities to allow for the abstract manipulation of mathematical concepts.
Paul White, Sue Wilson, & Michael Mitchelmore
29
Conclusions
To answer our research questions, then, it appears that collaborative lesson
development of the type we provided did not lead to faithful implementation of the Teaching
for Abstraction model. In particular, there were serious difficulties in implementing the
Similarityand Reification phases of the model. As a consequence, although students gained
from the use of familiar contexts and the challenge of reaching their own conclusions, it
seems that they did not reach the desired depth of understanding.
Because most modern curriculum innovations stress the importance of linking abstract
concepts to familiar situations, it appears to be relatively easy for teachers to learn the
Familiarity phases of the Teaching for Abstraction model. However, the Similarity and
Reification phases are unique to the model, and are therefore likely to be completely novel to
teachers. As Sullivan, Clarke, & Clarke (2009) found in a similar context, teachers may need
a lot of help in developing the new skills required to implement these two phases effectively.
We conclude once again that the type of one-off intervention that was the subject of
the present study is unlikely to achieve the desired effects. More time is needed for teachers
to experiment with the new lesson structure and to reflect on the results in the classroom. A
successful professional development would need to allow teachers to experience more
examples of Teaching for Abstraction than the two we were able to provide in this study.
They would then be better able to recognise the underlying structure of the model, reify it
into a set of principles to be followed, and apply their understanding to the design of new
lessons. In other words, we probably need to teach teachers Teaching for Abstraction by
abstraction.
Acknowledgements
The study reported in this paper was supported by a grant from the National Centre of
Science, Information and Communication Technology, and Mathematics Education for Rural
and Regional Australia (SiMERR).
Notes 1The names of the school, teachers and students in this paper are all
pseudonyms.
Teaching for Abstraction: Teacher Learning
30
References
Clarke, D., & Hollingsworth, H. (2002). Elaborating a model of teacher professional growth. Teaching and Teacher Education, 18, 947-967.
Cluskey, T. R. (2002). Professional development and teacher change. Teachers and Teaching: Theory and Practice, 8, 381-391.
Davidov, V. V. (1990). Types of generalisation in instruction: Logical and psychological problems in the structuring of school curricula. Reston, VA: National Council of Teachers of Mathematics.
Dienes, Z. P. (1963). An experimental study of mathematics-learning. London: Hutchinson. Hart, L. C., Alston, A. S., & Murata, A. (Eds.).(2011). Lesson study research and practice in
mathematics education: Learning together. New York: Springer. Jaworski, B. (2004). Insiders and outsiders in mathematics teaching development: The design
and study of classroom activity. Research in Mathematics Education, 6, 3-22. Mitchelmore, M. C. (2000). Empirical is not mathematical! Reflections, 25(2), 13-15. Mitchelmore, M. C., & White, P. (2000). Teaching for abstraction: Reconstructing
constructivism. In J. Bana & A. Chapman (Eds.), Mathematics education beyond 2000 (Proceedings of the 23rd annual conference of the Mathematics Education Research Group of Australasia, pp. 432-439). Perth: MERGA.
Mitchelmore, M. C., & White, P. (2002a). Teaching angles by abstraction: A professional development experiment in Year 3. Unpublished report, New South Wales Department of Education and Training, Sydney. Retrieved 5 May 2011 from http:// www.curriculumsupport.education.nsw.gov.au/primary/mathematics/assets/pdf/angles_report01.pdf
Mitchelmore, M. C., & White, P. (2002b). Teaching angles by abstraction: A second professional development experiment. Unpublished report, New South Wales Department of Education and Training, Sydney. Retrieved 5 May 2011 from http://www.curriculumsupport.education.nsw.gov.au/primary/mathematics/assets/pdf/angles_rep2002.pdf
Mitchelmore, M. C., & White, P. (2004). Abstraction in mathematics and mathematics learning. In In M. J. Høines& A. B. Fuglestad (Eds.), Proceedings of the 28th annual conference of the International Group for the Psychology of Mathematics Education (Vol. 3, pp. 329-336). Bergen, Norway: Program Committee.
New South Wales Department of Education and Training. (2003). Teaching about angles: Stage 2. Ryde, NSW: Author.
Pegg, J., &Panizzon, D. (2008). Addressing changing assessment agendas: Impact of professional development on secondary mathematics teachers in NSW. Mathematics Teacher Education and Development, 9, 66-80.
Skemp, R. (1986). The psychology of learning mathematics. (2nd ed.) Harmondsworth: Penguin.
Sullivan, P., Clarke, D., & Clarke, B. (2009). Converting mathematics tasks to learning opportunities: An important aspect of knowledge for mathematics teaching. Mathematics Education Research Journal, 21, 85-105.
White, P., & Mitchelmore, M. C. (2010). Teaching for abstraction: A model. Mathematical Thinking and Learning, 12, 205-226.
White, P., Mitchelmore, M. C., Wilson, S., & Faragher, R. (2008). Teaching percentages: Professional learning in three regional Catholic schools. Journal of Catholic School Studies, 80(2), 55-62.
Southeast Asian Mathematics Education Journal 2012, Vol. 2 No. 2, 31 - 43
31
Transition from Primary to Secondary School Mathematics: Students’ Perceptions
Catherine Attard University of Western Sydney
During a longitudinal case study on engagement in Australian middle school years mathematics, 20 students in their first year of secondary school in Western Sydney, New South Wales, were asked about their experiences of the transition to secondary school in relation to their experiences of mathematics teaching and learning. Changes and disruptions in teacher-student relationships were a major cause of concern. This was due to fewer opportunities for teacher-student interactions and a heavy usage of computer-based mathematics lessons during the first months of secondary school. Findings indicate that a strong pedagogical relationship is a critical foundation for sustained engagement in mathematics during the middle years.
Keywords: transition, primary school mathematics, secondary school mathematics, teaching and learning
Students experience significant change in the structure, delivery and expectations of
school during the transition from primary to secondary education. In an Australian setting,
transition to secondary school occurs at a time when students are experiencing physiological,
psychological and social changes associated with adolescence (Downs, 2003). Literature
suggests difficult transitions can result in lowered levels of engagement, negative attitudes
towards school and learning, and reduced self-confidence and motivation, particularly in
relation to mathematics education (McGee, Ward, Gibbons, & Harlow, 2003). Lowered
engagement with mathematics can potentially result in limiting the range of higher education
courses available to students and can limit the capacity of students to understand and interpret
life experiences through a mathematical perspective (Sullivan, Mousley, & Zevenbergen,
2005).
During a qualitative longitudinal case study on engagement with mathematics during
the middle years (Years 5 to 8 in New South Wales (NSW)), a group of 20 Year 6 students
from one school were asked to asked about their perspectives of mathematics teaching and
learning. Data was collected through individual interviews, focus group discussions and
classroom observations. In the second phase of the study, during their first year of secondary
schooling the students participated in a sequence of three focus group discussions over the
course of the year. This paper is a report of some of the findings of this study relating to the
differences in mathematics teaching and learning encountered by the students following their
transition to secondary school.
Transition from Primary to Secondary School Mathematics: Students’ Perceptions
32
Transition and Middle Years Mathematics
There are factors from within the mathematics classroom, the school, and outside the
school that have the potential to influence students’ engagement with mathematics. Although
transition to secondary school can play a major role in influencing engagement, there are
other factors specific to the teaching and learning of mathematics that play a critical role.
Such factors are curriculum, pedagogy, assessment strategies, social interactions and
students’ interpersonal relationships. Together with issues relating to transition, the
potentially negative impacts of these factors are cause for concern. It is beyond the scope of
this paper to explore current literature concerning all of these issues, so the following is a
brief account of current literature pertaining to key issues of transition and mathematics.
During the last two decades research has overwhelming documented an increasingly
smaller percentage of students pursuing the study of mathematics beyond the compulsory
years. Low academic performance and students’ negative attitudes towards mathematics can
seriously influence the choice not to pursue mathematics. This choice is also shaped by
school mathematical experiences and the teaching practices students experience while at
school (Nardi & Steward, 2003). Although arguably attitudes can change throughout the
school years, once formed, negative attitudes are difficult to change and often persist into
adulthood (Newstead, 1998). If positive engagement can be maintained during the middle
years of education, students may be more inclined to continue the study of mathematics.
There is a definite decline in school mathematics engagement of young adolescents in
Australia when compared with their strong levels of engagement during primary school
(NSW Department of Education and Training, 2005). In addition, during early adolescence
there is an increase in truancy, greater incidence of disruptive behaviour, alienation and
isolation increase (Sullivan, McDonough, & Harrison, 2004). Hill, Holmes-Smith and Rowe
(1993) note that during the middle years there is a noticeable arrest in the progression of
learning observed, with those in the lower deciles appearing not to progress academically
beyond a Year 4 level. Disinterest in mathematics resulting from particular pedagogical
approaches seems strongly linked with underachievement (Boaler, 1997).
During their transition to secondary school students must deal with changes at social,
organisational and academic levels. When preparing to transition from primary to secondary
schooling, students often have preconceived ideas and high expectations of the challenges
presented by secondary schools. Many students in their final year of primary education
expect the work in secondary school to be harder than the work in primary school, presenting
Catherine Attard
33
a challenge to some, and anxiety and concern for others (Howard & Johnson, 2004). In an
Australian study of students’ perceptions of the transition to secondary school by Kirkpatrick
(1992), students found the academic work during their first year of secondary school was
similar, and in some cases easier than their final primary year, yet they still experienced
difficulty adjusting to the different academic environment. Although there may be a lack of
academic challenge, the transition to secondary often results in some level of achievement
loss, a phenomenon not limited to students in Australian schools (McGee et al., 2003).
Along with the academic issues outlined above, students are faced with substantial
social changes as they transition to secondary school. Many must learn to cope in a
significantly larger school environment where, relative to Australian primary schools,
secondary schools are characterised by a greater emphasis on control, less personal student-
teacher relationships and a greater likelihood of public evaluations of students (Hardy,
Bukowski, & Sippola, 2002). Most secondary schools in Australia require students to move
from classroom to classroom, often changing peer groups and teachers throughout the day.
While substantial literature maintains social interaction within the classroom is an
important contributor to positive learning outcomes (see, for example, O’Toole & Plummer,
2004; Ricks, 2009), it appears mathematics classrooms are sometimes regarded as an
exception to this. The often individualistic nature of mathematics lessons seems extremely
unusual when compared to other subject areas, causing some students to view mathematics
classrooms as ‘other-worldly’, with no relationship to their own lives and perhaps no
connection to other academic areas (Boaler, 2000). Traditional practices of individualised
work in the mathematics classroom discourage meaning, engagement and understanding.
"Students within mathematics classrooms regard themselves as a community, whether
teachers do or not, and it is antithetical to the notion of any community that it should inhibit
communication between participants, and that dominant practices preclude meaning and
agency" (Boaler, 2000, p.394).
Emotional wellbeing is crucial for adolescents to function well at school and within
society. Along with peer relationships, relationships with teachers have a substantial
influence on student learning of mathematics. One of the most obvious differences between
primary and secondary schools in Australia is the amount of time students spend with their
teachers forming pedagogical relationships. The Connecting Through the Middle Years
Project (Henry, Barty, & Tregenza, 2003), found when dealing with students and the ‘drop-
out’ syndrome a link was made with ‘connectedness’, referring to the sense of belonging
Transition from Primary to Secondary School Mathematics: Students’ Perceptions
34
which results in a feeling of wellbeing. For adolescents to function positively at school and
within society, emotional wellbeing is crucial.
While there is an abundance of research into middle years, mathematics and transition
from primary to secondary school, there appears to be a gap in the current research with a
lack of longitudinal studies set within an Australian context. Another gap is a lack of using
‘student voice’ to explore students’ perspectives on mathematics teaching and learning during
this time of transition. The goal of this study is to address these current gaps in research and
to explore students’ perceptions of teaching and learning in mathematics, identifying
pedagogies that help sustain engagement during the transition to secondary schooling,
fostering continued study and enjoyment of mathematics.
Methodology
It was a commitment in this study to take a positive perspective rather than a deficit
approach towards current classroom practices, focussing on identifying what was perceived
by the participants to be working well or taught well in the mathematics classrooms involved.
A second commitment was to give the participants a voice; something lacking in current
research on student engagement.
The initial phase of the study took place during the students’ final year of primary
school in a western Sydney systemic Catholic school (although Catholic the school accepts
students from all religions). The school had been selected as an appropriate site for the study
because it had been identified as one in which a large proportion of students gained high
achievement levels in the Year 5 Basic Skills Numeracy Test in 2007 (a nation-wide
numeracy test). A ‘high achieving’ school was purposely chosen due to repeated studies
showing moderate to strong correlations between academic achievement and academic self-
concept (Barker, Dowson, & McInerney, 2005). It made sense, then, that students who
experience positive academic self-concept in mathematics are more likely to be engaged, and
therefore was an appropriate starting point from which to explore students’ engagement
levels as they made the transition to secondary school.
In the second phase of data collection the students attended the second site, a systemic
Catholic secondary school within the same area of western Sydney. At the time of data
collection, the school was in its third year of operation and considered itself a ‘ground-
breaking’ learning community in which an interdisciplinary approach to learning via an
integrated curriculum was delivered. Students embarked on Programs of Study that ranged
Catherine Attard
35
from five to 10 weeks in length, making connections between and across two or more key
learning areas. Each student at the school was required to purchase a laptop computer and
teachers were referred to as ‘learning advisors’. Co-teaching occurred in large, purpose-built
learning spaces with each learning advisor taking a role in the facilitation of the group. The
school population was derived from a low to mid socio-economic range with students drawn
from a wide range of both catholic and local government schools.
For the purpose of identifying prospective participants, the Year 6 cohort of 55
students were administered the Motivation and Engagement Scale (High School), a 44 item
Likert scale requiring students to rate themselves on a scale of 1 Strongly Disagree to 7
Strongly Agree (Martin, 2008). The instrument was adapted to be specific to mathematics.
Twenty students, all of whom identified themselves through the Motivation and Engagement
Scale as having strong levels of engagement with mathematics and also intending on
transitioning to the same high school, were invited and became participants. The participants’
academic ability was not a consideration. The participants came from a variety of cultural
backgrounds including Filipino, South African, Chinese, Italian, Sudanese and Irish. Almost
all of the students came from families with two working parents.
In the first phase of data collection participants took part in individual interviews
before taking part in focus group discussions. The participants placed themselves into one of
three groups: all female; all male; and mixed gender. The interviews and focus group
discussions were based on the following set of discussion points or questions: (a) Tell me
about school; (b) Let’s talk about maths; (c) Tell me about a fun maths lesson that you
remember well; (d) When it was fun, what was the teacher doing? and (e) What do people
you know say about maths? Other data were collected through series of classroom
observations and teacher interviews.
The data gathered were transcribed and analysed using NVivo software as a tool to
assist coding into themes. In terms of the most significant changes and issues affecting the
students through their transition to secondary school, two broad themes emerged: differences
in pedagogy from primary to secondary; and changes in teacher-student relationships.
Representative excerpts from the data will be used to illustrate the two themes in the
following section.
Transition from Primary to Secondary School Mathematics: Students’ Perceptions
36
Results and Discussion
Pedagogical Differences
The different pedagogies experienced by the participants will be discussed in terms of
mathematics content, teaching practices, student workload, assessment practices, integration,
and the use of Information and Computer Technologies (ICTs). It will be seen that during
their first year at secondary school the students’ attitudes towards mathematics and their
teachers evolved as they began to settle in to their new school environment.
Consistent with existing literature, the students found most of the content in Year 7 very
similar to that in Year 6 (Kirkpatrick, 1992).
… basically it’s just primary work but they’re just making it like that step harder. Like, … , we did polygons the other day, we did polygons from primary but then they gave us harder ones. (Year 7 boy, Term 2)
While the content did not present as a challenge, the students did find the teaching of
the content and the volume of work (at school and at home) expected of them was.
I find it much more up front and demanding this year. And last year, they’d give you time until you understand it. That’s what I like about last year. (Year 7 girl, Term 1)
From the start of Year 7 the students noticed a significant change in the pace of the
mathematics lessons when compared to primary school. During their primary school
experience, lessons were paced according to the students’ needs and there was room in the
timetable to re-visit topics that students were experiencing difficulty with. This fast pace
continued during the second term (the school year is divided into four, 10 week terms), as the
students felt pressure to complete work within a limited time frame. Although the participants
claimed they were familiar with the mathematics content, the fast pace of lessons appeared to
have a negative effect on their engagement with mathematics.
… people are complaining about the teachers and when work is due and I think it’s ridiculous how fast it’s got to be done and stuff. (Year 7 boy, Term 2)
As the first year of secondary school progressed the participants became less
concerned over the workload and more concerned over the number of assessment tasks they
were required to complete. This finding is consistent with literature that states the assessment
practices in secondary school are quite different to those in primary, are more competitive
and norm-referenced resulting in lower engagement (Martin, 2006).
Catherine Attard
37
… there’s so many assessments. (Year 7 girl, Term 2) The only kind of maths we do is assessments… I guess that’s what makes maths a bit boring ‘cause there’s no excitement. (Year 7 girl, Term 4)
During their years at primary school, the participants had experienced a range of
formative and summative assessment strategies that included few traditional pen and paper
tests. At the beginning of Year 7 the main methods of assessment were either traditional pen
and paper tests or computer-based tests at the end of each topic. This evolved as the year
progressed, so that by Term 4 the students were beginning to be exposed to a slightly wider
variety of assessments in which they appeared to be much more engaged. One assessment
task that the students particularly enjoyed incorporated the use of computers to create a
movie. The assessment required students to produce a ‘How to Do It’ movie on geometrical
constructions. The students were to film themselves, using their laptops, constructing a range
of different angles. While completing their constructions they were to explain the procedures.
Students were provided with a portion of time during mathematics classes to work on their
assessments.
It’s pretty good… considering it’s a maths assessment task. Usually they’re not too fun, and nobody’s looking forward to them, but I’m actually pretty excited. (Year 7 boy, Term 4)
When interviewed, the teacher identified by the students as the ‘best’ mathematics teacher at the school spoke about this particular assessment.
It’s a move away from very traditional topic tests at the end, it’s not logical. We’ve got to account for lots of different learning styles and different assessment strategies to enable the different types of learners to have a fair chance of showing us what they know. (Year 7 mathematics teacher)
The practical, ‘hands-on’ approach that students found engaging in the above
assessment task was one aspect of primary school teaching and learning that appeared to be
lacking from their secondary school mathematics classrooms. Although the students
commented on how they enjoyed being more independent, it appears they still desired the use
of concrete materials and ‘hands-on’ practical activities in their mathematics lessons.
In contrast to their primary school experiences where no text books were used and
students regularly participated in interactive, cooperative learning tasks, during the first term
of secondary school the students were confronted with a purely computer-based experience as
the basis of all their mathematics lessons. In addition to using a traditional textbook (provided
in CD-ROM format), the school provided a subscription to an on-line commercial
mathematics site that included a comprehensive program of lessons, worksheets, interactive
animations, step-by-step instructions, assessment activities and feedback. Although the
Transition from Primary to Secondary School Mathematics: Students’ Perceptions
38
students were initially engaged with the computer activities it can be argued that this was
likely due to the novelty of having brand new laptops and a degree of freedom to work at
their own pace. During the first months of secondary schooling the dependence on the on-line
program for full, 100-minute mathematics lessons and a lack of other pedagogies saw the
students quickly become disengaged with their mathematics learning.
I think I liked it better when we could do hands-on stuff… with the (commercial site) it’s kind of like you can sometimes get the same problem over and over again ‘cause it’s like the Internet… (Year 7 boy, Term 1)
It seems a lack of interaction between teachers and students and amongst students,
minimal explicit teaching, and an overuse or misuse of computer technology initially had an
impact on the students’ overall engagement in mathematics during the first months of high
school. However, things did improve for the students so that by the end of Term 2, lessons
were no longer based purely on the on-line mathematics program and the computers were
beginning to be used in a more flexible manner. In addition, some lessons involved hands-on
activities.
I’m enjoying maths… we can use computers in this program called Sketch-up to make three dimensional shapes. It’s fun. (Year 7 boy, Term 2) One of my favourite lessons was when we got all the straws and had to build a 3D shape… (Year 7 boy, Term 2)
The tasks that the students found engaging appear to be those that were derived from
the interdisciplinary Programs of Study. The integration of mathematics with other subject
areas was found to engage the students yet some felt they still needed mathematics lessons
that were focussed on the mathematics content.
Overall, the different pedagogies experienced by the students during transition had
some effect on their engagement in mathematics causing their attitudes to fluctuate
throughout the year but surprisingly, pedagogy was not the most influential factor effecting
the student’s engagement. The relationships between teachers and with other students proved
to be a stronger influence on engagement in mathematics.
Relationships
As they made the transition to secondary school the relationships the participants
experienced within the mathematics classroom changed dramatically. Coming from a school
where they were expected to work within cooperative groups, the students were initially
faced with working on an individual basis. The students’ reactions are consistent with the
Catherine Attard
39
findings of Boaler (2000), who found that because of the often individualistic nature of
mathematics lessons, some students come to view mathematics as ‘other-worldly’, having
little relationship to their own lives.
I learnt a lot more in maths when we were doing that cooperative learning. Yeah, but it’s more individual here. (Year 7 boy, Term 1) It’s better if you can communicate with people ‘cause then you can explain stuff better to each other rather than by yourself. You can sort of get off task. (Year 7 boy, Term 1)
During their first year of secondary school the students continued to complete most of
their mathematics work on an individual basis and they appeared to become accustomed to
this. However, they did express some concerns over the lack of interaction between the
students and their teachers. It should be noted at this point that along with coming to terms
with having different teachers for different subjects, the participants were faced with a
rotation of teachers during their mathematics lessons as well. That is, four teachers taught the
Year 7 cohort on a rotation basis so students did not see the same teacher for two consecutive
lessons. This seemed to have had a negative effect on the participants as none of the teachers
were trained mathematics specialists and as such, did not have a strong pedagogical content
knowledge and were unable to cater to the learning needs of all of the students. The strong
teacher-student relationships the participants had experienced in primary school were vastly
different to what they were experiencing in secondary school.
The thing is at times when we’re trying to get help from the teachers they’re not sure how to figure it out. (Year 7 boy, Term 1) Well, there’s no student-teacher connection. He ends up… calling out the answers… he keeps going through so he’s not teaching us anything. (Year 7 girl, Term 2)
Despite the experiences causing students to become disengaged in mathematics,
during focus group meetings the students discussed a teacher whom they considered to be the
‘best’ mathematics teacher in the school.
When Mr S. was teaching us I really understood fractions more than I did before with other teachers because he really can simplify it if you don’t get it. (Year 7 girl, Term 4) He always walks you through step-by-step on how to do it and he gives you homework but he doesn’t overload you with homework and he doesn’t make you rush. (Year 7 boy, Term 4)
The particular teacher who came from a middle years training background and had
previously taught in primary schools, appeared to have formed positive relationships with the
students. Amongst the positive attributes discussed by almost all of the students were his
Transition from Primary to Secondary School Mathematics: Students’ Perceptions
40
ability to explain things well, his sense of humour and his ability to make mathematics
lessons interesting. Unfortunately, due to the structure of the school, the students did not have
access to this particular teacher for every mathematics lesson.
During their final focus group meeting in Term 4, the participants were asked if their
attitudes towards mathematics had changed since leaving primary school. The students’
responses were mixed with many of them claiming they still enjoyed mathematics and
realised how important mathematics is to their futures at school and beyond.
Implications
While the nature of the sample precludes the construction of generalisations, the
findings do add to the body of knowledge regarding engagement of students with
mathematics, It is important to note that there were many positive aspects of the participants’
experiences that should be focussed upon even though the students reported dips in their
engagement due to the differences in their mathematics teaching and learning experiences
between primary and secondary schooling. Many of the negative aspects such as the
individual work and a lack of hands-on activities have already been documented in literature.
It is the positive aspects that should be highlighted if any future improvements are to take
place.
In the very early part of their secondary experience the students were highly engaged
when working on computers each day. These levels of engagement were not maintained due
to the way the computers were used. Had they been used differently and in a more flexible
manner, as was beginning to occur as the year progressed, the computers may have had the
potential to enhance and sustain engagement with mathematics in combination with stronger
teacher-student relationships. Further studies into the use of computer technology in the
mathematics classrooms would be beneficial.
The issue of having several mathematics teachers may be limited to this particular
school and does not necessarily have to be a cause of disengagement if the teachers work on
building relationships with the students. However, a positive pedagogical relationship
includes a strong knowledge of how students learn and a strong content knowledge. If
teachers are not trained in mathematics, this does not always occur. The lack of qualified
mathematics teachers could indirectly be a result of students’ disengagement with
mathematics and it seems there is a cycle occurring that needs to be addressed sooner rather
than later.
Catherine Attard
41
The use of more a more interactive approach to teaching and learning with hands-on
activities and concrete materials is something that must continue during the middle years
when students are still making the transition from a concrete-manipulative state to abstract
thought. Although the structure of secondary school timetables makes the provision of such
activities a challenge for teachers, incorporation of such pedagogies would be of benefit
during the middle years. Liaison and networking opportunities with primary school teachers
and a sharing of teaching and learning ideas would assist with this.
Above all, the difficulties in establishing pedagogical relationships between students
and teachers appear to have had a vast effect on this group of students’ engagement levels.
Although some of the pedagogies these students experienced were not considered ‘best
practice’, it appears they were able to overcome this where it was difficult for them to
overcome the lack of positive interactions with teachers coupled with fewer opportunities for
interaction with other students. It is proposed that regardless of the school context, students in
the middle years have a need for positive teacher-student and student-student relationships as
a foundation for engagement in mathematics. This relationship is built on an understanding of
students and their learning needs and unless such a relationship exists, other factors such as
pedagogy and content knowledge will not sustain engagement with mathematics during the
middle years.
Although this study is limited by the selective nature of the sample, it can be argued
the impacts of transition, pedagogy and teacher-student relationships will be of interest to
different student groups. Repetition of the study in different contexts and further investigation
of factors affecting engagement during the transition from primary to secondary school would
be of benefit in maintaining student engagement with mathematics during the secondary
years and beyond.
Transition from Primary to Secondary School Mathematics: Students’ Perceptions
42
References
Barker, K., Dowson, M., & McInerney, D. M. (2005). Effects between motivational goals,
academic self-concept and academic achievement: What is the causal ordering? Paper presented at the Australian Association of Educational Research (AARE). Sydney. Retrieved fromhttp://aare.edu.au/05pap/bar05373.pdf
Boaler, J. (1997). Setting, social class and survival of the quickest. British Educational Research Journal, 23(5), 575-595.
Boaler, J. (2000). Mathematics from another world: Traditional communities and the alienation of learners. Journal of Mathematical Behavior,18, pp. 379-397.
Downs, J. (2003). Self-concept during the transition to secondary school: Turmoil or normative adjustment? Paper presented at the Australian Association for Research in Education (AARE) Conference/New Zealand Association for Research in Education (NZARE) Conference, Auckland, NZ.
Hardy, C. L., Bukowski, W., & Sippola, L. K. (2002). Stability and change in peer relationships during the transition to middle-level school. The Journal of Early Adolescence, 22(2), 117-142.
Henry, J., Barty, K., & Tregenza, K. (2003).Connecting through the middle years: Phase two evaluation report. Melbourne: State Government Victoria Department of Education and Training.
Hill, P. W., Holmes-Smith, P., & Rowe, K. (1993). School and teacher effectiveness in Victoria: Key findings from Phase 1 of the Victorian Quality Schools Project. Melbourne: Centre for Applied Educational Research.
Howard, S., & Johnson, B. (2004). Transition from primary to secondary school: possibilities and paradoxes. Melbourne: Australian Association for Research in Education.
Kirkpatrick, D. (1992). Students' perceptions of the transition from primary to secondary school. Paper presented at the Australian Association for Research in Education/New Zealand Association for Educational Research joint conference, Deakin University, Geelong. Retrieved fromhttp://www.aare.edu.au/92pap/kirkd92003.txt
Martin, A. J. (2006). The relationship between teachers' perceptions of student motivation and engagement and teachers' enjoyment of and confidence in teaching. Asia-Pacific Journal of Teacher Education, 34(1), 73-93.
Martin, A. J. (2008). Motivation and Engagement Scale: High School (MES-HS) Test User Manual. Sydney: Lifelong Achievement Group.
McGee, C., Ward, R., Gibbons, J., & Harlow, A. (2003). Transition to secondary school: A literature review. New Zealand: Ministry of Education.
Nardi, E., & Steward, S. (2003). Is mathematics T.I.R.E.D? A profile of quiet disaffection in the secondary mathematics classroom. British Educational Research Journal, 29(3), 345-367
Newstead, J. (1998). Aspects of children's mathematics anxiety. Educational Studies in Mathematics, 36(1), 53-71.
NSW Department of Education and Training. (2005). Students - middle years. Retrieved on July 5, 2005, from http://www.det.nsw.edu.au/reviews/futuresproject/issuespapers/stdnt_middle.htm
O'Toole, T., & Plummer, C. (2004). Social interaction: A vehicle for building meaning. Australian Primary Mathematics Classroom, 9(4), 39-42.
Ricks, T. E. (2009). Mathematics is motivating. The Mathematics Educator, 19(2), 2-9.

Catherine Attard
43
Sullivan, P., McDonough, A., & Harrison, R. (2004). Students' perceptions of factors contributing to successful participation in mathematics. Paper presented at the 28th Conference of the International Group for the Psychology of Mathematics Education, Toronto, Canada.
Sullivan, P., Mousley, J., & Zevenbergen, R. (2005). Increasing access to mathematical thinking. The Australian Mathematical Society Gazette, 32(2), 105-109.

Southeast Asian Mathematics Education Journal 2012, Vol. 2 No. 2, 45 - 60
45
Bibliotherapy: A Framework for Understanding Pre-Service Primary Teachers’ Affective Responses to Learning and Teaching Mathematics
Sue Wilson Australian Catholic University
Steve Thornton Charles Darwin University
Abstract
This paper advocates bibliotherapy as a powerful tool through which teacher educators can analyze and interpret the affective responses of pre-service primary teachers. Pre-service teachers analyzed readings about school students’ learning, and reflected on and reconstructed their understanding of their own school experiences. This process facilitated a meta-affective change that enabled the pre-service teachers to reconsider their assessment of their capacity to learn and understand mathematics. We describe this change using the stages of bibliotherapy. This change enabled the pre-service teachers to approach their future teaching of mathematics with greater enthusiasm, and empowered them to construct positive projective identities.
Keywords: Affect, meta-affect, bibliotherapy, pre-service mathematics teacher education, projective identity, reflection
People will forget what you said. People will forget what you did. But people will never forget how you made them feel (Unknown).
Introduction
Mathematics anxiety has been a focus of concern among educators in many countries
for many years. Pre-service primary (elementary) teachers’ mathematics anxiety affects the
way they engage with mathematics and the way they teach. Furner and Gonzalez-
DeHassstate that “teachers can play an active role in both helping to prevent and reduce
mathematics anxiety in their students” (2011, p. 237). Hence it is important to address
mathematics anxiety during teacher education courses.
Bibliotherapy, developed in psychology and library science aims to assist individuals
to overcome negative emotions related to a real-life problem by guided reading followed by
individual or group discussion in a non-threatening environment (Hendricks, Hendricks &
Cochran, 1999). In this paper we describe how the stages of bibliotherapy were used to
analyze the reflective responses of primary pre-service teachers during a course focusing on
school students’ mathematics learning difficulties.
In comparison to other reflective practices, the potential of bibliotherapy lies in the
opportunity for the process to simultaneously promote a cognitive and emotional response
(Morawski & Gilbert, 2000). This is particularly important in the context of mathematics
teacher education where negative feelings a bout mathematics have been shown to be

Bibliotherapy: A Framework for Understanding Pre-Service Primary Teachers’ Affective Responses to Learning and Teaching Mathematics
46
notoriously hard to reverse and where the interaction between knowledge and emotions has a powerful influence on pre-service teachers’ perceptions of teaching (Pajares, 1992). We propose that understanding the stages of bibliotherapy—identification, catharsis, insight and universalization—will better enable teacher educators to address simultaneously the cognitive and affective domains, and to develop meta-affective capabilities that enable pre-service teachers to manage their emotional responses in productive ways (DeBellis & Goldin, 1997).
The Genesis of Our Research
During a course focusing on mathematics and learning difficulties, we observed that
thinking about the emotional and cognitive problems of school students caused pre-service teachers to reflect more deeply on their own experiences of mathematics. Their written reflections revealed that, when examining case studies of children who found learning mathematics difficult, pre-service teachers strongly identified with such children. An unexpected outcome of the unit was that many expressed greater confidence in their own ability to learn and teach mathematics. Hence our initial research question was: Might an explicit focus on children’s learning/learned difficulties impact upon pre-service teachers’ confidence as future teachers of primary school mathematics?
We set up a small-scale research project to investigate this question with the following year’s group of pre-service teachers. Readings were selected that we thought might encourage these pre-service teachers to re-evaluate their own experiences, develop a more positive self-image as learners of mathematics and gain insight into how children’s anxiety about mathematics can be minimized by teachers. We were surprised that, when responding to the readings, the pre-service teachers often put themselves in the place of the child. They provided graphic descriptions of incidents in their own schooling, being able to identify precisely when “their love of maths changed” (Wilson & Thornton, 2005). They identified with the school students in the readings, releasing pent-up emotion and gaining insight into the causes of their feelings of inadequacy as mathematicians. They realized that they were “not alone in this anxiety”, and were “healed and enthused” as they thought about how they might teach mathematics in the future (Wilson & Thornton, 2006).
This paper extends the theoretical framework that shows how bibliotherapy can be used to describe cognitive and affective aspects of pre-service teacher reflection. It makes two significant and new contributions: it shows how bibliotherapy can enhance pre-service teachers’ meta-affective capability (DeBellis & Goldin, 1997); and it shows how bibliotherapy can enhance pre-service teachers’ capacity to project themselves into their future role as teachers.
Sue Wilson, Steve Thornton
47
Literature Review
In this review, we introduce the process of bibliotherapy and explain how it can assist
teacher educators to better understand the emotional and cognitive responses of pre-service
primary teachers in mathematics education subjects. We discuss the concepts of meta-affect
and projective identity, explaining their connection to the process of bibliotherapy.
Bibliotherapy
Bibliotherapy is a technique which aims to assist individuals to overcome negative
emotions related to a real-life problem through guided reading. It is “a process of dynamic
interaction between the personality of the reader and literature – interaction which may be
utilized for personality assessment, adjustment and growth” (Cornett & Cornett, 1980, p. 8).
The procedure is based on the active process of reading about the dilemmas of a third person,
followed by individual or group discussion in a non-threatening environment (Aiex, 1996).
Underlying the application of bibliotherapy is the assumption that reading is a dynamic
process, in which the reader is an active participant and identifies with the protagonist in the
story. When people read they interpret through the lens of their own experiences. As the
reading involves a third person, the reader is removed from the situation and is able to
experience the problem from an objective viewpoint. This interactive process has the capacity
to “to heal and enthuse” (Martin 2002, p. 34).
Researchers in the field of bibliotherapy describe four stages: identification, catharsis,
insight and universalization (Halstead, 1991; Hebert & Furner, 1997). These stages of
bibliotherapy can be summarized as:
Identification – the reader identifies with and relates to the protagonist. The reader
recognizes herself and her situation in the readings. “Examining the behaviors and related
motives of another individual can act as a transition into the exploration of one’s own
perceptions and actions” (Morawski, 1997, p. 247).
Catharsis – the reader becomes emotionally involved and releases pent-up emotions.
Tension is released and this is accompanied by an “emotional feeling that lets the readers
know they are not alone in facing their problems” (Hebert & Furner, 1997, p. 168).
Identification is thus more strongly established, and the reader is better positioned to profit
from reviewing the feelings associated with the incidents that are recalled during the
identification phase.
Bibliotherapy: A Framework for Understanding Pre-Service Primary Teachers’ Affective Responses to Learning and Teaching Mathematics
48
Insight – this stage moves the emphasis to the reader. “Insight is the reader’s application of the character’s situation to her own life” (Halstead, 1991, p. 67).The reader envisages new ways of looking at the issues that they face (Hebert & Furner, 1997)’learns through the experiences of the character and becomes aware that her problems might also be addressed or solved. Having achieved release from some of her emotional tension, she becomes more inclined to evaluate the reasons behind her attitudes and behaviors. The reader is positioned to deconstruct her past views, and the understanding that she gains from this process helps her to recognize that her current feelings are valid in the light of her past experiences.
Universalization – the recognition that we are not alone in having these problems, we “are in this together” (Slavson, 1950, quoted in Hebert & Furner, 1997, p. 170). One of the reasons for using the technique of bibliotherapy is for an individual to come to the realization that she is not the only one who has the problem (Aiex, 1996).
The act of reading alone does not comprise the full process of bibliotherapy. Hebert and Furner (1997) stress that “successful bibliotherapy requires a meaningful follow-up discussion” (p. 169). Activities such as discussions and journal writing enable the reader to develop self-awareness, an enhanced self-concept and improved personal and social judgment. One of the benefits of sharing reflective writing is that students are exposed to a range of attitudes and experiences with which they can identify (Flores & Brittain, 2003).
As Ambrose (2004) emphasizes, emotion-packed vivid experiences that leave a
lasting impression are essential ingredients in stimulating affective changes in pre-service
teachers. These experiences can be identified in the process of bibliotherapy discussed above.
They are precisely the catalysts that stimulate catharsis. Insight and universalization, i.e. the
cognitive elements of bibliotherapy, are contingent upon this emotional response.
The technique of bibliotherapy has been used to help high ability secondary students
overcome mathematics anxiety (Furner & Duffy, 2002; Hebert & Furner, 1997), to assist
children with learning disabilities (Forgan, 2002; McTague, 1998), to remediate children’s
social difficulties (Sullivan & Strang, 2003) and in preparing pre-service teacher to teach
students with emotional and behavioral disorders (Marlowe & Maycock, 2000). Morawski
(1997), using bibliotherapy in units about teaching reading and teaching students with special
needs, concludes that it can be a stimulus for reflective practices in both pre-service and in-
service teacher education. While this study did not use bibliotherapy as an interventionist
technique it contributes to the growing application of bibliotherapy in education by showing
its potential to help teacher educators better understand the emotional responses of pre-
service primary teachers to mathematics (for example, Wilson, 2012).
Sue Wilson, Steve Thornton
49
Affect, Meta-Affect and Mathematics
I was so inhibited by my incomprehension that I did not dare to ask any questions. Mathematics classes became sheer terror and torture to me. Other subjects I found easy; and as, thanks to my good visual memory, I contrived for a long while to swindle my way through mathematics, I usually had good marks. But my fear of failure and my sense of smallness in the face of the vast world around me created in me not only a dislike but a kind of silent despair which completely ruined school for me. (Jung, 1977, p. 45)
Affective issues in the learning of mathematics have been the subject of significant
research for many years (Schuck & Grootenboer, 2004; Thompson, 1992). As Jung so vividly
describes in his autobiographical account of his own schooling, failure in mathematics can
have a powerful emotional impact that may extend far beyond the mathematics classroom.
For potential teachers of mathematics this emotional impact becomes doubly significant,
potentially affecting not only their current study but also their future teaching of mathematics
and hence the attitudes of their future students.
Of particular significance in considering emotional aspects of pre-service primary
teacher education is the phenomenon of mathematics anxiety (Haylock, 2001). Hembree’s
(1990) meta-analysis of research studies found that the level of mathematics anxiety of pre-
service elementary teachers was the highest of any major on university campuses. Trujillo
and Hadfield (1999) trace the roots of mathematics anxiety in American pre-service primary
teachers, and identify five principal factors: self-perceptions, school experiences relating to
mathematics, teachers, family influences and mathematics test anxiety. These factors were
strongly reflected in this study, in which many of the pre-service teachers expressed high
levels of mathematics anxiety.
While it is important that pre-service teachers have positive experiences of
mathematics in their teacher education courses, it may be equally important to heighten their
awareness of affective issues and thus to enhance their meta-affective capability (DeBellis &
Goldin, 1997) Meta-affect concerns people’s awareness of, and emotions about, their
emotional states, and their way of monitoring and regulating emotion. For example, Goldin
(2002) contrasts the young child’s debilitating fear of the dark with the fear experienced on a
roller-coaster which, providing the person feels safe, enhances the thrill of the ride. He claims
that the different meta-affective states associated with fear arise from different cognitive
beliefs and values. DeBellis and Goldin (2006) suggest that “the most important affective
goals in mathematics are not to eliminate frustration, remove fear and anxiety or make
mathematical activity consistently easy and fun. Rather they are to develop meta-affect where
the emotional feelings about the emotions associated with impasse or difficulty are
Bibliotherapy: A Framework for Understanding Pre-Service Primary Teachers’ Affective Responses to Learning and Teaching Mathematics
50
productive of learning and accomplishment” (p.137). We suggest that bibliotherapy
empowers pre-service teachers to see personal anxiety about mathematics as positively
influencing their capacity to teach more effectively. That is, pre-service teachers’ emotions
can be harnessed to contribute to the development of a positive projective identity.
Projective Identity
Gee (2003) examines the design of video games, looking particularly at what they
show about effective learning. One of the design features of video games identified by Gee is
the development of a strong “virtual identity”, in which the game player projects her own
values onto their virtual character, imbuing that character with her own values and desires.
The player sees the character as their “project in the making”, what she wants it to be and
become. Gee suggests that projective identity creates ownership, and that “something magic
happens” when learners take on a projective identity. They feel what it is like to have the
capacity to be the sort of person they have created and built their character to be. This is a
transformative experience, touching on cognitive and emotional elements as well as future
actions. We suggest that this transformation is a critical aspect of pre-service teacher
education in mathematics, and one that can be enhanced through the process of bibliotherapy.
Personal and professional transformation is a critical factor in teacher education,
where intrapersonal awareness and growth need to become an integral part of the ongoing
construction of knowledge and practice. In particular, teachers need to gain an understanding
of their perceptions as well as the influence that these perceptions can have on their attitudes
and actions in the educational setting (Morawski, 1997, pp. 255-6)
Research Approach
The context
The setting for this study was an elective unit Mathematics and Learning Difficulties
at an Australian urban university. This unit, which supplemented compulsory units in
mathematics content knowledge and pedagogy, focused specifically on difficulties school-
aged children experience in mathematics as a consequence of specific learning difficulties or
of cultural and attitudinal factors. The emphasis of the unit was on students who struggle in
the mainstream classroom rather than those with severe learning difficulties. The topics
discussed during the unit included mathematics anxiety, mathematical understanding, the
social context of the classroom, language factors, and ways of addressing students’ individual
needs.
Sue Wilson, Steve Thornton
51
In the first workshop of the unit pre-service teachers were asked to describe a critical
incident in their own school mathematics education that impacted on their image of
themselves as learners of mathematics. This incident could have been positive or negative.
During each week of the unit, pre-service teachers were required to read articles that
related to the experience of learning mathematics in a classroom, particularly for those
students who find it difficult or suffer anxiety. These readings were chosen to give a broad
overview of the difficulties that primary school students have in learning mathematics. They
included readings about mathematics anxiety (Dossel, 1993), understanding in mathematics
(Skemp, 1976), classroom interactions (Zevenbergen, 2000) and exclusion from school
mathematics (Walkerdine, 1990). The readings focused on both psychological and
sociocultural aspects of learning mathematics, and encouraged pre-service teachers to
consider both the affective and the cognitive dimensions. We particularly chose readings that
we felt were likely to provoke an emotional response.
Part of the assessment for the unit required students to maintain a reflective journal. In
this journal they were encouraged not only to consider the implications of the readings for
children in schools, but also to reflect on their own experience of school mathematics.
Prompts were provided for their responses to the readings, including:
• Something I learned • Something I felt reassured by • Something that surprised me • Something I disagreed with • Something I would like to know more about
This was presented as an open-ended task and did not require every prompt to be addressed.
In the following workshop, the students then shared as much of their reflective writing
as they wished in a small group of their choosing, and each group was provided with an
opportunity to raise issues they felt were important with the whole group. As teachers of the
unit we attempted to create a supportive and non-judgmental environment in which reflective
writing could be shared, with meaningful follow-up discussion. This process of publicly
sharing reflections is emphasized in the literature as an essential component of bibliotherapy
(Hebert & Furner, 1997).
The pre-service teaching students
Thirteen pre-service primary teachers (twelve females and one male) participated in
the unit. They encompassed a range of academic years from the second year to the fourth
year of their primary education degree. All had studied one unit of mathematics content, and
Bibliotherapy: A Framework for Understanding Pre-Service Primary Teachers’ Affective Responses to Learning and Teaching Mathematics
52
had completed or were simultaneously completing one unit focusing on mathematics
pedagogy. All had completed at least two three-week periods of professional teaching
experience in primary schools. The pre-service teachers in the fourth year of their degree had
completed a second unit of mathematics pedagogy and an eight-week teaching internship in
addition to those completed by the second or third year pre-service teachers. Most of the
students were studying the unit as part of an inclusive education major. They did not
necessarily have negative feelings themselves about mathematics but they were particularly
interested in school students who had cognitive or emotional difficulties in mathematics.
Data collection and ethics
The reflective journals, consisting of the critical incident report and the regular
weekly responses to the readings, were the source of the data for this study. Those who
agreed to participate in the study could choose to send additional reflections to a third party
without the lecturer’s knowledge, for the purposes of research only. They were aware that
these additional reflections did not form part of the assessment for the unit and did not need
to satisfy formal assessment requirements. A clear distinction between criteria used for
formal assessment in the unit and the use of reflective writing as a research tool was made.
All additional reflections that had been submitted were sealed until the unit was finished and
formal assessment had been completed. Although sharing of reflections and in-class
discussions were important elements in creating a supportive and non-judgmental
environment, for ethical reasons they were not recorded and are not reported in this study.
This research design was examined by the university’s ethics committee to ensure that
results would not be skewed by pre-service teachers submitting spurious reflections purely in
order to pass the unit.
All thirteen pre-service primary teachers agreed to participate in the research, however
the researchers did not know this until after the unit assessment had been completed.
Fictitious female names were assigned to all pre-service teachers to preserve anonymity.
Data analysis
After the completion of the unit, the critical incidents and journals were read and
summarized independently by three researchers, who each identified common themes
(Wilson & Thornton, 2005). The themes identified by each of the researchers were compared
and synthesized.
The study was designed to provide a snapshot of how the pre-service teachers felt
about themselves as learners and potential teachers of mathematics at the start of the unit, and
Sue Wilson, Steve Thornton
53
to examine how those feelings changed as the unit progressed. It was not designed to provide
a rigorous pre and post unit comparison of their beliefs and self-efficacy, nor was it designed
as a systematic analysis of beliefs or emotions based on pre-existing research. Rather, it was
an interpretive study based on a small number of very rich written reflections.
Results and Discussion
Themes emerging from the critical incidents
The critical incidents provided a snapshot of how pre-service teachers felt when they
started the unit (Wilson & Thornton, 2005). The act of writing about these incidents in their
own school mathematics evoked some intense memories. Although no specific direction was
given when asking the pre-service teachers to write about a critical incident, they
overwhelmingly chose to write about an experience in their own schooling that provoked
negative rather than positive feelings towards mathematics.
Themes identified were: (1) the lasting influence of an individual teacher; (2) the
cycle of fear failure and avoidance; (3) their self-image as a learner of mathematics; (4) their
perceptions of the nature of mathematics; and, less commonly, (5) the influence of parents,
(Wilson & Thornton, 2008). There are parallels between the themes identified here and those
in the literature relating to mathematical autobiographies of pre-service teachers (Sliva &
Roddick, 2001; Ellsworth & Buss, 2000).
The critical incidents thus provided a snapshot of the pre-service teachers’ emotions
and beliefs about the causes of those emotions at the commencement of the unit. This
awareness of emotions, their causes and their impact is a critical aspect in developing meta-
affective capabilites (DeBellis & Goldin, 2006). Like the young child’s fear of the dark
(Goldin, 2002), for the most part these emotions had proved debilitating during the pre-
service teachers’ own school experiences.
We now describe how the process of reading and reflecting during the unit, described
by the stages of bibliotherapy, provided a means by which these emotions, like the positive
fear of a roller coaster, became productive in enabling the pre-service teachers to see
themselves as potentially more effective teachers of mathematics.
Bibliotherapy in This Study
The on-going reflective process of journaling provided data with which to examine
how the pre-service teachers’ attitudes changed during the unit in response to the readings. In
particular it enabled us to use bibliotherapy as a framework to understand this change
Bibliotherapy: A Framework for Understanding Pre-Service Primary Teachers’ Affective Responses to Learning and Teaching Mathematics
54
process. The readings in the unit provided a mirror in which pre-service teachers could see
themselves and their school experiences, and a lens through which they could construct
themselves as potentially enthusiastic and effective future teachers of mathematics. The
journal entries provided evidence that students did indeed experience a powerful emotional
response to the readings, reflected deeply on their own experiences in the light of the readings
and engaged in all four stages described in the literature relating to bibliotherapy (Aiex,
1996).
Stage 1: Identification
Several pre-service teachers identified closely with an article by Dossel (1993) which
describes the possible causes of mathematics anxiety among school students. Barbara saw
herself in their situation and could recognize the defensive barriers she had erected during her
own schooling. The article by Steve Dossel (1993) presented issues that I was able to relate to personally… I related deeply to the ‘unconscious defends itself’ statement by Walkerdine, (1990). (Barbara)
Skemp’s (1976) discussion of relational and instrumental understanding also
provoked a strong reaction among the pre-service teachers. They identified the instrumental
nature of their own schooling and saw that it had been debilitating for them. This is how I viewed maths, as long as I knew the set of rules and applied them appropriately then I didn’t really need to know why. To me maths was all about getting the right answer. (Mandy)
Despite three years of studying mathematics and mathematics education subjects at
university, it was the experience of focusing on students with learning difficulties that
prompted Mandy and Barbara to explicitly connect the cognitive components of their pre-
service teacher education with their own experiences as learners of mathematics in school.
The identification stage of bibliotherapy thus represents the beginnings of an enhanced meta-
affective awareness.
Stage 2: Catharsis
Through their reading of the articles the pre-service teachers became emotionally
involved and shared and released pent-up emotion. Several reflected on their own
mathematics anxiety having read about children’s mathematics anxiety in Dossel (1993). I am currently studying maths …and let me tell you the fear that has risen in me is nasty. Even though these subjects are not about the actual content of maths the very fact they are to do with maths terrifies me. (Felicity) There seems to be an overwhelming fear of failure from everyone - parents, teachers, society – ‘You fail in math, you fail in life’ mentality. (Gail)
Sue Wilson, Steve Thornton
55
These are classic examples of students responding emotionally and connecting the
readings with their past experiences. The strength of these responses, as shown by Felicity’s
use of words such as ‘nasty’ and phrases such as ‘let me tell you’, indicates a release of
emotion that is essential if people are to begin to recognize the causes of their feelings and, as
with the fear of the roller coaster, to use these feelings productively.
Stage 3: Insight
Through reading articles focused on the reasons school students struggle with
mathematics, the pre-service teachers became more aware that their problems were not
necessarily of their own making and could thus be addressed or solved. In some cases they
recognized that this was related to the nature of the mathematics studied and the type of
understanding they felt was valued in their schooling. Instrumental and relational learning (Skemp, 1976) was a bit of a mind blower for me and funnily enough gave me a little more confidence within myself, that it was the way I was taught that has made me mathematically challenged not my actual intelligence. (Felicity)
Some reflections showed progress in pre-service teachers’ perceptions of themselves
as learners of mathematics. These included development of a deeper understanding of what it
means to learn mathematics, and awareness that there are alternatives to the approaches that
they experienced. Jenny, reflecting on a reading about excellent mathematics teaching from
Reys, Lindquist, Lambdin, Smith and Suydam (2002) expressed her frustration very
concisely. Basically I feel a bit cheated – like I got a second rate education. (Jenny)
These reflections contain a strong cognitive component, in that they show
understanding of how emotions have arisen. As emphasized by DeBellis and Goldin (2006),
this cognitive element is critical in developing meta-affective capability, as it is knowledge
that enables us to monitor and regulate our emotions. However, the pre-service teachers’ use
of emotionally charged words such as “mind blower”, “cheated” and “second rate” also
demonstrate the impact of the cathartic experience. As described in bibliotherapy, insight is
deepened when it is accompanied by catharsis.
Stage 4: Universalisation
Using their reflections on the readings and through the sharing of their experiences
pre-service teachers were able to connect with each other and find that they were not alone in
their feelings and experiences. The recognition that others have the same issues and one is not
alone (Rizza, 1997) was particularly evident during the shared reflections.
Bibliotherapy: A Framework for Understanding Pre-Service Primary Teachers’ Affective Responses to Learning and Teaching Mathematics
56
The biggest thing I think I have learned this week was that I am really not alone in this anxiety there are lots of my peers and children still there with me. (Felicity)
A conviction that one is alone in one’s feelings of anxiety and the overwhelming
desire to conceal that emotion makes it almost impossible to discuss and resolve these
feelings. Through the sharing of responses to readings in the privacy of a small group,
followed by a more public sharing as they felt able, the pre-service teachers’ feelings of
aloneness were reduced. Felicity’s use of the term” still there with me” shows her willingness
to admit her anxiety and expose her fears. Her capacity to express solidarity with students
who find mathematics difficult stems from the identification, catharsis and insight described
by bibliotherapy. The feelings of aloneness experienced by the young child afraid of the dark
are in stark contrast to the shared fear and accompanying exhilaration experienced by the
riders of a roller coaster, and to the sense of solidarity promoted by the discussions of the
readings.
Stage 5: Projection
The pre-service teachers’ added insight into their own circumstances was followed by
a consideration of what this could mean for the future. While we would expect pre-service
teachers to imagine themselves as future teachers, it was the vehemence with which they
rejected the way in which they felt they had been taught, accompanied by the vividness with
which they described the type of teacher they wanted to be that surprised us when we read
their reflections. We observed this not only among those nearing the end of their study, but
also in the reflections of those pre-service teachers who were only in the second year of their
course. The prevalence and strength of this aspect of their reflections was so striking that we
identified it as worthy of description in its own right. We term this fifth stage of the
bibliotherapy process “projection” (Wilson & Thornton, 2008). I can only hope that at the end of this semester I can turn this around and actually make a difference to another child so that they don’t experience what I have…I feel more determined in teaching maths well, so students don’t suffer through maths as I did. (Felicity) There is no place for the methods of my past in classrooms of today if I wish to stop the cyclical nature of instrumental mathematics teaching experienced to date. (Barbara)
In several cases during the eight weeks of the journal reflections the focus of the pre-
service teachers’ comments moved from reflections about how inadequate they felt to the
reassurance they felt when faced with research that concluded that the best teachers were not
always those who had performed best in mathematics at school.
Sue Wilson, Steve Thornton
57
It gives me great comfort to know that although I may not graduate at the top of the mathematics class, this will have no lasting bearing on my ability to teach it (Jenny)
As the semester progressed extensive sections of some of the pre-service teachers’
journals were devoted to a consideration of the effects of the readings on their intended
teaching practices. The comments about teaching fell into several categories - their views of
mathematics itself, characteristics of good teachers of mathematics, and their aim for their
own teaching to be substantially different from the way that they were taught. Some of the
comments addressed specific issues such as the need to ensure that their students see purpose
and make connections in their mathematics learning. Others showed detailed analysis of
applications taken from particular readings, and descriptions of learning tools that they
intended to incorporate into their classrooms. Thus rather than expressing inadequacy, as in
their earlier reflections, their later reflections contained practical thoughts and strategies to
make them more effective teachers
In particular, the insights developed through the readings convinced the pre-service
teachers of the need to achieve positive attitudes in their classrooms. Their comments
reflected a determination that negative learning experiences would not be transferred to their
students and continue a cycle of negative attitudes, beliefs and feelings about mathematics.
More powerfully, some pre-service teachers saw their own past fears and inadequacies as
learners of mathematics as being positive factors in helping them to become more effective
teachers. The identification, catharsis, insight and universalization described in the
bibliotherapy process were instrumental in enabling the creation of a projective identity that
was in stark contrast to the timidity with which they had previously viewed themselves as
learners and potential teachers of mathematics. Like the game players described by Gee
(2003), the pre-service teachers underwent a transformative experience, feeling what it was
like to have the capacity to be the sort of teacher they did not themselves have as a learner.
Jenny, in particular, captured the dual emotional and cognitive aspects of the projection stage
of bibliotherapy. This also leads me to my second thought that, for those teachers, who like me, have never believed maths to be their “thing”, there is the distinct possibility that our desire not to let students suffer our fate and to improve on our own childhood experiences in classrooms could well be the factor that makes us more effective teachers. We are more open to the need for reflective teaching and professional development, and more willing to look for alternate explanations and examples. (Jenny, emphasis added)
Bibliotherapy: A Framework for Understanding Pre-Service Primary Teachers’ Affective Responses to Learning and Teaching Mathematics
58
Conclusion and Implications
The five stages of bibliotherapy described above explain how meta-affective change
might take place. We suggest that each is critical in enabling pre-service teachers to develop
greater awareness of their own emotions about mathematics, and in developing the capacity
to monitor and regulate these emotions. Goldin (2002) claims that meta-affect is the most
important aspect of affect. He states (p.71) that “it will be important to provide experiences
that are sufficiently rich, varied, and powerful in their emotional content to foster the
students’ construction of new meta-affect. This is a difficult challenge indeed.” As evidenced
by the transformation in the pre-service teachers’ meta-affect described above, we claim that
the stages of bibliotherapy may provide just such a set of experiences, and hence go some
way towards meeting that challenge.
Not only were the pre-service teachers more enthused about their potential as teachers
of mathematics, but their concept of themselves as learners of mathematics was sufficiently
healed that they were willing to confront mathematical concepts they had not understood in
their schooling. As several asked after one session: “Can you explain trigonometry to me?” In
asking for an explanation of trigonometry, the pre-service teachers were not merely asking
for mathematical content. Rather, they were exhibiting a powerful meta-affective
transformation by acknowledging that their past lack of understanding had not been because
of an inherent mathematical inability, but that, given a more appropriate explanation, they
would be able to understand concepts they had once found difficult. The meta-affective
capability gained through reading and reflection, and described in the stages of bibliotherapy,
made them open to new ideas and keen to explore new challenges.
In this study the stages of bibliotherapy were not linear, sequential or something that
only happens once. It was a cyclic process, with each reading provoking a range of cognitive
and emotional responses that we have described using the stages of bibliotherapy, and that
contributed to meta-affective capability. The intensity and nature of the responses were
different for different participants. However, as the unit progressed the balance of the pre-
service teachers’ responses moved towards the development of greater insight, and ultimately
towards robust and healthy projection into the situation of teaching.
Understanding the process of bibliotherapy, and providing stimulus and space for pre-
service teachers to read and respond to the difficulties faced by children at school may thus
enable teacher educators to assist all pre-service teachers to develop a more robust projective
identity with healthy cognitive and emotional components.
Sue Wilson, Steve Thornton
59
References
Aiex, N. (1996). Bibliotherapy. Available on line at http://www.ldonline.org/ld_store/bibliotherapy/eric_digest82.html
Ambrose, R. (2004). Initiating change in prospective elementary school teachers’ orientations to mathematics teaching by building on beliefs. Journal of Mathematics Teacher Education, 7, 91-119.
Buerk, D. (1982). An experience with some able women who avoid mathematics. For the Learning of Mathematics, 3(2), 19-24.
Cornett, C., & Cornett, C. (1980). Bibliotherapy: The right book at the right time. Bloomington, Ind.: Phi Delta Kappa Educational Foundation.
DeBellis, V., & Goldin, G. (1997). The affective domain in mathematical problem-solving. In E. Pekhonen (Ed.) Proceedings of the 21st Annual Meeting of the International group for the Psychology of Mathematics Education (Vol 2, pp. 209-216). Lahti, Finland: Univ. of Helsinki,
DeBellis, V. ,& Goldin, G. (2006). Affect and meta-affect in mathematical problem solving: a representational perspective. Educational Studies in Mathematics, 63(2), 131-147
Dossel, S. (1993). Maths anxiety. Australian Mathematics Teacher, 49(1), 4-8. Ellsworth, J., & Buss, A. (2000). Autobiographical stories from preservice elementary
mathematics and science students: Implications for K-16 teaching. School Science and Mathematics, 100(7), 355-364.
Flores, A., & Brittain, C. (2003).Writing to reflect in a mathematical methods course. Teaching Children Mathematics, 10(2), 112-118.
Forgan, J. (2002). Using bibliotherapy to teach problem solving. Intervention in School & Clinic, 38(2), 75-82.
Furner, J., & Duffy, M. (2002). Equity for all students in the new millennium: Disabling math anxiety. Intervention in School and Clinic, 38(2), 67-75.
Furner, J. & Gonzalez-DeHass, A. (2011). How do students’ mastery and performance goals relate to math anxiety? Eurasian Journal Of Mathematics, Science & Technology Education, 7(4), 227-242.
Gee, J. P. (2003). What video games have to teach us about literacy and learning. New York: Palgrave Macmillan.
Goldin, G. (2002). Affect, meta-affect and mathematical belief structures. In G. Leder, E. Pehkonen& G. Törner (Eds.), Beliefs: A hidden variable in mathematics education (pp. 59-72). Dordrecht: Kluwer.
Halstead, J. (1991). Guiding gifted readers. Melbourne: Hawker Brownlow Education. Haylock, D. (2001). Mathematics explained for primary teachers. London: Paul Chapman. Hebert, T., & Furner, J. (1997). Helping high ability students overcome maths anxiety
through bibliotherapy. Journal of Secondary Gifted Education, 8(4), 164-179. Hembree, R. (1990). The nature, effects and relief of mathematics anxiety. Journal for
Research in Mathematics Education, 21(1), 33-46. Hendricks, C., Hendricks, J. & Cochran, L (1999). Using literacy conversations for healing:
The significant conversationalists. American Reading Forum Online Yearbook Vol XIX.http://americanreadingforum.org/yearbook/yearbooks/99_yearbook/pdf/8_hendricks_99.pdf
Jung, C. (1977). Memories, dreams, reflections (R. Winston & C. Winston, Trans.). Great Britain: Collins Fount Paperbacks.
Marlowe, M.,&Maycock, G. (2000). Phenomenology of bibliotherapy in modifying teacher punitiveness. Journal of Genetic Psychology, 161(3), 325-336
Martin, L. (2002). Using books to heal and enthuse gifted students. Gifted,123, 34-35.
Bibliotherapy: A Framework for Understanding Pre-Service Primary Teachers’ Affective Responses to Learning and Teaching Mathematics
60
McTague, K. (1998). Children's literature: Bibliotherapy and learning problems. Unpublished Masters’ Dissertation. Kean University of New Jersey.
Morawski, C. (1997). A role for bibliotherapy in teacher education. Reading Horizons, 37(3), 243-259.
Morawski, C., & Gilbert, J. (2000). Developmental interactive bibliotherapy. College Teaching, 48(3), 108-114.
Pajares, M. (1992) Teachers’ beliefs and education research: Cleaning up a messy construct. Review of Educational Research,62(3) 301-332.
Reys, R., Lindquist, M., Lambdin, D., Smith, N. & Suydam, M. (2002). Helping Children Learn Mathematics. New York: John Wiley & Sons Inc.
Rizza, M. (1997). A parent's guide to helping children: Using bibliotherapy at home. http://www.gifted.uconn.edu/nrcgt/newsletter/winter97/wintr972.html
Schuck, S., & Grootenboer, P. (2004). Affective issues in mathematics education. In B. Perry, G. Anthony & C. Diezmann (Eds.), Research in mathematics education in Australasia 2000-2003 (pp. 53-74).Flaxton, Qld: Post Pressed.
Skemp, R. (1976). Relational understanding and instrumental understanding. Mathematics Teaching, 77, 20-26.
Sliva, J., & Roddick, C. (2001). Mathematicsautobiographies: A window into beliefs, values, and past mathematics experiences of preservice teachers. Academic Exchange Quarterly, 5(2), 101-107.
Sullivan, A., & Strang, H. (2003). Bibliotherapy in the classroom: Using literature to promote the development of emotional intelligence. Childhood Education, 79(2), 74-80.
Thompson, A. (1992). Teachers' beliefs and conceptions: A synthesis of the research. In D. Grouws (Ed.), Handbook of research on mathematics teaching and learning (pp. 127-146). New York: Macmillan.
Trujillo, K., & Hadfield, O. (1999).Tracing the roots of mathematics anxiety through in-depth interviews with pre-service elementary teachers. College Student Journal, 33(2), 219-232.
Walkerdine, V. (1990). Difference, cognition and mathematics education. For the Learning of Mathematics, 10(3), 51-56.
Wilson, S. (2012). Bibliotherapy: a powerful tool to address mathematics anxiety in pre-service primary teachers. In A. L. White & U. H.Cheah (Eds.), Transforming School Mathematics Education In the 21st Century. (pp. 317 - 329). Penang: SEAMO RECSAM.
Wilson, S., & Thornton, S. (2005). The year in which my love of maths changed: Pre-service primary teachers' self-image as mathematicians. In M. Coupland, J. Anderson & T. Spencer (Eds.), Making Mathematics Vital: Proceedings of the 20th biennial conference of the Australian Association of Mathematics Teachers(pp.268-274). AAMT: Adelaide
Wilson, S. & Thornton, S (2006). To heal and enthuse: Developmental bibliotherapy and pre-service primary teachers' reflections on learning and teaching mathematics. In P. Grootenboer, R. Zevenbergen & M. Chinnappan (Eds.), Identities, Cultures and Learning Spaces: Proceedings of the 29th annual conference of the Mathematics Education Research Group of Australasia (pp. 36-44). AAMT: Adelaide.
Wilson, S. & Thornton, S. (2008) “The factor that makes us more effective teachers”: Two pre-service primary teachers’ experience of bibliotherapy. Mathematics Teacher Education and Development, 9, 21-35
Zevenbergen, R. (2000). "Cracking the code" of mathematics classrooms: School success as a function of linguistic, social, and cultural background. In J. Boaler (Ed.), Multiple perspectives on mathematics teaching and learning (pp. 201-224). Westport, CT: Ablex.
Southeast Asian Mathematics Education Journal 2012, Vol. 2 No. 2, 61 - 73
61
Introducing Computer Adaptive Testing to a Cohort of Mathematics Teachers: The Case of Concerto
S. Kanageswari Suppiah Shanmugam SEAMEO RECSAM
Leong Chee Kin SEAMEO RECSAM
Abstract
This article describes a study that explores on-line assessment, with the objectives to identify features that support or impede the usability of Concerto, an on-line adaptive testing software that was developed by the Psychometrics Centre of the University of Cambridge. We report on the analysis of data collected during a one-month in-service programme organised for secondary teachers and teacher educators from the Southeast Asian Minister of Education Organisation (SEAMEO) region. The study identifies the challenges the participants encountered during a one-day workshop and evaluates the difficulties of adopting Concerto to create a simple and an adaptive on-line mathematics test. While the small study limits the possibility of applicability for other samples, yet the findings of the study illustrate the complexity of using the Concerto’s features and the commonly occurring difficulties, providing the basis for the development of some new workshop materials that will contribute to the improvement of introductory Concerto workshops that will be conducted in the future.
Keywords: Concerto; computer adaptive testing (CAT); on-line adaptive testing; assessment; testing
Introduction
Technology has long been incorporated in education as a tool that enhances teaching,
learning and assessing strategies (Barker, 1974). Technology in testing has evolved from a
simple gadget like a blackboard to the present sophisticated Smartphone, tablets and applets,
while along the way witnessing gadgets like handhelds scientific calculators and the widely
used computer. Computer based technology is possibly essential for sustainability in
education. From computer assisted learning to the current computer adaptive testing (CAT),
computers have continued to live up to its name as a powerful educational tool that is
effectively used as a medium to assess students, apart from its essential role as a teaching and
learning aid (Barker, 1974). With the Internet, CAT is slowly but steadily moving into the
classrooms, making assessments efficient, accessible, economical and borderless.
Adaptive Testing
The first recorded adaptive test was created by Alfred Binet in 1905 which became the
first intelligence test. He ordered the items according to their difficulty level. Test
Introducing Computer Adaptive Testing to a Cohort of Mathematics Teachers: The Case of Concerto
62
administration began by presenting the students with an item that was believed to be a good
estimate of the student’s ability. If the student succeeded with that item, a moderately more
difficult item was presented and if he failed, an easier item was presented. The process would
continue until the student was unable to answer a few questions in a row (Linacre, 2000).
Stanford-Binet Intelligence Test and Wechsler Intelligence tests are examples of current
modern adaptive tests that follow the modest works of Alfred Binet (Partners in Learning,
2012). When computers came along, adaptive tests morphed into computer adaptive testing
as computers overtook the role of test administrators and examiners. The computers selected
items after making an estimation of the test taker’s ability, administered the items and,
provided objective and accurate scores without compromising test validity (Linacre, 2000).
Technology in Testing
Computer based technology has become a component in classrooms, especially in
computer based testing (CBT) (Russell, 2006). Using computers in testing has proven to
increase the effectiveness of test administration as it reduces costs of printing and shipping of
test papers, scores accurately and reports the scores with great precision (Linacre, 2000). In
addition, computers capitalise on ever-growing number of software to include multimedia
and sound that adds colour and vibrancy, redefining the conventional, mundane static tests
(Russell, 2006). The benefits of using computers in testing have transcended the objectives of
measuring the product (students’ work) to measuring the process which makes CBT an
invaluable asset in testing. CBT has become mandatory in certain testing situations that
require test takers to work in simulated environments such as assessing the skills required by
air traffic controller. The use of simulations increased the authenticity of the items presented
during the test administration and injected reality into the world of testing. CBT can be
effectively used to cater for students with special needs, with the help of certain software like
the speech-to-text software (Russell, 2006).
Over the years, CBT has grown from the infancy purpose of computer delivered
examinations to computer adaptive testing that can provide accurate estimates of a person’s
ability by administering a small number of items that are closely matched (Linacre, 2000).
With the introduction of the Internet, computer adaptive testing has undergone another uplift
that opens a parallel world of on-line assessment.
S. Kanageswari Suppiah Shanmugam, Leong Chee Kin
63
Computer Adaptive Testing Computer adaptive testing has gained recognition as a test that is tailored to the test
taker’s ability. CAT has a reputation as a new wave in assessment, breaking away from the
traditional paper-pencil test. The design of CAT allows pre-calibrated items to be
administered from an item bank, hence rendering itself as a customised test that continuously
re-estimates the true test taker’s ability with improved precision of an individual measure.
Since the selection of item difficulty is matched to a person’s ability, the iterative process will
converge to provide an accurate, reliable and valid measure of the person’s ability (Linacre,
2000). As items are individually paced, there is no need for the test takers to be presented
with irrelevant items that are easy or too difficult, hence reducing and eliminating ‘unwanted’
behaviour like boredom, fatigue, test anxiety and frustration.
It has been claimed that CAT provides immediate scoring and feedback to the test
takers and cuts down testing time by half (Russell, 2006). In addition, administrating
equivalently challenging items reduces over-exposure of items and thus increases test
security. Cost of administrating tests is cut down as the need for hiring and training
invigilators does not arise, which also reduces measurement error. Besides test takers, CAT
also benefits test developers and test publishers as experimental items can be simultaneously
validated with testing and, test revision is less strenuous since adding or removing items does
not contribute to test reliability (Rudner, 1998).
The major setback of on-line CAT is the computer facilities and the quality of the
Internet connection which are mandatory components and they must function well for
without either one, CAT cannot be administered.
The open source software that was used in this study was Concerto which is an on-
line adaptive testing software and will be briefly discussed in the next section.
Concerto: On-line Adaptive Testing Platform
Concerto is an open source, web based, adaptive testing platform that was developed
by the Psychometrics Centre of University of Cambridge for creating and running rich
dynamic tests. It combines the flexibility of HTML presentation with the computing power of
the R language. A table is used to store the data in the form of items, their responses and their
difficulty level or any other item parameters depending on the parameter model stipulated in
the Item Response Theory (IRT) (Hambleton, Swamination & Rogers, 1991; Lord, 1980;
Wainer, 1990). IRT is a statistical framework in which test takers can be described by a set of
one or more ability scores that are predictive, through mathematical models, linking actual
performance on test items, items statistics, and their abilities (Lilley & Barker, 2002). The
Introducing Computer Adaptive Testing to a Cohort of Mathematics Teachers: The Case of Concerto
64
HTML template is used to create an introduction template, an item template and a feedback
template and to present it to the test takers. The scores are calculated as the test takers
advance into the test.
Description of the Study
The study described in this article was conducted with the intention of identifying the
features of Concerto that support or impede the usability of the software as a platform to
conduct on-line adaptive assessment. By doing so, the user-friendliness of Concerto as a tool
to create on-line adaptive tests could be identified which could help to increase its use in
classroom testing. In addition, the challenges that the participants encountered during the
Concerto workshop would be identified and solutions sought that would help to alleviate
these impediments. At the end of the study, the authors hoped to make some
recommendations to improve the user-friendliness of the software itself so that CAT would
be more widely used as a mode of assessment. Specifically, there are two main objectives in
this study, namely:
1. To identify the features of Concerto that support or impede its usability as an on-line
adaptive assessment
2. To provide a basis to revise and develop an improve version of Concerto workshop
material for novice users of the software. Context and Environment
The study reports on a cohort of 11 secondary teachers and one teacher trainer
introduced to Concerto as part of their four-week in-service course where one of the authors
was the facilitator for the one-day (6 hours) Concerto workshop. The main purpose of the
course was to enhance meaningful secondary mathematics learning through interactive
technologies. Concerto was one of the technologies introduced in this course. During the
workshop, participants used the desktops with Internet connection provided in the workshop
venue. This cohort consisted of two teachers each from Philippines and Malaysia, one each
from Thailand, Brunei, Vietnam, Cambodia, Myanmar, Laos, Indonesia and Singapore.
The teaching experience of these teachers ranged from three to twenty years with four
teachers with an experience of 6 years and two teachers with 18 years of teaching experience.
There were three male teachers while the rest were female. There was only one participant
with a diploma and one with a Masters while the rest had a bachelor’s degree. All the
participants taught Mathematics and their academic qualifications were related in the
Mathematics field except two who specialised in Economics and Education Management.
S. Kanageswari Suppiah Shanmugam, Leong Chee Kin
65
All these participants had no prior knowledge of Item Response Theory and R script.
According to the participants, this workshop was the first of its kind that provided an
exposure to IRT and none of them had ever heard of or applied R script knowledge in their
university years, career or in any other course. In addition, they also admitted their lack of
knowledge of CAT, even though they claimed that they have heard about it. These limitations
were considered while conducting this workshop, and prevent the application of the findings
to other samples or workshops.
Instrument Evaluation The Concerto introductory workshop was evaluated using data derived from
observations by the facilitator, conversations between the facilitator and the teachers, their
created adaptive on-line test, and a 28-item questionnaire. Questionnaires have long been
used to evaluate user interfaces (Root & Draper, 1983). The questionnaire used in this study
was adapted from the ‘USE Questionnaire’ by Lund, as it had been taken through a complete
psychometric instrument development process (Lund, 2001). It has four categories. The
categories, the items concerned, and it purposes are as shown below.
• Usefulness (Item 1- Item 6): to evaluate the effectiveness of Concerto
• Ease of Use (Item 7- Item 17): to evaluate if it is easy to use Concerto
• Ease of Learning (Item 18 - Item 21): to evaluate if it is easy for the participants to
learn the use of Concerto
• Satisfaction (Item 22 - Item 28): to evaluate if the participants are satisfied with
Concerto
After the workshop, the participants were asked to indicate their level of agreement on
this questionnaire based on a Likert scale ranging from 1 (‘Strongly Disagree’) to 5
(‘Strongly Agree”). Design and Content of the Workshop
The workshop was divided into three sessions each of two hours The first session
included knowledge of adaptive testing, computer adaptive testing (CAT), and an overview
of Concerto and Item Response Theory (IRT). The various IRT models of one-parameter,
two-parameter and three-parameter models were introduced for comparison purposes.
However, only the one-parameter model was used to introduce and develop a simple adaptive
on-line test in this workshop. The main idea here was to guide the participants to utilise
Concerto to deliver a simple yet powerful tool for the development of an adaptive on-line
test. Although, this platform relies on three main elements, that is, 1) a HTML presentation
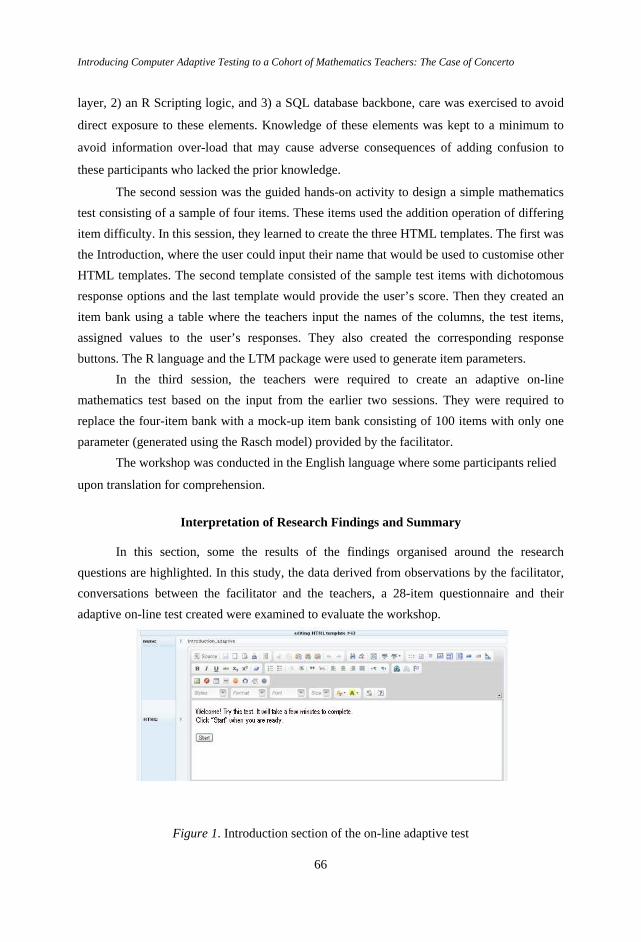
Introducing Computer Adaptive Testing to a Cohort of Mathematics Teachers: The Case of Concerto
66
layer, 2) an R Scripting logic, and 3) a SQL database backbone, care was exercised to avoid
direct exposure to these elements. Knowledge of these elements was kept to a minimum to
avoid information over-load that may cause adverse consequences of adding confusion to
these participants who lacked the prior knowledge.
The second session was the guided hands-on activity to design a simple mathematics test consisting of a sample of four items. These items used the addition operation of differing item difficulty. In this session, they learned to create the three HTML templates. The first was the Introduction, where the user could input their name that would be used to customise other HTML templates. The second template consisted of the sample test items with dichotomous response options and the last template would provide the user’s score. Then they created an item bank using a table where the teachers input the names of the columns, the test items, assigned values to the user’s responses. They also created the corresponding response buttons. The R language and the LTM package were used to generate item parameters.
In the third session, the teachers were required to create an adaptive on-line mathematics test based on the input from the earlier two sessions. They were required to replace the four-item bank with a mock-up item bank consisting of 100 items with only one parameter (generated using the Rasch model) provided by the facilitator.
The workshop was conducted in the English language where some participants relied
upon translation for comprehension.
Interpretation of Research Findings and Summary
In this section, some the results of the findings organised around the research questions are highlighted. In this study, the data derived from observations by the facilitator, conversations between the facilitator and the teachers, a 28-item questionnaire and their adaptive on-line test created were examined to evaluate the workshop.
Figure 1. Introduction section of the on-line adaptive test
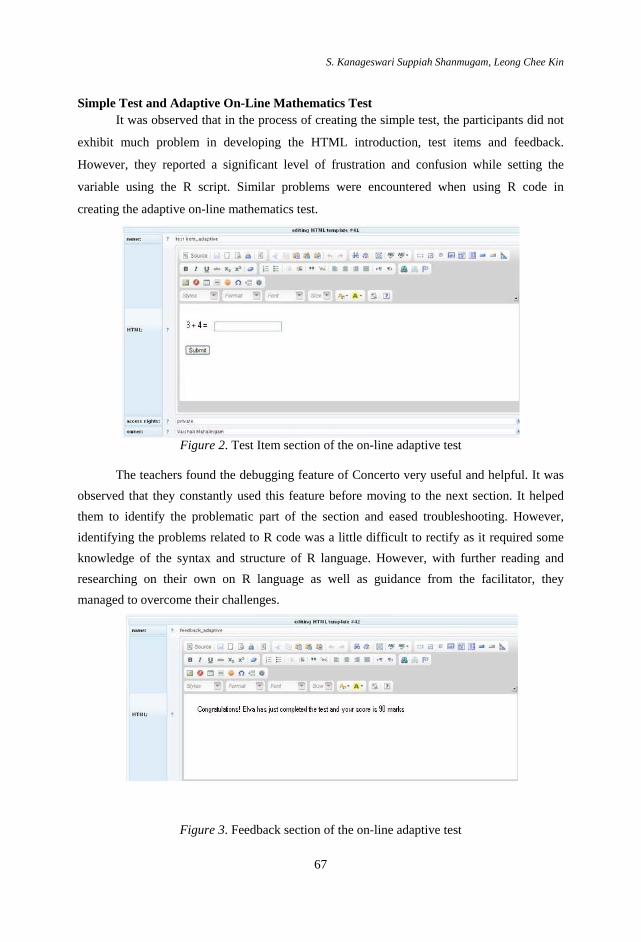
S. Kanageswari Suppiah Shanmugam, Leong Chee Kin
67
Simple Test and Adaptive On-Line Mathematics Test It was observed that in the process of creating the simple test, the participants did not
exhibit much problem in developing the HTML introduction, test items and feedback.
However, they reported a significant level of frustration and confusion while setting the
variable using the R script. Similar problems were encountered when using R code in
creating the adaptive on-line mathematics test.
Figure 2. Test Item section of the on-line adaptive test
The teachers found the debugging feature of Concerto very useful and helpful. It was
observed that they constantly used this feature before moving to the next section. It helped them to identify the problematic part of the section and eased troubleshooting. However, identifying the problems related to R code was a little difficult to rectify as it required some knowledge of the syntax and structure of R language. However, with further reading and researching on their own on R language as well as guidance from the facilitator, they managed to overcome their challenges.
Figure 3. Feedback section of the on-line adaptive test
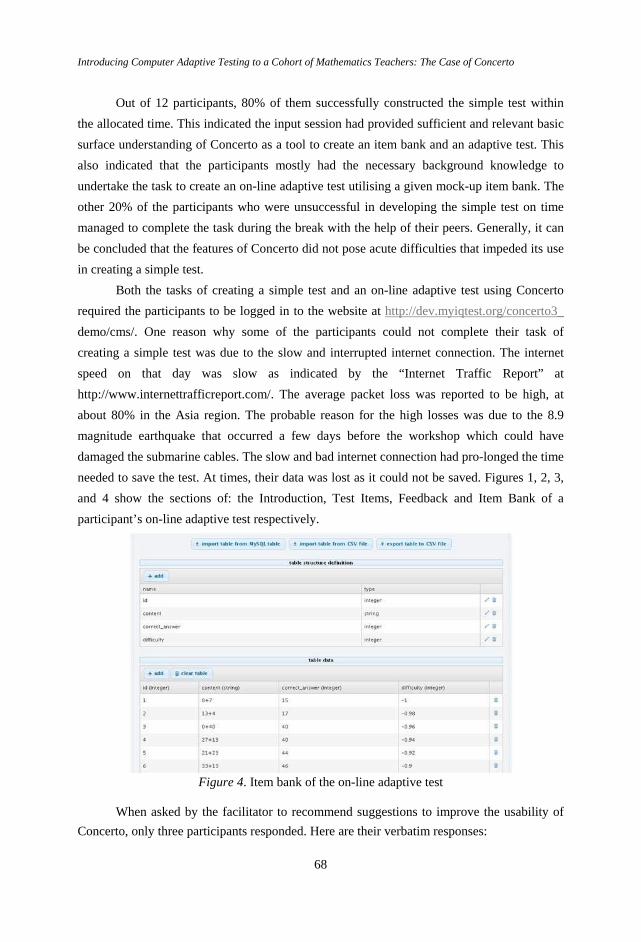
Introducing Computer Adaptive Testing to a Cohort of Mathematics Teachers: The Case of Concerto
68
Out of 12 participants, 80% of them successfully constructed the simple test within the allocated time. This indicated the input session had provided sufficient and relevant basic surface understanding of Concerto as a tool to create an item bank and an adaptive test. This also indicated that the participants mostly had the necessary background knowledge to undertake the task to create an on-line adaptive test utilising a given mock-up item bank. The other 20% of the participants who were unsuccessful in developing the simple test on time managed to complete the task during the break with the help of their peers. Generally, it can be concluded that the features of Concerto did not pose acute difficulties that impeded its use in creating a simple test.
Both the tasks of creating a simple test and an on-line adaptive test using Concerto required the participants to be logged in to the website at http://dev.myiqtest.org/concerto3_ demo/cms/. One reason why some of the participants could not complete their task of creating a simple test was due to the slow and interrupted internet connection. The internet speed on that day was slow as indicated by the “Internet Traffic Report” at http://www.internettrafficreport.com/. The average packet loss was reported to be high, at about 80% in the Asia region. The probable reason for the high losses was due to the 8.9 magnitude earthquake that occurred a few days before the workshop which could have damaged the submarine cables. The slow and bad internet connection had pro-longed the time needed to save the test. At times, their data was lost as it could not be saved. Figures 1, 2, 3, and 4 show the sections of: the Introduction, Test Items, Feedback and Item Bank of a participant’s on-line adaptive test respectively.
Figure 4. Item bank of the on-line adaptive test
When asked by the facilitator to recommend suggestions to improve the usability of
Concerto, only three participants responded. Here are their verbatim responses:
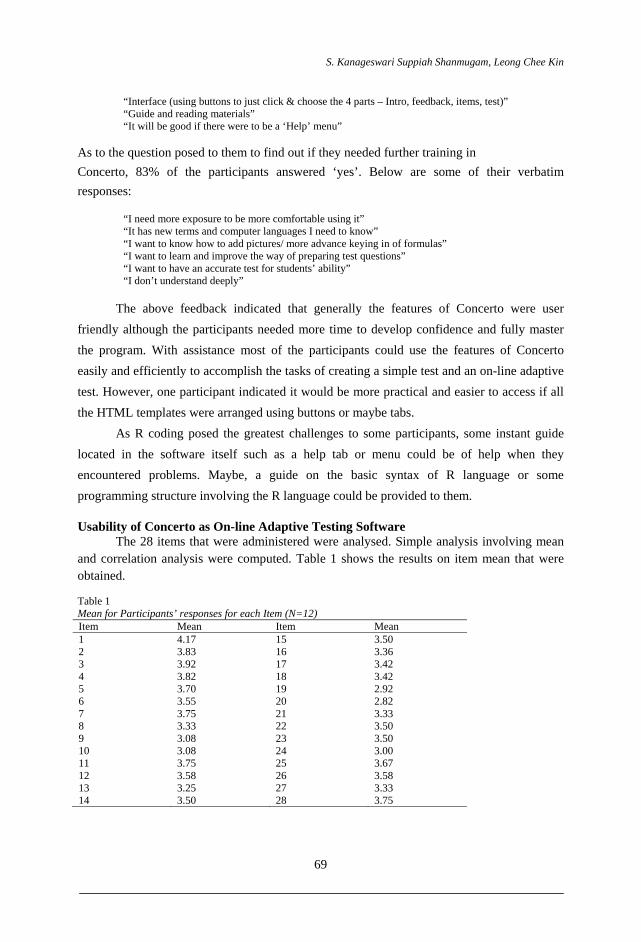
S. Kanageswari Suppiah Shanmugam, Leong Chee Kin
69
“Interface (using buttons to just click & choose the 4 parts – Intro, feedback, items, test)” “Guide and reading materials” “It will be good if there were to be a ‘Help’ menu”
As to the question posed to them to find out if they needed further training in Concerto, 83% of the participants answered ‘yes’. Below are some of their verbatim responses:
“I need more exposure to be more comfortable using it” “It has new terms and computer languages I need to know” “I want to know how to add pictures/ more advance keying in of formulas” “I want to learn and improve the way of preparing test questions” “I want to have an accurate test for students’ ability” “I don’t understand deeply”
The above feedback indicated that generally the features of Concerto were user friendly although the participants needed more time to develop confidence and fully master the program. With assistance most of the participants could use the features of Concerto easily and efficiently to accomplish the tasks of creating a simple test and an on-line adaptive test. However, one participant indicated it would be more practical and easier to access if all the HTML templates were arranged using buttons or maybe tabs.
As R coding posed the greatest challenges to some participants, some instant guide located in the software itself such as a help tab or menu could be of help when they encountered problems. Maybe, a guide on the basic syntax of R language or some programming structure involving the R language could be provided to them. Usability of Concerto as On-line Adaptive Testing Software
The 28 items that were administered were analysed. Simple analysis involving mean and correlation analysis were computed. Table 1 shows the results on item mean that were obtained.
Table 1 Mean for Participants’ responses for each Item (N=12) Item Mean Item Mean 1 4.17 15 3.50 2 3.83 16 3.36 3 3.92 17 3.42 4 3.82 18 3.42 5 3.70 19 2.92 6 3.55 20 2.82 7 3.75 21 3.33 8 3.33 22 3.50 9 3.08 23 3.50 10 3.08 24 3.00 11 3.75 25 3.67 12 3.58 26 3.58 13 3.25 27 3.33 14 3.50 28 3.75
Introducing Computer Adaptive Testing to a Cohort of Mathematics Teachers: The Case of Concerto
70
The results indicate Item 1 obtain the highest mean of 4.17 and Item 20 the lowest
mean. With reference to Item 1, more than 83% agreed that Concerto was effective in
assessing students. Item 20 refers to the item “It is easy to learn to use it”. The low rating was
most probably related to the problems they had encountered with the use of the R language
and the frustration caused by the disruption to the internet connection. For the category
“Usefulness” which consisted of Items 1 to Item 6, almost no participants selected
“disagree”. This indicated that almost all the participants were of the view that Concerto
could be a powerful tool in assessing the students. They reported Concerto as possibly an
effective method of assessing students, could also be more productive, take less time, allow
better control, and a useful mechanism in assessing students as it could possibly accurately
estimate students’ true ability.
For the category “Ease of Learning” which is a grouping of Item 18 to Item 21, the
mean range was from 2.82 to 3.42 which were among the items lowly rated by the
participants. This can be conjectured that the participants faced some challenges to fully
grasp the understanding of the introductory material well. As highlighted, the materials
should be revised to overcome the difficulties faced with respect to the R language and to
ensure that the internet connection is not disrupted and of high speed.
Correlation analyses conducted on the four categories, “Usefulness”, “Ease of Use”,
“Ease of Learning” and “Satisfaction” revealed that there were no significant correlation
among these categories. Correlation between “Ease of Use” and “Ease of Learning” is a low
Spearman correlation coefficient of 0.235. This is in contradiction with many studies.
According to Lund (2001), these two categories should be highly correlated. Obviously the
small sample could explain this result, where the participants had rated those items in “Ease
of Use” as favourable and items in “Ease of Learning” as unfavourable. Again, it is implied
that the problems related to the R language need to be addressed.
Overall, based on the ratings for the items in the “Ease of Use” category and
“Satisfaction” category, it can be conjectured that the workshop activities and materials were
appropriate for the participants although some changes are needed to overcome the
challenges they faced with the R language. They were satisfied with Concerto as an on-line
adaptive test platform even though this was the first time they had used it. Specifically, this
study indicated that the participants agreed that Concerto could:
1. Help them to be more effective in assessing their students;
2. Be more productive than paper-pencil test;
3. Give them more control in assessing their students;
S. Kanageswari Suppiah Shanmugam, Leong Chee Kin
71
4. Save time when assessing students;
5. Fulfill their expectations about the purpose of an assessment;
6. Give accurate details about their students’ ability;
7. Provide a correct way to assess students as it was based on students’ ability;
In addition, the participants also felt that they:
1. Preferred to use Concerto to conduct computer adaptive testing;
2. Could use it after the course;
3. Preferred to use it to design their test;
4. Were satisfied using it to design a simple test;
5. Were satisfied using it to design a computer adapted test.
Research Limitation
There were three main limitation of this study which involved the size of the sample
and prior knowledge of the participants, the length of the intervention, and the instrument
used.
Obviously the size of the sample prevents any conclusions being made that can be
generalised to a larger population. As mentioned, the participants who attended this workshop
even though had adequate computer literacy, they had no exposure to the IRT which provides
the foundation in understanding CAT and, no knowledge of the R script language which is
fundamental in designing the simple and adaptive tests. The participants had to learn to deal
with syntax of R language as they were creating the two tests, a task that they had
successfully accomplished with much feat.
There was also the limitation that a one day workshop is too short a time period for
the participants to master the programme. At best the participants developed a surface
understanding that would require further consolidation. The issue of retention of this
knowledge could become the focus for future research.
Another limitation was that the instrument that was used could not be validated due to
the small sample of 12 participants. Although Lund (2001) provided evidence about the
reliability of the instrument and posited that the items that contributed to each scale were of
approximately equally weighted and exhibited high Cronbach's Alpha (Lund, 2001), it cannot
be applied here due again to the size of the sample.
Introducing Computer Adaptive Testing to a Cohort of Mathematics Teachers: The Case of Concerto
72
Conclusion
CAT although relatively new in the field of assessment in the SEAMEO region, has
the potential to be a useful tool in testing students’ performance and could become one of the
basic testing procedures. There are numerous potentials and advantages with efficiency as the
most important (Georgiadou, Triantafillou, & Economides, 2006). While access to
technology is becoming increasingly widespread in schools and homes, nevertheless,
technology is still only marginally integrated into educational assessment at all levels (Erstad,
2008). According to Laborde (2001) and Lagrange, Artigue, Laborde, and Trouche (2003),
the successful integration of technology is a rather complex and tedious process. It is argued
that high quality in-service programmes for teachers are essential for successful technology
integration. This study presented the evaluation of an in-service programme using Concerto,
an open source, on-line adaptive testing platform software. While acknowledging the
limitations of a small sample, the results of this study identified difficulties and challenges
that the teachers faced while participating in a one-day introductory workshop for learning
the use of the new software to create an on-line adaptive test. These findings suggested how
this technology in-service programme for teachers could be improved. The study immediately
resulted in the development of an improved and enhanced design of several new handouts to
ease difficulties of novice users and, devised plans to extend the duration of future workshop
for effective and smooth transition of knowledge. In addition, the evaluation tools were
improved in our quest to strive for improving in-service programme of teachers as well as
developing appropriate materials.
References
Barker, P. (Ed.).(1974). Designing multi-media workstations. In P. Barker (Ed.), Multi-media
Computer Assisted Learning (pp.53-77). New York, NY: Nicholas Publisher. Erstad, O. (2008). Changing Assessment Practices and the Role of IT. International
Handbook of Information Technology in Primary and Secondary Education , 20( 2), 181-194.
Georgiadou, E., Triantafillou, E.,& Economides, A. (2006). Evaluation parameters for computer adaptive. British Journal of Educational Technology , 37(2), 261-278.
Hambleton, R. K., Swamination, H., & Rogers, H. J. (1991). Fundamentals of item response theory. California: Sage Publications Inc.
Laborde, C. (2001). Integration of technology in the design of geometry tasks with Cabri-Geometry. International Journal of Computers for Mathematical Learning, 6, 283-317.
Lagrange, J. B., Artigue, M., Laborde, C., & Trouche, L. (2003). Technology and mathematics education: a multidimensional study of the evolution of research and innovation. In A. J. Bishop, M. A. Clements, C. Keitel, J. Kilpatrick, &F. K. S. Leung
S. Kanageswari Suppiah Shanmugam, Leong Chee Kin
73
(Eds), Second International Handbook of Mathematics Education, (pp. 237-269). Dordrecht: Kluwer Academic Publishers
Lilley, M. & Barker, T. (2002). The development and evaluation of a computer-adaptive testing application for English language. In Proceedings of the 6th Computer-assisted Assessment Conference (pp. ). Loughborough University, UK.
Linacre, J.M. (2000). Computer-Adaptive Testing: A Methodology Whose Time Has Come. Retrieved from http://www.rasch.org/memo69.pdf
Lord, F. M. (1980). Applications of item response theory to practical testing problems. NJ: Lawrence Erlbaum Associates, Publishers.
Lund A. M. (2001). Measuring Usability with the USE Questionaire. Society for Technical Communication Newsletter, 8(2).
Partners in Learning (2012).History of CAT. Retrieved from http://performancepyramid.muohio.edu/pyramid/shared-best- practices/Technology/Computer-Adaptive-Testing/History-of-CAT.html
Root, R. W., & Draper, S. (1983). Questionnaires as a Software Evaluation Tool Interface Design 4 Analyses of User Inputs Proceedings of ACM CHI'83 Conference on Human Factors in Computing Systems . New York:ACM.
Rudner, L. (1998). An on-line, interactive, computer adaptive testing mini tutorial. ERIC Clearinghouse on Assessment and evaluation.
Russell, M. (2006). Technology and assessment: the tale of two interpretations. United Sates of America: Information Age Publishing Inc.
Wainer, H. (1990). Computerized adaptive testing. NJ: Lawrence Erlbaum Associates.

Southeast Asian Mathematics Education Journal 2012, Vol. 2 No. 2, 75 - 87
75
What Does Brain Research Say about Teaching and Learning Mathematics?
Allan Leslie White
University of Western Sydney, Australia. <[email protected]>
Brain research has shaken our ideas of the structure of the brain and how the brain works. Gone are the ancient ideas of comparing the brain to a machine. Neuroplasticity describes the remarkable ways in which the brain adapts and transforms itself as a result of a change in stimuli. Cognitive exercises have been designed and trialled that improve memory, problem solving abilities, and language skills in aged subjects and in children, as well as reversing the aging process by twenty to thirty years in some adults. Since the decline of behaviourism as a major theoretical influence upon mathematics education, there have been a number of learning theories emphasising thinking and the influences of the social and cultural contexts. Although, brain research is in its infancy, the question arises as to what does brain research add to mathematics teaching and learning in addressing student needs and developing their potential?
Keywords: Teaching and learning, neuroplasticity, behaviourism
Introduction
A long retired and respected Australian mathematics expert and teacher of mine when asked
the purpose of mathematics replied.
What is the purpose of Mathematics? To help one realise that a brain is a wonderful part of our body and the more we understand how to use it to refine and analyse our perceptions and develop our capabilities the more likely we are to lead a fuller and longer life.
His statement focuses on mathematics as a construction of the human mind which can
be used to develop thinking and to transform lives. Little did he know at the time that an
explosion of brain research was to come and change long held notions and accepted practices
involving the brain and learning. These notions involved:
Descartes’s idea of the brain as a complex machine culminated in our current idea of the brain as a computer and in localizationism. Like a machine, the brain came to be seen as made of parts, each one in a preassigned location, each performing a single function, so that if one of the parts was damaged, nothing could be done to replace it; after all, machines don’t grow new parts (Doidge, 2008, p. 13)
As a result of brain research, Descartes’s idea has been abandoned. No longer is the
brain seen as a fixed organ. It appears that the brain can reorganise itself. Neuroplasticity was
the term given to the remarkable ways in which the brain adapts and transforms itself as a
result of a change in stimuli. Brain researchers have shown that:
What Does Brain Research Say about Teaching and Learning Mathematics?
76
Children are not always stuck with mental abilities they are born with; that the damaged brain can often reorganise itself so that when one part fails, another can often substitute; … One of these scientists even showed that thinking, learning, and acting can turn our genes on and off, thus shaping our brain anatomy and our behaviour (Doidge, 2008, p. xv).
Amazingly, cognitive exercises have been designed and trialled that improve memory,
problem solving abilities, and language skills in aged subjects and in children, as well as
reversing the aging process by twenty to thirty years in some adults. These exercises have
also been used with autistic children with amazing effects on their language skills and their
autistic behavioural traits.
Arising out of this abundance of brain research is the question: How does this apply to
mathematics teaching and learning? The true efficacy of an education system is not
determined by performance on an international comparison examination but resides in how
well the system nurtures students in terms of their current needs and their potential. The
assumption being that if the system addresses thoroughly a student’s current needs and
develops a student’s potential then the results will be future positive individual and societal
life outcomes. It is beyond the scope of this paper to examine this assumption in any
comprehensive manner and the rest of this paper only briefly attempts to answer the question
of what brain research adds to mathematics teaching and learning in addressing student needs
and developing their potential.
Drill and Practice
From international studies and their corresponding ranking or league tables, interest
has focused upon high and low scoring countries and this interest has generated greater
knowledge of the classroom practice in participating countries.
International studies of mathematics achievement have profound influence on mathematics education worldwide in the past 15 years. Results of studies such as TIMSS and PISA have dominated the agenda of discussion in the mathematics education community as well as among policy makers. Much attention however has been paid on the ranking of countries in the league tables generated from such studies, often without due consideration of the nature of these studies, as well as the contextual factors that affect the performance of students from different countries (Leung, 2012, p. 34).
An observation arising from this focus is a characteristic of many mathematics
classrooms in SEAMEO (South East Asian Ministries of Education Organisation) countries is
the considerable time spent upon mathematics drill and practice. It has been stated that drill
and practice are the rice dishes of Asian mathematics classrooms. While this is an over
generalisation, the reasons for any concentration on drill and practice are complex as
education occurs in a social environment influenced by many cultural traditions that include
Allan Leslie White
77
the perceived values of individuals and society, the social structures such as the relationship
between parents and children, or between teachers and students.
Our contention is that cultural divisions are much more meaningful than political or geographic divisions in explaining differences of educational practices in mathematics (Leung, Graf, & Lopez-Real, 2006, p. 4).
While it is beyond the scope of this paper to do a comprehensive study of all these
influences, one that will be discussed briefly is the influence of the learning theories arising
from Western sources upon Asian mathematics classrooms.
Behaviourism
In the first edition of this journal the darkness of behaviourism (White, 2011) was
discussed in regards to mathematics teaching and learning. It was appropriate to focus upon
the negative influences because that paper concentrated only upon the negative lasting effects
of this tradition. Now in the light of brain research, are there positive aspects of behaviourism
that should be reconsidered and modified? Perhaps the reasons that many mathematics
teachers have resisted the introduction of newer theories of learning such as constructivism
and socio-cultural theories are due to their feeling that behaviourism held some truth or value.
So this section will briefly describe some features of behaviourism, how it is still the subject
of quite fierce debate in the mathematics education community, and what brain research
contributes to this debate.
Behaviourism is a philosophical tradition whose foundations were constructed with
the assistance of many laboratory based researchers such as Skinner's (1953) theory of using
cause and effect to manipulate behaviour by conditioning which emphasised reward and
punishments and gave rise to programmed learning and later mastery learning approaches.
The behaviourist teaching approach was based on a framework of behavioural
objectives and a hierarchy of levels of mastery. Criterion based pre and post tests often
consisting of multiple choice questions were given to students and if a desired level of
mastery was achieved then the student progressed to the next level. Failure meant another go
at the current level where drill and practice filled the majority of time. The pedagogy
involved the teachers demonstrating a skill and then students would then seek to copy and
master it. The progression through the levels consisted of a series of simple tasks where a
task was broken into small achievable steps. It was common to hear, when referring to this
strategy, the saying: A long journey can be achieved by taking small steps. However, the
What Does Brain Research Say about Teaching and Learning Mathematics?
78
dangers of using this approach in the mathematics classroom have been highlighted
elsewhere (Brousseau, 1984; Clements, 2004; White, 2011).
The common teacher classroom strategy that reduced a student’s role to answering a
series of relatively simple questions because the teacher emptied the task of much of its
cognitive challenge, was dangerous and destructive. Another consequence in the curriculum
was that the more cognitively challenging questions were removed and replaced by simpler
ones. When teachers adopted this style in an attempt to help students tackle higher-level
mathematics tasks, they denied their students the opportunity to formulate and apply
strategies of their own (Clements, 2004). To provide an example of this emptying process,
examine the following dialogue.
Teacher: Add one third and two fifths. Student: Cannot. Teacher: Ok multiply 3 and 5. Student: 15. Teacher: Good write that down at the bottom of a fraction, now what is 1 by 5? Student: 5. Teacher: Good write that on top of that fraction to make a third, now what is 3 by 2? Student: 6. Teacher: Good write that on top of that fraction to make two fifths, now add 5 and 6 Student: 11 Teacher: So write 11 over 15 Student: Ok. Teacher: Very good, do you understand? Student:Yes.
While the teacher’s intentions in the dialogue above are kind and helpful, good
intentions are not enough. The teacher makes an assumption that if the student answered each
step, then the student had learnt what had just been taught, and the student could construct the
whole from the parts and thus the student should be able to add two thirds and one half
following the same procedure. How deeply do you think this student understands? I predict
that the next day, if you asked this student a similar question, the student would struggle to
get the correct answer. It would depend upon the student’s memory of the procedure. Apart
from the use of memory, other aspects of thinking were not used.
Breaking a task down on the surface seems to resonate with our experience, but it all
depends on how this breaking is done. If I ask a student a question and they show they do not
understand, then, is it not usual to ask a simpler question? If I show a child a procedure and
they do not understand, do I not scaffold their thinking by asking further questions and
making the steps smaller and simpler? The answer is of course that behaviourism wasn’t
interested in thinking, but only on behaviour and behavioural outcomes. It is the later learning
Allan Leslie White
79
theories that shifted the focus to thinking and the influences of the social and cultural
contexts upon the learning of students.
There is a crucial distinction between a strategy that empties a mathematical problem
of challenge and a strategy that gradually increases the level of challenge presented to the
students by differentiating the curriculum and catering for individual needs. It is this second
strategy that current learning theories seek to address. Skemp (1976) would classify the
student’s understanding in the dialogue above as instrumental. The best we could say is that
the student has an understanding of a procedure. A deeper understanding of the concept will
require a different teaching strategy and learning experience.
This strategy of cognitive emptying has been shown by a large number of research
studies to have poor results and students’ were often unable to apply this learning to other
novel problems. Brain research helps answer why mathematics teachers are often frustrated
when students are able to use a procedure correctly one day but cannot remember how to do
the same thing on the next day, as though the brain treats it as new. The reasons are:
Students may diligently follow the teacher’s instructions to memorize facts or perform a sequence of tasks repeatedly, and may even get the correct answers. But if they have not found meaning by the end of the learning episode, there is little likelihood of long-term storage (Sousa, 2008, p. 56).
So in the dialogue presented earlier, unless the student has formed some meaning
from the teachers instructions, then the teachers instructions will not be remembered. The fact
that some teachers have to do so much reteaching and revision before the end of year
examination reflects upon their teaching and the lack of help to students in constructing
meaning rather than the usual blame being aimed at the intelligence of the student.
The Maths Wars
Now the reader might think that surely behaviourism has no influence in our current
enlightened times, but the reader would be wrong. It became obvious by the end of the 1970s
that the behaviourist teaching approaches were problematic and there was a need for change
(Clements, 2003, 2004).
Some of the heaviest criticisms of mathematics teaching and learning is the reliance on drill and practice as a pedagogy. Reform pedagogies have attempted to shift the ideology of drill and practice to one where the learner engages with deep learning so that there is a clear shift from procedural thinking/learning to conceptual thinking/learning (Jorgenson & Lowrie, 2012, p. 382).
What Does Brain Research Say about Teaching and Learning Mathematics?
80
In the 1980s there was a strong move by mathematics education researchers in
Western countries away from behaviourism although it still continues to exert influence. An
example can be seen in the current debate between researchers in the USA involving what
has become known as the ‘Math Wars’. These so called wars were triggered by the
publication in 1989 of the Curriculum and Evaluation Standards for School Mathematics by
the National Council of Teachers of Mathematics (NCTM, 1989) and developed into a debate
between two camps, the traditionalists and the reformist (Becker & Jacobs, 2000; Schoenfeld,
2004). One particularly extreme traditional group called themselves ‘Mathematically Correct’
and used aggressive tactics to voice their views. A fuller treatment of the history and context
of this debate is available elsewhere (see Schoenfeld, 2004). However the war is not over, as
recently, a respected international academic made a public statement alleging bullying and
improper conduct by two researchers from the traditionalist camp (Boaler, 2012). The
academic had completed a series of different studies thatasserted that students who engaged
actively in their mathematics learning and constructed meaning, rather than simply practicing
procedures, achieved at higher levels. Those from the traditionalist side opposed these
assertions and have conducted a campaign to discredit the researcher.
There are other battles rather than wars being fought elsewhere, for example, the
debate over the nature of the curriculum concerned with both the nature of disciplinary
knowledge and the nature of learning. One side wants more practical mathematics
(functionally relevant), while the other side wants pure theoretical mathematics
(mathematical rigour). Thus the first side wants to make the mathematics relevant to the
students and to involve real life problem solving often involving the use of mathematical
modelling. An example of the influence of this view is Singapore, where modelling and
applications are included as process components in the revised 2007 curriculum document
(MOE, 2007). This push for relevance has an assumption that being relevant assists students
to construct meaning. While the assumption of the pure side is that the mathematics comes
first and the applications will follow and they point to the computer and the use of fractals in
a multitude of applications as examples.
Another example of the struggle between competing ideas can be found in Indonesia,
where there have been efforts to place a stronger emphasis on connecting school mathematics
with real world contexts and applications in Indonesian primary schools through the
Pendidikan Realistik Matematik Indonesia (PMRI) movement (Sembiring, Hoogland, Dolk,
2010).Yet there is evidence of the other side fighting back, for example in the Netherlands
Allan Leslie White
81
there have been calls by various groups for more mathematical rigour and public criticism of
the successful and internationally recognised Realistic Mathematics Education approach (van
den Heuvel-Panhuizen, 2010).
While most teachers would see the need for both sides to be represented in the
classroom, both the practical and the theoretical, brain research points to aspects of teaching
and learning that are relevant to both.
Small Challenges Rather Than Simple Steps
Brain research can contributes to this debate and refers to the classical education of
the nineteenth and early twentieth century which developed the brain by learning other
languages that strengthened auditory memory, by concentrating on precise handwriting that
helped strengthen motor capacities and added speed and fluency to reading, and by placing an
emphasis on correct speech and pronunciation.
The irony of this new discovery is that for hundreds of years educators did seem to sense that children’s brains had to be built up through exercises of increasing difficulty that strengthened brain functions (Doidge, 2008, p. 41).
Brain research does not support a strategy that empties a mathematical problem of the
challenge but it does support a strategy that gradually increases the level of challenge
presented to the students to develop the capacities of the brain by differentiating the
curriculum and catering for individual needs. For brain research, practice does not make
perfect, practice makes permanent and memory fades quickly without meaning.
An example of a successful brain training program that gradually increases the level
of challenge is called Fast For Word. This program consists of seven brain exercises and has
had remarkable success with language-impaired and learning-impaired children including
autistic children. The program is a series of plasticity based techniques and has:
… helped hundreds of thousands. Fast For Word is disguised as a children’s game. What is amazing about it is how quickly the change occurs. In some cases people who have had a lifetime of cognitive difficulties get better after only thirty to sixth hours of treatment (Doidge, 2008, p. 47).
While cognitive challenge, the construction of meaning and thinking are needed as
well as drill and practice, brain research has also revealed some interesting things about the
quality of student engagement. This issue will be briefly examined in the next section.
What Does Brain Research Say about Teaching and Learning Mathematics?
82
Engagement, Intensity and Retention
Student classroom engagement has received considerable attention as it is argued that
decreased engagement can have a negative effect upon a student’s future (Sullivan, Mousley,
& Zevenbergen, 2005). One of my colleagues (Attard, 2010, 2011a, b, 2012) conducted a
longitudinal case study investigating the problem of lowered engagement with mathematics
from the Australian students’ perspectives of the factors that influenced their engagement
during the middle years of Australian schooling. The study spanned three school years (Years
5-7) and used a multi-dimensional view of engagement that combines the cognitive, operative
and affective facets (Fair Go Team NSW Department of Education and Training, 2006;
Munns & Martin, 2005), which leads to students valuing and enjoying school mathematics
and seeing connections between school mathematics and their own lives beyond the
classroom.
One finding that is worth repeating is in regard to ‘fun’ in mathematics lessons. The
data clearly revealed that aspects of lessons that made them fun were not always based on
games but involved their relevance to the students’ lives, an element of challenge built into
the tasks, and the ability for students to see the mathematics as useful within practical
situations. In other words, lessons that promoted affective, operative and cognitive
engagement with mathematics.
Apart from this need for challenge, brain researchers have found that the speed at
which we think is also plastic. It is possible to train the brain to fire brain neurons more
quickly in response to stimuli. The essence of the training lay in paying close attention or
intense concentration.
Merzenich discovered that paying close attention is essential to long-term plastic change. In numerous experiments he found that lasting changes occurred only when his monkeys paid close attention. When animals performed tasks automatically, without paying attention… the change did not last. We often praise “the ability to multitask.” While you can learn when you divide your attention, divided attention doesn’t lead to abiding change in your brain (Doidge, 2008, p. 68).
So it seems that the intensity of engagement is the key for stimulating the control
centre to produce acetylcholine (helps concentration) and dopamine (pleasure).
That’s why learning a new language in old age is so good for improving and maintaining the memory generally. Because it requires intense focus, studying a new language turns on the control system for plasticity and keeps it in good shape for laying down sharp memories of all kinds (Doidge, 2008, p. 87).
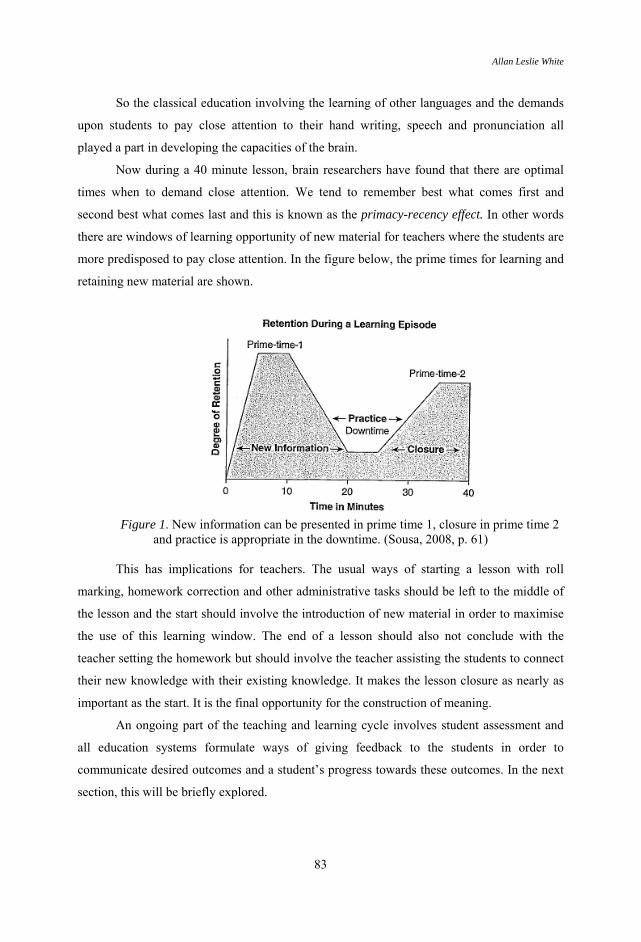
Allan Leslie White
83
So the classical education involving the learning of other languages and the demands
upon students to pay close attention to their hand writing, speech and pronunciation all
played a part in developing the capacities of the brain.
Now during a 40 minute lesson, brain researchers have found that there are optimal
times when to demand close attention. We tend to remember best what comes first and
second best what comes last and this is known as the primacy-recency effect. In other words
there are windows of learning opportunity of new material for teachers where the students are
more predisposed to pay close attention. In the figure below, the prime times for learning and
retaining new material are shown.
Figure 1. New information can be presented in prime time 1, closure in prime time 2
and practice is appropriate in the downtime. (Sousa, 2008, p. 61) This has implications for teachers. The usual ways of starting a lesson with roll
marking, homework correction and other administrative tasks should be left to the middle of
the lesson and the start should involve the introduction of new material in order to maximise
the use of this learning window. The end of a lesson should also not conclude with the
teacher setting the homework but should involve the teacher assisting the students to connect
their new knowledge with their existing knowledge. It makes the lesson closure as nearly as
important as the start. It is the final opportunity for the construction of meaning.
An ongoing part of the teaching and learning cycle involves student assessment and
all education systems formulate ways of giving feedback to the students in order to
communicate desired outcomes and a student’s progress towards these outcomes. In the next
section, this will be briefly explored.
What Does Brain Research Say about Teaching and Learning Mathematics?
84
Student Feedback
Technology and the use of digital games have been the focus of considerable current
research. Among other issues it has focussed on extending the thinking of students,
particularly in literacy and numeracy and upon using levels of challenge and rewards as a
means of providing individual feedback to the student. For example, Lowrie (2005) worked
with eight-year old students using the Pokemon environment and found that the children
worked well beyond the experiences being provided in the standard school curriculum in
terms of spatial representation and visualisation. This work highlighted the possibilities of the
digital games environment for enhancing mathematical learning and understandings that were
beyond the realms of standard pencil-and-paper representations.
Early behaviourism studies used stimulus response experiments and relied on rewards
and punishments to change behaviour. This was also adopted into behaviourist teaching
strategies and involved using differing feedback strategies to promote behaviour
modification. Usually the rewards were forgotten and the punishments involved detentions
and corporal punishment. The cane was a recurring nightmare for many a poor student. While
behaviourism was unable to satisfactorily explain why this was effective, brain research is
able to deepen our understanding of the processes involved.
The early example, the Fast for Word brain training program uses reward as a crucial
feature of the program because each time the child receives a reward the brain secretes
neurotransmitters such as dopamine and acetylcholine which helps consolidate the brain
changes the child has made. Dopamine reinforces the reward while acetylcholine helps
concentration and sharpens memory. The reward feeds into the student overcoming the
challenge of a particular level. Perhaps one of the many reasons for the popularity of
computer games revolves around the fact that the child competes against him or herself and
not against a classroom of peers. Certainly individual levels of challenge are better for
catering for individual differences.
Allan Leslie White
85
Conclusion
Brain research is still in its infancy regarding applications to education but what has
already arisen has added to our understanding of the teaching and learning of mathematics.
Mathematics is a rich and powerful context within which students’ brains can be challenged,
deeply engaged, and rewarded as they struggle to make meaning in their lives. The process of
meaning construction involves connected knowledge, and a student’s ability with
mathematics is plastic and not fixed, and depends upon the experiences and stimulus to the
brain. The principle of use it or lose it is a challenge to all mathematics teachers to provide
brain stimulation to their students, because:
… post-mortem examinations have shown that education increases the number of branches among neurons. An increased number of branches drives the neurons farther apart, leading us to an increase in the volume and thickness of the brain. The idea that the brain is like a muscle that grows with exercise is not just a metaphor (Doidge, 2008, p. 43).
As brain research continues to develop and more applications to education are
established, I look forward to walking into a mathematics classroom in the future and hearing
the students excitedly chant, “Give me more, my brain feels no pain, maths is good for me!”
What Does Brain Research Say about Teaching and Learning Mathematics?
86
References
Attard, C. (2010). Students' experiences of mathematics during the transition from primary to secondary school. Paper presented at the 33rd annual conference of the Mathematics Education Research Group of Australasia, Fremantle, Perth.
Attard, C. (2011a). Engagement with mathematics: The influence of teachers. Southeast Asian Mathematics Education Journal, 1(1), 31-39.
Attard, C. (2011b). “My favourite subject is maths. For some reason no-one really agrees with me”: Student perspectives of mathematics teaching and learning in the upper primary classroom. Mathematics Education Research Journal, 23(3), 363-377.
Attard, C. (2012). The influence of pedagogy on student engagement with mathematics during the middle years of schooling. In A. L. White & U. H. Cheah (Eds.), Transforming School Mathematics Education in the 21st Century (pp. 140-157). Penang: SEAMEO RECSAM
Becker, J. P., & Jacobs, B. (2000). The politics of California school mathematics. The anti-reform of 1997–99.Phi Delta Kappan, 81(7), 529–537.
Bloom, B. S., Englehart, M. D., Furst, E. J., Hill, W. H., & Krathwohl, D. R. (1956).Taxonomy of Educational Objectives: The Classification of Educational Goals. Handbook I: Cognitive Domain. New York: Longmans, Green & Co.
Boaler, J. (2012). When Academic Disagreement Becomes Harassment and Persecution. Retrieved 20 October 2012 from http://www.stanford.edu/~joboaler/
Brousseau, G. (1984). The crucial role of the didactical contract in the analysis and construction of situations in teaching and learning mathematics. In H. G. Steiner (Ed.), Theory of mathematics education (pp. 110−119). Bielefeld, Germany: Universität Bielefeld.
Clements, M. A. (2003). Professional practice in mathematics education: Introduction. In A. J. Bishop, M. A. Clements, C. Keitel, J. Kilpatrick, & F. Leung (Eds.), Second international handbook of mathematics education (pp. 637-641). Dordrecht, The Netherlands: Kluwer Academic Publishers.
Clements, M. A. (2004). Pre-service Teacher Education: Its time for a rethink. Keynote address delivered at the EduCATE 2004 Conference organized by the Faculty of Cognitive Sciences and Human Development (UNIMAS) in collaboration with the Bahagian Pendidikan Guru (Kementerian Pelajaran Malaysia). Kuching Sarawak Malaysia.
Doidge, N. (2008). The brain that changes itself: Stories of personal triumph from the frontiers of brain science (Revised Edition).Melbourne: Scribe Publications Pty Ltd.
Fair Go Team NSW Department of Education and Training. (2006). School is for me: pathways to student engagement. Sydney: NSW Department of Education and Training, Sydney, Australia.
Gagne, R. M. (1968). Contributions of learning to human development. Psychological Review, 75, 177-191.
Jorgenson, R., & Lowrie, T. (2012).Digital games for learning mathematics: possibilities and limitations. In J. Dindyal, L. P. Cheng & S. F. Ng (Eds.), Mathematics education: Expanding horizons, (Proceedings of the 35th annual conference of the Mathematics Education Research Group of Australasia, eBook, pp. 378-384). Singapore: MERGA Inc.
Allan Leslie White
87
Leung, F. K. S. (2012). What can and should we learn from international studies of mathematics achievement? In J. Dindyal, L. P. Cheng & S. F. Ng (Eds.), Mathematics education: Expanding horizons, (Proceedings of the 35th annual conference of the Mathematics Education Research Group of Australasia, eBook,, pp. 34-60). Singapore: MERGA Inc.
Leung, F. K. S., Graf, K-D., & Lopez-Real, F. J. (2006). Mathematics education in different cultural traditions: A comparative study of East Asia and the West - A discussion document. In F. K. S. Leung, K-D Graf, F. J. Lopez-Real (Eds.), Mathematics education in different traditions – A comparative study of East Asia and the West (pp. 1-20). New York, NY: Springer.
Lowrie, T. (2005). Problem solving in technology rich contexts: Mathematics sense making in out-of-school environments. Journal of Mathematical Behavior, 24, 275–286.
Ministry of Education (MOE) (2007). Ministry of Education Mathematics Syllabus – Primary, Singapore: Curriculum Planning and Developmental Division.
Munns, G., & Martin, A. J. (2005). It's all about MeE: A motivation and engagement framework. Paper presented at the Australian Association for Academic Research Focus Conference, Cairns. Retrieved 28 September 2012 from http://www.aare.edu.au/05pap/mun05400.pdf
National Council of Teachers of Mathematics (NCTM).(1989). Curriculum and evaluation standards for school mathematics. Reston, VA: Author
Schoenfeld, A. (2004).The Math Wars. Educational Policy, 18(1), 253-286. Sembiring, R. K., Hoogland, K., & Dolk, M. (2010). A decade of PMRI in Indonesia.
Utrecht: APS International. Skemp, R. R. (1976). Relational understanding and instrumental understanding. Mathematics
Teaching, 77, 20-26. Skinner, B. F. (1953). Science and human behavior. New York: Free Press. Sousa, D. A. (2008). How the brain learns mathematics. Thousand Oaks, CA: Corwin Press. Sullivan, P. (2011). Teaching mathematics : using research-informed strategies. Australian
Education Review; no. 59.Camberwell, VIC: ACER press. Sullivan, P., Mousley, J., & Zevenbergen, R. (2005). Increasing access to mathematical
thinking. The Australian Mathematical Society Gazette, 32(2), 105-109. van den Heuvel-Panhuizen, M. (2010). Reform under attack: Forty years of working on better
mathematics education thrown on the scrapheap? No way! In L. Sparrow, B. Kissane & C. Hurst (Eds.), Proceedings of MERGA 33 conference: Shaping the future of mathematics education (Vol. 1, pp. 1–25). Fremantle, Western Australia: MERGA.
White, A. L. (2011). School mathematics teachers are super heroes. South East Asia Mathematics Education Journal, 1(1), 3-17.

Southeast Asian Mathematics Education Journal 2012, Vol. 2 No. 2, 89 - 125
89
Exploring Student Perceptions on Teacher-Students Interaction and Classrooms Learning Environments in Indonesian Mathematics Classrooms
Ida Karnasih Universitas Negeri Medan, Indonesia
Wahyudi SEAMEO QITEP in Mathematics, Yogyakarta, Indonesia
Abstract Research studies in education that focus on classrooms and school-level learning environments have escalated and produced promising findings that lead to enhancement of the teaching and learning process. The present study reports on the research findings on associations between students’ perceptions of their teacher interaction, classroom learning environment and students’ outcomes. A sample of 946 students from 43 classes in Indonesia schools completed a survey including the Questionnaire on Teacher Interaction (QTI), What is Happening in This Class (WIHIC) and a scale relating to their attitude towards mathematics classes. Statistical analysis shows that the reliability and validity of the WIHIC and the QTI were confirmed. Cronbach alpha coefficients ranged from 0.66 to 0.85 and from 0.62 to 0.92 for the actual and preferred versions of the Indonesian version QTI, respectively. For the Indonesian version of WIHIC, Cronbach alpha coefficients of seven scales ranged from 0.80 to 0.91 for actual version, and from 0.78 to 0.92 preferred versions. The relationships of classroom environment and interpersonal teacher behaviour with students' attitudinal outcome were identified. Finally, suggestions on the use of the two instruments for teacher professional development were offered.
Keywords: Learning environment, Students-teacher interaction, Professional Development, Student Attitude
Most teachers have little control over school policy or curriculum or choice
of texts or special placement of students, but most have a great deal of
autonomy inside the classroom. ~Tracy Kidder
Introduction
Students and teachers spend a considerable amount of time in a formal school setting.
The teacher’s behaviour, when interacting with students, has been found to have a
considerable impact on the nature of learning environment that is created (Fraser, 1989). It is
believed that a positive teacher-student relationship stoutly contributes to student learning.
Educators, parents and students understand that problematic relationships can be detrimental
to student outcomes and development. Productive learning environments are characterised by
supportive and warm interactions throughout the class: teacher-student and student-student.
Similarly, teacher learning thrives when principals facilitate accommodating and safe school
Exploring Student Perceptions on Teacher-Students Interaction and Classrooms Learning Environments in Indonesian Mathematics Classrooms
90
cultures. Researchers confirmed that teacher-student interaction is a powerful force that can
play a major role in influencing cognitive and affective development of students (Getzel &
Thelen, 1960; Wubbles, Breklmans, & Hermans, 1987). Furthermore Wubbels and Levy
(1993) reaffirmed the role and significance of teacher behaviour in classroom environment
and in particular how this can influence students’ motivation leading to achievement.
Some reviews show that science and mathematics education researchers have led the
world in the field of classroom environment since early 1980s, and that this field has
contributed much to understanding and improving science and mathematics education (Fraser
1998; Fraser & Walberg, 1991). For example, classroom environment assessments provide a
means of monitoring, evaluating and improving science and mathematics teaching and
curriculum. It is highlighted that a key to improving student achievement and attitudes is to
create learning environments that emphasise those characteristics that have been found to be
linked empirically with student outcomes (Waldrip & Fisher, 2002).
International studies in the last four decades have firmly established classroom
environment research as a thriving field of study (Fraser, 1998). Past recent classroom
environment research has focused on cross-national studies of science classroom
environments (Fisher, Rickards, Goh, & Wong, 1997), constructivist classroom environments
(Taylor, Fraser, & Fisher, 1997), science laboratory classroom environments (McRobbie &
Fraser, 1993) and computer-assisted instruction classrooms (Fisher & Stolarchuk, 1997; Teh
& Fraser, 1995). Most of researchers reveal promising results of the important role of
classroom learning environment on students learning in science classroom. While the area of
classroom learning environment research has been internationally established, however, we
notice that only very few studies have been done in SEAMEO member countries. Therefore,
it is timely to initiate such a study on this area of research in the region.
Review of literatures
Research studies in education that focus on classrooms and school-level learning
environments have escalated and produced promising findings that lead to enhancement of
the teaching and learning process. A great deal of progress has involved conceptualisation,
assessment and use of learning environments (Fraser, 1989). This research area has captured
all school levels from primary to university, urban and rural, cross-national studies beyond
non-Western countries, actual and preferred forms, and comparisons between teachers’ and
students’ perceptions of their classroom learning environments, and has employed a number
Ida Karnasih & Wahyudi
91
of salient and robust instruments that have been validated and revalidated (Fraser, 1998).
Furthermore, this research area has also attracted researchers to conduct their research in non-
Western countries, for example, Malaysia, Brunei, Korea, Taiwan, Nigeria, Japan and Papua
New Guinea. Thus, there has been an acceptance of the learning environment as a significant
variable in predicting the success of educational practice. It seems that the evaluation of the
learning environment is as important as evaluating other student performances and outcomes.
Reviews of learning environment studies have been provided conveniently and
comprehensively, for example, in Fraser’s (Fraser, 1994, 1998) studies. Those reviews dissect
the development of learning environment research from the beginning to the recent trend of
learning environment research. The following paragraphs provide review on the development
and use of two instruments employed in this study, namely, What is Happening in this Class
(WIHIC) questionnaire and the Questionnaire on Teacher Interaction (QTI).
Overview of and Development and Validation of Questionnaire on Teacher Interaction
(QTI)
By adapting Watzlawick, Beavin, and Jackson’s (1967) theory on communication
processes, Wubbels, Creton, and Holvast (1988) investigated teacher behaviour in classrooms
from a systems perspective in The Netherlands. According to the systems perspective on
communication, it is assumed that participants’ behaviours influence each other mutually. In
classroom, the behaviour of the teacher is influenced by the behaviour of the students and in
turn influences student behaviour. Circular communication processes build up which not only
consist of behaviour, but also determine behavior as well.
Previously, Wubbels, Creton, and Hooymayers (1985) developed a model to map
interpersonal teacher behaviour extrapolated from the work of Leary (1957). This model has
been used in The Netherlands in the development of an instrument, the Questionnaire on
Teacher Interaction (QTI), to gather students' and teachers' perceptions of interpersonal
teacher behaviour (Wubbels, Brekelmans, & Hooymayers, 1991; Wubbels & Levy, 1993).
This model maps interpersonal behaviour with the aid of an influence dimension
(Dominance, D - Submission, S) and a proximity dimension (Cooperation, C - Opposition,
O). In their application of the model to the classroom situation, Wubbels, Creton, and
Hooymayers (1985) further divided each quadrant of the original model into two sectors-
giving eight sectors in all, each describing different aspects of interpersonal behaviour.
The sectors are labelled DC, CD and so on according to their position in the
coordinate system, the letters coding the relative influence of the axes. For example, sectors
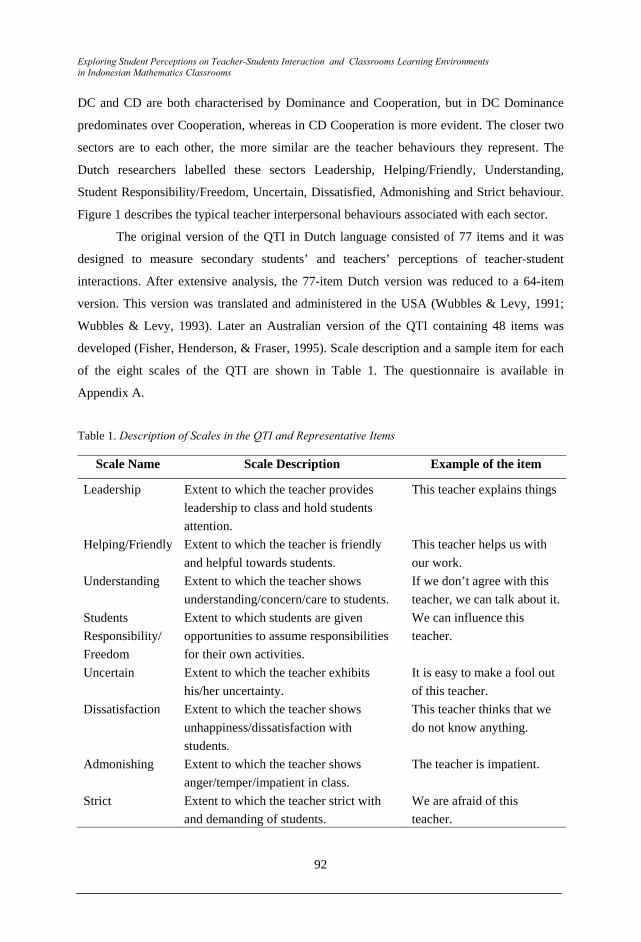
Exploring Student Perceptions on Teacher-Students Interaction and Classrooms Learning Environments in Indonesian Mathematics Classrooms
92
DC and CD are both characterised by Dominance and Cooperation, but in DC Dominance
predominates over Cooperation, whereas in CD Cooperation is more evident. The closer two
sectors are to each other, the more similar are the teacher behaviours they represent. The
Dutch researchers labelled these sectors Leadership, Helping/Friendly, Understanding,
Student Responsibility/Freedom, Uncertain, Dissatisfied, Admonishing and Strict behaviour.
Figure 1 describes the typical teacher interpersonal behaviours associated with each sector.
The original version of the QTI in Dutch language consisted of 77 items and it was
designed to measure secondary students’ and teachers’ perceptions of teacher-student
interactions. After extensive analysis, the 77-item Dutch version was reduced to a 64-item
version. This version was translated and administered in the USA (Wubbles & Levy, 1991;
Wubbles & Levy, 1993). Later an Australian version of the QTI containing 48 items was
developed (Fisher, Henderson, & Fraser, 1995). Scale description and a sample item for each
of the eight scales of the QTI are shown in Table 1. The questionnaire is available in
Appendix A.
Table 1. Description of Scales in the QTI and Representative Items
Scale Name Scale Description Example of the item
Leadership Extent to which the teacher provides leadership to class and hold students attention.
This teacher explains things
Helping/Friendly Extent to which the teacher is friendly and helpful towards students.
This teacher helps us with our work.
Understanding Extent to which the teacher shows understanding/concern/care to students.
If we don’t agree with this teacher, we can talk about it.
Students Responsibility/ Freedom
Extent to which students are given opportunities to assume responsibilities for their own activities.
We can influence this teacher.
Uncertain Extent to which the teacher exhibits his/her uncertainty.
It is easy to make a fool out of this teacher.
Dissatisfaction Extent to which the teacher shows unhappiness/dissatisfaction with students.
This teacher thinks that we do not know anything.
Admonishing Extent to which the teacher shows anger/temper/impatient in class.
The teacher is impatient.
Strict Extent to which the teacher strict with and demanding of students.
We are afraid of this teacher.
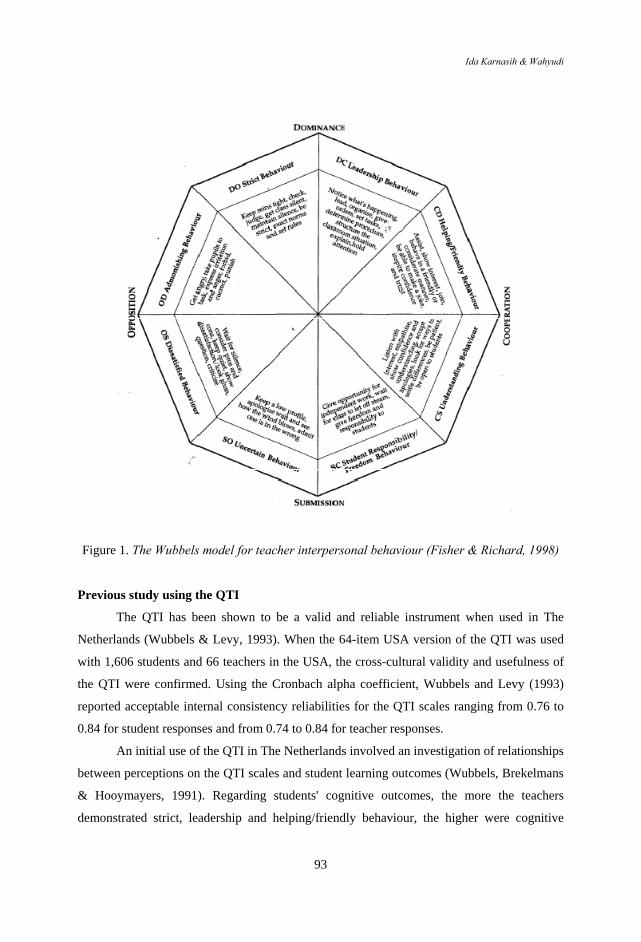
Ida Karnasih & Wahyudi
93
Figure 1. The Wubbels model for teacher interpersonal behaviour (Fisher & Richard, 1998)
Previous study using the QTI
The QTI has been shown to be a valid and reliable instrument when used in The
Netherlands (Wubbels & Levy, 1993). When the 64-item USA version of the QTI was used
with 1,606 students and 66 teachers in the USA, the cross-cultural validity and usefulness of
the QTI were confirmed. Using the Cronbach alpha coefficient, Wubbels and Levy (1993)
reported acceptable internal consistency reliabilities for the QTI scales ranging from 0.76 to
0.84 for student responses and from 0.74 to 0.84 for teacher responses.
An initial use of the QTI in The Netherlands involved an investigation of relationships
between perceptions on the QTI scales and student learning outcomes (Wubbels, Brekelmans
& Hooymayers, 1991). Regarding students' cognitive outcomes, the more the teachers
demonstrated strict, leadership and helping/friendly behaviour, the higher were cognitive
Exploring Student Perceptions on Teacher-Students Interaction and Classrooms Learning Environments in Indonesian Mathematics Classrooms
94
outcomes scores. Conversely, student responsibility and freedom, uncertain and dissatisfied
behaviours were related negatively to achievement. Wubbels and Brekelmans (1998) stated
that student outcomes are related to student perceptions of teacher behaviours with affective
outcomes displaying a greater association than cognitive outcomes. In fact, studies into
student teacher interactions suggest that teachers 'using open teaching styles are able to
control student input and procedures in class in order to avoid disorder (Wubbels &
Brekelmans 1998). Wubbels and Levy (1993) claimed that student perceptions of
interpersonal teacher behaviour appear to account for 70 percent of the variability in student
achievement and 55 percent for attitude outcomes.
Levy, Creton, and Wubbels (1993) analysed data from studies in The Netherlands, the
USA and Australia involving students being asked to use the QTI to rate their best and worst
teachers. Students rated their best teachers as being strong leaders and as friendly and
understanding. The characteristics of the worst teachers were that they were more
admonishing and dissatisfied.
The Australian version of the QTI containing 48 items was used in a pilot study
involving upper secondary science classes in Western Australia and Tasmania (Fisher, Fraser,
& Wubbels, 1993; Fisher, Fraser, Wubbels, & Brekelmans, 1993; Fisher, Fraser, &
Henderson, 1995). This pilot study strongly supported the validity and potential usefulness of
the QTI within the Australian context, and suggested the desirability of conducting further
and more comprehensive research involving the QTI.
Wubbels (1993) used the QTI with a sample of 792 students and 46 teachers in
Western Australia and Tasmania. The results of this study were similar to previous Dutch and
American research in that, generally, teachers did not reach their ideal and differed from the
best teachers as perceived by students. It is noteworthy that the best teachers, according to
students, are stronger leaders, more friendly and understanding, and less uncertain,
dissatisfied and admonishing than teachers on average. When teachers described their
perceptions of their own behaviours, they tended to see it a little more favourably than did
their students. On average, the teachers' perceptions were between the students' perceptions
of actual behaviour and the teachers' ideal behaviour. An interpretation of this is that teachers
think that they behave closer to their ideal than their students think that they do.
Fisher, Rickards, and Fraser (1996) found that after having completed the QTI and
having had time to consider the results supplied to them, science teachers reported that they
had been stimulated to reflect on their own teaching and verbal communication in the
classroom. For example, one teacher concluded that she had become more aware of her
Ida Karnasih & Wahyudi
95
students' need for clear communication and that this had become a focus for her in improving
her classroom teaching (Fisher, Rickards, & Fraser, 1996).
Fisher and Rickards (1998) analysed a large database of 2,960 student responses to
the QTI and found associations between students’ perceptions of teacher-student interactions
and students’ attitudinal and cognitive achievement outcomes. Seven out of eight scales of
the QTI were significantly correlated to attitudes to the class and achievement scores when
using simple and multiple correlation. It was found that the scales Leadership, Helping/
Friendly, and Understanding were positively and significantly correlated with the attitude to
class and the achievement scores. The other QTI scales Uncertain, Dissatisfied, Admonishing
and Strict were negatively correlated to the attitude to class and the achievement scores. For
cultural differences it was reported that students from Asian background perceived their
teachers significantly more positively than did those from the other cultural groups used in
the analysis.
Fisher et al. (1997) carried out a similar study involving 720 students in Singapore
and 705 students in Australia. In this study the results were the same except that Student
Responsibility/ Freedom was also positively associated with students’ attitudes towards their
science classes in both countries.
The QTI has been used in The Netherlands, USA, Australia, Singapore and a few
other Asian countries and has been cross-validated in different contexts and cultures (Fisher
& Rickards, 1998; Fisher et al., 1997; Kim, Fisher, & Fraser, 2000; Wubbles & Levy, 1993)
All the studies confirm that data obtained from the questionnaire provide valid, reliable and
useful information for the teacher regarding their learning environment in general and more
specifically about their teacher-student interactions.
Khine and Fisher (2001) administered the QTI to 1,188 students from 54 science
classes in Brunei. This study provided further validation data on QTI and indicated that this
tool is a valid and reliable instrument to be used in this context. This study showed that
students enjoyed the science lessons more when their teachers displayed greater leadership,
understanding and are helping and friendly. On the other hand, teachers’ uncertain,
admonishing and dissatisfied behaviours were negatively associated with the enjoyment of
science lessons.
Waldrip and Fisher (2002) employed the QTI to investigate the behavior of good or
exemplary teachers. They found that the better or exemplary teachers could be identified as
those whose students' perceptions were more than one standard deviation above the mean on
Exploring Student Perceptions on Teacher-Students Interaction and Classrooms Learning Environments in Indonesian Mathematics Classrooms
96
the scales of Leadership, Helping/Friendly, and Understanding and more than one standard
deviation below the mean on the Uncertainty, Dissatisfied and Admonishing scales.
Santiboon (2007) have conducted study in Thailand with a sample of 4,576 students
in 245 physics classes at the grade 12 level. The study documented that the associations
between students' perceptions of their learning environments and teachers' interpersonal
behaviour with their attitudes to their physics classes. This study asserted that in Thailand
school context students have a more favourable attitude towards their physics classes if their
teachers display good leadership, helping/friendly, understanding, and students
responsibility/freedom behaviours and less uncertain, admonishing, dissatisfied and strict
behaviours.
Overview of and Development and Validation of the Questionnaire ‘What Is Happening
In This Class?’ (WIHIC)
The What is Happening In This Class? (WIHIC) questionnaire brings parsimony to
the field of learning environment by combining modified versions of the most salient scales
from a wide range of existing questionnaires with additional scales that accommodate
contemporary educational concerns e.g., equity and cooperation (Fraser, 1998). Based on the
previous studies, Fraser, Fisher, and McRobbie (1996) developed this new learning
environment instrument. The WIHIC consists of 7 scales and 56 items. The seven scales are
Student Cohesiveness, Teacher Support, Involvement, Investigation, Task Orientation,
Cooperation and Equity. Table 2 shows the scales in the WIHIC, along with a brief
description and a sample item from each scale in the questionnaire. The WIHIC
Questionnaire is provided in Appendix B.
Table 2. Descriptions of Scales in WIHIC and Representative Items
Scale Name Scale Description Example of the item
Student
Cohesiveness
Extent to which students know, help,
and are supportive of one another
I help other class members
who are having trouble
with their work.
Teacher Support Extent to which the teacher helps,
befriend, trust, and shows interest in
students
The teacher considers my
feelings
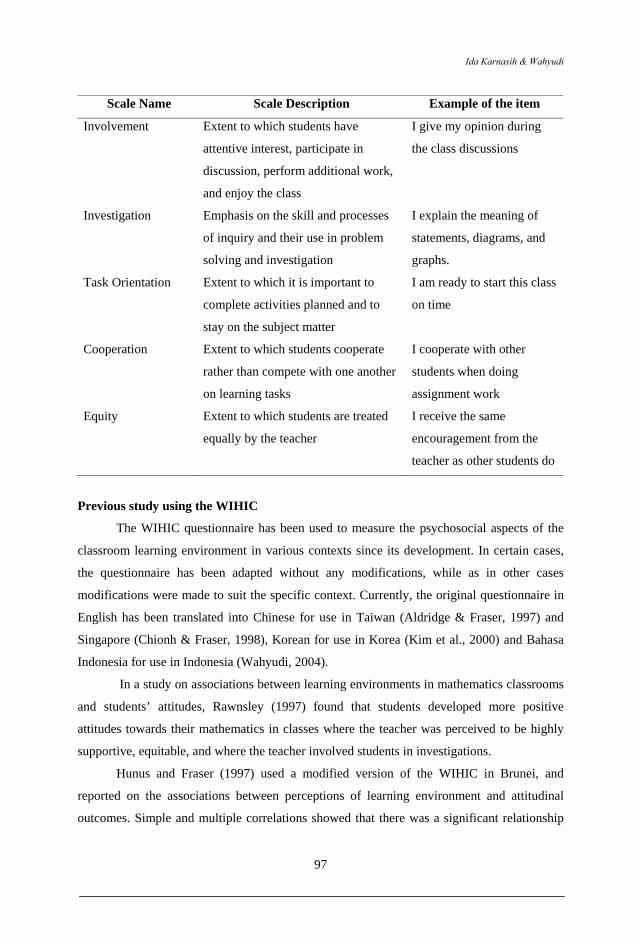
Ida Karnasih & Wahyudi
97
Scale Name Scale Description Example of the item
Involvement Extent to which students have
attentive interest, participate in
discussion, perform additional work,
and enjoy the class
I give my opinion during
the class discussions
Investigation Emphasis on the skill and processes
of inquiry and their use in problem
solving and investigation
I explain the meaning of
statements, diagrams, and
graphs.
Task Orientation Extent to which it is important to
complete activities planned and to
stay on the subject matter
I am ready to start this class
on time
Cooperation Extent to which students cooperate
rather than compete with one another
on learning tasks
I cooperate with other
students when doing
assignment work
Equity Extent to which students are treated
equally by the teacher
I receive the same
encouragement from the
teacher as other students do
Previous study using the WIHIC
The WIHIC questionnaire has been used to measure the psychosocial aspects of the
classroom learning environment in various contexts since its development. In certain cases,
the questionnaire has been adapted without any modifications, while as in other cases
modifications were made to suit the specific context. Currently, the original questionnaire in
English has been translated into Chinese for use in Taiwan (Aldridge & Fraser, 1997) and
Singapore (Chionh & Fraser, 1998), Korean for use in Korea (Kim et al., 2000) and Bahasa
Indonesia for use in Indonesia (Wahyudi, 2004).
In a study on associations between learning environments in mathematics classrooms
and students’ attitudes, Rawnsley (1997) found that students developed more positive
attitudes towards their mathematics in classes where the teacher was perceived to be highly
supportive, equitable, and where the teacher involved students in investigations.
Hunus and Fraser (1997) used a modified version of the WIHIC in Brunei, and
reported on the associations between perceptions of learning environment and attitudinal
outcomes. Simple and multiple correlations showed that there was a significant relationship
Exploring Student Perceptions on Teacher-Students Interaction and Classrooms Learning Environments in Indonesian Mathematics Classrooms
98
between the set of environment scales and students’ attitudes towards chemistry theory
classes. The Student Cohesiveness, Teacher Support, Involvement, and Task Orientation
scales were positively associated with the students’ attitudes.
Khoo and Fraser (1998) used a modified version of the WIHIC to measure classroom
environment when evaluating adult computer courses. The Cooperation scale was dropped in
this modified version and Student Cohesiveness and Teacher Support were collapsed into one
scale named Trainer Support. A set of 38 items was retained after factor analyses. This study
indicated that the males perceived greater Involvement, while females perceived more
Equity. The other striking result of the study was that older females had a more positive
perception of Trainer Support than the younger ones.
Fraser and Aldridge (1998) used English and Chinese versions of the WIHIC in
Australia and Taiwan, respectively, to explore the potential of cross-cultural studies. Results
of the study indicated that students in Australia consistently perceived their classroom
environment more positively than students in Taiwan. Significant differences were detected
on the WIHIC scales of Involvement, Investigation, Task Orientation, Cooperation and
Equity. This indicated that students in Australia perceived they are given more opportunity to
get involved in the experiments and investigate scientific phenomena. In this study, cultural
differences were highlighted. Education in Taiwan is examination based and teaching styles
are adopted to suit the particular situation. In Taiwan, having good content knowledge of the
subject was the yardstick for being a good teacher, while as in Australia having good
interpersonal relationships between students and teachers is considered the most important
factor in education process. Taiwan classrooms are teacher centred giving very little
opportunity to students to discuss issues.
Khine and Fisher (2001) used the WIHIC in Brunei to study the classroom
environment and teachers’ cultural background in an Asian context. The study found that
teachers from different cultural backgrounds created different types of learning environments.
It also indicated that the WIHIC is a useful instrument with which to measure the cultural
background differences and can be used as a basis for identification and development of
desirable teacher behaviours that will lead to a favourable learning environment.
Wahyudi (2004) study in Indonesian lower secondary school using the Indonesian
version of WIHIC also documented the association between students’ perception on their
classroom learning environment and their attitudinal and cognitive outcome. Students’
enjoyment during science lessons and their attitude toward inquiry in science was greater in
Ida Karnasih & Wahyudi
99
classrooms that have less cooperation and less student cohesiveness. Students’ achievement
in school science was negatively influenced by investigation activities during science lessons.
Methodology
The goals of this study were to provide further cross cultural validation information
for the QTI and WIHIC questionnaires when used with a large Indonesian sample; to
investigate differences in students' actual and ideal or preferred perceptions of their teacher
interpersonal behavior and their classroom learning environment; and to investigate the
associations between students’ perceptions of teacher interaction and their learning
environment with their attitudes toward mathematics.
In more detail, the aims are formulated in the following three research questions:
1. Are the questionnaires used in this study valid and reliable?
2. What are students’ perception towards their teacher interpersonal behavior and
their classroom learning environment?
3. Are there any associations between teacher interpersonal behavior and classroom
learning environment with students’ attitude toward mathematics classes?
In so doing, the instruments namely, the Indonesian version of Questionnaire on
Teacher Interaction (QTI) and the What is Happening in this Class (WIHIC) questionnaire
were developed (See Appendix C and D, respectively). As sugested by Brislin (1970),
translataions of the questionnaires into Bahasa Indonesia and then back transalation of both
questionnaires into English were carried out. This procedure was done to ensure that the
instruments used in the study still carry the original meaning.
The sample was composed of 43 mathematics classes at the lower secondary levels in
Indonesia. The total sample involved 946 students spread approximately equally between
grades 7, 8, and 9 in 26 different schools. Each student in the sample responded to both actual
and preferred versions of the QTI and the WIHIC. Attitude to class was assessed using a
seven-item scale based on the Test of Mathematics Related Attitudes (TOMRA) (Fraser,
1981; Fisher, Henderson & Fraser, 1995), namely Enjoyment toward Mathematics as school
subject.
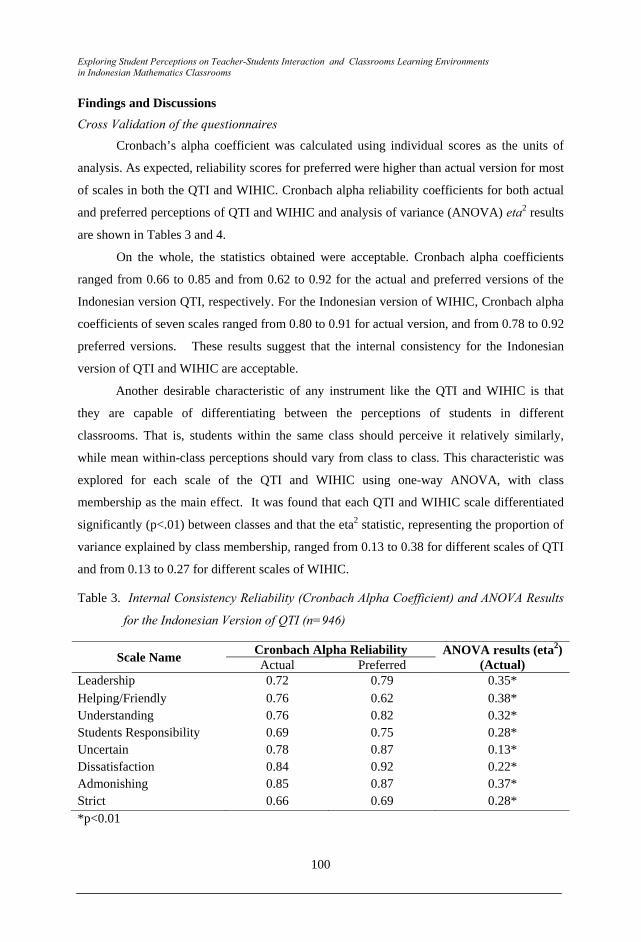
Exploring Student Perceptions on Teacher-Students Interaction and Classrooms Learning Environments in Indonesian Mathematics Classrooms
100
Findings and Discussions Cross Validation of the questionnaires
Cronbach’s alpha coefficient was calculated using individual scores as the units of
analysis. As expected, reliability scores for preferred were higher than actual version for most
of scales in both the QTI and WIHIC. Cronbach alpha reliability coefficients for both actual
and preferred perceptions of QTI and WIHIC and analysis of variance (ANOVA) eta2 results
are shown in Tables 3 and 4.
On the whole, the statistics obtained were acceptable. Cronbach alpha coefficients
ranged from 0.66 to 0.85 and from 0.62 to 0.92 for the actual and preferred versions of the
Indonesian version QTI, respectively. For the Indonesian version of WIHIC, Cronbach alpha
coefficients of seven scales ranged from 0.80 to 0.91 for actual version, and from 0.78 to 0.92
preferred versions. These results suggest that the internal consistency for the Indonesian
version of QTI and WIHIC are acceptable.
Another desirable characteristic of any instrument like the QTI and WIHIC is that
they are capable of differentiating between the perceptions of students in different
classrooms. That is, students within the same class should perceive it relatively similarly,
while mean within-class perceptions should vary from class to class. This characteristic was
explored for each scale of the QTI and WIHIC using one-way ANOVA, with class
membership as the main effect. It was found that each QTI and WIHIC scale differentiated
significantly (p<.01) between classes and that the eta2 statistic, representing the proportion of
variance explained by class membership, ranged from 0.13 to 0.38 for different scales of QTI
and from 0.13 to 0.27 for different scales of WIHIC.
Table 3. Internal Consistency Reliability (Cronbach Alpha Coefficient) and ANOVA Results
for the Indonesian Version of QTI (n=946)
Scale Name Cronbach Alpha Reliability ANOVA results (eta2) (Actual) Actual Preferred
Leadership 0.72 0.79 0.35* Helping/Friendly 0.76 0.62 0.38* Understanding 0.76 0.82 0.32* Students Responsibility 0.69 0.75 0.28* Uncertain 0.78 0.87 0.13* Dissatisfaction 0.84 0.92 0.22* Admonishing 0.85 0.87 0.37* Strict 0.66 0.69 0.28* *p<0.01
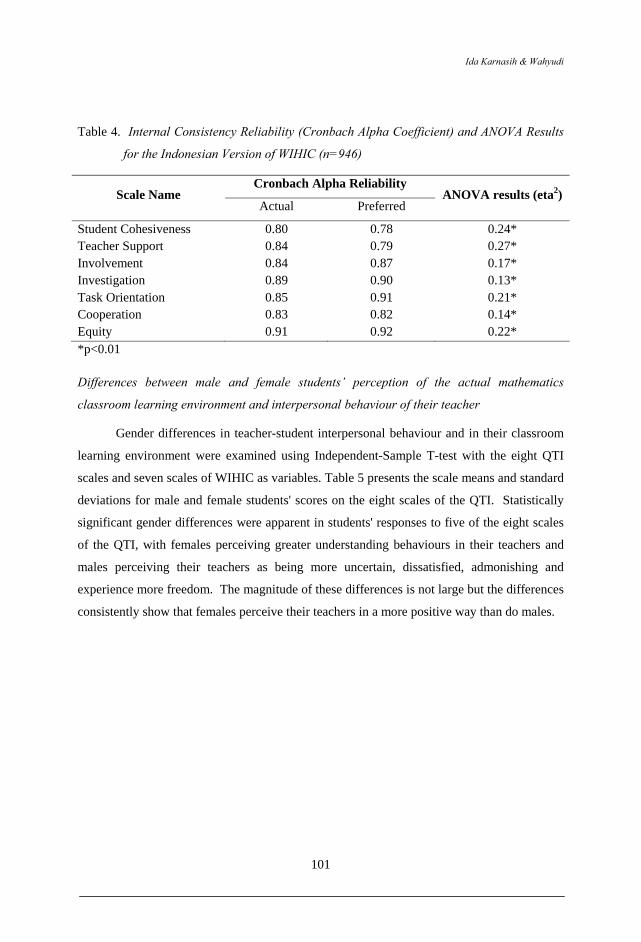
Ida Karnasih & Wahyudi
101
Table 4. Internal Consistency Reliability (Cronbach Alpha Coefficient) and ANOVA Results
for the Indonesian Version of WIHIC (n=946)
Scale Name Cronbach Alpha Reliability
ANOVA results (eta2) Actual Preferred
Student Cohesiveness 0.80 0.78 0.24* Teacher Support 0.84 0.79 0.27* Involvement 0.84 0.87 0.17* Investigation 0.89 0.90 0.13* Task Orientation 0.85 0.91 0.21* Cooperation 0.83 0.82 0.14* Equity 0.91 0.92 0.22* *p<0.01
Differences between male and female students’ perception of the actual mathematics
classroom learning environment and interpersonal behaviour of their teacher
Gender differences in teacher-student interpersonal behaviour and in their classroom
learning environment were examined using Independent-Sample T-test with the eight QTI
scales and seven scales of WIHIC as variables. Table 5 presents the scale means and standard
deviations for male and female students' scores on the eight scales of the QTI. Statistically
significant gender differences were apparent in students' responses to five of the eight scales
of the QTI, with females perceiving greater understanding behaviours in their teachers and
males perceiving their teachers as being more uncertain, dissatisfied, admonishing and
experience more freedom. The magnitude of these differences is not large but the differences
consistently show that females perceive their teachers in a more positive way than do males.
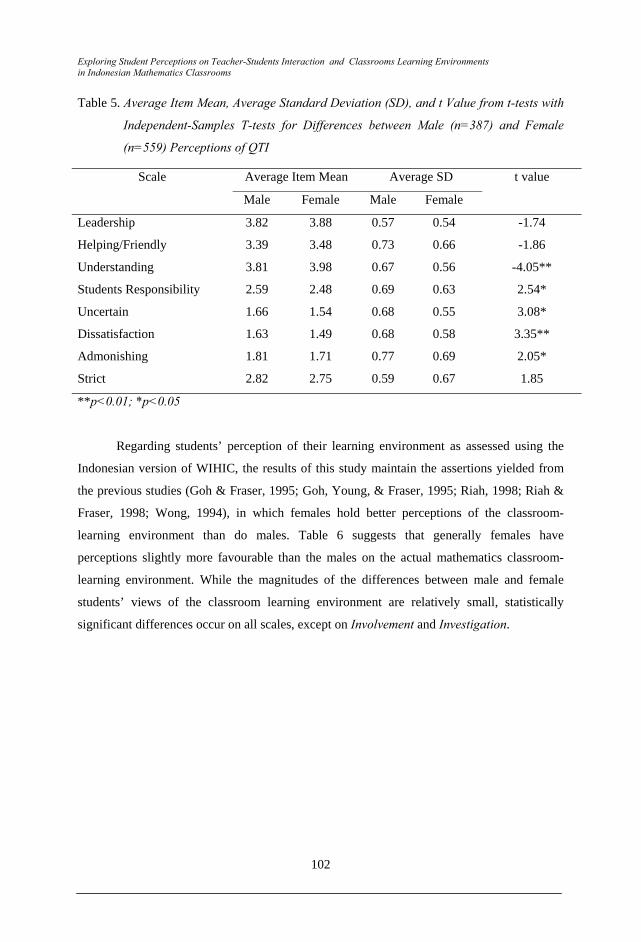
Exploring Student Perceptions on Teacher-Students Interaction and Classrooms Learning Environments in Indonesian Mathematics Classrooms
102
Table 5. Average Item Mean, Average Standard Deviation (SD), and t Value from t-tests with
Independent-Samples T-tests for Differences between Male (n=387) and Female
(n=559) Perceptions of QTI
Scale Average Item Mean Average SD t value
Male Female Male Female
Leadership 3.82 3.88 0.57 0.54 -1.74
Helping/Friendly 3.39 3.48 0.73 0.66 -1.86
Understanding 3.81 3.98 0.67 0.56 -4.05**
Students Responsibility 2.59 2.48 0.69 0.63 2.54*
Uncertain 1.66 1.54 0.68 0.55 3.08*
Dissatisfaction 1.63 1.49 0.68 0.58 3.35**
Admonishing 1.81 1.71 0.77 0.69 2.05*
Strict 2.82 2.75 0.59 0.67 1.85
**p<0.01; *p<0.05
Regarding students’ perception of their learning environment as assessed using the
Indonesian version of WIHIC, the results of this study maintain the assertions yielded from
the previous studies (Goh & Fraser, 1995; Goh, Young, & Fraser, 1995; Riah, 1998; Riah &
Fraser, 1998; Wong, 1994), in which females hold better perceptions of the classroom-
learning environment than do males. Table 6 suggests that generally females have
perceptions slightly more favourable than the males on the actual mathematics classroom-
learning environment. While the magnitudes of the differences between male and female
students’ views of the classroom learning environment are relatively small, statistically
significant differences occur on all scales, except on Involvement and Investigation.
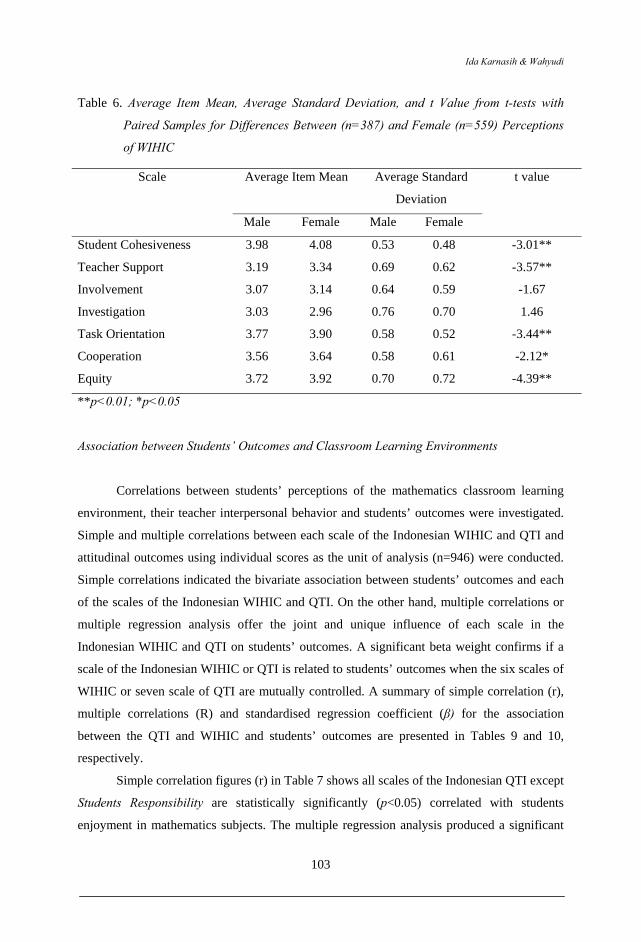
Ida Karnasih & Wahyudi
103
Table 6. Average Item Mean, Average Standard Deviation, and t Value from t-tests with
Paired Samples for Differences Between (n=387) and Female (n=559) Perceptions
of WIHIC
Scale Average Item Mean Average Standard
Deviation
t value
Male Female Male Female
Student Cohesiveness 3.98 4.08 0.53 0.48 -3.01**
Teacher Support 3.19 3.34 0.69 0.62 -3.57**
Involvement 3.07 3.14 0.64 0.59 -1.67
Investigation 3.03 2.96 0.76 0.70 1.46
Task Orientation 3.77 3.90 0.58 0.52 -3.44**
Cooperation 3.56 3.64 0.58 0.61 -2.12*
Equity 3.72 3.92 0.70 0.72 -4.39**
**p<0.01; *p<0.05
Association between Students’ Outcomes and Classroom Learning Environments
Correlations between students’ perceptions of the mathematics classroom learning
environment, their teacher interpersonal behavior and students’ outcomes were investigated.
Simple and multiple correlations between each scale of the Indonesian WIHIC and QTI and
attitudinal outcomes using individual scores as the unit of analysis (n=946) were conducted.
Simple correlations indicated the bivariate association between students’ outcomes and each
of the scales of the Indonesian WIHIC and QTI. On the other hand, multiple correlations or
multiple regression analysis offer the joint and unique influence of each scale in the
Indonesian WIHIC and QTI on students’ outcomes. A significant beta weight confirms if a
scale of the Indonesian WIHIC or QTI is related to students’ outcomes when the six scales of
WIHIC or seven scale of QTI are mutually controlled. A summary of simple correlation (r),
multiple correlations (R) and standardised regression coefficient (β) for the association
between the QTI and WIHIC and students’ outcomes are presented in Tables 9 and 10,
respectively.
Simple correlation figures (r) in Table 7 shows all scales of the Indonesian QTI except
Students Responsibility are statistically significantly (p<0.05) correlated with students
enjoyment in mathematics subjects. The multiple regression analysis produced a significant
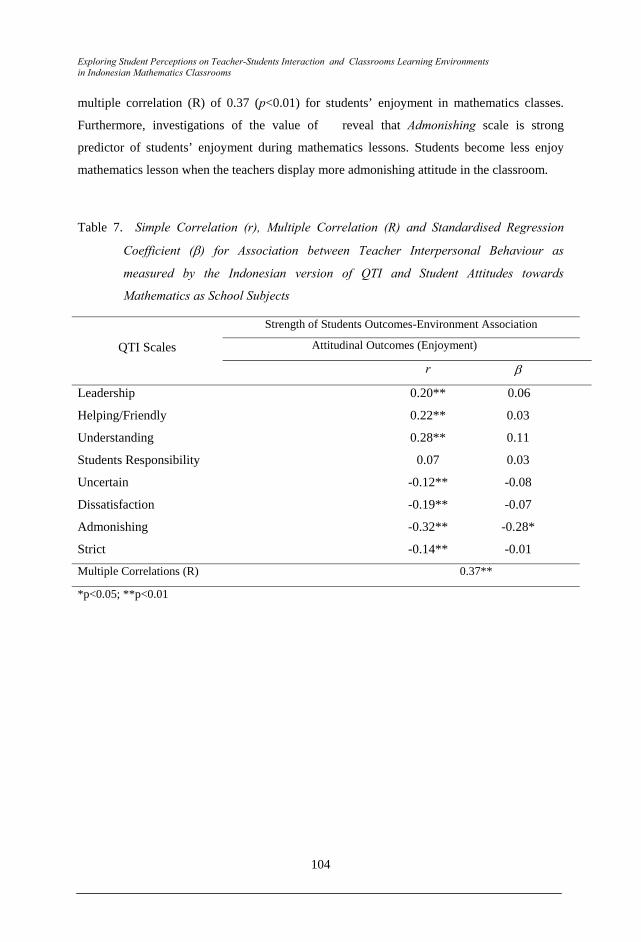
Exploring Student Perceptions on Teacher-Students Interaction and Classrooms Learning Environments in Indonesian Mathematics Classrooms
104
multiple correlation (R) of 0.37 (p<0.01) for students’ enjoyment in mathematics classes.
Furthermore, investigations of the value of � reveal that Admonishing scale is strong
predictor of students’ enjoyment during mathematics lessons. Students become less enjoy
mathematics lesson when the teachers display more admonishing attitude in the classroom.
Table 7. Simple Correlation (r), Multiple Correlation (R) and Standardised Regression
Coefficient (β) for Association between Teacher Interpersonal Behaviour as
measured by the Indonesian version of QTI and Student Attitudes towards
Mathematics as School Subjects
QTI Scales
Strength of Students Outcomes-Environment Association Attitudinal Outcomes (Enjoyment)
r β
Leadership 0.20** 0.06
Helping/Friendly 0.22** 0.03
Understanding 0.28** 0.11
Students Responsibility 0.07 0.03
Uncertain -0.12** -0.08
Dissatisfaction -0.19** -0.07
Admonishing -0.32** -0.28*
Strict -0.14** -0.01
Multiple Correlations (R) 0.37**
*p<0.05; **p<0.01
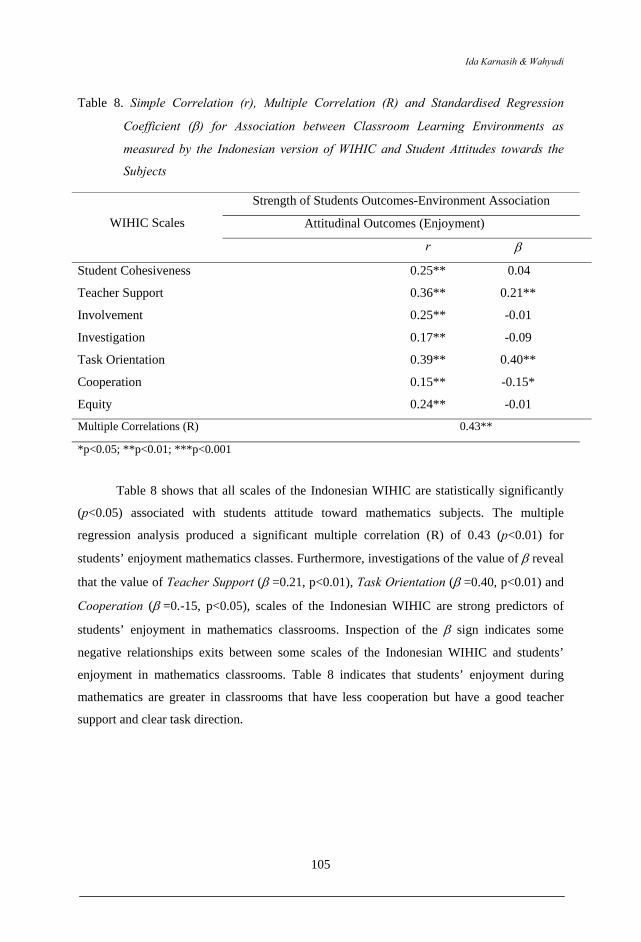
Ida Karnasih & Wahyudi
105
Table 8. Simple Correlation (r), Multiple Correlation (R) and Standardised Regression
Coefficient (β) for Association between Classroom Learning Environments as
measured by the Indonesian version of WIHIC and Student Attitudes towards the
Subjects
WIHIC Scales
Strength of Students Outcomes-Environment Association
Attitudinal Outcomes (Enjoyment)
r β
Student Cohesiveness 0.25** 0.04
Teacher Support 0.36** 0.21**
Involvement 0.25** -0.01
Investigation 0.17** -0.09
Task Orientation 0.39** 0.40**
Cooperation 0.15** -0.15*
Equity 0.24** -0.01
Multiple Correlations (R) 0.43**
*p<0.05; **p<0.01; ***p<0.001
Table 8 shows that all scales of the Indonesian WIHIC are statistically significantly
(p<0.05) associated with students attitude toward mathematics subjects. The multiple
regression analysis produced a significant multiple correlation (R) of 0.43 (p<0.01) for
students’ enjoyment mathematics classes. Furthermore, investigations of the value of β reveal
that the value of Teacher Support (β =0.21, p<0.01), Task Orientation (β =0.40, p<0.01) and
Cooperation (β =0.-15, p<0.05), scales of the Indonesian WIHIC are strong predictors of
students’ enjoyment in mathematics classrooms. Inspection of the β sign indicates some
negative relationships exits between some scales of the Indonesian WIHIC and students’
enjoyment in mathematics classrooms. Table 8 indicates that students’ enjoyment during
mathematics are greater in classrooms that have less cooperation but have a good teacher
support and clear task direction.
Exploring Student Perceptions on Teacher-Students Interaction and Classrooms Learning Environments in Indonesian Mathematics Classrooms
106
Conclusions and Recommendations
This study has explored associations between students’ perceptions of their teacher
interpersonal behavior, classroom learning environment and their attitude toward
mathematics classes.
This study confirmed the reliability and validity of the QTI and WIHIC when used in
lower secondary mathematics classes in Indonesian school context. It is found in this study
that there are differences on students’ perceptions toward their teacher interpersonal behavior
and their classroom learning environment based on actual and preferred version as well as
based on students’ gender. As expected, even though to such extend students are contented
with their actual perceptions on both the QTI and WIHIC scales, however, they would like to
have more positive experience of teacher interaction and to have more conducive classroom
learning environment. This study also found gender differences that consistently showed that
females perceive their teachers in a more positive way than do males. Female students also
consistently perceive their mathematics classroom environment more favorable than their
male counterparts do.
Regarding the association between students’ perception of learning environment and
their attitude toward science and mathematics, generally the dimensions or scales of the QTI
and WIHIC were found to be significantly associated with student attitudes. In particular, the
study showed that there was a positive correlation between student attitude toward
mathematics classes and the teachers' leadership, helping/friendly and understanding
behaviours. Students had a more positive attitude to their mathematics classes when their
teacher exhibited more of these behaviours and less admonishing, dissatisfied, uncertain and
strict behaviours. If mathematics teachers want to promote favourable student attitudes to
their class, they should ensure the presence of these interpersonal behaviours.
This research is of practical significance in that it has drawn a link between student
attitudes and the nature of the teacher-student behaviour in the classroom. The study could
be of significance for teacher educators and policy makers in that it provides a way of
improving student outcomes by changing the nature of classroom learning environment and
the existence of interpersonal relationships between students and teachers in mathematics
classrooms.
Future research should be planned to help teachers in using these two instruments for
improving their teaching performance. A study on better or exemplary teachers as suggested
by Waldrip and Fisher (2002) would be advised to be done in Indoensia and SEAMEO

Ida Karnasih & Wahyudi
107
member countries so that the teachers from this region may share and learn from each other
through the best practices found from the research.
It is also advisable for teacher training centre or the university to take into
consideration the important of knowledge of teacher interpersonal behaviour and learning
environment. To provide student teachers with adequate knowledge, therefore, learning
environments can be included as mandatory unit course in the university or teacher training
centre.
Exploring Student Perceptions on Teacher-Students Interaction and Classrooms Learning Environments in Indonesian Mathematics Classrooms
108
References
Aldridge, J. M., & Fraser, B. J. (1997, August). Examining science classroom environments in a cross-national study. Paper presented at the 12th WAIER Research Forum for the Western Australian Institute for Educational Research, Perth, Australia.
Brislin, R. W. (1970). Back translation for cross-cultural research. Journal of Cross-Cultural Psychology, 1, 185-216.
Chionh, Y. H., & Fraser, B. J. (1998). Validation and use of the 'What is Happening in this Class' (WIHIC) questionnaire in Singapore. Paper presented at the annual meeting of the American educational Research Association, San Diego, CA.
Fisher, D., Fraser, B., & Wubbels, T. (1993). Interpersonal teacher behavior and school environment. In T. Wubbels & J. Levy (Eds.), Do you know what you look like? Interpersonal relationships in education (pp. 103-112). London, England: Falmer Press.
Fisher, D., Fraser, B., Wubbels, T., & Brekelmans, M. (1993, April). Associations between school environment and teacher interpersonal behavior in the classroom. Paper presented at the annual meeting of the American Educational Research Association, Atlanta, GA.
Fisher, D., Rickards, T., & Fraser, B. (1996). Assessing teacher-student interpersonal relationships in science classes. Australian Science Teachers Journal, 42, 28-33.
Fisher, D., & Stolarchuk, E. (1997). The effects of using laptop computers on achievement, attitude to science and classroom environment in science. Paper presented at the Annual Conference of the Western Australian Science Education Association, Perth.
Fisher, D. L., Henderson, D., & Fraser, B. J. (1995). Interpersonal behaviour in senior high school biology classes. Research in Science Education, 25(2), 125-133.
Fisher, D. L., & Rickards, T. (1998). Associations between teacher-student interpersonal behaviour and student attitude to mathematics. Mathematics Education Research journal, 10(1), 3-15.
Fisher, D. L., Rickards, T., Goh, S. C., & Wong, A. F. L. (1997). Perceptions of interpersonal teacher behaviour in secondary science classrooms in Singapore and Australia. Journal of Applied Research in Education, 1(2), 2-11.
Fraser, B.J. (1981). Test of Science-Related Attitudes. Melbourne: Australian Council for Educational Research.
Fraser, B. J. (1989). Assessing and improving classroom environment (What Research Says to the Science and Mathematics Teacher No. 2.). Perth: Key Centre for School Science and Mathematics, Curtin University of Technology.
Fraser, B. (1994). Research on classroom and school climate. In D. Gabel (Ed.), Handbook of research on science teaching and learning, (pp. 493-541). New York: Macmillan.
Fraser, B. J. (1998). science learning environments: assessment, effects and determinants. In K. G. Tobin (Ed.), The international handbook of science education (pp. 527-564). Dordrecht, The Netherlands: Kluwer Academic Publishers.
Fraser, B. J., & Aldridge, J. M. (1998). The potential of cross-national studies of science classrooms; An example involving Australia and Taiwan. In M.Quigley (Ed.), Science, Mathematics and Technical Education for national Development. (pp. 76-83). Brunei: University of Brunei Darussalam.
Fraser, B. J., Fisher, D. L., & McRobbie, C. J. (1996). Development, validation and use of personal and class forms of a new classroom environment instrument. Paper presented at the Annual Meeting of the American Education Research Association, Chicago.
Ida Karnasih & Wahyudi
109
Fraser, B., & Walberg, H. (Eds.). (1991). Educational environments: Evaluation, antecedents and consequences. Oxford: Pergamon Press.
Getzel, J. W., & Thelen, H. A. (1960). The classroom group as a unique social system. (Vol. 59): National Society for Studies in Education.
Hunus, R., & Fraser, B. J. (1997). Chemistry learning Environment in Brunei Darussallam's Secondary Schools. In T. Rickards (Ed.), Science, Mathematics and Technology Education and national Development: Proceedings of the Vietnam Conference (pp. 108-120). Hanoi,Vietnam.
Khine, M. S., & Fisher, D. L. (2001, December). Classroom environment and teacher's cultural background in secondary science classes in Asian context. Paper presented at the International Educational Research Conference of Australian association of Research in Education, Perth.
Khoo, H., & Fraser, B. J. (1998). Using classroom environment dimensions in the evaluation of adult computer courses. Paper presented at the annual meeting of the National Association for Research in Science Teaching, San Diego, CA.
Kim, H., Fisher, D., & Fraser, B. J. (2000). Classroom environment and teacher interpersonal behaviour in secondary classes in Korea. Evaluation and Research in Education, 14, 3-22.
Leary, T. (1957). An interpersonal diagnosis of personality. New York: Ronald-Press Company.
McRobbie, C. J., & Fraser, B. J. (1993). Associations between student outcomes and psychosocial science environment. Journal of Educational Research, 87, 78-85.
Rawnsley, D. G. (1997). Associations between classroom learning environments, teacher interpersonal behaviours and student outcomes in secondary mathematics classrooms. Unpublished doctoral thesis, Curtin University of Technology, Perth, Western Australia
Santiboon, T. (2007). Associations between Students’ Perceptions in Laboratory Learning Environments and Teacher Interpersonal Behaviours in Physics Classes in Thailand. Paper presented at The 1st International Conference on Educational Reform 2007 November 9-11, 2007, Mahasarakham University, Thailand.
Taylor, P., Fraser, B., & Fisher, D. (1997). Monitoring constructivist classroom learning environments. International Journal of Educational Research, 27(4), 293-302.
Teh, G., & Fraser, B. (1995). Development and validation of an instrument for assessing the psychosocial environment of computer-assisted learning classrooms. Journal of Educational Computing Research, 12, 177-193.
Wahyudi. (2004). Educational practice and learning environments in rural and urban lower secondary science classrooms in Kalimantan Selatan Indonesia. Unplished doctoral thesis, Curtin University of Technology: Perth, Australia.
Waldrip, B. and Fisher, D. (2002). Student-teacher interactions and better science teachers. Queensland Journal of Educational Research, 18(2), 141-163. http://education.curtin.edu.au/iier/qjer/qjer18/waldrip.html
Watzlawick, P., Beavin, J., & Jackson, D. (1967). The pragmatics of human communication. New York: Norton.
Wubbels, T. (1993). Teacher-student relationships in science and mathematics classes (What research says to the science and mathematics teacher, No. 11). Perth: National Key Centre for School Science and Mathematics, Curtin University of Technology.
Wubbels, T., Brekelmans, M. (1998), "The teacher factor in the social climate of the classroom", in Fraser, B.J., Tobin, K.G. (Eds), International Handbook of Science Education, Kluwer Academic Publishers, London, pp.565-80.
Exploring Student Perceptions on Teacher-Students Interaction and Classrooms Learning Environments in Indonesian Mathematics Classrooms
110
Wubbels, T., Brekelmans, M., & Hooymayers, H. (1991). Interpersonal teacher behavior in the classroom. In B. Fraser & H. Walberg (Eds.), Educational environments: Evaluation, antecedents and consequences, (pp. 141-160). Oxford: Pergamon Press.
Wubbels, T., Creton, H., & Holvast, A. (1988). Undesirable classroom situations. Interchange, 19, 25-40.
Wubbels, T., Creton, H., & Hooymayers, H. (1985, April). Discipline problems of beginning teachers. Paper presented at annual meeting of American Educational Research Association, Chicago, IL.
Wubbels, T., & Levy, J. (1991). A comparison of interpersonal behaviour of Dutch and American teachers. International Journal of Intercultural Relations, 15, 1-18.
Wubbels, T., & Levy, J. (Eds.). (1993). Do you know what you look like? Interpersonal relationships in education. London, England: Falmer Press.
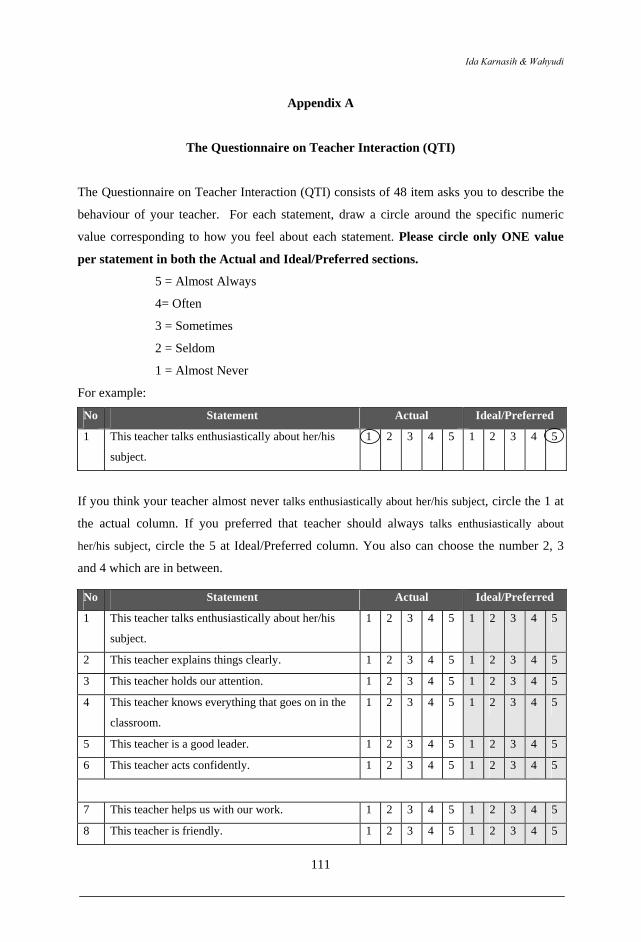
Ida Karnasih & Wahyudi
111
Appendix A
The Questionnaire on Teacher Interaction (QTI)
The Questionnaire on Teacher Interaction (QTI) consists of 48 item asks you to describe the
behaviour of your teacher. For each statement, draw a circle around the specific numeric
value corresponding to how you feel about each statement. Please circle only ONE value
per statement in both the Actual and Ideal/Preferred sections.
5 = Almost Always
4= Often
3 = Sometimes
2 = Seldom
1 = Almost Never
For example:
No Statement Actual Ideal/Preferred 1 This teacher talks enthusiastically about her/his
subject. 1 2 3 4 5 1 2 3 4 5
If you think your teacher almost never talks enthusiastically about her/his subject, circle the 1 at
the actual column. If you preferred that teacher should always talks enthusiastically about
her/his subject, circle the 5 at Ideal/Preferred column. You also can choose the number 2, 3
and 4 which are in between.
No Statement Actual Ideal/Preferred 1 This teacher talks enthusiastically about her/his
subject. 1 2 3 4 5 1 2 3 4 5
2 This teacher explains things clearly. 1 2 3 4 5 1 2 3 4 5
3 This teacher holds our attention. 1 2 3 4 5 1 2 3 4 5 4 This teacher knows everything that goes on in the
classroom. 1 2 3 4 5 1 2 3 4 5
5 This teacher is a good leader. 1 2 3 4 5 1 2 3 4 5
6 This teacher acts confidently. 1 2 3 4 5 1 2 3 4 5
7 This teacher helps us with our work. 1 2 3 4 5 1 2 3 4 5
8 This teacher is friendly. 1 2 3 4 5 1 2 3 4 5
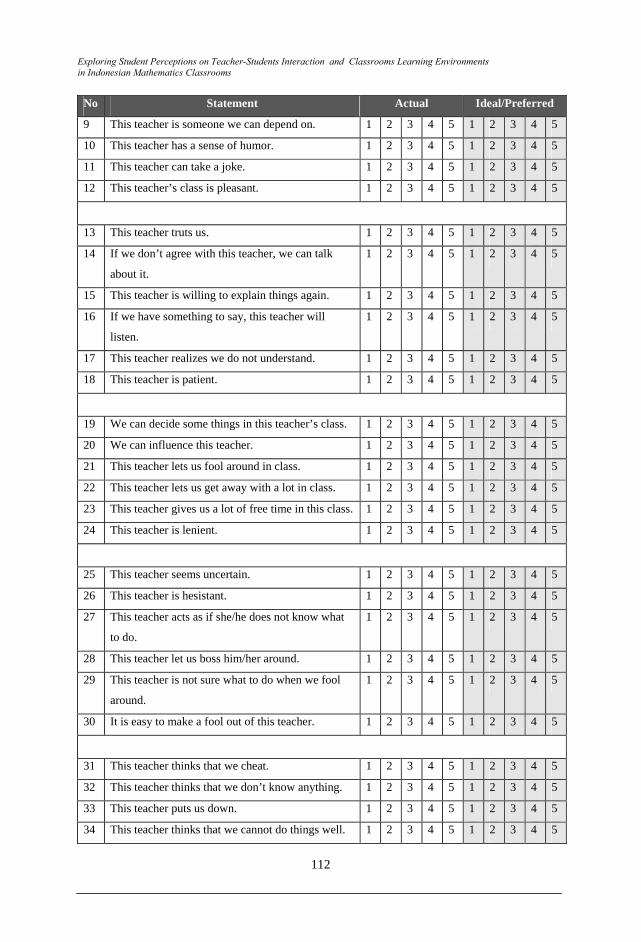
Exploring Student Perceptions on Teacher-Students Interaction and Classrooms Learning Environments in Indonesian Mathematics Classrooms
112
No Statement Actual Ideal/Preferred 9 This teacher is someone we can depend on. 1 2 3 4 5 1 2 3 4 5
10 This teacher has a sense of humor. 1 2 3 4 5 1 2 3 4 5
11 This teacher can take a joke. 1 2 3 4 5 1 2 3 4 5
12 This teacher’s class is pleasant. 1 2 3 4 5 1 2 3 4 5
13 This teacher truts us. 1 2 3 4 5 1 2 3 4 5 14 If we don’t agree with this teacher, we can talk
about it. 1 2 3 4 5 1 2 3 4 5
15 This teacher is willing to explain things again. 1 2 3 4 5 1 2 3 4 5
16 If we have something to say, this teacher will
listen. 1 2 3 4 5 1 2 3 4 5
17 This teacher realizes we do not understand. 1 2 3 4 5 1 2 3 4 5
18 This teacher is patient. 1 2 3 4 5 1 2 3 4 5
19 We can decide some things in this teacher’s class. 1 2 3 4 5 1 2 3 4 5
20 We can influence this teacher. 1 2 3 4 5 1 2 3 4 5
21 This teacher lets us fool around in class. 1 2 3 4 5 1 2 3 4 5
22 This teacher lets us get away with a lot in class. 1 2 3 4 5 1 2 3 4 5
23 This teacher gives us a lot of free time in this class. 1 2 3 4 5 1 2 3 4 5
24 This teacher is lenient. 1 2 3 4 5 1 2 3 4 5
25 This teacher seems uncertain. 1 2 3 4 5 1 2 3 4 5
26 This teacher is hesistant. 1 2 3 4 5 1 2 3 4 5
27 This teacher acts as if she/he does not know what
to do. 1 2 3 4 5 1 2 3 4 5
28 This teacher let us boss him/her around. 1 2 3 4 5 1 2 3 4 5
29 This teacher is not sure what to do when we fool
around. 1 2 3 4 5 1 2 3 4 5
30 It is easy to make a fool out of this teacher. 1 2 3 4 5 1 2 3 4 5
31 This teacher thinks that we cheat. 1 2 3 4 5 1 2 3 4 5
32 This teacher thinks that we don’t know anything. 1 2 3 4 5 1 2 3 4 5
33 This teacher puts us down. 1 2 3 4 5 1 2 3 4 5
34 This teacher thinks that we cannot do things well. 1 2 3 4 5 1 2 3 4 5
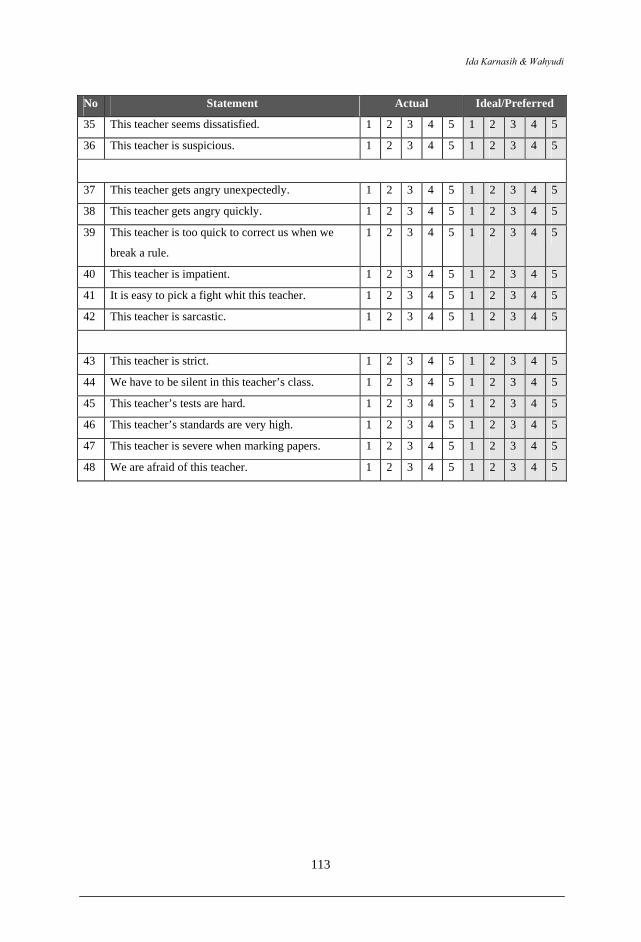
Ida Karnasih & Wahyudi
113
No Statement Actual Ideal/Preferred 35 This teacher seems dissatisfied. 1 2 3 4 5 1 2 3 4 5
36 This teacher is suspicious. 1 2 3 4 5 1 2 3 4 5
37 This teacher gets angry unexpectedly. 1 2 3 4 5 1 2 3 4 5
38 This teacher gets angry quickly. 1 2 3 4 5 1 2 3 4 5
39 This teacher is too quick to correct us when we
break a rule. 1 2 3 4 5 1 2 3 4 5
40 This teacher is impatient. 1 2 3 4 5 1 2 3 4 5
41 It is easy to pick a fight whit this teacher. 1 2 3 4 5 1 2 3 4 5
42 This teacher is sarcastic. 1 2 3 4 5 1 2 3 4 5
43 This teacher is strict. 1 2 3 4 5 1 2 3 4 5
44 We have to be silent in this teacher’s class. 1 2 3 4 5 1 2 3 4 5
45 This teacher’s tests are hard. 1 2 3 4 5 1 2 3 4 5
46 This teacher’s standards are very high. 1 2 3 4 5 1 2 3 4 5
47 This teacher is severe when marking papers. 1 2 3 4 5 1 2 3 4 5
48 We are afraid of this teacher. 1 2 3 4 5 1 2 3 4 5
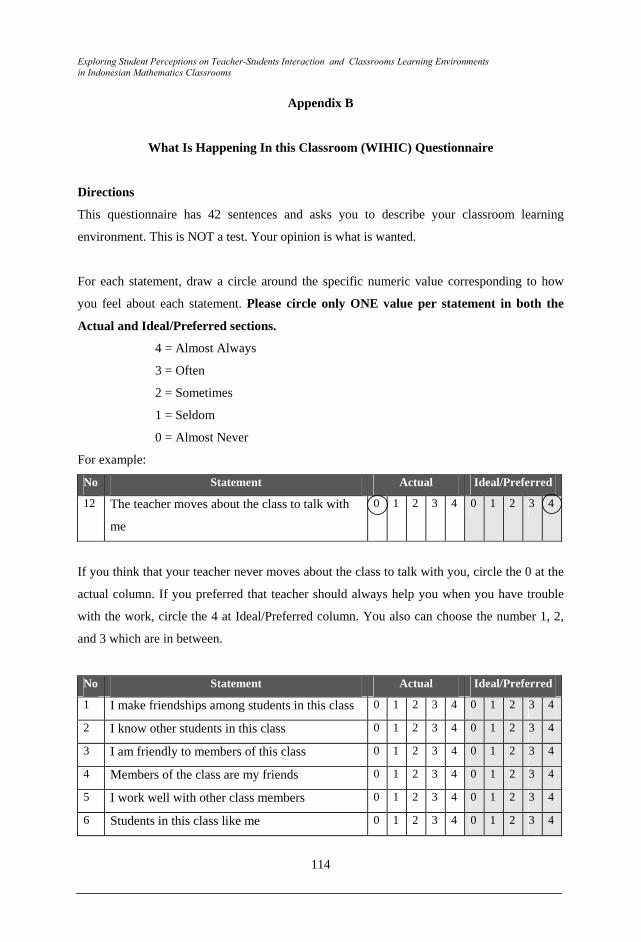
Exploring Student Perceptions on Teacher-Students Interaction and Classrooms Learning Environments in Indonesian Mathematics Classrooms
114
Appendix B
What Is Happening In this Classroom (WIHIC) Questionnaire
Directions
This questionnaire has 42 sentences and asks you to describe your classroom learning
environment. This is NOT a test. Your opinion is what is wanted.
For each statement, draw a circle around the specific numeric value corresponding to how
you feel about each statement. Please circle only ONE value per statement in both the
Actual and Ideal/Preferred sections.
4 = Almost Always
3 = Often
2 = Sometimes
1 = Seldom
0 = Almost Never
For example:
No Statement Actual Ideal/Preferred 12 The teacher moves about the class to talk with
me
0 1 2 3 4 0 1 2 3 4
If you think that your teacher never moves about the class to talk with you, circle the 0 at the
actual column. If you preferred that teacher should always help you when you have trouble
with the work, circle the 4 at Ideal/Preferred column. You also can choose the number 1, 2,
and 3 which are in between.
No Statement Actual Ideal/Preferred 1 I make friendships among students in this class 0 1 2 3 4 0 1 2 3 4
2 I know other students in this class 0 1 2 3 4 0 1 2 3 4
3 I am friendly to members of this class 0 1 2 3 4 0 1 2 3 4
4 Members of the class are my friends 0 1 2 3 4 0 1 2 3 4
5 I work well with other class members 0 1 2 3 4 0 1 2 3 4
6 Students in this class like me 0 1 2 3 4 0 1 2 3 4
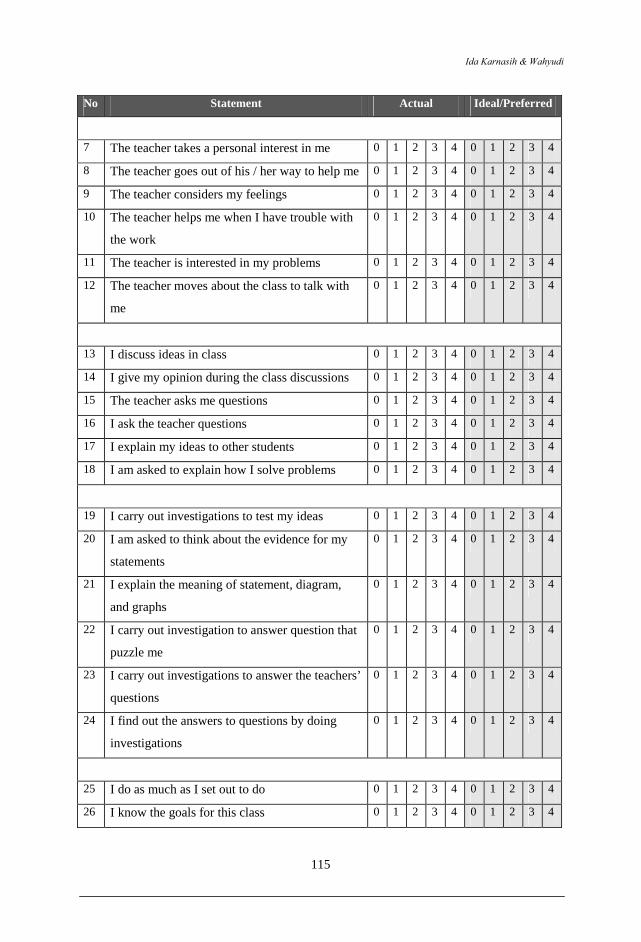
Ida Karnasih & Wahyudi
115
No Statement Actual Ideal/Preferred
7 The teacher takes a personal interest in me 0 1 2 3 4 0 1 2 3 4
8 The teacher goes out of his / her way to help me 0 1 2 3 4 0 1 2 3 4
9 The teacher considers my feelings 0 1 2 3 4 0 1 2 3 4
10 The teacher helps me when I have trouble with
the work
0 1 2 3 4 0 1 2 3 4
11 The teacher is interested in my problems 0 1 2 3 4 0 1 2 3 4
12 The teacher moves about the class to talk with
me
0 1 2 3 4 0 1 2 3 4
13 I discuss ideas in class 0 1 2 3 4 0 1 2 3 4
14 I give my opinion during the class discussions 0 1 2 3 4 0 1 2 3 4
15 The teacher asks me questions 0 1 2 3 4 0 1 2 3 4
16 I ask the teacher questions 0 1 2 3 4 0 1 2 3 4
17 I explain my ideas to other students 0 1 2 3 4 0 1 2 3 4
18 I am asked to explain how I solve problems 0 1 2 3 4 0 1 2 3 4
19 I carry out investigations to test my ideas 0 1 2 3 4 0 1 2 3 4
20 I am asked to think about the evidence for my
statements
0 1 2 3 4 0 1 2 3 4
21 I explain the meaning of statement, diagram,
and graphs
0 1 2 3 4 0 1 2 3 4
22 I carry out investigation to answer question that
puzzle me
0 1 2 3 4 0 1 2 3 4
23 I carry out investigations to answer the teachers’
questions
0 1 2 3 4 0 1 2 3 4
24 I find out the answers to questions by doing
investigations
0 1 2 3 4 0 1 2 3 4
25 I do as much as I set out to do 0 1 2 3 4 0 1 2 3 4
26 I know the goals for this class 0 1 2 3 4 0 1 2 3 4
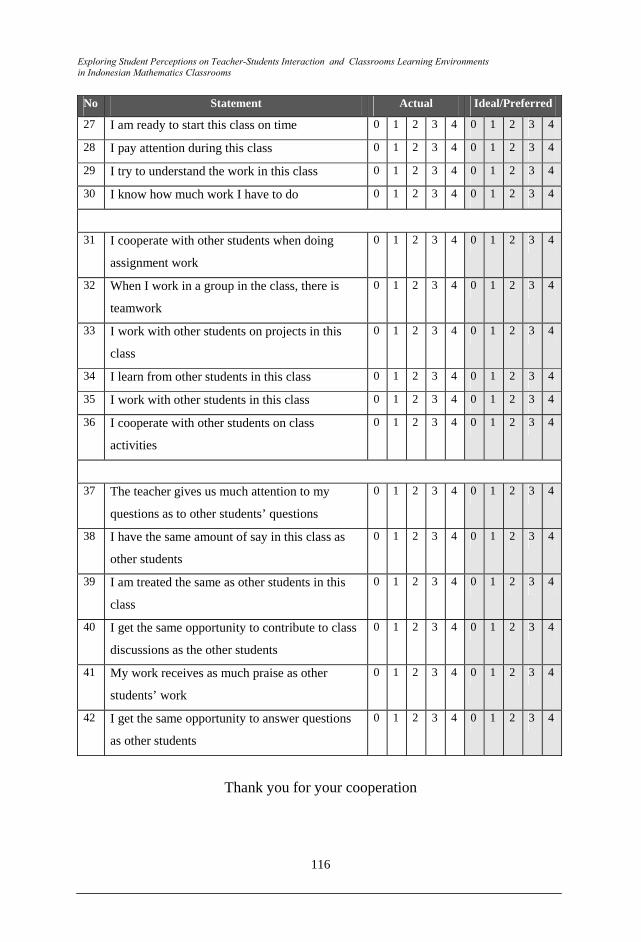
Exploring Student Perceptions on Teacher-Students Interaction and Classrooms Learning Environments in Indonesian Mathematics Classrooms
116
No Statement Actual Ideal/Preferred 27 I am ready to start this class on time 0 1 2 3 4 0 1 2 3 4
28 I pay attention during this class 0 1 2 3 4 0 1 2 3 4
29 I try to understand the work in this class 0 1 2 3 4 0 1 2 3 4
30 I know how much work I have to do 0 1 2 3 4 0 1 2 3 4
31 I cooperate with other students when doing
assignment work
0 1 2 3 4 0 1 2 3 4
32 When I work in a group in the class, there is
teamwork
0 1 2 3 4 0 1 2 3 4
33 I work with other students on projects in this
class
0 1 2 3 4 0 1 2 3 4
34 I learn from other students in this class 0 1 2 3 4 0 1 2 3 4
35 I work with other students in this class 0 1 2 3 4 0 1 2 3 4
36 I cooperate with other students on class
activities
0 1 2 3 4 0 1 2 3 4
37 The teacher gives us much attention to my
questions as to other students’ questions
0 1 2 3 4 0 1 2 3 4
38 I have the same amount of say in this class as
other students
0 1 2 3 4 0 1 2 3 4
39 I am treated the same as other students in this
class
0 1 2 3 4 0 1 2 3 4
40 I get the same opportunity to contribute to class
discussions as the other students
0 1 2 3 4 0 1 2 3 4
41 My work receives as much praise as other
students’ work
0 1 2 3 4 0 1 2 3 4
42 I get the same opportunity to answer questions
as other students
0 1 2 3 4 0 1 2 3 4
Thank you for your cooperation
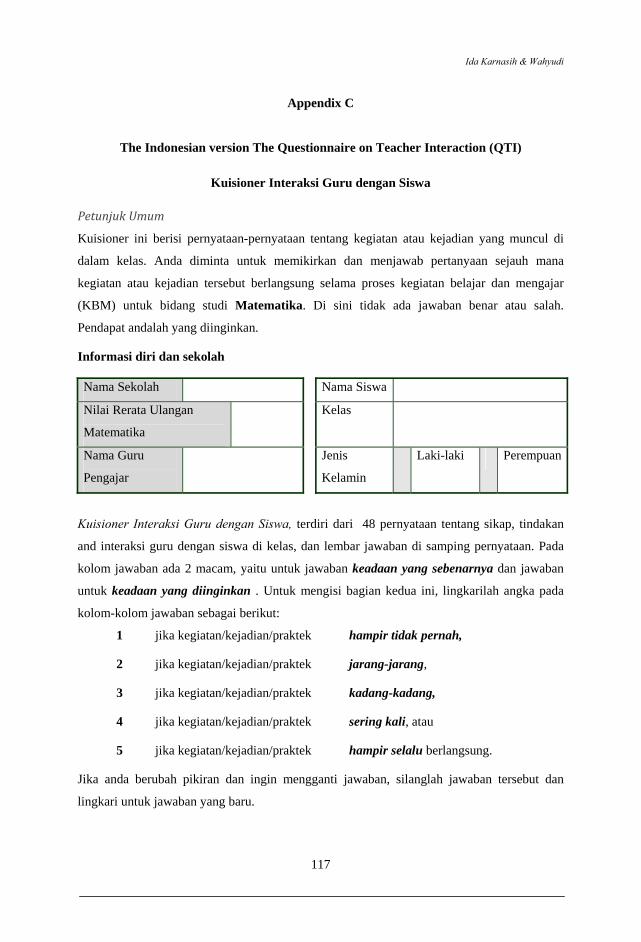
Ida Karnasih & Wahyudi
117
Appendix C
The Indonesian version The Questionnaire on Teacher Interaction (QTI)
Kuisioner Interaksi Guru dengan Siswa
Petunjuk Umum
Kuisioner ini berisi pernyataan-pernyataan tentang kegiatan atau kejadian yang muncul di
dalam kelas. Anda diminta untuk memikirkan dan menjawab pertanyaan sejauh mana
kegiatan atau kejadian tersebut berlangsung selama proses kegiatan belajar dan mengajar
(KBM) untuk bidang studi Matematika. Di sini tidak ada jawaban benar atau salah.
Pendapat andalah yang diinginkan.
Informasi diri dan sekolah
Nama Sekolah Nama Siswa
Nilai Rerata Ulangan
Matematika
Kelas
Nama Guru
Pengajar
Jenis
Kelamin
Laki-laki Perempuan
Kuisioner Interaksi Guru dengan Siswa, terdiri dari 48 pernyataan tentang sikap, tindakan
and interaksi guru dengan siswa di kelas, dan lembar jawaban di samping pernyataan. Pada
kolom jawaban ada 2 macam, yaitu untuk jawaban keadaan yang sebenarnya dan jawaban
untuk keadaan yang diinginkan . Untuk mengisi bagian kedua ini, lingkarilah angka pada
kolom-kolom jawaban sebagai berikut:
1 jika kegiatan/kejadian/praktek hampir tidak pernah,
2 jika kegiatan/kejadian/praktek jarang-jarang,
3 jika kegiatan/kejadian/praktek kadang-kadang,
4 jika kegiatan/kejadian/praktek sering kali, atau
5 jika kegiatan/kejadian/praktek hampir selalu berlangsung.
Jika anda berubah pikiran dan ingin mengganti jawaban, silanglah jawaban tersebut dan
lingkari untuk jawaban yang baru.
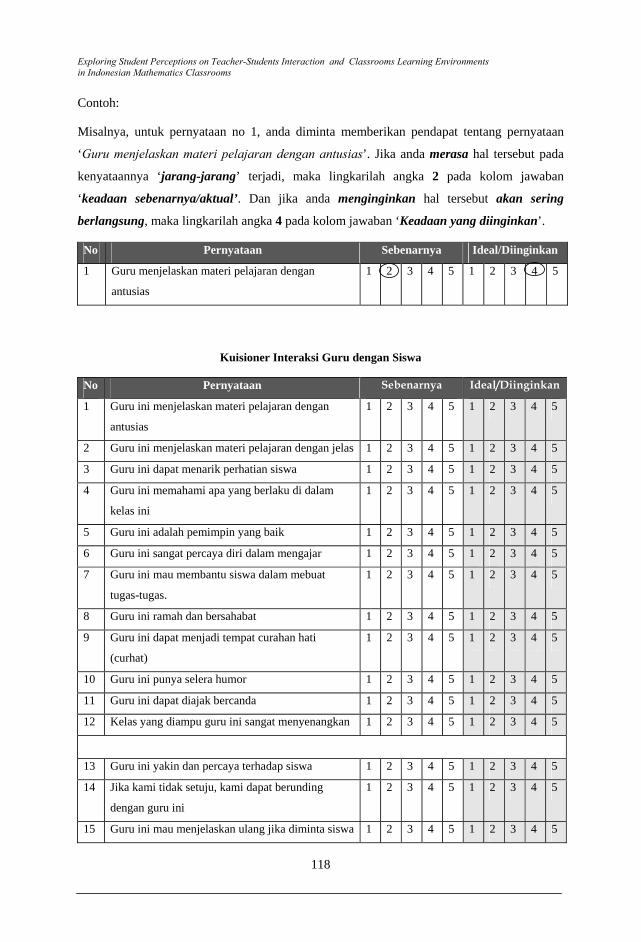
Exploring Student Perceptions on Teacher-Students Interaction and Classrooms Learning Environments in Indonesian Mathematics Classrooms
118
Contoh:
Misalnya, untuk pernyataan no 1, anda diminta memberikan pendapat tentang pernyataan
‘Guru menjelaskan materi pelajaran dengan antusias’. Jika anda merasa hal tersebut pada
kenyataannya ‘jarang-jarang’ terjadi, maka lingkarilah angka 2 pada kolom jawaban
‘keadaan sebenarnya/aktual’. Dan jika anda menginginkan hal tersebut akan sering
berlangsung, maka lingkarilah angka 4 pada kolom jawaban ‘Keadaan yang diinginkan’.
No Pernyataan Sebenarnya Ideal/Diinginkan 1 Guru menjelaskan materi pelajaran dengan
antusias 1 2 3 4 5 1 2 3 4 5
Kuisioner Interaksi Guru dengan Siswa
No Pernyataan Sebenarnya Ideal/Diinginkan
1 Guru ini menjelaskan materi pelajaran dengan
antusias 1 2 3 4 5 1 2 3 4 5
2 Guru ini menjelaskan materi pelajaran dengan jelas 1 2 3 4 5 1 2 3 4 5
3 Guru ini dapat menarik perhatian siswa 1 2 3 4 5 1 2 3 4 5
4 Guru ini memahami apa yang berlaku di dalam
kelas ini 1 2 3 4 5 1 2 3 4 5
5 Guru ini adalah pemimpin yang baik 1 2 3 4 5 1 2 3 4 5
6 Guru ini sangat percaya diri dalam mengajar 1 2 3 4 5 1 2 3 4 5
7 Guru ini mau membantu siswa dalam mebuat
tugas-tugas. 1 2 3 4 5 1 2 3 4 5
8 Guru ini ramah dan bersahabat 1 2 3 4 5 1 2 3 4 5
9 Guru ini dapat menjadi tempat curahan hati
(curhat) 1 2 3 4 5 1 2 3 4 5
10 Guru ini punya selera humor 1 2 3 4 5 1 2 3 4 5
11 Guru ini dapat diajak bercanda 1 2 3 4 5 1 2 3 4 5 12 Kelas yang diampu guru ini sangat menyenangkan 1 2 3 4 5 1 2 3 4 5
13 Guru ini yakin dan percaya terhadap siswa 1 2 3 4 5 1 2 3 4 5 14 Jika kami tidak setuju, kami dapat berunding
dengan guru ini 1 2 3 4 5 1 2 3 4 5
15 Guru ini mau menjelaskan ulang jika diminta siswa 1 2 3 4 5 1 2 3 4 5
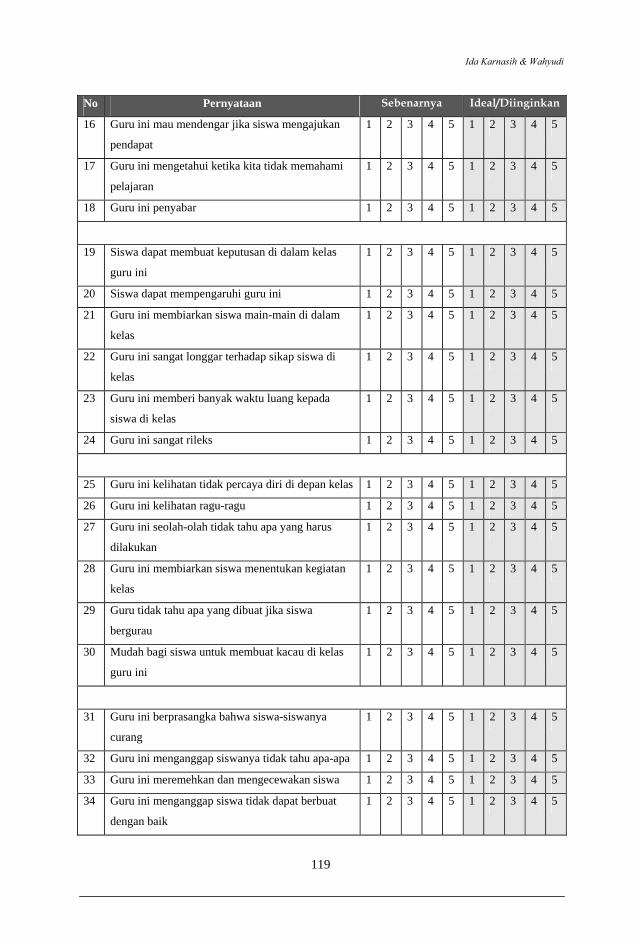
Ida Karnasih & Wahyudi
119
No Pernyataan Sebenarnya Ideal/Diinginkan
16 Guru ini mau mendengar jika siswa mengajukan
pendapat 1 2 3 4 5 1 2 3 4 5
17 Guru ini mengetahui ketika kita tidak memahami
pelajaran 1 2 3 4 5 1 2 3 4 5
18 Guru ini penyabar 1 2 3 4 5 1 2 3 4 5
19 Siswa dapat membuat keputusan di dalam kelas
guru ini 1 2 3 4 5 1 2 3 4 5
20 Siswa dapat mempengaruhi guru ini 1 2 3 4 5 1 2 3 4 5
21 Guru ini membiarkan siswa main-main di dalam
kelas 1 2 3 4 5 1 2 3 4 5
22 Guru ini sangat longgar terhadap sikap siswa di
kelas 1 2 3 4 5 1 2 3 4 5
23 Guru ini memberi banyak waktu luang kepada
siswa di kelas 1 2 3 4 5 1 2 3 4 5
24 Guru ini sangat rileks 1 2 3 4 5 1 2 3 4 5
25 Guru ini kelihatan tidak percaya diri di depan kelas 1 2 3 4 5 1 2 3 4 5
26 Guru ini kelihatan ragu-ragu 1 2 3 4 5 1 2 3 4 5
27 Guru ini seolah-olah tidak tahu apa yang harus
dilakukan 1 2 3 4 5 1 2 3 4 5
28 Guru ini membiarkan siswa menentukan kegiatan
kelas 1 2 3 4 5 1 2 3 4 5
29 Guru tidak tahu apa yang dibuat jika siswa
bergurau 1 2 3 4 5 1 2 3 4 5
30 Mudah bagi siswa untuk membuat kacau di kelas
guru ini 1 2 3 4 5 1 2 3 4 5
31 Guru ini berprasangka bahwa siswa-siswanya
curang 1 2 3 4 5 1 2 3 4 5
32 Guru ini menganggap siswanya tidak tahu apa-apa 1 2 3 4 5 1 2 3 4 5
33 Guru ini meremehkan dan mengecewakan siswa 1 2 3 4 5 1 2 3 4 5
34 Guru ini menganggap siswa tidak dapat berbuat
dengan baik 1 2 3 4 5 1 2 3 4 5
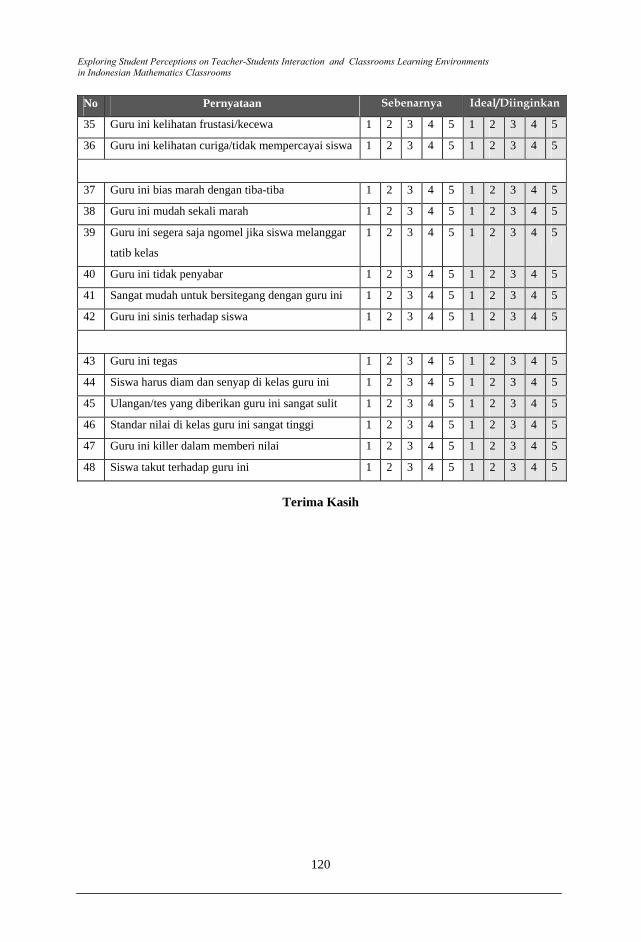
Exploring Student Perceptions on Teacher-Students Interaction and Classrooms Learning Environments in Indonesian Mathematics Classrooms
120
No Pernyataan Sebenarnya Ideal/Diinginkan
35 Guru ini kelihatan frustasi/kecewa 1 2 3 4 5 1 2 3 4 5
36 Guru ini kelihatan curiga/tidak mempercayai siswa 1 2 3 4 5 1 2 3 4 5
37 Guru ini bias marah dengan tiba-tiba 1 2 3 4 5 1 2 3 4 5
38 Guru ini mudah sekali marah 1 2 3 4 5 1 2 3 4 5
39 Guru ini segera saja ngomel jika siswa melanggar
tatib kelas 1 2 3 4 5 1 2 3 4 5
40 Guru ini tidak penyabar 1 2 3 4 5 1 2 3 4 5
41 Sangat mudah untuk bersitegang dengan guru ini 1 2 3 4 5 1 2 3 4 5
42 Guru ini sinis terhadap siswa 1 2 3 4 5 1 2 3 4 5
43 Guru ini tegas 1 2 3 4 5 1 2 3 4 5
44 Siswa harus diam dan senyap di kelas guru ini 1 2 3 4 5 1 2 3 4 5
45 Ulangan/tes yang diberikan guru ini sangat sulit 1 2 3 4 5 1 2 3 4 5
46 Standar nilai di kelas guru ini sangat tinggi 1 2 3 4 5 1 2 3 4 5
47 Guru ini killer dalam memberi nilai 1 2 3 4 5 1 2 3 4 5
48 Siswa takut terhadap guru ini 1 2 3 4 5 1 2 3 4 5
Terima Kasih
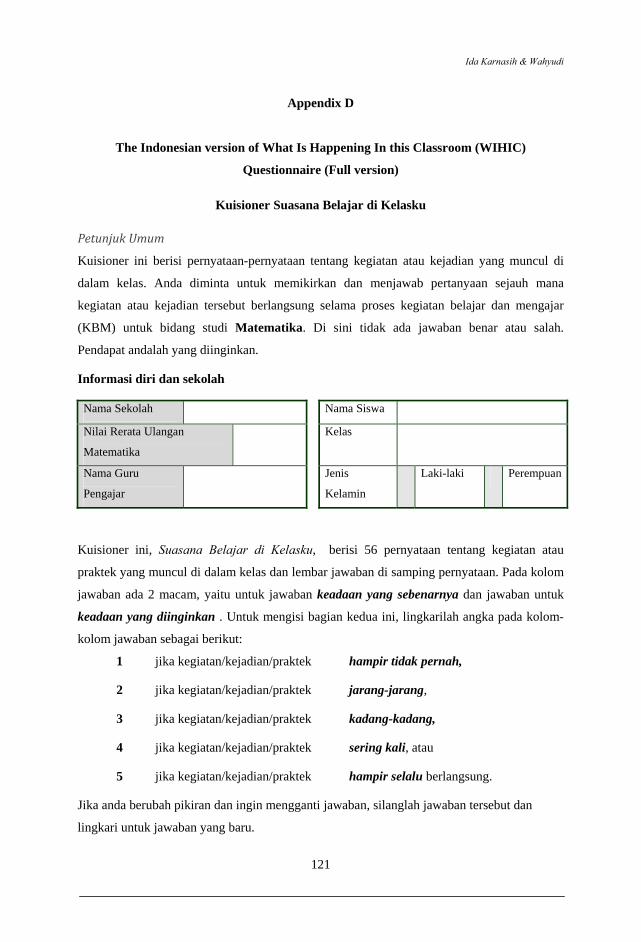
Ida Karnasih & Wahyudi
121
Appendix D
The Indonesian version of What Is Happening In this Classroom (WIHIC)
Questionnaire (Full version)
Kuisioner Suasana Belajar di Kelasku
Petunjuk Umum
Kuisioner ini berisi pernyataan-pernyataan tentang kegiatan atau kejadian yang muncul di
dalam kelas. Anda diminta untuk memikirkan dan menjawab pertanyaan sejauh mana
kegiatan atau kejadian tersebut berlangsung selama proses kegiatan belajar dan mengajar
(KBM) untuk bidang studi Matematika. Di sini tidak ada jawaban benar atau salah.
Pendapat andalah yang diinginkan.
Informasi diri dan sekolah
Nama Sekolah Nama Siswa
Nilai Rerata Ulangan
Matematika Kelas
Nama Guru
Pengajar Jenis
Kelamin Laki-laki Perempuan
Kuisioner ini, Suasana Belajar di Kelasku, berisi 56 pernyataan tentang kegiatan atau
praktek yang muncul di dalam kelas dan lembar jawaban di samping pernyataan. Pada kolom
jawaban ada 2 macam, yaitu untuk jawaban keadaan yang sebenarnya dan jawaban untuk
keadaan yang diinginkan . Untuk mengisi bagian kedua ini, lingkarilah angka pada kolom-
kolom jawaban sebagai berikut:
1 jika kegiatan/kejadian/praktek hampir tidak pernah,
2 jika kegiatan/kejadian/praktek jarang-jarang,
3 jika kegiatan/kejadian/praktek kadang-kadang,
4 jika kegiatan/kejadian/praktek sering kali, atau
5 jika kegiatan/kejadian/praktek hampir selalu berlangsung.
Jika anda berubah pikiran dan ingin mengganti jawaban, silanglah jawaban tersebut dan
lingkari untuk jawaban yang baru.
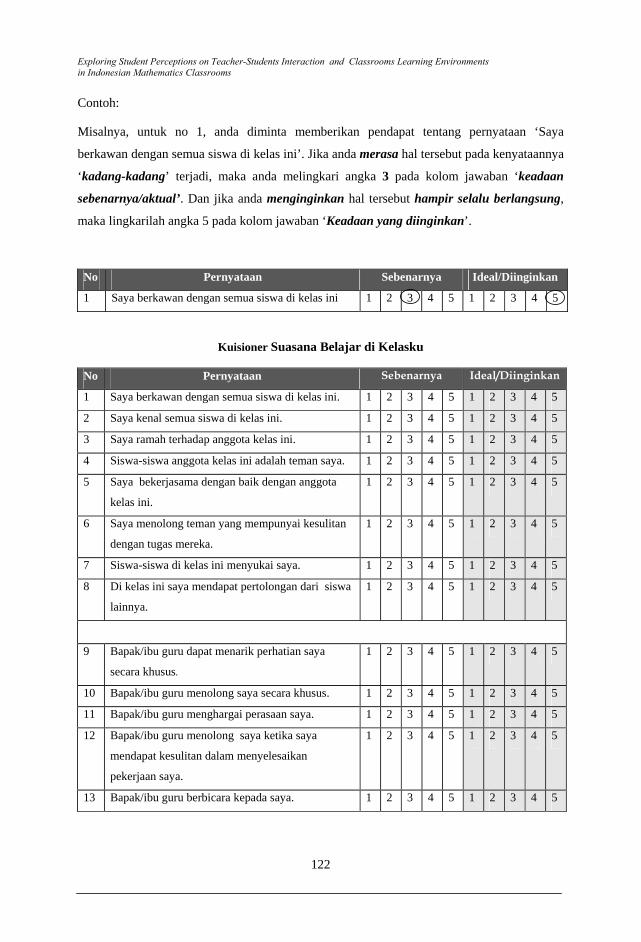
Exploring Student Perceptions on Teacher-Students Interaction and Classrooms Learning Environments in Indonesian Mathematics Classrooms
122
Contoh:
Misalnya, untuk no 1, anda diminta memberikan pendapat tentang pernyataan ‘Saya
berkawan dengan semua siswa di kelas ini’. Jika anda merasa hal tersebut pada kenyataannya
‘kadang-kadang’ terjadi, maka anda melingkari angka 3 pada kolom jawaban ‘keadaan
sebenarnya/aktual’. Dan jika anda menginginkan hal tersebut hampir selalu berlangsung,
maka lingkarilah angka 5 pada kolom jawaban ‘Keadaan yang diinginkan’.
No Pernyataan Sebenarnya Ideal/Diinginkan 1 Saya berkawan dengan semua siswa di kelas ini 1 2 3 4 5 1 2 3 4 5
Kuisioner Suasana Belajar di Kelasku
No Pernyataan Sebenarnya Ideal/Diinginkan
1 Saya berkawan dengan semua siswa di kelas ini. 1 2 3 4 5 1 2 3 4 5
2 Saya kenal semua siswa di kelas ini. 1 2 3 4 5 1 2 3 4 5
3 Saya ramah terhadap anggota kelas ini. 1 2 3 4 5 1 2 3 4 5
4 Siswa-siswa anggota kelas ini adalah teman saya. 1 2 3 4 5 1 2 3 4 5
5 Saya bekerjasama dengan baik dengan anggota
kelas ini. 1 2 3 4 5 1 2 3 4 5
6 Saya menolong teman yang mempunyai kesulitan
dengan tugas mereka. 1 2 3 4 5 1 2 3 4 5
7 Siswa-siswa di kelas ini menyukai saya. 1 2 3 4 5 1 2 3 4 5
8 Di kelas ini saya mendapat pertolongan dari siswa
lainnya. 1 2 3 4 5 1 2 3 4 5
9 Bapak/ibu guru dapat menarik perhatian saya
secara khusus. 1 2 3 4 5 1 2 3 4 5
10 Bapak/ibu guru menolong saya secara khusus. 1 2 3 4 5 1 2 3 4 5 11 Bapak/ibu guru menghargai perasaan saya. 1 2 3 4 5 1 2 3 4 5
12 Bapak/ibu guru menolong saya ketika saya
mendapat kesulitan dalam menyelesaikan
pekerjaan saya.
1 2 3 4 5 1 2 3 4 5
13 Bapak/ibu guru berbicara kepada saya. 1 2 3 4 5 1 2 3 4 5
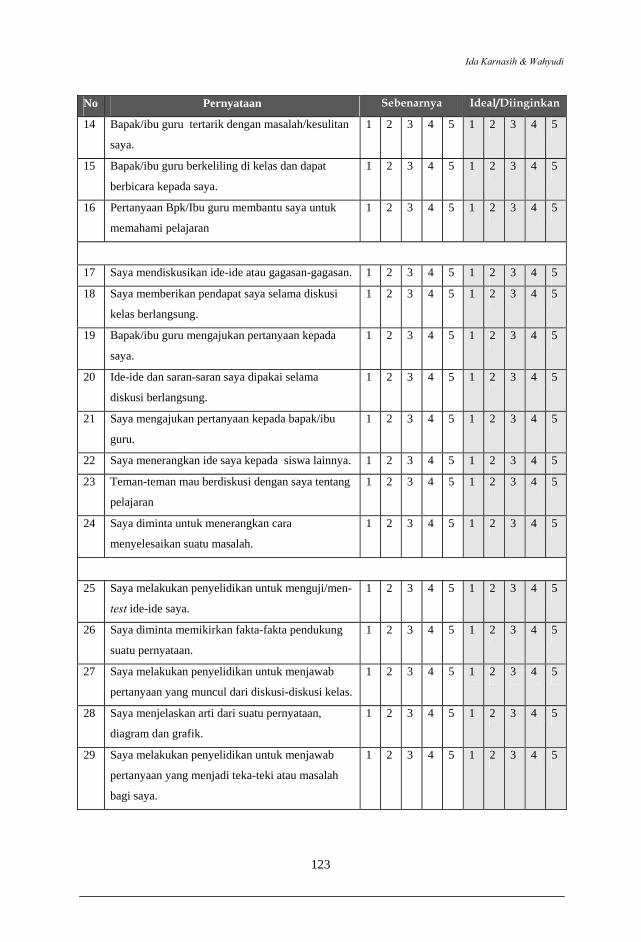
Ida Karnasih & Wahyudi
123
No Pernyataan Sebenarnya Ideal/Diinginkan
14 Bapak/ibu guru tertarik dengan masalah/kesulitan
saya. 1 2 3 4 5 1 2 3 4 5
15 Bapak/ibu guru berkeliling di kelas dan dapat
berbicara kepada saya. 1 2 3 4 5 1 2 3 4 5
16 Pertanyaan Bpk/Ibu guru membantu saya untuk
memahami pelajaran 1 2 3 4 5 1 2 3 4 5
17 Saya mendiskusikan ide-ide atau gagasan-gagasan. 1 2 3 4 5 1 2 3 4 5
18 Saya memberikan pendapat saya selama diskusi
kelas berlangsung. 1 2 3 4 5 1 2 3 4 5
19 Bapak/ibu guru mengajukan pertanyaan kepada
saya. 1 2 3 4 5 1 2 3 4 5
20 Ide-ide dan saran-saran saya dipakai selama
diskusi berlangsung. 1 2 3 4 5 1 2 3 4 5
21 Saya mengajukan pertanyaan kepada bapak/ibu
guru. 1 2 3 4 5 1 2 3 4 5
22 Saya menerangkan ide saya kepada siswa lainnya. 1 2 3 4 5 1 2 3 4 5
23 Teman-teman mau berdiskusi dengan saya tentang
pelajaran 1 2 3 4 5 1 2 3 4 5
24 Saya diminta untuk menerangkan cara
menyelesaikan suatu masalah. 1 2 3 4 5 1 2 3 4 5
25 Saya melakukan penyelidikan untuk menguji/men-
test ide-ide saya. 1 2 3 4 5 1 2 3 4 5
26 Saya diminta memikirkan fakta-fakta pendukung
suatu pernyataan. 1 2 3 4 5 1 2 3 4 5
27 Saya melakukan penyelidikan untuk menjawab
pertanyaan yang muncul dari diskusi-diskusi kelas. 1 2 3 4 5 1 2 3 4 5
28 Saya menjelaskan arti dari suatu pernyataan,
diagram dan grafik. 1 2 3 4 5 1 2 3 4 5
29 Saya melakukan penyelidikan untuk menjawab
pertanyaan yang menjadi teka-teki atau masalah
bagi saya.
1 2 3 4 5 1 2 3 4 5
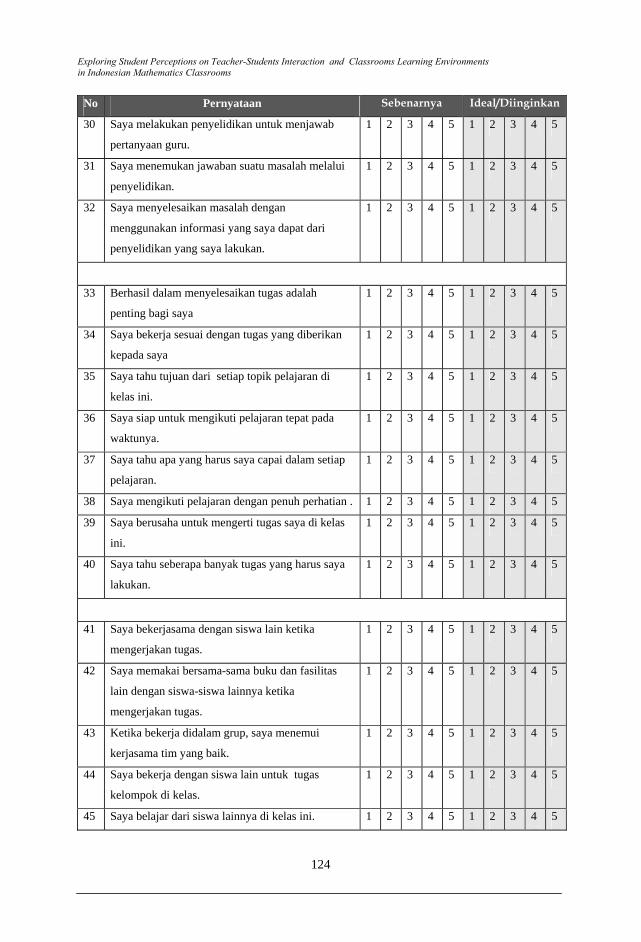
Exploring Student Perceptions on Teacher-Students Interaction and Classrooms Learning Environments in Indonesian Mathematics Classrooms
124
No Pernyataan Sebenarnya Ideal/Diinginkan
30 Saya melakukan penyelidikan untuk menjawab
pertanyaan guru. 1 2 3 4 5 1 2 3 4 5
31 Saya menemukan jawaban suatu masalah melalui
penyelidikan. 1 2 3 4 5 1 2 3 4 5
32 Saya menyelesaikan masalah dengan
menggunakan informasi yang saya dapat dari
penyelidikan yang saya lakukan.
1 2 3 4 5 1 2 3 4 5
33 Berhasil dalam menyelesaikan tugas adalah
penting bagi saya 1 2 3 4 5 1 2 3 4 5
34 Saya bekerja sesuai dengan tugas yang diberikan
kepada saya 1 2 3 4 5 1 2 3 4 5
35 Saya tahu tujuan dari setiap topik pelajaran di
kelas ini. 1 2 3 4 5 1 2 3 4 5
36 Saya siap untuk mengikuti pelajaran tepat pada
waktunya. 1 2 3 4 5 1 2 3 4 5
37 Saya tahu apa yang harus saya capai dalam setiap
pelajaran. 1 2 3 4 5 1 2 3 4 5
38 Saya mengikuti pelajaran dengan penuh perhatian . 1 2 3 4 5 1 2 3 4 5
39 Saya berusaha untuk mengerti tugas saya di kelas
ini. 1 2 3 4 5 1 2 3 4 5
40 Saya tahu seberapa banyak tugas yang harus saya
lakukan. 1 2 3 4 5 1 2 3 4 5
41 Saya bekerjasama dengan siswa lain ketika
mengerjakan tugas. 1 2 3 4 5 1 2 3 4 5
42 Saya memakai bersama-sama buku dan fasilitas
lain dengan siswa-siswa lainnya ketika
mengerjakan tugas.
1 2 3 4 5 1 2 3 4 5
43 Ketika bekerja didalam grup, saya menemui
kerjasama tim yang baik. 1 2 3 4 5 1 2 3 4 5
44 Saya bekerja dengan siswa lain untuk tugas
kelompok di kelas. 1 2 3 4 5 1 2 3 4 5
45 Saya belajar dari siswa lainnya di kelas ini. 1 2 3 4 5 1 2 3 4 5
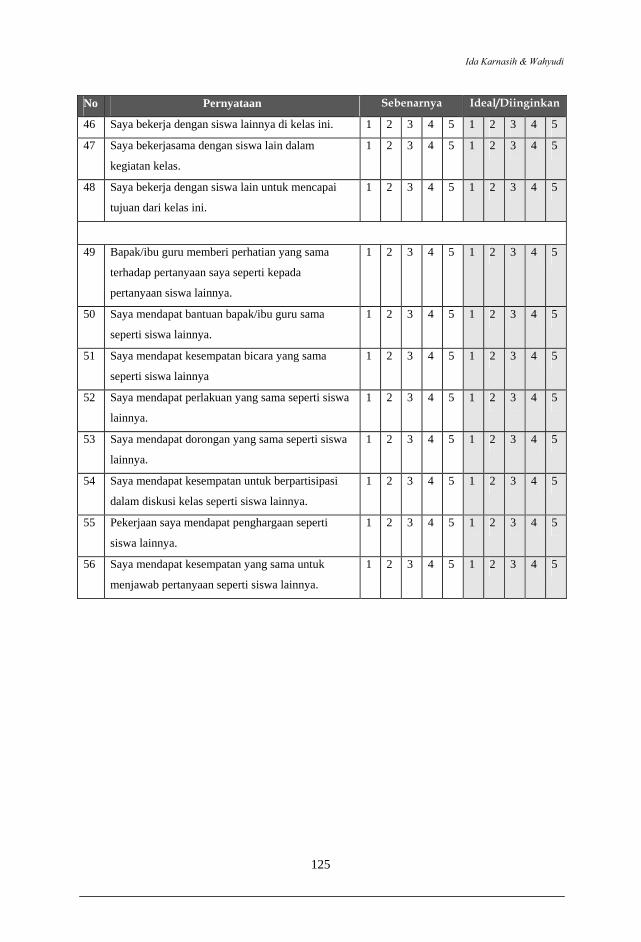
Ida Karnasih & Wahyudi
125
No Pernyataan Sebenarnya Ideal/Diinginkan
46 Saya bekerja dengan siswa lainnya di kelas ini. 1 2 3 4 5 1 2 3 4 5
47 Saya bekerjasama dengan siswa lain dalam
kegiatan kelas. 1 2 3 4 5 1 2 3 4 5
48 Saya bekerja dengan siswa lain untuk mencapai
tujuan dari kelas ini. 1 2 3 4 5 1 2 3 4 5
49 Bapak/ibu guru memberi perhatian yang sama
terhadap pertanyaan saya seperti kepada
pertanyaan siswa lainnya.
1 2 3 4 5 1 2 3 4 5
50 Saya mendapat bantuan bapak/ibu guru sama
seperti siswa lainnya. 1 2 3 4 5 1 2 3 4 5
51 Saya mendapat kesempatan bicara yang sama
seperti siswa lainnya 1 2 3 4 5 1 2 3 4 5
52 Saya mendapat perlakuan yang sama seperti siswa
lainnya. 1 2 3 4 5 1 2 3 4 5
53 Saya mendapat dorongan yang sama seperti siswa
lainnya. 1 2 3 4 5 1 2 3 4 5
54 Saya mendapat kesempatan untuk berpartisipasi
dalam diskusi kelas seperti siswa lainnya. 1 2 3 4 5 1 2 3 4 5
55 Pekerjaan saya mendapat penghargaan seperti
siswa lainnya. 1 2 3 4 5 1 2 3 4 5
56 Saya mendapat kesempatan yang sama untuk
menjawab pertanyaan seperti siswa lainnya. 1 2 3 4 5 1 2 3 4 5

Southeast Asian Mathematics Education Journal
2012, Vol. 2 No.2
INSTRUCTION FOR AUTHORS
It is important that authors follow these instructions before preparing a manuscript and submitting
to SEAMEJ. The manuscripts should be prepared in Microsoft Word and sent to
[email protected] and [email protected] in an e-mail attachment. Submissions must
be in English based on the style outlined by American Psychological Association (5th edition).
Documents that are not in compliance with the Journal’s submission criteria will be returned to the
sender for corrections. Each manuscript should have the following items placed in the order given:
Cover Page
Include the authors’ names and affiliations, addresses, phone numbers, fax numbers and e-mails as
well as corresponding author information.
Second page
Include an abstract of up to 250 words and identify up-to-five keywords.
Third page
This page should include the title at the top of the page and centered. Note that you should not
include the author information in the main body of the text. Manuscripts should not exceed 30
double-spaced pages in length. They should be prepared on (A4) pages with margins of at least
2.5cm (1 inch) from each side.
References
The full references should be listed in alphabetical order at the end of the main text and should be
aligned with the criteria set by American Psychological Association (APA) (Fifth Edition).
Tables and Figures
Tables and figures should follow the references. Each table and figure should be placed in a separate
page with the appropriate number and headings. Both tables and figures should be referred to in
appropriate places in the text. Tables should be double-spaced and should not include any
inside/outside borders. Sources of information and table notes should be given under the table and
should be double-spaced.
Miscellaneous
Author(s) should write for an international audience. When the article is accepted, author(s) will be
asked to provide a final version of the article formatted in Windows MS Word.