southeast asian american statistical profile · southeast asian american statistical profile 11...
TRANSCRIPT

Southeast Asian American
Statistical Profile
S O U T H E A S T A S I A R E S O U R C E A C T I O N C E N T E R
( S E A R A C )2004

2 Southeast Asian American Statistical Profile
Preferred Citation:Max Niedzwiecki and TC Duong. 2004. Southeast Asian American Statistical Profile. Washington, DC:
Southeast Asia Resource Action Center (SEARAC).
ISBN 0-9725637-2-5
Produced By:Southeast Asia Resource Action Center (SEARAC)
1628 16th Street, NWWashington, DC 20009
Tel: 202/667-4690Fax: 202/667-6449
E-mail: [email protected]: www.searac.org
SEARAC’s Mission:The Southeast Asia Resource Action Center (SEARAC), founded in 1979, is a national organization working to
advance the interests of Cambodian, Laotian, and Vietnamese Americans through leadership development,capacity building, and community empowerment.
The Authors Wish to Thank the Following People Who Helped With This Publication:Eloise Needleman, SEARAC
Sophy Pich, SEARACBrian Ray, Migration Policy Institute (MPI)
Naomi Steinberg, SEARACKaYing Yang, SEARAC
Note: Unless otherwise noted, all 2000 Census figures are for “Asian detailed group alone or in any combination.”
Funding Generously Provided By:The Joyce Foundation
AndThe Ford Foundation
AndWashington Mutual
Printed on Recycled Paper
3Southeast Asian American Statistical Profile
“Southeast Asian Americans”Include People from the Following Countries and Ethnic Groups:
Cambodia:Khmer (ethnic Cambodian): Most populous group
Cham (a Moslem minority group)Khmer Loeu (“Highland Khmer”)
Laos:Hmong (or Mong)
Lao (Lao Loum, “Lowland Lao”)Iu Mien (or Mien)
KhmuTaidam
And many other ethnic groups …Note: “Laotian” generally refers to all people with roots in Laos, except for Hmong
Vietnam:Vietnamese: Most populous group
Khmer Kampuchea Krom (ethnic Khmer)Montagnards (Highlanders from diverse ethnic minorities)
Ethnic Chinese also come from all three Southeast Asian Countries
4 Southeast Asian American Statistical Profile
Southeast Asian Americans:
P O P U L A T I O N ,I M M I G R A T I O N A N DN A T U R A L I Z A T I O N

5Southeast Asian American Statistical Profile
Southeast Asian Americans Reporting One or More Ethnic/Racial DesignationState Cambodian Hmong Laotian Vietnamese TotalAlabama 593 11 1,023 5,242 6,869Alaska 178 321 1,515 1,050 3,064Arizona 1,406 36 1,243 14,533 17,218Arkansas 36 33 3,256 4,392 7,717California 84,559 71,741 65,058 484,023 705,381Colorado 1,839 3,351 2,543 17,108 24,841Connecticut 2,790 163 3,267 8,271 14,491Delaware 36 1 130 893 1,060DC 47 6 62 2,035 2,150Florida 3,040 163 4,126 37,086 44,415Georgia 3,405 1,615 5,220 31,092 41,332Hawaii 330 22 2,437 10,040 12,829Idaho 86 45 597 1,511 2,239Illinois 3,516 604 5,973 21,212 31,305Indiana 695 172 1,138 5,540 7,545Iowa 803 303 4,778 7,803 13,687Kansas 896 1,118 3,926 12,616 18,556Kentucky 369 17 378 4,019 4,783Louisiana 450 23 1,511 25,601 27,585Maine 1,298 3 109 1,571 2,981Maryland 2,239 15 772 18,086 21,112Massachusetts 22,886 1,303 4,449 36,685 65,323Michigan 1,602 5,998 3,846 15,232 26,678Minnesota 6,533 45,443 11,516 20,570 84,062Mississippi 78 9 111 5,729 5,927Missouri 880 26 840 11,654 13,400Montana 12 229 85 293 619Nebraska 142 108 1,078 6,755 8,083Nevada 631 117 1,421 5,428 7,597New Hampshire 375 21 513 1,900 2,809New Jersey 868 27 629 16,707 18,231New Mexico 71 15 457 3,637 4,180New York 3,740 281 3,715 27,105 34,841North Carolina 2,681 7,982 6,282 17,142 34,087North Dakota 50 4 27 560 641Ohio 3,161 407 3,277 11,219 18,064Oklahoma 330 579 1,216 13,673 15,798Oregon 3,173 2,298 5,176 20,709 31,356Pennsylvania 10,207 844 2,536 33,204 46,791Rhode Island 5,290 1,112 3,507 1,134 11,043South Carolina 644 570 1,040 4,758 7,012South Dakota 84 42 295 708 1,129Tennessee 1,304 164 4,761 7,739 13,968Texas 8,225 422 11,626 143,352 163,625Utah 1,663 190 2,715 6,742 11,310Vermont 107 5 99 1,080 1,291Virginia 5,180 55 3,076 40,500 48,811Washington 16,630 1,485 9,382 50,697 78,194West Virginia 15 2 40 467 524Wisconsin 856 36,809 5,405 4,505 47,575Wyoming 23 0 21 128 172Totals 206,052 186,310 198,203 1,223,736 1,814,301
Source: 2000 Census
© 2003 Southeast Asia Resource Action Center (www.searac.org).Please acknowledge SEARAC when copying or making use of the information in this document.
6 Southeast Asian American Statistical Profile
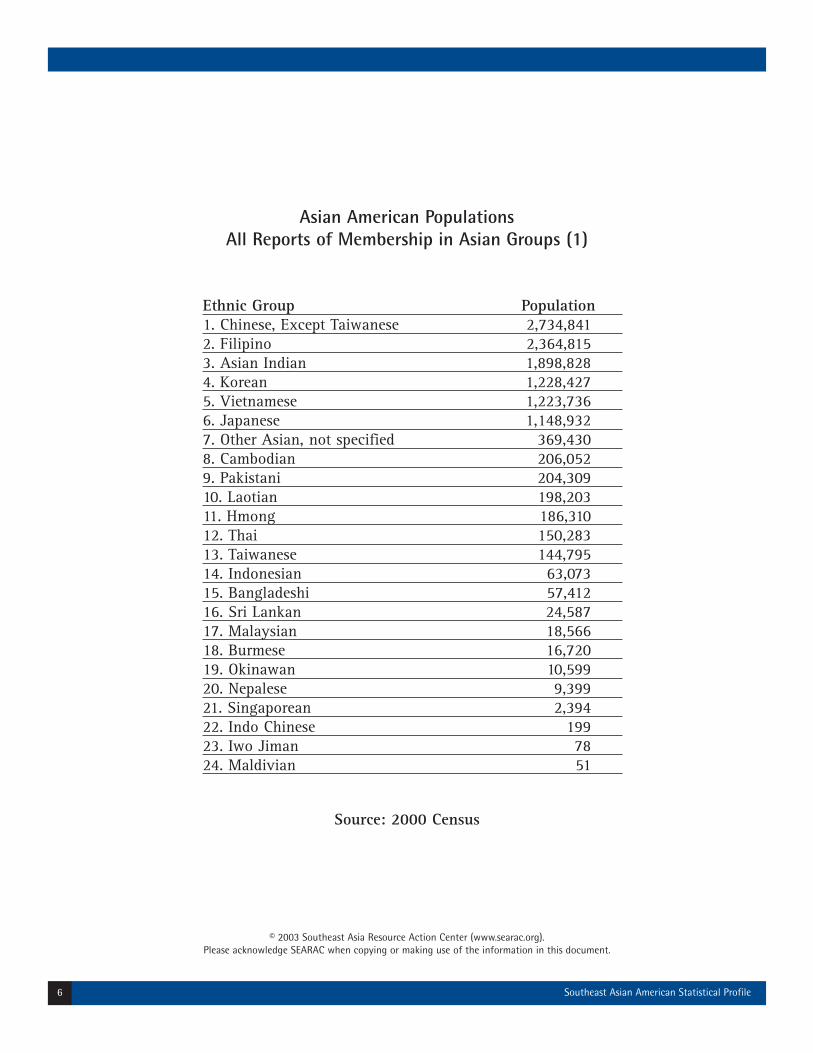
Asian American PopulationsAll Reports of Membership in Asian Groups (1)
Ethnic Group Population1. Chinese, Except Taiwanese 2,734,8412. Filipino 2,364,8153. Asian Indian 1,898,8284. Korean 1,228,4275. Vietnamese 1,223,7366. Japanese 1,148,9327. Other Asian, not specified 369,4308. Cambodian 206,0529. Pakistani 204,30910. Laotian 198,20311. Hmong 186,31012. Thai 150,28313. Taiwanese 144,79514. Indonesian 63,07315. Bangladeshi 57,41216. Sri Lankan 24,58717. Malaysian 18,56618. Burmese 16,72019. Okinawan 10,59920. Nepalese 9,39921. Singaporean 2,39422. Indo Chinese 19923. Iwo Jiman 7824. Maldivian 51
Source: 2000 Census
© 2003 Southeast Asia Resource Action Center (www.searac.org).Please acknowledge SEARAC when copying or making use of the information in this document.
7Southeast Asian American Statistical Profile
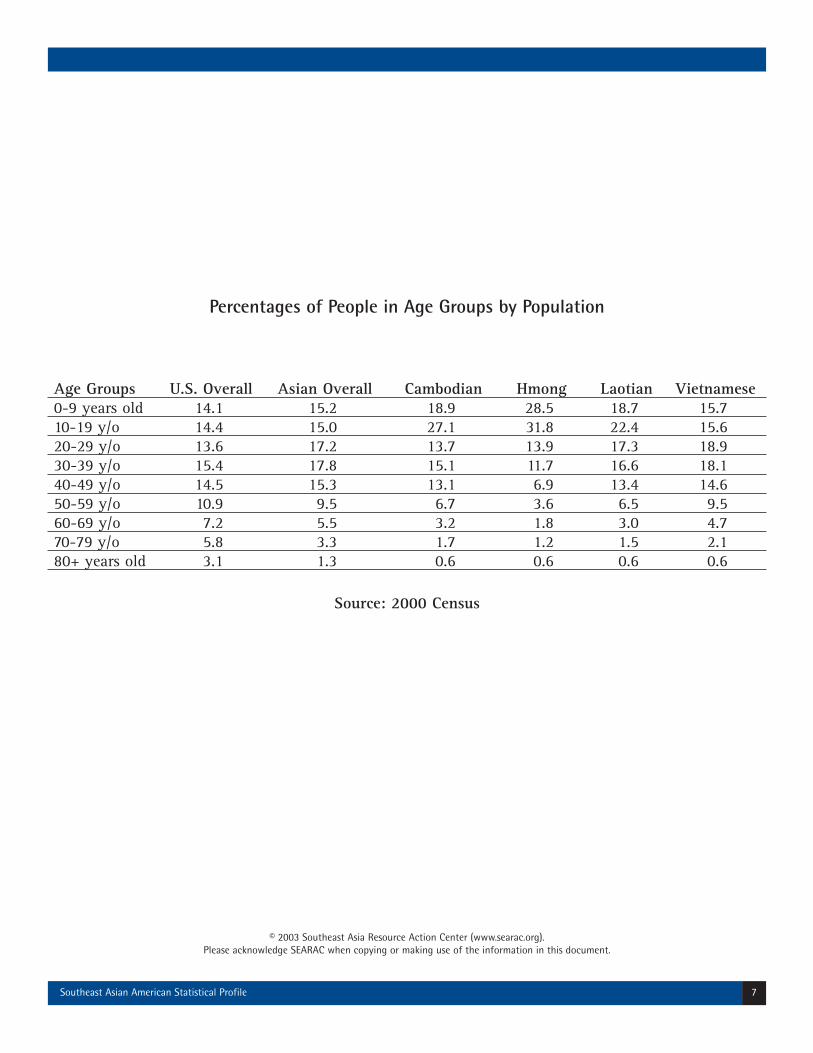
Percentages of People in Age Groups by Population
Age Groups U.S. Overall Asian Overall Cambodian Hmong Laotian Vietnamese0-9 years old 14.1 15.2 18.9 28.5 18.7 15.710-19 y/o 14.4 15.0 27.1 31.8 22.4 15.620-29 y/o 13.6 17.2 13.7 13.9 17.3 18.930-39 y/o 15.4 17.8 15.1 11.7 16.6 18.140-49 y/o 14.5 15.3 13.1 6.9 13.4 14.650-59 y/o 10.9 9.5 6.7 3.6 6.5 9.560-69 y/o 7.2 5.5 3.2 1.8 3.0 4.770-79 y/o 5.8 3.3 1.7 1.2 1.5 2.180+ years old 3.1 1.3 0.6 0.6 0.6 0.6
Source: 2000 Census
© 2003 Southeast Asia Resource Action Center (www.searac.org).Please acknowledge SEARAC when copying or making use of the information in this document.
8 Southeast Asian American Statistical Profile
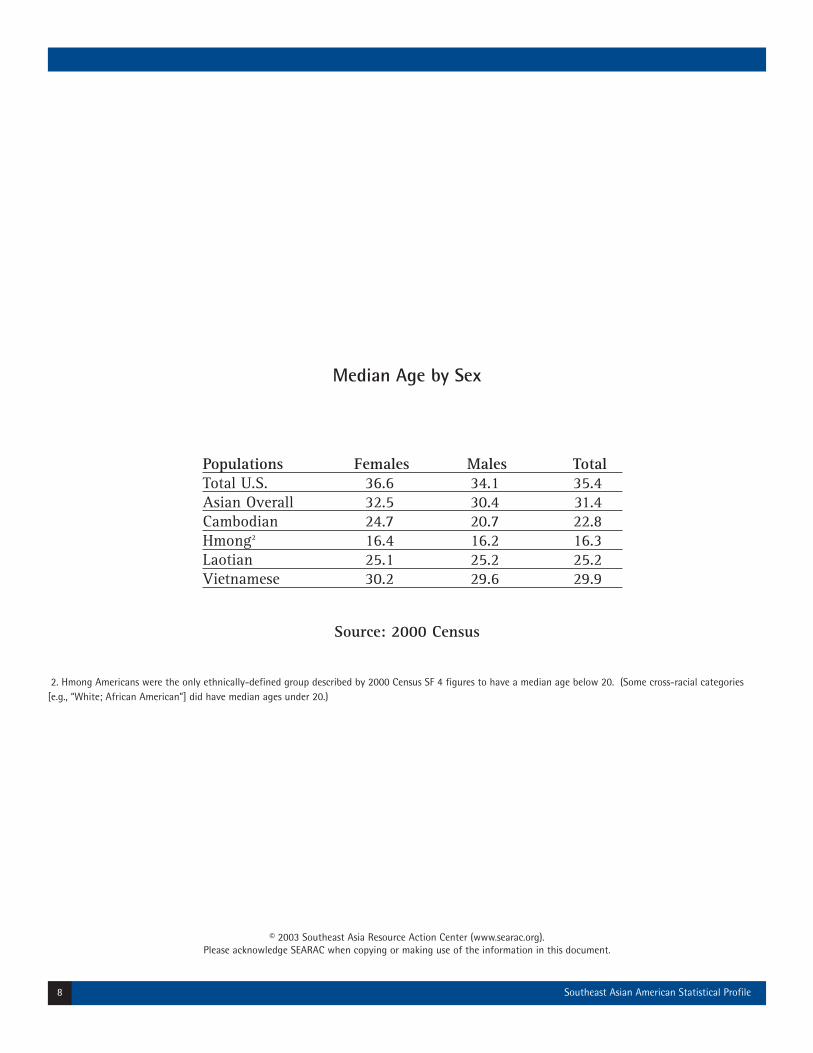
Median Age by Sex
Populations Females Males TotalTotal U.S. 36.6 34.1 35.4Asian Overall 32.5 30.4 31.4Cambodian 24.7 20.7 22.8Hmong2 16.4 16.2 16.3Laotian 25.1 25.2 25.2Vietnamese 30.2 29.6 29.9
Source: 2000 Census
2. Hmong Americans were the only ethnically-defined group described by 2000 Census SF 4 figures to have a median age below 20. (Some cross-racial categories[e.g., “White; African American”] did have median ages under 20.)

© 2003 Southeast Asia Resource Action Center (www.searac.org).Please acknowledge SEARAC when copying or making use of the information in this document.
9Southeast Asian American Statistical Profile
Immigrants (Excluding Refugees and Asylees) Admitted to the U.S. from Southeast Asia,Fiscal Years 1951 through 20013
Fiscal Years Cambodia Laos Vietnam Total1951-1970 96 227 4,675 4,9981971 21 24 2,038 2,0831972 39 35 3,412 3,4861973 66 46 4,569 4,6811974 40 61 3,192 3,2931975 98 96 3,039 3,2331976 126 163 4,230 4,5191977 126 237 4,629 4,9921978 * * 2,892 2,8921979 * * 2,065 2,0651980 148 179 4,510 4,8371981 113 78 2,238 2,4291982 129 130 3,030 3,2891983 163 159 3,275 3,5971984 193 185 5,203 5,5811985 198 212 5,120 5,5301986 9,013 4,239 15,256 28,5081987 8,494 3,557 11,489 23,5401988 7,098 6,037 14,231 27,3661989 4,425 6,973 25,957 37,3551990 3,577 6,364 37,773 47,7141991 2,564 5,792 43,939 52,2951992 878 670 45,580 47,1281993 831 738 29,365 30,9341994 847 607 14,027 15,4811995 1,224 572 13,157 14,9531996 1,358 692 12,367 14,4171997 1,475 572 16,222 18,2691998 1,377 502 12,728 14,6071999 1,361 471 15,890 17,7222000 2,106 672 21,171 23,9492001 2,398 896 25,180 28,474Totals 50,582 41,186 412,449 504,217
3. All figures in this table are from the Statistical Yearbook of the Immigration and Naturalization Service, fiscal years 1980 through 2000, except the following: (1) fig-ures for fiscal year 2001 are from the INS website (www.ins.gov); (2) figures for 1978 and 1979 are from Rumbaut (2000: 182). Reliable figures for Cambodia andVietnam for 1978 and 1979 are unavailable. These figures include Amerasians. Figures for fiscal years 1980 through 2001 have been adjusted to reflect the fact that“immigrant arrival” statistics record the number of people granted “immigrant” (or “permanent resident alien”) status for the given year, and do not represent only newarrivals to the U.S. Figures in this table for the years 1980 through 2001 were derived by subtracting INS “refugee and asylee adjustment” numbers from the “immi-grant” numbers.Sources: (1) Immigration and Naturalization Service (INS). 1981-2001. Statistical Yearbook of the Immigration and Naturalization Service (fiscal years 1980-2000).Washington, DC: Immigration and Naturalization Service, U.S. Department of Justice. (2) Immigration and Naturalization Service (INS) website: www.ins.gov. (3)Rumbaut, Rubén G. 2000. Vietnamese, Laotian, and Cambodian Americans. In Contemporary Asian America: A Multidisciplinary Reader. Edited by Min Zhou andJames V. Gatewood. New York, NY: New York University Press. Pp. 175-206.

© 2003 Southeast Asia Resource Action Center (www.searac.org).Please acknowledge SEARAC when copying or making use of the information in this document.
10 Southeast Asian American Statistical Profile
Refugee Arrivals to the U.S. From Southeast Asia,Fiscal Years 1975-20024
Fiscal Year Cambodia Laos Vietnam Total1975 4,600 800 125,000 130,4001976 1,100 10,200 3,200 14,5001977 300 400 1,900 2,6001978 1,300 8,000 11,100 20,4001979 6,000 30,200 44,500 80,7001980 16,000 55,500 95,200 166,7001981 38,194 19,777 65,279 123,2501982 6,246 3,616 27,396 37,2581983 13,041 2,907 22,819 38,7671984 19,727 7,218 24,856 51,8011985 19,175 5,195 25,222 49,5921986 9,845 12,313 21,700 43,8581987 1,786 13,394 19,656 34,8361988 2,897 14,597 17,571 35,0651989 2,162 12,560 21,924 36,6461990 2,329 8,715 27,797 38,8411991 179 9,232 28,396 37,8071992 163 7,285 26,795 34,2431993 63 6,944 31,401 38,4081994 15 6,211 34,110 40,3361995 6 3,682 32,250 35,9381996 5 2,203 16,107 18,3151997 9 915 6,612 7,5361998 7 9 10,266 10,2821999 0 19 9,622 9,6412000 0 64 2,839 2,9032001 23 22 3,109 3,1542002 0 18 2,855 2,873Totals 145,172 241,996 759,482 1,146,650
4. Sources: (1) Office of Refugee Resettlement. 1982-2001. Annual Reports to Congress (fiscal years 1981-2000). Washington, DC: Office of Refugee Resettlement,Administration for Children and Families, U.S. Department of Health and Human Services. (2) FY 2001 and 2002 figures (2002 from "preliminary data") are from theBureau of Population, Refugees, and Migration, U.S. Department of State. Tabulated and presented in Refugee Reports December 31, 2002. (3) Refugee arrival statis-tics for FY 1975-1980 are from Rumbaut (2000: 182).

© 2003 Southeast Asia Resource Action Center (www.searac.org).Please acknowledge SEARAC when copying or making use of the information in this document.
11Southeast Asian American Statistical Profile
People from Cambodia, Laos, and VietnamNaturalized as U.S. Citizens, Fiscal Years 1987-2001
Fiscal Year Cambodia Laos Vietnam Total1987 2,816 3,159 25,469 31,4441988 3,132 3,480 21,636 28,2481989 3,234 3,463 19,357 26,0541990 3,525 3,329 22,027 28,8811991 4,851 3,887 30,078 38,8161992 2,713 3,080 18,422 24,2151993 3,102 3,994 22,520 29,6161994 4,132 5,630 29,555 39,3171995 3,319 4,315 31,728 39,3621996 5,202 10,621 51,910 67,7331997 5,180 8,630 36,178 49,9881998 5,348 7,734 30,185 43,2671999 7,140 9,188 53,316 69,6442000 5,292 7,163 55,934 68,3892001 3,489 6,507 41,596 51,592Totals 62,475 84,180 489,911 636,566
Sources: Statistical Yearbook of the Immigration and Naturalization Source(Fiscal Years 1986-2001) and www.ins.gov

© 2003 Southeast Asia Resource Action Center (www.searac.org).Please acknowledge SEARAC when copying or making use of the information in this document.
12 Southeast Asian American Statistical Profile
Percentages of Foreign-Born PeopleNaturalized as U.S. Citizens
Populations Females Males Females & MalesTotal U.S. 43.0 37.6 40.3All Asians 50.6 49.0 49.9Cambodian 42.7 49.1 45.7Hmong 29.7 33.3 31.5Laotian 46.3 49.7 48.0Vietnamese 55.9 60.4 58.2
Source: 2000 Census

© 2003 Southeast Asia Resource Action Center (www.searac.org).Please acknowledge SEARAC when copying or making use of the information in this document.
13Southeast Asian American Statistical Profile
People Reporting Southeast Asian HeritageBorn in the United States
Population NumberCambodian 69,207Hmong 83,537Laotian 68,715Vietnamese 332,361Total 553,820
Source: 2000 Census

14 Southeast Asian American Statistical Profile
Southeast Asian Americans:
E D U C A T I O N
© 2003 Southeast Asia Resource Action Center (www.searac.org).Please acknowledge SEARAC when copying or making use of the information in this document.
15Southeast Asian American Statistical Profile
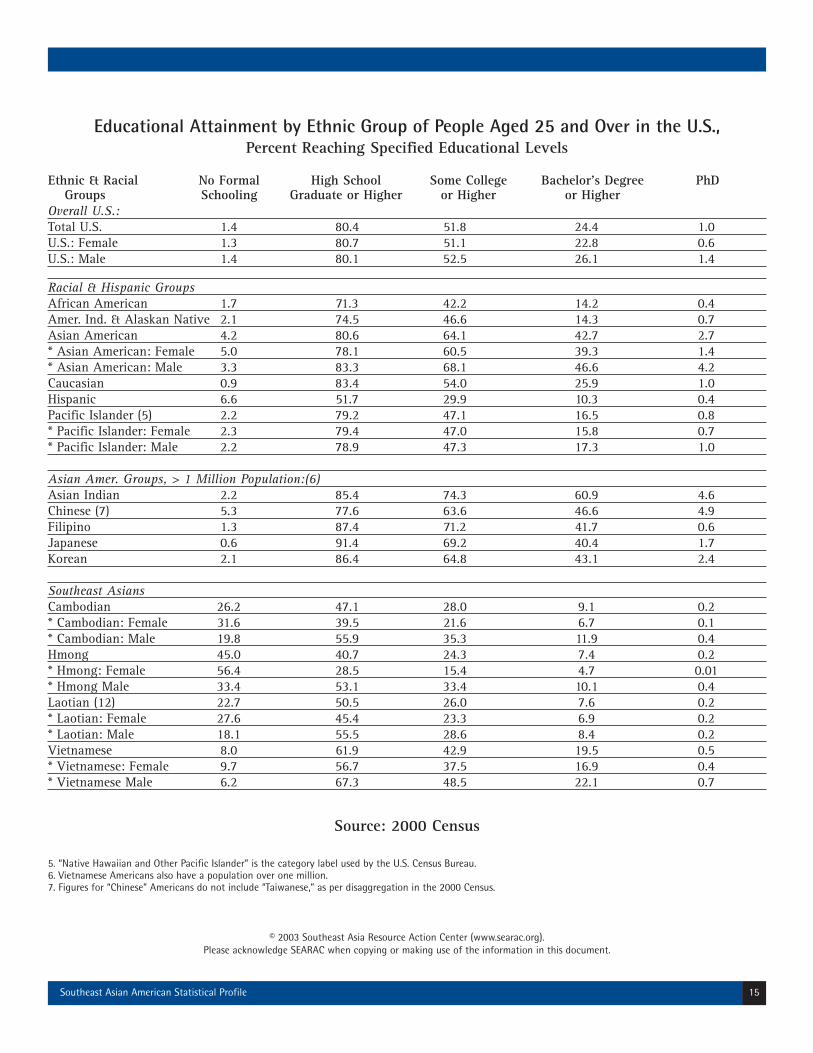
Educational Attainment by Ethnic Group of People Aged 25 and Over in the U.S., Percent Reaching Specified Educational Levels
Ethnic & Racial No Formal High School Some College Bachelor’s Degree PhDGroups Schooling Graduate or Higher or Higher or Higher
Overall U.S.:Total U.S. 1.4 80.4 51.8 24.4 1.0U.S.: Female 1.3 80.7 51.1 22.8 0.6U.S.: Male 1.4 80.1 52.5 26.1 1.4
Racial & Hispanic GroupsAfrican American 1.7 71.3 42.2 14.2 0.4Amer. Ind. & Alaskan Native 2.1 74.5 46.6 14.3 0.7Asian American 4.2 80.6 64.1 42.7 2.7* Asian American: Female 5.0 78.1 60.5 39.3 1.4* Asian American: Male 3.3 83.3 68.1 46.6 4.2Caucasian 0.9 83.4 54.0 25.9 1.0Hispanic 6.6 51.7 29.9 10.3 0.4Pacific Islander (5) 2.2 79.2 47.1 16.5 0.8* Pacific Islander: Female 2.3 79.4 47.0 15.8 0.7* Pacific Islander: Male 2.2 78.9 47.3 17.3 1.0
Asian Amer. Groups, > 1 Million Population:(6)Asian Indian 2.2 85.4 74.3 60.9 4.6Chinese (7) 5.3 77.6 63.6 46.6 4.9Filipino 1.3 87.4 71.2 41.7 0.6Japanese 0.6 91.4 69.2 40.4 1.7Korean 2.1 86.4 64.8 43.1 2.4
Southeast AsiansCambodian 26.2 47.1 28.0 9.1 0.2* Cambodian: Female 31.6 39.5 21.6 6.7 0.1* Cambodian: Male 19.8 55.9 35.3 11.9 0.4Hmong 45.0 40.7 24.3 7.4 0.2* Hmong: Female 56.4 28.5 15.4 4.7 0.01* Hmong Male 33.4 53.1 33.4 10.1 0.4Laotian (12) 22.7 50.5 26.0 7.6 0.2* Laotian: Female 27.6 45.4 23.3 6.9 0.2* Laotian: Male 18.1 55.5 28.6 8.4 0.2Vietnamese 8.0 61.9 42.9 19.5 0.5* Vietnamese: Female 9.7 56.7 37.5 16.9 0.4* Vietnamese Male 6.2 67.3 48.5 22.1 0.7
Source: 2000 Census
5. “Native Hawaiian and Other Pacific Islander” is the category label used by the U.S. Census Bureau.6. Vietnamese Americans also have a population over one million.7. Figures for “Chinese” Americans do not include “Taiwanese,” as per disaggregation in the 2000 Census.

© 2003 Southeast Asia Resource Action Center (www.searac.org).Please acknowledge SEARAC when copying or making use of the information in this document.
16 Southeast Asian American Statistical Profile
College Graduation Rates for People in U.S. Aged 25 and Over
Percentage Who Held Population Bachelor’s DegreesU.S. Overall 21Asian Americans 38Cambodian Americans 6Hmong Americans 3Laotian Americans 7Vietnamese Americans 17
Source: 1990 Census

© 2003 Southeast Asia Resource Action Center (www.searac.org).Please acknowledge SEARAC when copying or making use of the information in this document.
17Southeast Asian American Statistical Profile
Educational Attainment by Birthplace of People Aged 25 and Over in the 100 Largest Cities in the U.S.8
Percent Reaching Specified Educational Levels
No Formal High School Some College Bachelor’s Degree PhDBirthplace Schooling Graduate or Higher or Higher or HigherTotal Population 1.7 80.7 54.9 27.7 1.1* Total: Female 1.7 80.7 53.8 25.7 0.7* Total: Male 1.7 80.7 56.4 30.0 1.6
USA 0.6 85.6 58.2 28.8 1.0* USA: Female 0.6 85.4 56.7 26.6 0.6* USA: Male 0.7 85.6 59.5 31.2 1.4
Africa 2.7 86.8 67.8 42.0 2.5
Europe & Canada 1.8 77.8 54.3 31.0 2.6
Mexico 11.4 30.4 14.4 4.5 0.1
Total Asia 5.8 71.3 51.1 26.4 3.5Western Asia (9) 3.4 79.6 60.2 39.1 2.6East Asia 4.0 80.6 62.7 44.4 4.1South Asia 2.1 86.7 76.0 63.8 4.3
Oceania 1.9 80.5 53.2 24.7 1.8
Southeast Asia: (10)Burma/Myanmar 5.9 76.7 68.8 50.7 0.8Cambodia 23.6 50.6 32.2 11.4 0.5* Camb.: Female 29.6 41.1 26.1 8.1 -* Camb.: Male 16.9 61.2 39.1 15.0 1.0Indonesia 1.0 90.5 75.2 45.0 1.2Laos 30.8 45.7 26.7 9.4 0.1* Laos: Female 36.2 37.4 21.6 8.0 0.2* Laos: Male 25.6 53.4 31.4 10.5 -Malaysia 1.8 79.0 63.3 44.1 3.9Philippines 1.5 86.7 72.8 44.9 0.6Singapore - 96.4 80.6 57.7 2.6Thailand 3.5 79.2 63.6 40.6 0.6Vietnam 8.4 61.9 43.9 20.2 0.5* VN: Female 10.0 56.9 38.2 16.8 0.5* VN: Male 6.8 66.8 49.7 23.4 0.6
8. Data from the Public Use Microdata Files (PUMS), 2000 Census. Many thanks to Dr. Brian Ray of the Migration Policy Institute (MPI) for help in accessing andintepreting these data. MPI is accessible at http://www.migrationpolicy.org/. 9. “Western Asia” includes the regions more commonly known as the “Middle East” and “Central Asia.”10. Since there was only one person in the sample from Brunei, that country is omitted here.

© 2003 Southeast Asia Resource Action Center (www.searac.org).Please acknowledge SEARAC when copying or making use of the information in this document.
18 Southeast Asian American Statistical Profile
Percentages of Households in Southeast Asian American and Other Populations
That are “Linguistically Isolated”11
Percentages of Households Populations that Are “Linguistically Isolated”Total U.S.A. 4.1Asian Overall 24.7Cambodian 31.8Hmong 35.1Laotian 31.8Vietnamese 45.0
Source: 2000 Census
11. “A linguistically isolated household is one in which no member 14 years old and over (1) speaks only English or (2) speaks a non-English language and speaksEnglish ‘very well.’ In other words, all members 14 years old and over have at least some difficulty with English.” (Source: www.census.gov, 10/31/03.)
© 2003 Southeast Asia Resource Action Center (www.searac.org).Please acknowledge SEARAC when copying or making use of the information in this document.
19Southeast Asian American Statistical Profile
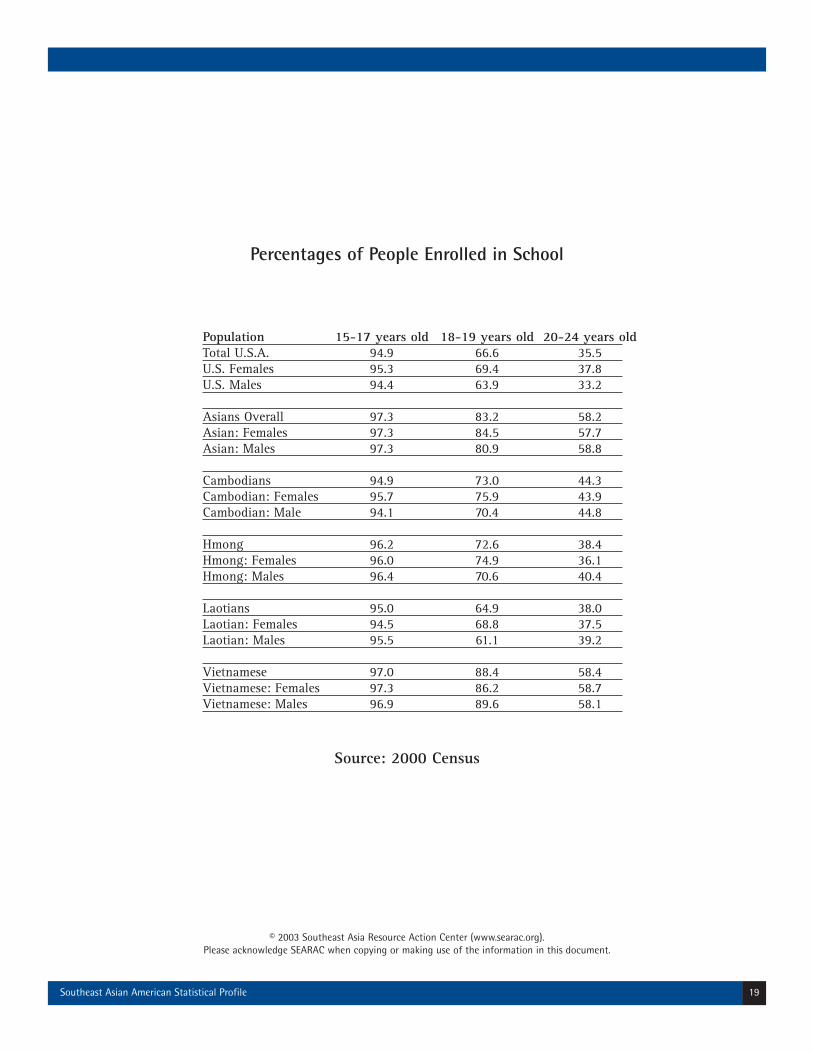
Percentages of People Enrolled in School
Population 15-17 years old 18-19 years old 20-24 years oldTotal U.S.A. 94.9 66.6 35.5U.S. Females 95.3 69.4 37.8U.S. Males 94.4 63.9 33.2
Asians Overall 97.3 83.2 58.2Asian: Females 97.3 84.5 57.7Asian: Males 97.3 80.9 58.8
Cambodians 94.9 73.0 44.3Cambodian: Females 95.7 75.9 43.9Cambodian: Male 94.1 70.4 44.8
Hmong 96.2 72.6 38.4Hmong: Females 96.0 74.9 36.1Hmong: Males 96.4 70.6 40.4
Laotians 95.0 64.9 38.0Laotian: Females 94.5 68.8 37.5Laotian: Males 95.5 61.1 39.2
Vietnamese 97.0 88.4 58.4Vietnamese: Females 97.3 86.2 58.7Vietnamese: Males 96.9 89.6 58.1
Source: 2000 Census

20 Southeast Asian American Statistical Profile
Southeast Asian Americans:
I N C O M E A N DE M P L O Y M E N T
© 2003 Southeast Asia Resource Action Center (www.searac.org).Please acknowledge SEARAC when copying or making use of the information in this document.
21Southeast Asian American Statistical Profile
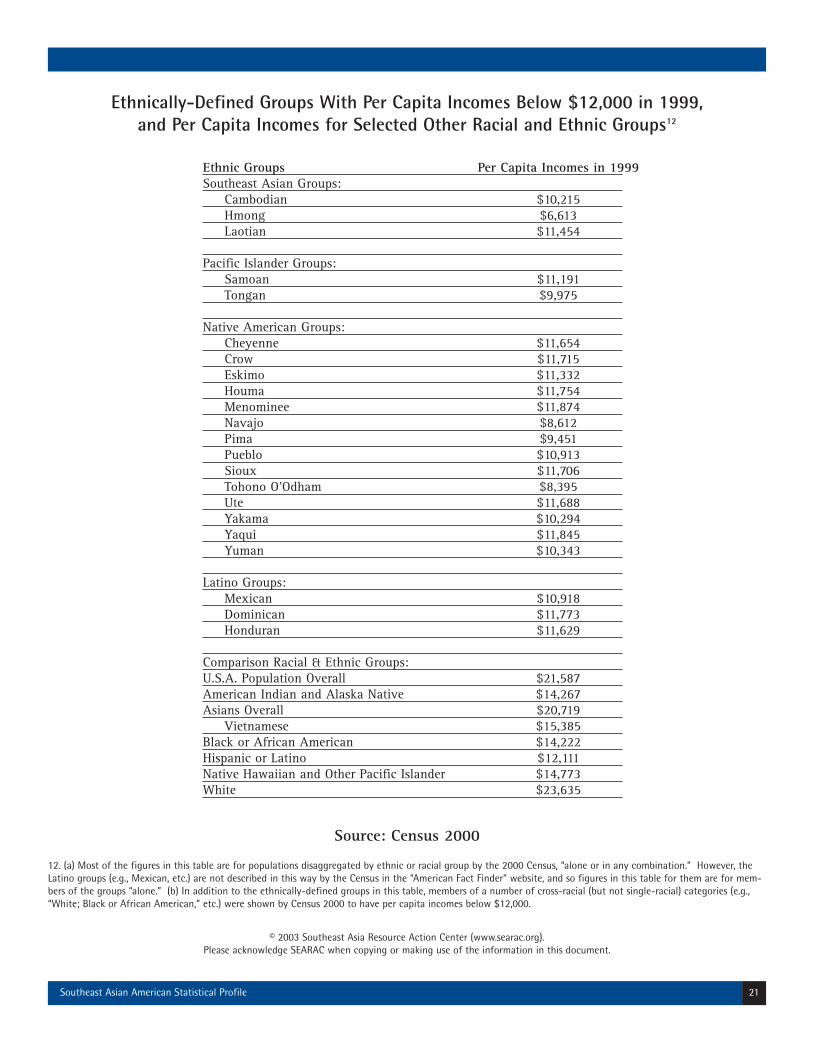
Ethnically-Defined Groups With Per Capita Incomes Below $12,000 in 1999, and Per Capita Incomes for Selected Other Racial and Ethnic Groups12
Ethnic Groups Per Capita Incomes in 1999Southeast Asian Groups:
Cambodian $10,215Hmong $6,613Laotian $11,454
Pacific Islander Groups:Samoan $11,191Tongan $9,975
Native American Groups:Cheyenne $11,654Crow $11,715Eskimo $11,332Houma $11,754Menominee $11,874Navajo $8,612Pima $9,451Pueblo $10,913Sioux $11,706Tohono O’Odham $8,395Ute $11,688Yakama $10,294Yaqui $11,845Yuman $10,343
Latino Groups:Mexican $10,918Dominican $11,773Honduran $11,629
Comparison Racial & Ethnic Groups:U.S.A. Population Overall $21,587American Indian and Alaska Native $14,267Asians Overall $20,719
Vietnamese $15,385Black or African American $14,222Hispanic or Latino $12,111Native Hawaiian and Other Pacific Islander $14,773White $23,635
Source: Census 2000
12. (a) Most of the figures in this table are for populations disaggregated by ethnic or racial group by the 2000 Census, “alone or in any combination.” However, theLatino groups (e.g., Mexican, etc.) are not described in this way by the Census in the “American Fact Finder” website, and so figures in this table for them are for mem-bers of the groups “alone.” (b) In addition to the ethnically-defined groups in this table, members of a number of cross-racial (but not single-racial) categories (e.g.,“White; Black or African American,” etc.) were shown by Census 2000 to have per capita incomes below $12,000.

© 2003 Southeast Asia Resource Action Center (www.searac.org).Please acknowledge SEARAC when copying or making use of the information in this document.
22 Southeast Asian American Statistical Profile
Poverty Status in 1999
Percent Living Below Ethnic & Racial Groups the Federal Poverty LevelOverall U.S. Population:Total U.S. 12.4U.S.: Female 13.52U.S.: Male 11.2
Racial & Hispanic Groups:African American 24.7American Indian & Alaskan Native 25.7Asian American 12.6* Asian American.: Female 12.8* Asian American.: Male 12.5Caucasian 9.4Hispanic 22.6Pacific Islander (13) 16.6* Pacific Islander: Female 17.5* Pacific Islander: Male 15.7
Asian Amer. Groups, > 1 Million Population: (14)Asian Indian 10.4Chinese (15) 13.2Filipino 7.0Japanese 9.2Korean 14.2
Southeast Asian Groups:Cambodian 29.3* Cambodian: Female 30.7* Cambodian: Male 27.7Hmong 37.6* Hmong: Female 38.3* Hmong Male 40.3Laotian 19.1* Laotian: Female 19.7* Laotian: Male 18.6Vietnamese 16.0* Vietnamese: Female 16.6* Vietnamese: Male 15.4
Source: 2000 Census
13. “Native Hawaiian and Other Pacific Islander” is the category label used by the U.S. Census Bureau.14. Vietnamese Americans also have a population over one million.15. Figures for “Chinese” Americans do not include “Taiwanese,” as per disaggregation in the 2000 Census.
© 2003 Southeast Asia Resource Action Center (www.searac.org).Please acknowledge SEARAC when copying or making use of the information in this document.
23Southeast Asian American Statistical Profile
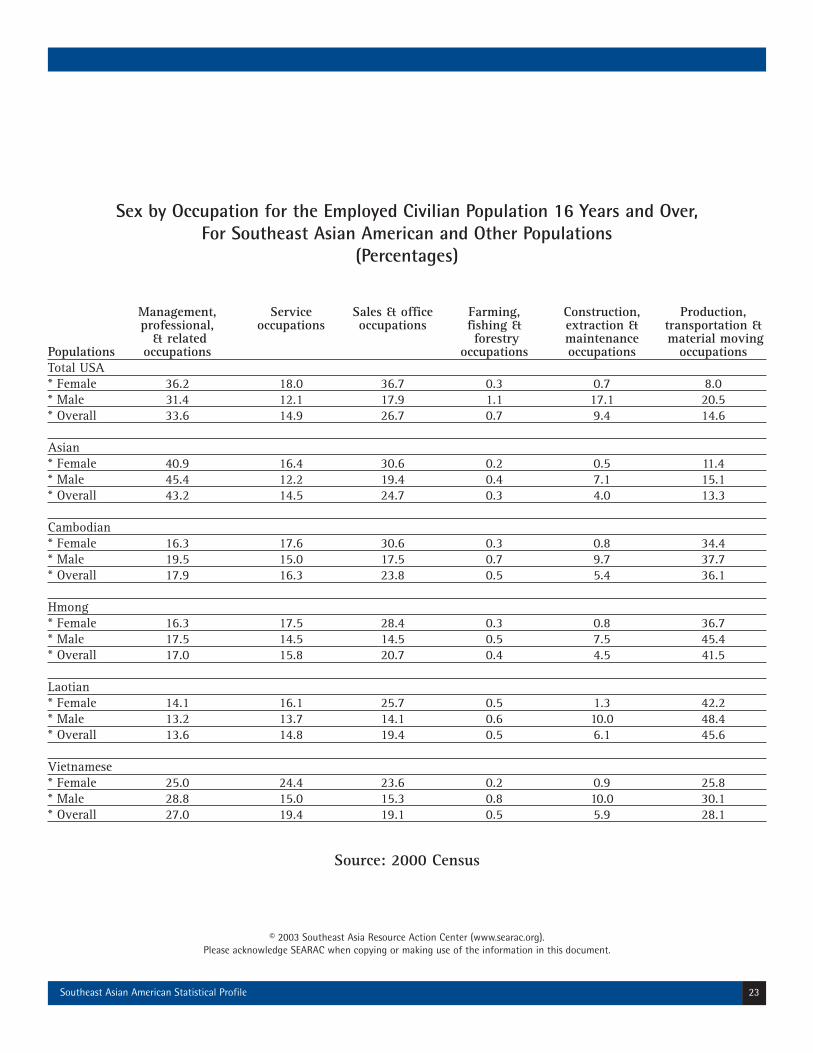
Sex by Occupation for the Employed Civilian Population 16 Years and Over,For Southeast Asian American and Other Populations
(Percentages)
Management, Service Sales & office Farming, Construction, Production,professional, occupations occupations fishing & extraction & transportation &
& related forestry maintenance material moving Populations occupations occupations occupations occupationsTotal USA* Female 36.2 18.0 36.7 0.3 0.7 8.0* Male 31.4 12.1 17.9 1.1 17.1 20.5* Overall 33.6 14.9 26.7 0.7 9.4 14.6
Asian* Female 40.9 16.4 30.6 0.2 0.5 11.4* Male 45.4 12.2 19.4 0.4 7.1 15.1* Overall 43.2 14.5 24.7 0.3 4.0 13.3
Cambodian* Female 16.3 17.6 30.6 0.3 0.8 34.4* Male 19.5 15.0 17.5 0.7 9.7 37.7* Overall 17.9 16.3 23.8 0.5 5.4 36.1
Hmong* Female 16.3 17.5 28.4 0.3 0.8 36.7* Male 17.5 14.5 14.5 0.5 7.5 45.4* Overall 17.0 15.8 20.7 0.4 4.5 41.5
Laotian* Female 14.1 16.1 25.7 0.5 1.3 42.2* Male 13.2 13.7 14.1 0.6 10.0 48.4* Overall 13.6 14.8 19.4 0.5 6.1 45.6
Vietnamese* Female 25.0 24.4 23.6 0.2 0.9 25.8* Male 28.8 15.0 15.3 0.8 10.0 30.1* Overall 27.0 19.4 19.1 0.5 5.9 28.1
Source: 2000 Census

© 2003 Southeast Asia Resource Action Center (www.searac.org).Please acknowledge SEARAC when copying or making use of the information in this document.
24 Southeast Asian American Statistical Profile
Median Family Income in 1999,Southeast Asian American and Other Populations
Median Family IncomePopulations in 1999Total U.S.A. $50,046Asian Overall $57,874Cambodian $35,434Hmong $32,224Laotian $42,838Vietnamese $46,929
Source: 2000 Census
Public Assistance Income16 in 1999 for Householdsin Selected Communities
Percentage of Households with Groups Public Assistance IncomeOverall U.S. Population 9.5
Asian Americans Overall 4.2
Cambodian 22.2Hmong 30.2Laotian 14.2Vietnamese 10.2
Source: 2000 Census Data
16. The U.S. Census specifies that “Public assistance or welfare payments include cash public assistance payments low-income people receive, such as aid to familieswith dependent children (AFDC, ADC), temporary assistance to needy families (TANF), general assistance, and emergency assistance.” (http://www.census.gov/popula-tion/www/cps/cpsdef.html)

25Southeast Asian American Statistical Profile
Southeast Asian Americans:
H O U S I N G
© 2003 Southeast Asia Resource Action Center (www.searac.org).Please acknowledge SEARAC when copying or making use of the information in this document.
26 Southeast Asian American Statistical Profile
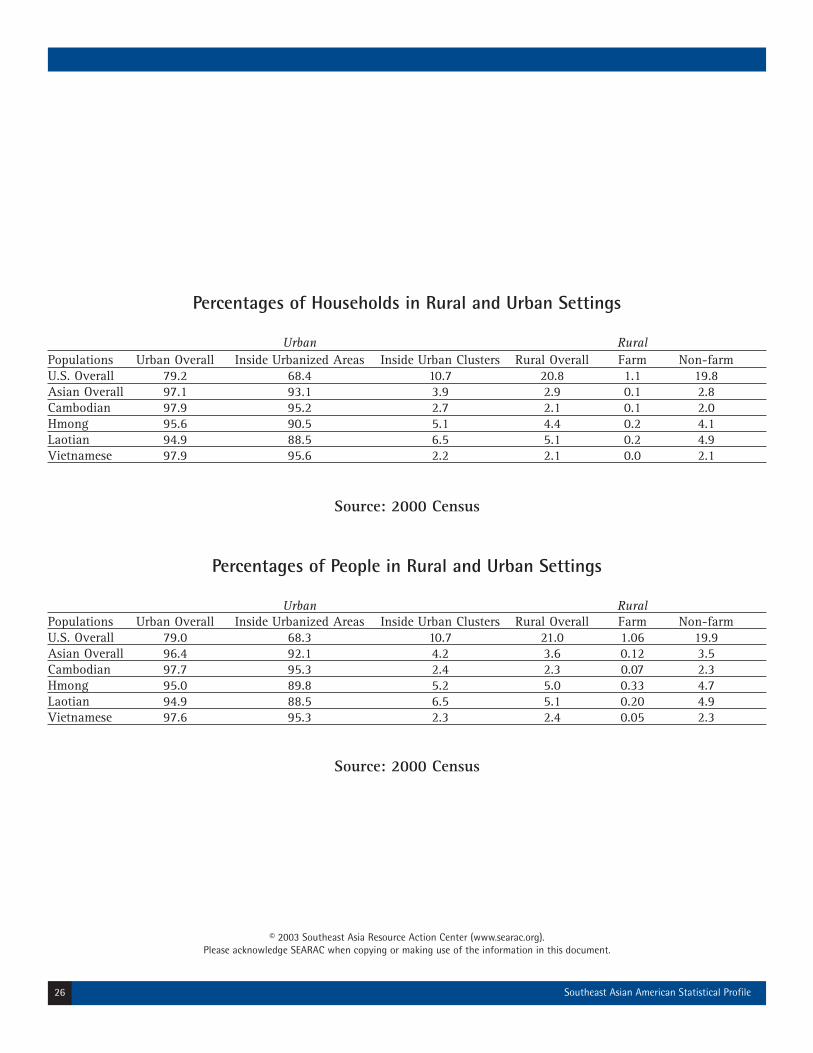
Percentages of Households in Rural and Urban Settings
Urban RuralPopulations Urban Overall Inside Urbanized Areas Inside Urban Clusters Rural Overall Farm Non-farmU.S. Overall 79.2 68.4 10.7 20.8 1.1 19.8Asian Overall 97.1 93.1 3.9 2.9 0.1 2.8Cambodian 97.9 95.2 2.7 2.1 0.1 2.0Hmong 95.6 90.5 5.1 4.4 0.2 4.1Laotian 94.9 88.5 6.5 5.1 0.2 4.9Vietnamese 97.9 95.6 2.2 2.1 0.0 2.1
Source: 2000 Census
Percentages of People in Rural and Urban Settings
Urban RuralPopulations Urban Overall Inside Urbanized Areas Inside Urban Clusters Rural Overall Farm Non-farmU.S. Overall 79.0 68.3 10.7 21.0 1.06 19.9Asian Overall 96.4 92.1 4.2 3.6 0.12 3.5Cambodian 97.7 95.3 2.4 2.3 0.07 2.3Hmong 95.0 89.8 5.2 5.0 0.33 4.7Laotian 94.9 88.5 6.5 5.1 0.20 4.9Vietnamese 97.6 95.3 2.3 2.4 0.05 2.3
Source: 2000 Census

© 2003 Southeast Asia Resource Action Center (www.searac.org).Please acknowledge SEARAC when copying or making use of the information in this document.
27Southeast Asian American Statistical Profile
Percentages of Housing Units by Tenure
Populations Owner-Occupied Renter-OccupiedU.S. Overall 66.2 34.8Asians Overall 52.6 47.4Cambodians 43.2 56.8Hmong 38.5 61.5Laotian 51.5 48.5Vietnamese 52.8 47.2
Source: 2000 Census
Household Size by Population (Percentages)
Household SizesPopulations 1-person 2-person 3-person 4-person 5-person 6-person 7 or more peopleU.S. Overall 25.8 32.6 16.5 14.2 6.7 2.5 1.6Asian Overall 18.7 25.0 19.2 19.1 9.6 4.7 3.7Cambodian 6.6 11.6 15.0 19.7 18.6 13.5 15.0Hmong 4.1 7.3 7.7 9.8 11.6 12.7 46.6Laotian 7.4 13.4 13.4 21.3 17.4 10.7 13.4Vietnamese 11.1 17.8 19.3 21.6 14.8 8.5 6.9
Source: 2000 Census
Average Household Size and Family Size
Average AveragePopulation Household Size Family SizeTotal U.S. 2.59 3.14Asians Overall 3.07 3.57Cambodian 4.39 4.54Hmong28 6.13 6.34Laotian 4.21 4.42Vietnamese 3.67 3.99
Source: 2000 Census
© 2003 Southeast Asia Resource Action Center (www.searac.org).Please acknowledge SEARAC when copying or making use of the information in this document.
28 Southeast Asian American Statistical Profile
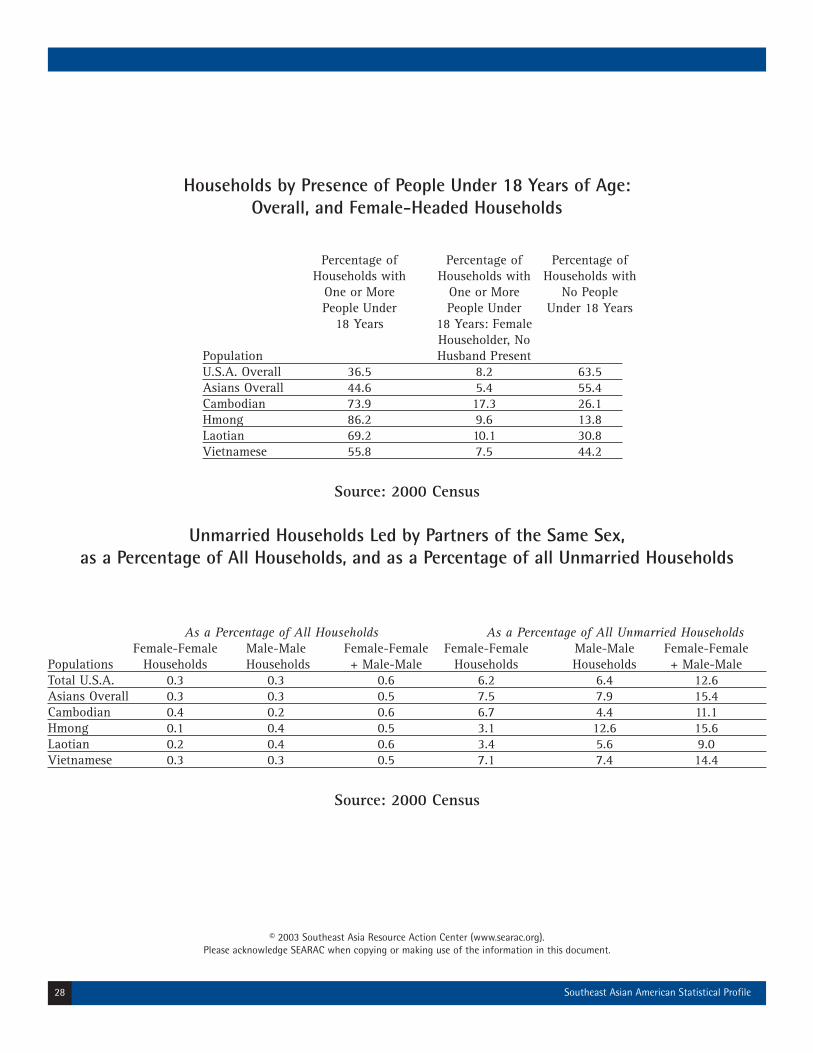
Households by Presence of People Under 18 Years of Age: Overall, and Female-Headed Households
Percentage of Percentage of Percentage ofHouseholds with Households with Households with
One or More One or More No PeoplePeople Under People Under Under 18 Years
18 Years 18 Years: FemaleHouseholder, No
Population Husband Present U.S.A. Overall 36.5 8.2 63.5Asians Overall 44.6 5.4 55.4Cambodian 73.9 17.3 26.1Hmong 86.2 9.6 13.8Laotian 69.2 10.1 30.8Vietnamese 55.8 7.5 44.2
Source: 2000 Census
Unmarried Households Led by Partners of the Same Sex, as a Percentage of All Households, and as a Percentage of all Unmarried Households
As a Percentage of All Households As a Percentage of All Unmarried HouseholdsFemale-Female Male-Male Female-Female Female-Female Male-Male Female-Female
Populations Households Households + Male-Male Households Households + Male-MaleTotal U.S.A. 0.3 0.3 0.6 6.2 6.4 12.6Asians Overall 0.3 0.3 0.5 7.5 7.9 15.4Cambodian 0.4 0.2 0.6 6.7 4.4 11.1Hmong 0.1 0.4 0.5 3.1 12.6 15.6Laotian 0.2 0.4 0.6 3.4 5.6 9.0Vietnamese 0.3 0.3 0.5 7.1 7.4 14.4
Source: 2000 Census
© 2003 Southeast Asia Resource Action Center (www.searac.org).Please acknowledge SEARAC when copying or making use of the information in this document.
29Southeast Asian American Statistical Profile
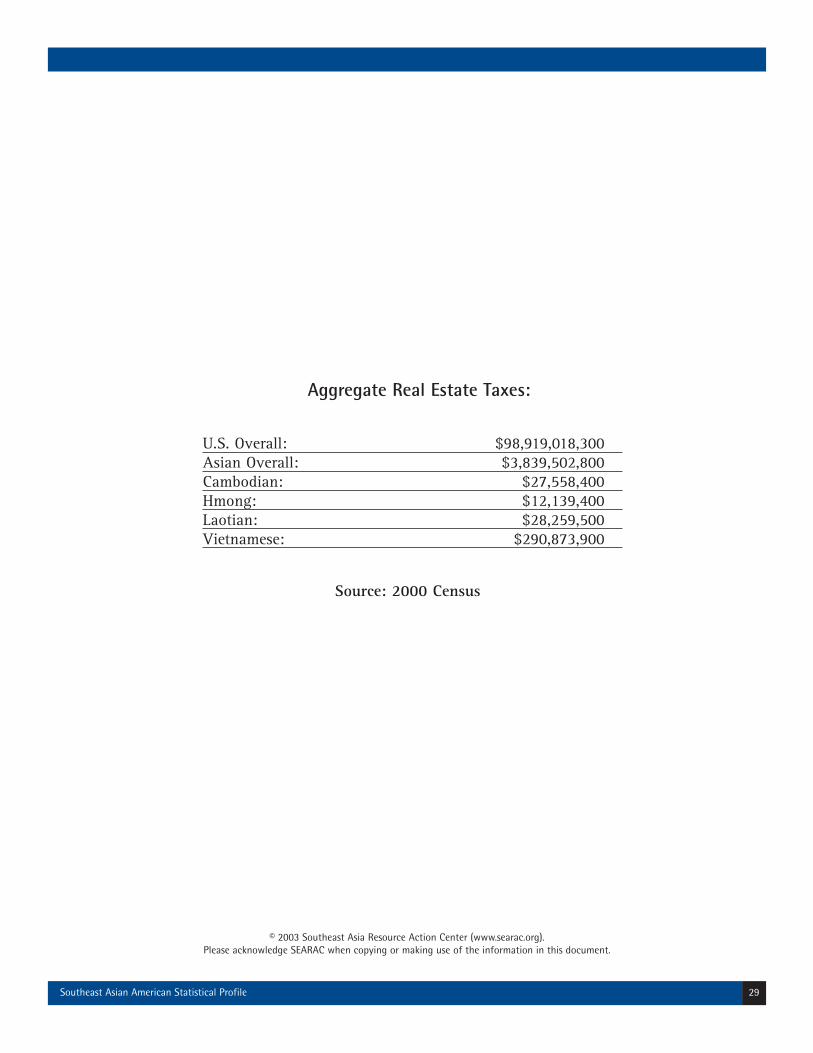
Aggregate Real Estate Taxes:
U.S. Overall: $98,919,018,300Asian Overall: $3,839,502,800Cambodian: $27,558,400Hmong: $12,139,400Laotian: $28,259,500Vietnamese: $290,873,900
Source: 2000 Census

S O U T H E A S T A S I A R E S O U R C E A C T I O N C E N T E R ( S E A R A C )1628 16th Street, NW Washington, DC 20009 • p 202.667.4690 • f 202.667.6449
[email protected] • www.searac.org