southeast asia - linesight southeast asia region is forecasted to grow at a rate of 6.2 percent over...
TRANSCRIPT

Strategy | Management | Consultancy
linesight.com/knowledge
k n o w l e d g e c e n t e r
2017
Southeast AsiaRegional Analysis

2 | Southeast Asia
linesight.com/knowledge
Contents
Southeast Asia Market Review 4
Singapore
Singapore Market Review 5
Macro indicators 6
Value of construction output 6
Singapore GDP growth rate 7
Currency exchange rates 7
Linesight average Singaporean construction costs 2017 8
Malaysia
Malaysia Market Review 9
Macro indicators 10
Malaysia GDP growth rate 10
Currency exchange rates 10
Linesight average Malaysian construction costs 2017 11
Vietnam
Vietnam Market Review 12
Macro indicators 13
Vietnam GDP growth rate 13
Currency exchange rates 13
Linesight average Vietnamese construction costs 2017 14

3 | Southeast Asia
linesight.com/knowledge
Contributors: John Butler, Michael Murphy, Su Yen Kong, Max Shea
©Linesight 2017
Indonesia
Indonesia Market Review 15
Macro indicators 16
Indonesian GDP growth rate 16
Currency exchange rates 16
Linesight average Indonesian construction costs 2017 17
Republic of Korea (South Korea)
Republic of Korea Market Review 18
Macro indicators 19
Republic of Korea GDP growth rate 19
Currency exchange rate 19
Linesight average Korean construction costs 2017 20

4 | Southeast Asia
linesight.com/knowledge
Southeast Asia Market Review
The countries of Southeast Asia differ greatly in their economic prosperity, population, history and political environment. However, they share some close interdependencies, which make this a truly dynamic region.
Asia is earmarked by many economists as the region forecast for greatest growth over the next 20 years. This optimism is driven by a number of factors including demographics, geography, natural resources and a growing middle class. The region shares a symbiotic relationship with China, with many of these countries now providing a fundamental element of its supply chain network. With China’s anticipated GDP growth slowdown, the net effect on these countries over the next five to ten year period remains to be seen.
The Southeast Asia region is forecasted to grow at a rate of 6.2 percent over the period 2017–2021. This represents a slight decrease from the 6.5 percent growth figure for 2016.
The 2017–2020 growth rate is forecasted to be 6.2 percent – a slight decrease from the 6.5 percent figure for 2016.

5 | Southeast Asia
linesight.com/knowledge
Singapore Market Review
Singapore’s economy has experienced some fluctuations in 2016. With an initial growth expectation of one to three percent dropping mid-year to between one and 1.5 percent, the economy then recorded year-on-year growth of 1.8 percent in Q4, bringing annual GDP growth to 1.8 percent. This final quarter increase, albeit somewhat minor, is despite the global economic outlook weakening since the Brexit vote, in addition to general uncertainties in the global growth outlook.
GDP attributable to construction in Singapore was circa SGD$4,800 million by the end of Q4. Looking forward, it is estimated that the figure will increase to SGD$4,920 in 2017, reaching SGD$5,260 million by 2020.
There was a decline in construction demand from the private sector in 2016 compared to previous years, due to less favorable economic conditions and an increased supply of completed private housing projects and offices. Nevertheless, this was somewhat offset by a higher construction demand from the public sector, largely due to an increase in civil engineering demand.
Looking Forward
The average construction demand is expected to be sustained between SGD$26 and $35 billion in 2017 and 2018, and SGD$26 and $37 billion in 2019 and 2020. The Building and Construction Authority (BCA) estimates public sector construction demand to be between SGD$16 and $20 billion annually from 2017 to 2020, with about 60 percent of the total demand coming from building projects and the remaining from civil engineering projects.
In light of the sluggish growth anticipated in the market for 2017, it is estimated that labor costs will continue to experience negative growth in the next six to twelve months
Year Construction demand (Value of contracts awarded)
Public Private Total
2015(p) $14 billion $13.2 billion $27.2 billion
2016(f) $18.5–21.5 billion $8.5–12.5 billion $27–34 billion
2017–2018(f) $16–20 billion - $26–35 billion
2019–2020(f) (60% from building projects and 40% from civil engineering projects)
$26–37 billion
Note: (p) preliminary; (f) forecastSource: BCA Singapore

6 | Southeast Asia
linesight.com/knowledge
It should be noted that in 2011/12 the BCA introduced a series of measures to reduce the reliance on foreign workers in Singapore’s construction industry; this move has resulted in slow growth in industry employment and a decrease in labor costs since 2013. In light of the sluggish growth anticipated in the market for 2017, it is estimated that labor costs will continue to experience negative growth in the next six to twelve months.
The result of the declining labor costs and the BCA measures introduced over the course of the last five years is the implementation of pre-fabricated components, including ductwork, pipework, reinforcement cages etc. The additional requirements of the Buildability Score ensure the reduction, and in some instances elimination, of ‘wet works’ and more prominent use of precast concrete walls, stairs etc.
Value of construction output
Macro indicators
Source: Department of Singapore Statistics, Building & Construction Authority
0
5
10
15
20
25
30
35
40
2016201520142013201220112010
Public Private

7 | Southeast Asia
linesight.com/knowledge
Singapore GDP growth rate
Currency exchange rates
Source: Trading Economics. Singapore Statistics
0
1
2
3
4
5
Q4Q3Q2Q1Q4Q3Q2Q1Q4Q3Q2Q1
2014 2015 2016
20172011 2012 2013 2014 2015 2016
0.55
0.60
0.65
0.70
0.75
0.80
0.85
JanOctJulAprJanOctJulAprJanOctJulAprJanOctJulAprJanOctJulAprJanOctJulAprJan
Source: European Central Bank
SG$/EUR€ SG$/USD$

8 | Southeast Asia
linesight.com/knowledge
Linesight average Singaporean construction costs 2017
Cost range SG$
from to unit
Commercial Offices
City Centre Air Conditioned
Shell and Core (Low - Medium Rise) n/a n/a per sq.m.
Developer Standard (Low - Medium Rise) n/a n/a per sq.m.
Shell and Core (Medium - High Rise) 1,650 2,200 per sq.m.
Developer Standard (Medium - High Rise) 2,400 3,250 per sq.m.
Residential
Developer Standard Apartments (Medium Standard) 1,500 2,100 per sq.m.
Developer Standard Apartments (High Standard) 2,400 3,100 per sq.m.
Leisure
Hotel Building (Budget / 3 Star) 2,450 2,850 per sq.m.
Hotel Building (4/5 Star) 2,950 3,750 per sq.m.
Shopping Centre 1,800 2,450 per sq.m.
Education
Primary Level (Up to 3 stories, no Air Conditioning) 1,400 1,700 per sq.m.
Car Park
Multi Storey 25,000 35,000 per space
Double Level Basement 35,000 52,500 per space
Notes: Key Rates Current at January 2017i) All subject to site specifics, design and specificationii) All exclude land acquisition costs, external works costs and professional feesSource: Linesight

9 | Southeast Asia
linesight.com/knowledge
Malaysia Market Review
The Malaysian market outlook continues to look sluggish. Slow global growth, political uncertainties and weak domestic fundamentals are weighing heavily on the economy.
Still reeling from the effects of the global oil glut and low prices, GDP for 2017 is forecasted at a moderate 4.5 percent, with a glimmer of hope for better conditions ahead as OPEC has finally agreed on a production cut for the first time in 15 years. The Malaysian Ringgit plummeted to record lows against the US dollar in 2016, and many anticipate that the downward trend will continue this year. Consumer price inflation continues to inch up, pegged to a depreciating currency, while the slow pace of credit growth and the impact of the Goods and Services Tax (GST) continue to linger. Market and investment sentiment remain cautious, with the ongoing political instability compounded with persistent allegations of mismanagement of the sovereign wealth fund.
Externally, the fallout from Brexit and Trump’s presidency has cast further doubts onto an already vulnerable global trade partnership. China’s contracting economy also poses a concern, as it is Malaysia’s second largest trading partner. Other global events such as a US federal rates hike, and the European election cycle in 2017 along with its unknown policy directions from the election outcomes, are causing considerable uncertainty for Malaysia’s trade climate. Fresh from the axed Trans-Pacific Partnership (TPP) agreement, there is mounting pressure to address prolonged weak external demand.
While the residential property market remains oversupplied and the commercial market remains subdued, the construction industry continues to benefit from a high level of public spending, recording 9 percent growth in the first half of 2016, with the value of total construction works exceeding RM32 billion in Q3. Investments in infrastructure extend into 2017 and beyond, including the RM55 billion East Coast Rail Link (ECRL), the Singapore-Johor Baru Rapid Transit System (RTS) and the Singapore-Malaysia High Speed Rail (HSR). Furthermore, a joint tender to operate and maintain rail assets for the HSR is expected later year.
The construction industry continues to benefit from a high level of public spending, recording a 9 percent growth in the first half of 2016

10 | Southeast Asia
linesight.com/knowledge
Malaysia GDP growth rate
Currency exchange rates
Macro indicators
Source: Trading Economics. Department of Statistics Malaysia
0
1
2
3
4
5
6
7
8
Q4Q3Q2Q1Q4Q3Q2Q1Q4Q3Q2Q1
2014 2015 2016
20172011 2012 2013 2014 2015 2016
0.20
0.25
0.30
0.35
JanOctJulAprJanOctJulAprJanOctJulAprJanOctJulAprJanOctJulAprJanOctJulAprJan
Source: European Central Bank
MYR/USD$ MYR/EUR€

11 | Southeast Asia
linesight.com/knowledge
Linesight average Malaysian construction costs 2017
Cost range US$
from to unit
Commercial Offices
City Centre Air Conditioned
Shell and Core (Low - Medium Rise) n/a n/a per sq.m.
Developer Standard (Low - Medium Rise) n/a n/a per sq.m.
Shell and Core (Medium - High Rise) 950 1250 per sq.m.
Developer Standard (Medium - High Rise) 1,300 1,700 per sq.m.
Residential
Developer Standard Apartments (Medium Standard) 450 700 per sq.m.
Developer Standard Apartments (High Standard) 750 1,150 per sq.m.
Leisure
Hotel Building (Budget / 3 Star) 1,300 1,650 per sq.m.
Hotel Building (4/5 Star) 1,700 2,700 per sq.m.
Shopping Centre 1,000 1,450 per sq.m.
Education
Primary Level (Up to 3 stories, no Air Conditioning) 450 600 per sq.m.
Car Park
Multi Storey 9,000 12,000 per space
Double Level Basement 14,500 22,000 per space
Notes: Key Rates Current at January 2017i) All subject to site specifics, design and specificationii) All exclude land acquisition costs, external works costs and professional feesSource: Linesight

12 | Southeast Asia
linesight.com/knowledge
Vietnam Market Review
Vietnam’s economic performance has been underpinned by robust domestic demand, combined with record levels of Foreign Direct Investment (FDI). This has stimulated the country’s GDP to grow by 6.2 percent last year, which was slightly above the IMF’s yearly estimate. Unemployment rates remain relatively low compared to similar Southeast Asian economies, at approximately 2.06 percent.
Foreign Direct Investment (FDI) reached a record high of US$15.8 billion in 2016. This represented an increase of 9 percent on the 2015 figure. The main sectors contributing to this growth were manufacturing and processing, and ultimately, Vietnam remains one of the more attractive FDI locations in the region.
The local currency (Dong) has also contributed to the country’s performance in recent years. The Dong has maintained a low depreciation rate against the US dollar (-1.2 percent), when compared to other similar Southeast Asian economies. This modest depreciation could be compared, for example, with the Malaysian Ringgit which has depreciated by approximately 6.9 percent over the same period.
The outlook for Vietnam remains optimistic, with expected growth of over 6 percent year-on-year for 2017 and 2018 in the construction industry. This growth is fuelled by large-scale transport and energy projects, regulatory reforms and encouraging economic conditions. With the moderation of laws regarding foreign ownership, the government is attempting to attract foreign private sector players to the more high tech projects, given the level of expertise and investment required.
Foreign Direct Investment (FDI) tracked positively in 2016 reaching a record high of US$15.8 billion – an increase of 9 percent on the 2015 figure

13 | Southeast Asia
linesight.com/knowledge
Vietnam GDP growth rate
Currency exchange rates
Macro indicators
Source: Trading Economics. General Statistics O�ice of Vietnam
0
1
2
3
4
5
6
7
8
Q4Q3Q2Q1Q4Q3Q2Q1Q4Q3Q2Q1
2014 2015 2016
20172011 2012 2013 2014 2015 2016
18,000
20,000
22,000
24,000
26,000
28,000
30,000
JanOctJulAprJanOctJulAprJanOctJulAprJanOctJulAprJanOctJulAprJanOctJulAprJan
Source: European Central Bank
USD$/VND EUR€/VND

14 | Southeast Asia
linesight.com/knowledge
Linesight average Vietnamese construction costs 2017
Cost range US$
from to unit
Commercial Offices
City Centre Air Conditioned
Shell and Core (Low - Medium Rise) n/a n/a per sq.m.
Developer Standard (Low - Medium Rise) n/a n/a per sq.m.
Shell and Core (Medium - High Rise) 750 975 per sq.m.
Developer Standard (Medium - High Rise) 950 1,300 per sq.m.
Residential
Developer Standard Apartments (Medium Standard) 750 900 per sq.m.
Developer Standard Apartments (High Standard) 750 1,100 per sq.m.
Leisure
Hotel Building (Budget / 3 Star) 1,150 1,450 per sq.m.
Hotel Building (4/5 Star) 1,500 2,000 per sq.m.
Shopping Centre 750 1,100 per sq.m.
Education
Primary Level (Up to 3 stories, no Air Conditioning) 475 600 per sq.m.
Car Park
Multi Storey 13,000 17,000 per sq.m.
Double Level Basement 21,500 28,000 per sq.m.
Notes: Key Rates Current at January 2017i) All subject to site specifics, design and specificationii) All exclude land acquisition costs, external works costs and professional feesSource: Linesight
15 | Southeast Asia
linesight.com/knowledge
Indonesia Market Review
Indonesia remains a powerhouse within Southeast Asia, with the largest population and GDP by a sizeable factor. Indonesia’s population is estimated at 256 million, with a GDP of USD$861 billion. Its GDP growth is anticipated to exceed the 4.8 percent achieved in 2015 to reach over 5 percent. Unemployment rates further reduced from 2015’s figures and are now estimated at approximately 5.5 percent. The inflation rate for 2016 has fluctuated around 3.5 percent.
The Indonesian government announced twelve economic stimulus packages between late 2015 to mid-2016, to provide an improved business environment for both the domestic and international markets. Business should, in effect, benefit from more streamlined rules and regulations, which should in turn improve efficiencies and lower taxation.
The construction industry is expected to play a leading role in the growth of GDP which is integral to the above mentioned stimulus packages. The GDP growth includes government spending on large capital infrastructure projects, including Light Rapid Transport (LRT) of Jakarta and large-scale housing to meet the anticipated shortfall in homes.
The outlook for Indonesia appears positive with long-term growth expected to track at approximately 4.4 percent annually. This growth profile is linked to a number of factors, including large reserves of natural resources, labor supply and geographic location. Indonesia, with the world’s fourth largest population, has a plentiful supply of labor and extensive natural gas reserves, contracts for the supply of which have
The outlook appears positive with long-term growth expected to track at approximately 4.4 percent annually
16 | Southeast Asia
linesight.com/knowledge
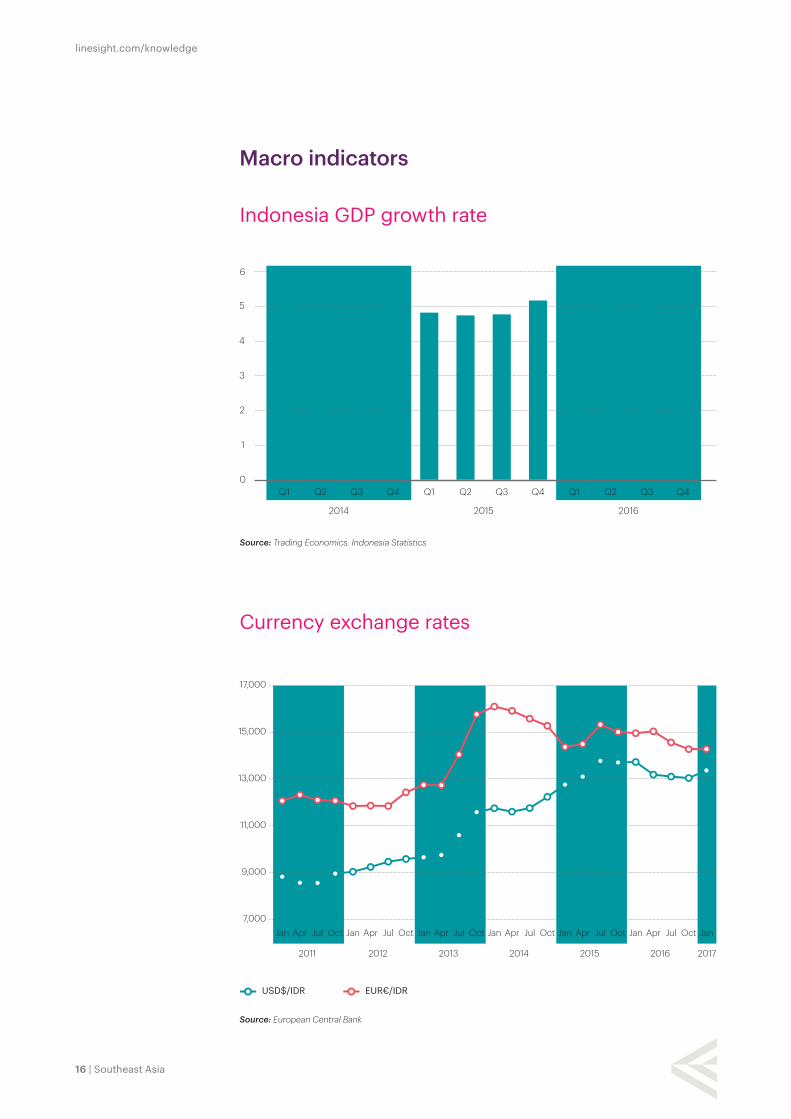
Indonesia GDP growth rate
Currency exchange rates
Macro indicators
Source: Trading Economics. Indonesia Statistics
0
1
2
3
4
5
6
Q4Q3Q2Q1Q4Q3Q2Q1Q4Q3Q2Q1
2014 2015 2016
20172011 2012 2013 2014 2015 2016
7,000
9,000
11,000
13,000
15,000
17,000
JanOctJulAprJanOctJulAprJanOctJulAprJanOctJulAprJanOctJulAprJanOctJulAprJan
Source: European Central Bank
USD$/IDR EUR€/IDR

17 | Southeast Asia
linesight.com/knowledge
Linesight average Indonesian construction costs 2017
Cost range US$
from to unit
Commercial Offices
City Centre Air Conditioned
Shell and Core (Low - Medium Rise) n/a n/a per sq.m.
Developer Standard (Low - Medium Rise) n/a n/a per sq.m.
Shell and Core (Medium - High Rise) 650 825 per sq.m.
Developer Standard (Medium - High Rise) 800 1,100 per sq.m.
Residential
Developer Standard Apartments (Medium Standard) 600 775 per sq.m.
Developer Standard Apartments (High Standard) 900 1,150 per sq.m.
Leisure
Hotel Building (Budget / 3 Star) 950 1,250 per sq.m.
Hotel Building (4/5 Star) 1,400 1,800 per sq.m.
Shopping Centre 600 700 per sq.m.
Education
Primary Level (Up to 3 stories, no Air Conditioning) 400 650 per sq.m.
Car Park
Multi Storey 8,250 10,500 per space
Double Level Basement 13,000 17,000 per space
Notes: Key Rates Current at January 2017i) All subject to site specifics, design and specificationii) All exclude land acquisition costs, external works costs and professional feesSource: Linesight

18 | Southeast Asia
linesight.com/knowledge
Republic of Korea Market Review
The South Korean construction industry forecast has improved slightly from previous years, and is expected to reach growth levels of between 1 and 2.5 percent over the next two to five year period. This growth is largely attributable to increased public spending in infrastructure, combined with an increased number of building permits for residential, industrial and institutional buildings.
As noted in previous editions, the construction sector will also benefit from the upcoming Winter Olympic Games in 2018, both in terms of the direct works and associated indirect works required to host the Games.
South Korea’s economy grew by the predicted 2.7 percent in 2015 and is expected to increase moderately up to 3 percent for 2016-17. Unemployment rates within the country remain low; however these rates increased to 3.8 percent in 2016.
The Korean economy has been rocked in recent months by scandals involving some of their key conglomerates, but at this stage, it is too early to predict the full impact of these.
The outlook for the economy remains stable, with much of the economy based on the international export market. The government has implemented a number of initiatives aimed at sustaining this stable growth, including a focus on tourism, a new manufacturing initiative and investment in a high-speed rail network to connect all major cities.
The construction sector will benefit both directly and indirectly from the upcoming Winter Olympic Games in 2018

19 | Southeast Asia
linesight.com/knowledge
Republic of Korea GDP growth rate
Currency exchange rates
Macro indicators
Source: Trading Economics. The Bank of Korea
0
0.5
1.0
1.5
2.0
2.5
3.0
3.5
4.0
Q4Q3Q2Q1Q4Q3Q2Q1Q4Q3Q2Q1
2014 2015 2016
20172011 2012 2013 2014 2015 2016
1,000
1,100
1,200
1,300
1,400
1,500
1,600
JanOctJulAprJanOctJulAprJanOctJulAprJanOctJulAprJanOctJulAprJanOctJulAprJan
Source: European Central Bank
USD$/KRW EUR€/KRW

20 | Southeast Asia
linesight.com/knowledge
Linesight average Korean construction costs 2017
Cost range US$
from to unit
Commercial Offices
City Centre Air Conditioned
Shell and Core (Medium - High Rise) 1,200 1,550 per sq.m.
Developer Standard (Medium - High Rise) 1,450 2,000 per sq.m.
Residential
Developer Standard Apartments (Medium Standard) 1,200 1,600 per sq.m.
Developer Standard Apartments (High Standard) 1,650 2,000 per sq.m.
Leisure
Hotel Building (Budget / 3 Star) 1,700 2,400 per sq.m.
Hotel Building (4/5 Star) 3,000 4,500 per sq.m.
Shopping Centre 1,500 2,250 per sq.m.
Education
Primary Level (Up to 3 stories, no Air conditioning) 1,000 1,500 per sq.m.
Car Park
Multi Storey 17,500 22,500 per space
Double Level Basement 28,000 35,000 per space
Notes: Key Rates Current at January 2017i) All subject to site specifics, design and specificationii) All exclude land acquisition costs, external works costs and professional feesSource: Linesight