south sudan food security and nutrition monitoring a...
TRANSCRIPT

South Sudan Food Security and Nutrition Monitoring A collaborative activity of MOEST, NBS, SMoAF, SMoH, SSGID, SSMDP, SSRRA, SSRRC, FAO, OCHA, UNHCR,
UNICEF, WFP, AAH, ACF, ADRA, ATITA, CARE, caritas Suez, CDOT, CDTY, CRS, Don Bosco, FACDDO, FADA, FEWSNET,
GAA, GOAL, HeRRY, IRC, JAM, LDA, MEDAIR, NCDA, Nile Hope, NPA, OFAD, PIN, Plan International, RI, SALF, Save
the Children, SCC, SMAFC&RD, SMAR, SMARF, SOME, SP, UCDC, UNKEA, VSF-SUISE, World Concern, WVI.
FSNMS Mar/April 2015
1
1 FSNMS survey computations. The figures reported here were triangulated with other data used in IPC. Thus, FSNMS only complements the IPC findings.
Highlights
The food security situation in South Sudan has further deteriorated from the December 2014 levels of about 3.7 million to current levels of up to 4.1 million people in rural areas categorized as moderately or severely food insecure1. The high levels of food insecurity in Greater Upper Nile and most parts of Greater Bahr el Ghazal, particularly Warrap and Lakes, is related to the protracted conflict and insecurity which affected the planting season last year. In addition, parts of Warrap State were particularly affected by the 2014 seasonal floods destroying a lot of cultivation in counties like Tonj East and the Gogrials. This has led to abnormal migration of livestock, limited market functionality, high food prices also associated with rising inflation and depreciation of the local currency, diminishing purchasing power, depletion of household stocks and depleted livelihood options.
Market functionality is greatly constrained in the Greater Upper Nile region while in Greater Bahr el Ghazal, food
prices are very high and have a negative impact on household food security since most households depend on markets as a result of the local production deficits.
The food security situation in the Greater Equatoria Region remains generally favourable as households still have stocks from the previous season’s production.
The food consumption patterns are inadequate with 41% of the population reporting poor or borderline food consumption levels. In most of these households, dietary intake mainly consists of cereals and vegetables with limited intake of proteins. This predisposes the population to a range of nutrition problems including micronutrient deficiencies.
Vulnerability to food insecurity is more prevalent among female-headed households (53%) as compared to male-headed households (37%).
The nutrition situation in South Sudan remains critical in most areas, with a rising trend of acute malnutrition in the Greater Upper Nile states, Warrap and Northern Bahr el Ghazal. The Global Acute Malnutrition (GAM) rates in the Greater Upper Nile states, Warrap and Northern Bahr el Ghazal have persistently remained above the emergency threshold (GAM>15%). Relatively low malnutrition levels are observed in Central Equatoria and Western Equatoria whilst GAM rates in Eastern Equatoria, Lakes and Western Bhar el Ghazal are serious (GAM 10-14.9%).
The rapidly widening gap between official and unofficial foreign exchange rates currently witnessed in the markets is likely to erode the purchasing power of households especially the majority that depend on imported foods, primarily the urban poor but also in a number of food-deficit rural areas.
Food security situation
The food security situation was measured and classified using the Consolidated Approach to Reporting Indicators of Food Security (CARI) methodology. This entails classifying food insecurity based on the household’s current status of food security (using food consumption indicators) and their coping capacity (using indicators measuring economic vulnerability—share of expenditure on food and asset depletion). From the CARI analysis, households are grouped into four categories: severely food insecure (SFI), moderately food insecure (MFI), marginally food secure (MFS) and food secure (FS). Food insecurity in South Sudan remains distressingly widespread. Nationwide, some 41% of the population are food insecure (7% and 34% are severely and moderately food insecure respectively). The number of people vulnerable to food insecurity in South Sudan is high especially in the Greater Upper Nile states with Jonglei having the highest prevalence of

A collaborative activity of MOEST, NBS, SMoAF, SMoH, SSGID, SSMDP, SSRRA, SSRRC, FAO, OCHA, UNHCR, UNICEF, WFP, AAH, ACF, ADRA, ATITA, CARE, caritas Suez, CDOT, CDTY, CRS, Don Bosco, FACDDO, FADA, FEWSNET, GAA, GOAL, HeRRY, IRC, JAM, LDA, MEDAIR, NCDA, Nile Hope, NPA, OFAD, PIN, Plan International, RI, SALF, Save the Children, SCC, SMAFC&RD, SMAR, SMARF, SOME, SP, UCDC, UNKEA, VSF-SUISE, World Concern, WVI.
FSNMS Mar/April 2015
2
households that are food insecure (5% and 51% are severely and moderately food insecure respectively) followed by Lakes (14% and 37% severe and moderate food insecurity respectively). As expected, the Equatorias have the least prevalence of food insecure households with Western Equatoria recording the lowest occurrence of food insecurity at only 21% (less than 1% severely food insecure and a
further 20% moderately food insecure). Furthermore, the livelihood zones that are in the Greater Upper Nile states: Eastern Plain Cattle and Sorghum and North Eastern Cattle and Maize have the highest prevalence of food insecurity at 64% and 56% respectively. Figure 1 indicates a decrease in the proportions of households that are severely food insecure in the March 2015 compared to the same period last year, especially in the Greater Upper Nile states, WES, EES and Warrap. However, in Lakes, WBS, NBS and CES, the proportion of severely food insecure either increased or remained the same during the same period. In Greater Upper Nile, although proportions of severe food insecurity decreased, it still remained higher than the pre-crisis levels and considerably higher than the rest of the country, except Lakes. Severe food insecurity has somewhat decreased compared to March 2014 due to the population resilience. However, the limited resilience capacity could only get them to moderately food insecure categories thus the increased proportion of moderate food insecurity in 2015 compared to same period in 2014 (Figure 1). The high levels of food insecurity in March 2015 in Greater Upper Nile compared to the non-conflict states is primarily driven by the volatile security situation and conflicts which have eroded livelihoods and caused massive disruption to market operations. Markets are constrained to re-stock food commodities as a result of movement restrictions. This is likely to deepen the rapidly increasing commodity prices even in areas outside the conflict states.
Female headed households are more vulnerable to food insecurity with 53% of them facing food insecurity as compared to their male counterparts (37%), an indication of gender-based vulnerabilities.
Food consumption
Food Consumption Scores (FCS) are based on a seven-day recall period that captures the diversity and frequency of food intake.
Food consumption patterns in the different states are inadequate with diets mainly consisting of cereals and vegetables with limited intake of proteins and other important food groups. This predisposes the population to a range of nutrition problems including micronutrient deficiencies. Poor food consumption, a reflection of low dietary diversity, is a major contributor to food insecurity in
51%36%
40%
46%36%
31%
37%27%
32%
37%41%
45%36%32%
35%32%
13%
50%
29%15%
58%
28%20%
38%
27%
14%19%
20%12%
16%
35%24%
36%
5%
32%
8%5%
11%12%
14%
3%
22%11%
31%
5%
10%28%
20%
6%
4%
23%
10%
4%
9%
2%
2%
12%
4%
1%
3%1%
2%
4%
7%
12%
12%
0%
10%
20%
30%
40%
50%
60%
70%
80%
20
15
20
14
20
13
20
15
20
14
20
13
20
15
20
14
20
13
20
15
20
14
20
13
20
15
20
14
20
13
20
15
20
14
20
13
20
15
20
14
20
13
20
15
20
14
20
13
20
15
20
14
20
13
20
15
20
14
20
13
20
15
20
14
20
13
Jonglei Warrap Lakes UpperNile
Unity WBS NBS EES CES WES National
Figure 1: Food security by state March 2015, 2014 and 2013
Moderately food insecure Severely food insecure
30%
7%18% 20% 17%
6%14% 8% 12% 4%
14%
33%
42% 28% 25% 26%33% 21%
25% 20%25%
28%
0%
20%
40%
60%
80%Figure 2: South Sudan food consumption status
Poor Border line

A collaborative activity of MOEST, NBS, SMoAF, SMoH, SSGID, SSMDP, SSRRA, SSRRC, FAO, OCHA, UNHCR, UNICEF, WFP, AAH, ACF, ADRA, ATITA, CARE, caritas Suez, CDOT, CDTY, CRS, Don Bosco, FACDDO, FADA, FEWSNET, GAA, GOAL, HeRRY, IRC, JAM, LDA, MEDAIR, NCDA, Nile Hope, NPA, OFAD, PIN, Plan International, RI, SALF, Save the Children, SCC, SMAFC&RD, SMAR, SMARF, SOME, SP, UCDC, UNKEA, VSF-SUISE, World Concern, WVI.
FSNMS Mar/April 2015
3
almost all parts of the country but with heightened acute levels in the Greater Upper Nile states, Warrap and Lakes where the levels are elevated.
Jonglei and Warrap have the majority of households with a lopsided diet (prevalence of poor and borderline food consumption at 63% and 49% respectively). In these areas, households are unable to supplement the humanitarian rations with market purchases due to poor or lack of market functionality characterized by high commodity prices. Western Equatoria and Northern Bahr el Ghazal have the least proportions of those with inadequate food consumption levels at 29% and 31% respectively (Figure 2). Jonglei has the highest level of inadequate food consumption. In addition, most households depend on food aid and unconventional food sources such as hunting and gathering and the least on markets, this could be a sign of low market integration, but also high prices and low purchasing power, which has a negative impact on the state’s food security status.
During the period of the assessment, markets were the primary source of food, accounting for more than 50% of households in Lakes, WBS, NBS, Warrap and CES. This implies an earlier than usual depletion of stocks from previous harvests. The Greater Upper Nile would have been similar to these other states had it not been for disrupted market access and lack of purchasing power. The only exception is WES where own production is still accounting for nearly 50% of food sources, a reflection of the stable production capacity in the state. The exceptionally high level of dependence on markets within Northern and Western Bahr el Ghazal is attributed to poor crop production in the previous harvest and presence of skilled and salaried labour in the two states (at least 10% report skilled/salaried labour as an income source, higher than the national average which is 7%). Considering the huge production deficits in the country and the onset of the lean season (June - July), dependence on market sources of food is therefore expected to increase amidst dwindling income opportunities as a result of the evolving inflationary pressures. Interestingly, own food production as a source of food has gone down compared to the same period last year, giving rise to the dependency on markets as a source of food. There were more households that depended on own production in 2014 (28%) as compared to 2015 (23%). The opposite being
true for markets, in 2014 households that relied on markets were 43% and in in 2015 they increased by 10%.
Food assistance is significant in the Greater Upper Nile states with 33%, 24%, 14% households in Jonglei, Unity and Upper Nile reporting it as a source of food. The national average is only 6% (Figure 3).
The diet of most households is largely composed of cereals and tubers (consumed nearly on daily basis in all states) followed by meat (about three to four times a week
except in Unity and Jonglei probably due to rapid depletion of animals) while vegetables are only consumed three times a
26%
3%17%
37%16%
25%
48%
19% 26%13%
22%
2% 24% 33% 7%
43%90%
45% 55%
76% 56%
35%
56% 49%
29%53%
16%2% 9% 1% 1%
2% 2%2% 1%
5% 4%
0%
20%
40%
60%
80%
100%
120%Figure 3: Sources of food by states
Own production Food aid Gifts Markets Borrowing Fishing Hunting & Gathering
6 7 5 6 5 6 6 6 6 6 6
5 5 31
1 1 13
1 2
3 3
2
3
44 5 3
3
33
4 5
1
32
3 3 3
6
33
0
10
20
30
40
WES EES Jonglei Lakes UpperNile
WBS NBS Warrap CES Unity National
Figure 4: Average no. of days food groups consumed
Cereals & tubers Pulses
Vegetables, wild veg & leaves Fruits
Red meat, poultry, fish & eggs Milk and dairy products
Oils, fats and butter Sugar and sugar products
Condiments
A collaborative activity of MOEST, NBS, SMoAF, SMoH, SSGID, SSMDP, SSRRA, SSRRC, FAO, OCHA, UNHCR, UNICEF, WFP, AAH, ACF, ADRA, ATITA, CARE, caritas Suez, CDOT, CDTY, CRS, Don Bosco, FACDDO, FADA, FEWSNET, GAA, GOAL, HeRRY, IRC, JAM, LDA, MEDAIR, NCDA, Nile Hope, NPA, OFAD, PIN, Plan International, RI, SALF, Save the Children, SCC, SMAFC&RD, SMAR, SMARF, SOME, SP, UCDC, UNKEA, VSF-SUISE, World Concern, WVI.
FSNMS Mar/April 2015
4
week except in Eastern and Western Equatoria where the vegetable intake is at least 5 times a week (Figure 4). As expected, intake of condiments such as spices, salt, Maggi cubes is common in CES—primarily attributed to the large urban community in Juba.
On average, pulses are rarely consumed (1 – 2 times a week). Intake of milk and dairy products is also low, only once a week except in pastoral communities where intake increases to 2-3 times a week. The highest number of days different types of food groups are consumed is observed in Greater Equatoria. Upper Nile, Unity, Jonglei and Warrap have the most infrequent intake of different food groups.
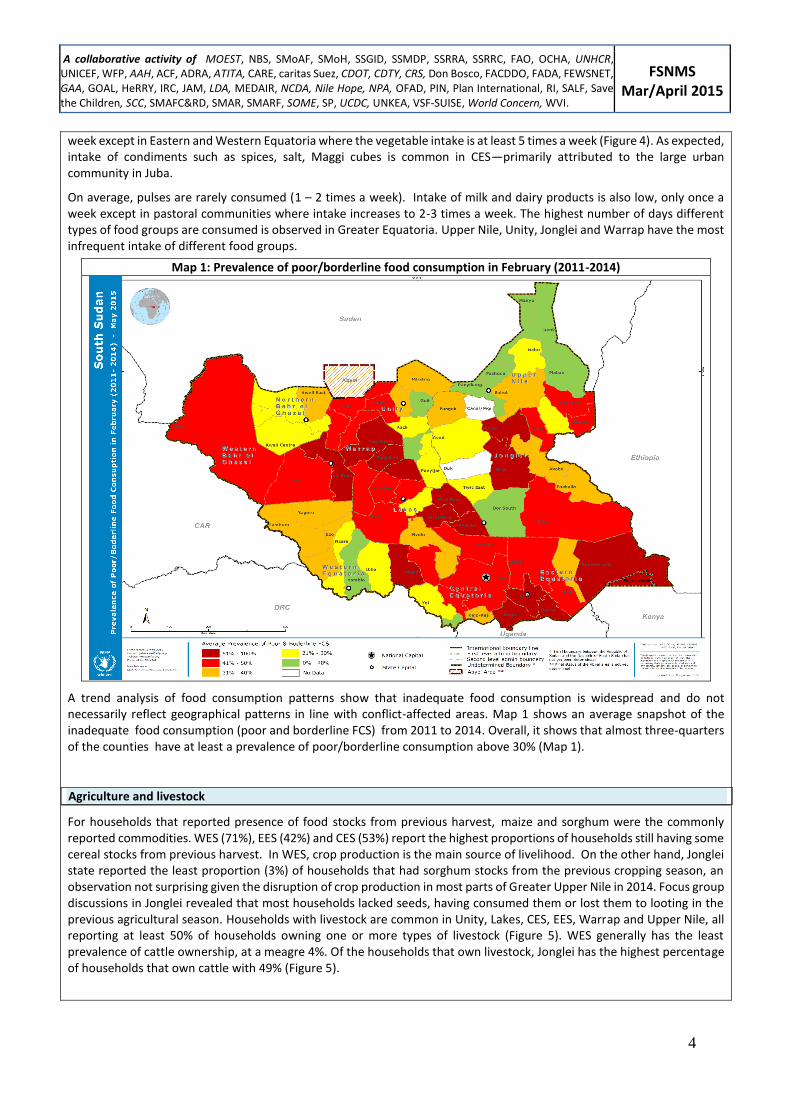
Map 1: Prevalence of poor/borderline food consumption in February (2011-2014)
A trend analysis of food consumption patterns show that inadequate food consumption is widespread and do not necessarily reflect geographical patterns in line with conflict-affected areas. Map 1 shows an average snapshot of the inadequate food consumption (poor and borderline FCS) from 2011 to 2014. Overall, it shows that almost three-quarters of the counties have at least a prevalence of poor/borderline consumption above 30% (Map 1).
Agriculture and livestock
For households that reported presence of food stocks from previous harvest, maize and sorghum were the commonly reported commodities. WES (71%), EES (42%) and CES (53%) report the highest proportions of households still having some cereal stocks from previous harvest. In WES, crop production is the main source of livelihood. On the other hand, Jonglei state reported the least proportion (3%) of households that had sorghum stocks from the previous cropping season, an observation not surprising given the disruption of crop production in most parts of Greater Upper Nile in 2014. Focus group discussions in Jonglei revealed that most households lacked seeds, having consumed them or lost them to looting in the previous agricultural season. Households with livestock are common in Unity, Lakes, CES, EES, Warrap and Upper Nile, all reporting at least 50% of households owning one or more types of livestock (Figure 5). WES generally has the least prevalence of cattle ownership, at a meagre 4%. Of the households that own livestock, Jonglei has the highest percentage of households that own cattle with 49% (Figure 5).

A collaborative activity of MOEST, NBS, SMoAF, SMoH, SSGID, SSMDP, SSRRA, SSRRC, FAO, OCHA, UNHCR, UNICEF, WFP, AAH, ACF, ADRA, ATITA, CARE, caritas Suez, CDOT, CDTY, CRS, Don Bosco, FACDDO, FADA, FEWSNET, GAA, GOAL, HeRRY, IRC, JAM, LDA, MEDAIR, NCDA, Nile Hope, NPA, OFAD, PIN, Plan International, RI, SALF, Save the Children, SCC, SMAFC&RD, SMAR, SMARF, SOME, SP, UCDC, UNKEA, VSF-SUISE, World Concern, WVI.
FSNMS Mar/April 2015
5
2 Sales of charcoal, poles, grass, firewood and other forest products
In terms of food security, states that have high numbers of cattle reported high levels of milk and dairy products consumption especially in Warrap, UNS and Unity with milk and dairy products consumed twice a week. On average 32% of households surveyed in the country reported ownership of goats. Ownership of sheep is the lowest in the country, varying from a prevalence of none in WES to 24% in EES.
Income Sources
The March 2015 FSNMS was conducted during the post-harvest period which in some states also coincided with the onset of an earlier than normal lean season. This explains the increased reliance on crop production as a livelihood source followed by sale of natural resources2. The main income sources for households at this time of the year include crop production (21%), followed by livestock production for Greater Equatoria and parts of Bahr el Ghazal. On the other hand, main
income sources for Greater Upper Nile, Northern and Western el Bahr Ghazal is sale of natural resources—primarily firewood, grass, poles etc. The sale of livestock is common in the pastoral states that include Warrap, Lakes, EES, Unity and Jonglei, but low in WES and WBS. States with the highest number of households relying on crop production include WES (21%) and CES (11%). Warrap (16%), EES (15%), Lakes (15%), and Jonglei (13%) rely on livestock production as a source of livelihood (Figure 6). These two livelihood activities are generally considered as reliable and sustainable and such households have increased resilience capacity to survive shocks. Sale of alcoholic beverages/brewing is popular among households in EES (20%) and WES (13%), areas where consumption of traditional/local brews is predominant. Sale of natural resources (such as charcoal, poles, grass and firewood) as a source of livelihood is more widespread in Unity (48%), NBS (40%) and Upper Nile (39%). As a livelihood activity, sale of natural resources is typically associated with difficulties in getting viable sources of income. Fishing as a livelihood undertaking is more likely to have been reported in Upper Nile (21%). Skilled labour and salaried work are limited, rarely reported with only 7% or less relying on it as a livelihood activity, with the exception of Northern and Western Bahr el Ghazal where the prevalence is at least 10%.
4%
30%
49%
27%
36%
16%20%
31%
16%
36%
28%
35%31% 32% 32% 31% 30% 32%
28%
38%
31% 32%
0%
10%
20%
30%
40%
50%
60%Figure 5: Types of livestock in South Sudan
Cattle Sheep Goats Poultry
36%30%14%14%
32%28%49%
36%30%21%39%32%
22%15%25%
6% 6% 7% 14% 6%26%19%
14%12%
40%
27%34%39%
14%10%21%14%13%14%18%16%39%35%
48%46%
26%
48%27%26%
0%
20%
40%
60%
80%
100%
120%
20
15
20
14
20
15
20
14
20
15
20
14
20
15
20
14
20
15
20
14
20
15
20
14
20
15
20
14
20
15
20
14
20
15
20
14
20
15
20
14
20
15
20
14
Lakes NBS WBS CES Warrap WES EES UNS Unity Jonglei National
Figure 6: Sources of income by states (March 2015 & 2014)
Crop production Livestock production BrewingCasual labour Skilled/salaried labour Sale of natural resourcesPetty trading

A collaborative activity of MOEST, NBS, SMoAF, SMoH, SSGID, SSMDP, SSRRA, SSRRC, FAO, OCHA, UNHCR, UNICEF, WFP, AAH, ACF, ADRA, ATITA, CARE, caritas Suez, CDOT, CDTY, CRS, Don Bosco, FACDDO, FADA, FEWSNET, GAA, GOAL, HeRRY, IRC, JAM, LDA, MEDAIR, NCDA, Nile Hope, NPA, OFAD, PIN, Plan International, RI, SALF, Save the Children, SCC, SMAFC&RD, SMAR, SMARF, SOME, SP, UCDC, UNKEA, VSF-SUISE, World Concern, WVI.
FSNMS Mar/April 2015
6
The households were also classified based on reliability and sustainability of their income sources. Poor unreliable and unsustainable income sources include dependence on natural resources while moderate income reliability include casual labour and petty trading as opposed to reliable and sustainable livelihoods that include crop and livestock production, salaried/skilled labour. About 36% and 35% households in South Sudan have medium and good reliable and sustainable income sources. However, 29% indicated poor unreliable and unsustainable sources of income. The majority of households that rely on poor and unsustainable income sources are in Jonglei, EES, NBS and Warrap (49%, 43%, 33% and 32%) respectively. Compared to the period a year ago, less households currently rely on poor unreliable and unsustainable incomes in these states, with the exception of Warrap where the incidences on unsustainable and unreliable income sources has increased.
Expenditure (income proxy) and purchasing power
The March 2015 FSNMS expenditure results indicate that a large share of household expenditures is devoted to food (51%) and the rest to non food items (49%) (Figure 7). WES, EES, Warrap and CES reported the least expenditure shares on food at 33%, 48%, 49% and 40% respectively. On the other hand, NBS (69%) and Upper Nile (59%) report the highest expenditure shares on food. The livelihood zones in the Greater Upper Nile states, The Eastern Plain Cattle and Sorghum and the Northern Sorghum and Livestock livelihood zones have the highest expenditure shares on food at 60% each. The high expenditure shares on food is partly by the increasing food prices but also largely due to dependence on market as a result of massive production deficits, especially in Greater el Bahr Ghazals and Greater Upper Nile.
The Greater Bahr el Ghazal Sorghum and Cattle (82%), Western Groundnuts, Simsim and Sorghum (86%) and Northern Sorghum and Livestock (93%) livelihood zones have exceptionally high shares of expenditure on food. These livelihood zones are primarily in Greater Bahr el Ghazal, where the impact of rising food prices has been pronounced due to their heavy reliance on markets.
Market
The highest expenditure shares on cereals is reported in NBS (42%), Unity (35%), Upper Nile (34%), Warrap (31%) and Lakes (30%). Although Unity is dependent on cereals from food assistance, they still have to source from the market to supplement whatever they receive from humanitarian agencies. The Equatorias have the least share of expenditure on cereals, primarily attributed to their relative dependence on their own production.
The assessment shows market instability with 24% of respondents indicating that the food prices of key commodities have increased compared to the pre-crisis period (see Figure 8). This can partly explain the low food consumption in states with concurrent high dependency on markets and on unstable and non-lucrative income sources, such as Upper Nile, Unity and to a lesser extent Jonglei.
Clothes,3%
Milling, 2%
Tobacco & Alcohol, 4%
Soap, 8% Trans, 3%
Construction, 1%
Fines & Taxes, 1%
Agric tools, …
Labour, 6%HH assets, 1%
Health, 6%
Educ, 1%
Celebrations, 2%
Rent, 47%
Other Non-Food, 3%
Food, 51%
Cereals, 25%
Fruits & Veg, 2%Meat & Fish, 7%
Pulses, 3%Oil, 4%
Sugar, 5%Other Foods, 4%
Food, 51%
Figure 7: Household expenditure breakdown

A collaborative activity of MOEST, NBS, SMoAF, SMoH, SSGID, SSMDP, SSRRA, SSRRC, FAO, OCHA, UNHCR, UNICEF, WFP, AAH, ACF, ADRA, ATITA, CARE, caritas Suez, CDOT, CDTY, CRS, Don Bosco, FACDDO, FADA, FEWSNET, GAA, GOAL, HeRRY, IRC, JAM, LDA, MEDAIR, NCDA, Nile Hope, NPA, OFAD, PIN, Plan International, RI, SALF, Save the Children, SCC, SMAFC&RD, SMAR, SMARF, SOME, SP, UCDC, UNKEA, VSF-SUISE, World Concern, WVI.
FSNMS Mar/April 2015
7
Prices of staples increased and were above the 5-year average in all markets in the country. Compared to the same period the previous year, prices of the staple food commodity, sorghum, has shown a modest variance in all markets with exception of Bentiu where a malwa (equivalent of 3.5 kg) of sorghum costs SSP35. Juba and Aweil showed an increase of 44% and 47% respectively, atypical of the first quarter in a year unless there is an acute shock. This year has seen a sharp rise, a reflection of the deepening macro-economic climate and commodities being imported at inflated prices resulting from a depreciating currency.
In Greater Upper Nile, although most markets remain dysfunctional, few are beginning to function although sub-optimally with current commodity supplies trending below the average pre-crisis stocks. The depreciation of the local currency against the US dollar (according to informal market exchange rates) has contributed to rising food prices. Shortages of fuel caused by shortage of hard dollar currency and insecurity in parts of Greater Upper Nile and parts of Greater Bahr el Ghazal hinders movement of goods. There is an acute shortage of hard dollar currency primarily attributed to conflict-induced reduction in oil production, decline in global oil prices, fixed payment for use of the Sudan oil pipelines and increasing budget deficit. The informal
exchange rate reached SSP8.8 for US$1 U.S in mid-April compared to SSP7.5 in March.
Coping strategies index and shocks experienced by households
All assessed households experienced a shock or more in the three months preceding the survey. The dominant shocks reported are: high food prices (24%) as compared to (19%) reported in October 2014 followed by human sicknesses (24%) and insecurity (15%). High food price was likely to have been reported in NBS (41%), Warrap (36%) and WBS (28%), but least likely to have been experienced in WES (11%) and CES (12%) (Figure 9). High food prices as a shock mentioned in Northern Bahr el Ghazal is attributed to a reduction in informal trade
with Sudan occasioned by presidential elections resulting to closure of the border with the neighbouring country. Insecurity as a shock was most prevalent in Lakes (28%) due to persistent cattle rustling incidences and conflict-affected Upper Nile (24%).With majority of households unable to meet their food requirements without difficulties, most of them have resorted to use of coping strategies, both consumption/dietary and livelihood coping mechanisms. Some 21% reportedly used medium to high consumption coping strategy indices, primarily related to reducing the number of meals and reducing meal portions. Some 11% and 40% use emergency and crisis livelihood coping strategies respectively.
05
1015202530354045
jan mar may jul sep nov jan mar may jul sep nov jan mar
2014 2015
SSP
/3.5
KG
Figure 8: White sorghum retail price from selected markets
Aweil Juba Wau Bentiu
11%23% 21% 21% 22% 28%
41% 36%
12% 17% 24%
27%
25%21% 19% 18%
36%
29%21%
33% 17%
24%
24%11%
16%28% 24%
7% 1%15%
10%
12%
15%
0% 0%12%
3% 8%5%
7%1%
2% 8% 6%
0%
10%
20%
30%
40%
50%
60%
70%
80%
90%
100%Figure 9: Prevalence of main shocks affecting households
Food too expensive Human sickness
Insecurity/violence Livestock diseases
Lack of free access/movement Late food aid distribution

A collaborative activity of MOEST, NBS, SMoAF, SMoH, SSGID, SSMDP, SSRRA, SSRRC, FAO, OCHA, UNHCR, UNICEF, WFP, AAH, ACF, ADRA, ATITA, CARE, caritas Suez, CDOT, CDTY, CRS, Don Bosco, FACDDO, FADA, FEWSNET, GAA, GOAL, HeRRY, IRC, JAM, LDA, MEDAIR, NCDA, Nile Hope, NPA, OFAD, PIN, Plan International, RI, SALF, Save the Children, SCC, SMAFC&RD, SMAR, SMARF, SOME, SP, UCDC, UNKEA, VSF-SUISE, World Concern, WVI.
FSNMS Mar/April 2015
8
The commonly applied diet-related coping strategies are: relying on less preferred food, reduction in adult consumption and reduction of number of meals eaten in a day. Warrap, Lakes, WBS and Jonglei report high prevalence of diet-related coping strategies at 35%, 31%, 28% and 27% respectively with at least 3% of households reporting high diet-related coping strategy indices. Figure 10 indicates an increase in the proportions of households that use medium reduced coping strategies in the March 2015 Round as compared to the same period last year, especially in the non-conflict states. However, in Jonglei, Unity and Upper Nile states, the proportion of households that applied medium reduced coping strategies reduced in 2015 as compared to the same period last year. In 2015 Jonglei had 27%, Unity 19% and Upper Nile 16%, which is a reduction of 10%, 32% and 24% for Jonglei, Unity and Upper Nile respectively compared to the current situation, this was influenced by the December 2013 conflict. Women headed households were more likely (25%) to apply diet-related coping strategy indices as compared to their male counterparts (19%).
In order to understand the longer-term coping capacity of households, livelihood coping strategies were explored. The most common coping strategies reported were: consumption of seed stocks (31%) and reduced expenses on health with 21% as crisis strategies and the emergency coping strategies included selling of last female animals (11%) and migration of entire household (10%). Upper Nile State reported the highest prevalence of emergency coping strategies while Equatorias reported the highest levels of crisis coping strategies.
Nutrition status of Children 6 to 59 months and Women 15 to 49 years
Based on a national total of 5,153 children included in the anthropometric analysis, the global acute malnutrition (GAM) rate was 16.7% (14.9% – 18.6%) (WHZ<-2 and/or oedema) whilst severe acute malnutrition stood at 4.5% (3.6% - 5.5%) WHZ<-3 and/or oedema. The findings denote a worsening nutrition situation when compared to the previous situation according to the November/December 2014 FSNMS.
35%25%
31%23%27%
37%28%
1%
19%
51%
16%
40%
16%
4%13%
7% 7% 4% 7% 5%20%
20%
3%
5%1%
1%3%
6%
1%
8%
1%
8%
2%
1% 1%1%
1% 3%
%
10%
20%
30%
40%
50%
60%
70%
20
15
20
14
20
15
20
14
20
15
20
14
20
15
20
14
20
15
20
14
20
15
20
14
20
15
20
14
20
15
20
14
20
15
20
14
20
15
20
14
20
15
20
14
Warrap Lakes Jonglei WBS UnityUpper NileNBS EES CES WES National
Figure 10: Prevalence of Medium/High Coping Strategy Index
Medium High
13%10% 8%
15% 13% 14%19%
11%7%
22%
13%
35%
27%
45%54%
28%
36%
54% 49%
24%
40% 40%
1% 1%
9%
17%22%
6%
15% 16%
7% 8%11%
0%
10%
20%
30%
40%
50%
60%
Figure 11: Summary of asset depletion coping strategies by state
Stress coping strategies Crisis coping strategies Emergencies coping strategies

A collaborative activity of MOEST, NBS, SMoAF, SMoH, SSGID, SSMDP, SSRRA, SSRRC, FAO, OCHA, UNHCR, UNICEF, WFP, AAH, ACF, ADRA, ATITA, CARE, caritas Suez, CDOT, CDTY, CRS, Don Bosco, FACDDO, FADA, FEWSNET, GAA, GOAL, HeRRY, IRC, JAM, LDA, MEDAIR, NCDA, Nile Hope, NPA, OFAD, PIN, Plan International, RI, SALF, Save the Children, SCC, SMAFC&RD, SMAR, SMARF, SOME, SP, UCDC, UNKEA, VSF-SUISE, World Concern, WVI.
FSNMS Mar/April 2015
9
3 GAM of 10-14.9% 4 GAM of 5-9.9% 5 GAM of <5%
Table 1: Prevalence of acute malnutrition by state
State Nutrition Outcome WHO Classification
GAM (95% CI) SAM (95% CI)
CES (n=503) 7.2% ( 4.9-10.4) 0.8% ( 0.3- 2.1)
EES (n=457) 10.0% ( 7.4-13.4) 3.5% ( 2.3- 5.2)
Jonglei (n=474) 19.5*
Lakes (n=614) 12.2% ( 9.3-15.9) 3.4% ( 2.0- 5.9)
NBS (n=599) 19.7% (15.5-24.7) 5.3% ( 3.4- 8.1)
Unity (n=608) 19.0*
Upper Nile (n=549) 15.4*
Warrap (n=465) 21.2*
WBS (n=436) 12.0% ( 9.3-15.5) 1.7% ( 0.7- 3.7)
WES (n=422) 1.8*
National 16.7% (14.9 - 18.6) 4.5% (3.7 - 5.5)
** represents estimates for states for which calculated GAM was used due to data quality issues. No SAM estimate available in these states
The Greater Upper Nile (GUN) States (Jonglei, Unity and Upper Nile) and the two traditionally high burden states, Warrap and Northern Bahr el Ghazal, have maintained the highest level of acute malnutrition. In all those five states, the GAM is above the 15% emergency threshold (Table 1).
Insecurity is a key driver of the high levels of under nutrition in the GUN states. The precarious security situation presents major consumption and access constraints and disruption of livelihoods. Households that
depend primarily on own production are faced with food shortages as the last season harvest was not optimal to sustain households to the next season. Substantial displacement of the population as a result of insecurity has further aggravated the situation, affecting consumption and care practices. Nutrition SMART surveys conducted around the same time provide a consistent picture. A few areas within the GUN states, however, show some improvements including Pochalla, Bor South, Akobo and Uror in Jonglei, Leer, Panyinjar and Mayendit in Unity and Fashoda and Longochuk in Upper Nile. Improvement is attributable to better security situation, increased access in most of those counties and provision of assistance. However, the situation in these areas is not guaranteed to continue improving if the security worsens. Moreover, the situation is expected to worsen further at the peak of the lean season expected in May/June.
In Warrap and Northern Bahr el Ghazal, the 2014 agricultural season was affected by floods that destroyed agricultural fields. This resulted in earlier than usual depletion of household food stocks. Also, staple commodity prices have gone up substantially in some of the areas affecting household access to food and consumption patterns. Increased insecurity along
areas bordering Sudan could have had an impact on the situation in these states. Also noted is the migration of animals during this period in search for pasture, rendering reduced consumption of animal products in some areas.
Consistent with previous assessments, GAM in the states of Lakes, Eastern Equatoria State and Western Bahr el Ghazal states is at Serious3 level (GAM of 10-14.9%) based on WHO classification while that in CES and WES is at Alert4 and Acceptable5 levels respectively. These areas witnessed better production from last agricultural season and have better market functionality. However, events in parts of Lakes, Eastern Equatoria State and Western Bahr el Ghazal have contributed to maintaining these areas at
Serious level including: the effects of flooding on population health and food production, tribal conflict/insecurity on
13
.5
11
.8 13
.8
14
.4
13
.9
16
.6
14
.8 16
.9
8
17
.1
4.1
11
16
.2
10
.6
14
.6
15
.2
17
.2
10
.1
5.87
.2
10
19
.5
12
.2
19
.7
15
.4
21
.2
12
1.8
19
0
5
10
15
20
25
CES EES Jonglei Lakes NBS UNS Warrap WBS WES Unity
Figure 13: Trend of Global acute malnutrition
Aug '14 Nov'14 Mar '15 Emergency threshold

A collaborative activity of MOEST, NBS, SMoAF, SMoH, SSGID, SSMDP, SSRRA, SSRRC, FAO, OCHA, UNHCR, UNICEF, WFP, AAH, ACF, ADRA, ATITA, CARE, caritas Suez, CDOT, CDTY, CRS, Don Bosco, FACDDO, FADA, FEWSNET, GAA, GOAL, HeRRY, IRC, JAM, LDA, MEDAIR, NCDA, Nile Hope, NPA, OFAD, PIN, Plan International, RI, SALF, Save the Children, SCC, SMAFC&RD, SMAR, SMARF, SOME, SP, UCDC, UNKEA, VSF-SUISE, World Concern, WVI.
FSNMS Mar/April 2015
10
consumption and feeding patterns, cattle migration reducing access to animal protein; and high market prices that affected food access from the markets.
Overall, the nutrition situation in South Sudan calls for continuing interventions necessarily targeting the GUN states, and the high burden states of Warrap and Northern Bahr el Ghazal states to address the high level of child under nutrition
Women Anthropometry
Out of the 3,759 women 15 to 49 years old assessed, 10.3% were pregnant, 51% were lactating while 38.7% were neither pregnant nor breastfeeding. Wasting based on MUAC (<230mm) was prevalent in 17.1% of the women, depicting an increasing trend when compared to previous GAM of 10.4% among women 15 to 49 years. Similar to the previous FSNMS, states with the highest prevalence of wasted women include Jonglei (27%), Warrap (22.8%), Upper Nile (22.1%), Northern Bahr el Ghazal (20.9%), Unity (20.7%) and Eastern Equatoria State (18.4%) (Figure 14).
Notably, the worst maternal nutrition prevails in states with the worst acute malnutrition in children suggesting commonality in factors that affect child and maternal nutrition and a need to continue addressing child and women malnutrition concurrently.
Wasting was 17.3% among the Pregnant and lactating women and does not differ significantly from wasting among the overall women nutrition, implying that programmes that address women nutrition need to target all women of reproductive age.
Retrospective morbidity
Results from recall of illnesses children suffered two weeks prior to the assessment also show an increase in morbidity, based on the prevalence of watery diarrhea among the children (Figure
15). The highest prevalence of diarrhea is seen in Unity, UNS, Western Equatoria State, Northern Bahr el Ghazal and Warrap. Again, the states with the worst GAM are seen to have the highest disease prevalence, demonstrating the role of morbidity in under nutrition. Factors associated with wasting in children At a bivariate level, factors found significantly associated with child wasting (P value < 0.05) include; child suffering from diarrhea, child being male, child being under two years, child belonging to household with a wasted women, household having low dietary diversity and household not employing stress coping. History of child suffering from diarrhea was significantly associated with child
0.0
10.0
20.0
30.0
40.0
50.0
60.0
WES EES Jonglei Lakes UNS WBS NBS Warrap CES Unity
Figure 15: Prevalence of diarrhoea among children 6 - 59 months
Nov/Dec '14 Mar/Apr '15
2.4
17.5
16.1
6.4
14.1
9.9
17.6
8.8
3.3
10.4
6.9
18.4
27.0
7.6
20.9
20.7
22.1
22.8
11.5
7.0
17.1
0 5 10 15 20 25 30
CES
EES
Jonglei
Lakes
NBS
Unity
UNS
Warrap
WBS
WES
National
Figure 14: Wasting in Women 15 to 49 years
Mar/Apr '15 Nov /Dec '14

A collaborative activity of MOEST, NBS, SMoAF, SMoH, SSGID, SSMDP, SSRRA, SSRRC, FAO, OCHA, UNHCR, UNICEF, WFP, AAH, ACF, ADRA, ATITA, CARE, caritas Suez, CDOT, CDTY, CRS, Don Bosco, FACDDO, FADA, FEWSNET, GAA, GOAL, HeRRY, IRC, JAM, LDA, MEDAIR, NCDA, Nile Hope, NPA, OFAD, PIN, Plan International, RI, SALF, Save the Children, SCC, SMAFC&RD, SMAR, SMARF, SOME, SP, UCDC, UNKEA, VSF-SUISE, World Concern, WVI.
FSNMS Mar/April 2015
11
Table 2: Associated characteristics of the malnourished
Variable % Children
wasted % Children not wasted
P-value
Child age 6 to 23 months 46.9 34 0.000
24 to 59 months 53.1 66
Child sex*
Male 56 49.1 0.001
Female 44 50.9
Retrospective morbidity
Child suffered diarrhea 27.1 17.8 0.000
Child did not suffer diarrhea 72.9 82.2
Woman nutrition*
Wasted 24.9 14.8 0.000
Not wasted 75.1 85.2
Household dietary diversity
Low 53.8 46.3 0.000
Medium to High 46.2 53.7
Livelihood coping
No stress coping 64.1 68.8 0.034
Stress coping 35.9 31.2
wasting/acute malnutrition. Physiological conditions associated with disease can hamper growth by suppressing appetite, impairing absorption of nutrients, increasing nutrient losses and diverting nutrients away from growth. Therefore disease prevention measures are necessary to address high levels of under nutrition.
Significant association found between child wasting and child being male or aged under two is consistent with many surveys and supports the focus on children under two years in programming of preventive nutrition support. Households with low dietary diversity were significantly more likely to have a malnourished child, an indication that households with better access to food are more likely to have better fed in children. Therefore, efforts to increase dietary diversity at household level will likely support better complimentary feeding/child nutrition status.
A strong association was found between child wasting and a household having a wasted woman, suggesting that well-nourished women are more likely to provide better care to children. Therefore, the need for mothers to be supported to have good nutrition remains vital for good child nutrition. Households that employed stress coping were significantly less likely to have a wasted child than the households that did not employ stress coping. This is indicative of food access constraints in a households, where households struggle to maintain adequate food consumption/better nutrition through coping.
Assistance received
About 20% of the assessed households had received some form of assistance three months preceding the assessment. Of the households that had received some form of assistance, 88% had received food assistance. The Greater Upper Nile states were the highest recipients of food assistance: Jonglei and Unity with 98% each and Upper Nile 84%, while Lakes and NBS also had high prevalence of food assistance: 84% and 82% respectively. States with the least prevalence of food assistance were EES 25%, WBS 33% and WES 50%. It is notable that most of the food assistance received in the Equatorias and Bahr el Ghazals were typically through livelihood support and targeted nutrition supplies unlike the Greater Upper Nile that mainly reported general food distribution.
Of the populations that received food assistance, 80% received General food distribution, 16% received supplementary feeding, with 4% receiving food through asset creation programmes. Female headed households are the highest recipients of general food distribution at 83% while male headed households were more likely to have received food through asset creation programmes.
Food security outlook
The food security situation in South Sudan has worsened and will continue to witness increased turbulence in the lean season with the worst affected regions being Greater Upper Nile and Greater Bahr el Ghazals, particularly Warrap and Lakes.

A collaborative activity of MOEST, NBS, SMoAF, SMoH, SSGID, SSMDP, SSRRA, SSRRC, FAO, OCHA, UNHCR, UNICEF, WFP, AAH, ACF, ADRA, ATITA, CARE, caritas Suez, CDOT, CDTY, CRS, Don Bosco, FACDDO, FADA, FEWSNET, GAA, GOAL, HeRRY, IRC, JAM, LDA, MEDAIR, NCDA, Nile Hope, NPA, OFAD, PIN, Plan International, RI, SALF, Save the Children, SCC, SMAFC&RD, SMAR, SMARF, SOME, SP, UCDC, UNKEA, VSF-SUISE, World Concern, WVI.
FSNMS Mar/April 2015
12
The continuing political instability will weigh heavily against opportunities for income sources and market functionality thus continue to hinder household’s food access since approximately 53% of households in South Sudan depend on markets. With the onset of the lean season, market prices are likely to further increase limiting accessibility by poor households with weaker purchasing power. In addition, the rapidly widening gap between official and unofficial foreign exchange rates currently witnessed in the markets will further erode the purchasing power of households especially the majority that depend on markets for foods.
Thus, humanitarian assistance is projected to remain the only viable remedy for majority of the vulnerable households in the country estimated at over 4 million, at least until the green harvest period (in in late July). The most vulnerable groups are IDPs both in camps and in communities, the urban poor and most residents of Greater Upper Nile and parts of Bahr el Ghazal who either had limited production in the previous season or are already severely affected by the downward spiraling of prices.
Methodology
The Food Security and Nutrition Monitoring System (FSNMS) is a collaborative effort involving over 35 organizations (government, UN, NGOs and community-based organizations) that aims to provide periodic food security findings that are representative at national and state levels. It provides and allows monitoring of trends and changes in key food security and nutrition indicators over time. Data were collected from 28 clusters (sites) randomly selected from each of the ten states based on probability proportional to sizes (PPS), factoring in population movements in the case of Greater Upper Nile. A further 15 randomly selected households were surveyed in each site. One community/key informant interview (where applicable) was conducted at each selected cluster to provide supplementary information that would explain some of the quantitative findings.
The data collection process experienced accessibility and security challenges: three sites in Jonglei, three sites in Unity and one site in EES were not surveyed. However, the number of sites surveyed were still sufficient to provide valid and representative information.
Data collection from a total of 3,906 households was undertaken in March/April 2015, followed by analysis and reporting in May 2015. Of the assessed households, 26% were female headed. The average household size is seven persons.
In understanding the food security situation, the below basic indicators were used:
Food consumption was derived using a seven-day recall period. Food items were weighted based on their nutritional value to establish a food consumption score that classifies the households having either acceptable, borderline or poor food consumption.
The reduced Coping Strategies Index was derived from the severity and the frequency of the consumption coping strategies applied by households in the last seven days prior to the assessment. More severe coping strategies are often those with irreversible effects on the households’ livelihoods.
Livelihood coping mechanisms was also analyzed with the coping mechanisms categorized into: emergency, crisis and stress coping mechanisms.
Household food security categories were established according to a composite index derived from household’s food consumption indicators and coping capacity (using indicators measuring economic vulnerability and asset depletion). From the CARI analysis, households are grouped into five categories: severely food insecure (SFI), moderately food insecure (MFI), marginally food secure (MFS) and food secure (FS). State abbreviations
Western Equatoria (WES), Eastern Equatoria (EES), Central Equatoria (CES), Upper Nile (UNS), Western Bahr el Ghazal (WBS), Northern Bahr el Ghazal (NBS)
For additional information, please contact [email protected] The FSNMS partners: