south regional wastewater treatment plant evaluation...
TRANSCRIPT

SOUTH REGIONAL WASTEWATER
TREATMENT PLANT
EVALUATION AND
MASTER PLAN
Prepared by: HDR Engineering, Inc.
17111 Preston Road, Suite 200 Dallas, TX 75248
Firm Registration No. 754

South Regional WWTP Improvements Project #66962 Page i of ii
Master Plan
TABLE OF CONTENTS
Project Description ............................................................................................... 1
Initial Design Projects ........................................................................................... 1
Pump Station 200 Improvements .............................................................................................................................. 1 Grit Facility Evaluation ............................................................................................................................................... 1 Disinfection Evaluation .............................................................................................................................................. 1 Digester Mixing and Operating Temperature ............................................................................................................. 2
Existing Facility Evaluation ................................................................................... 2
Process Structures .................................................................................................................................................... 3 Process Equipment ................................................................................................................................................... 3 HVAC Systems .......................................................................................................................................................... 3 Estimated Costs ........................................................................................................................................................ 7 SCADA System ......................................................................................................................................................... 7 Electrical Switchgear ................................................................................................................................................. 8 Estimated Costs ........................................................................................................................................................ 9 Electrical .................................................................................................................................................................... 9 Estimated Costs ...................................................................................................................................................... 10
Process Evaluations ........................................................................................... 10
Process Modeling Evaluation .................................................................................................................................. 10 Sludge Dewatering Equipment Comparison ............................................................................................................ 10 Pump Station 200 Relocation .................................................................................................................................. 11 Centrifuge Backdrive Evaluation ............................................................................................................................. 11 Solar Collectors ....................................................................................................................................................... 11 Sludge Heating Evaluation ...................................................................................................................................... 11 Supplementary Alkalinity Evaluation ....................................................................................................................... 11
Recommendations and Capital Improvements Program .................................. 12

Master Plan
South Regional WWTP Improvements Project #66962 Page ii of ii
LIST OF APPENDICES Appendix A – TM No. 1 P.S. 200 Screening Evaluation Appendix B – TM No. 2 – Grit Removal Evaluation Appendix C – TM No. 3 – Disinfection Evaluation Appendix D – TM No. 4 – Digester Mixing Evaluation Appendix E – Process Modeling Report Appendix F – ETC Klorigen Information Appendix G – Characterizing Municipal Grit Entering South Regional WWTP Appendix H – Thickening Centrifuges (Centrisys & Andritz) Appendix I – Belt Filter Presses (Ashbrook Simon-Hartley BFP Proposal) Appendix J – Discharge Permit

Master Plan
South Regional WWTP Improvements Project #66962 Page 1 of 12
Project Description
Texarkana’s South Regional Wastewater Treatment Plant treats most of the wastewater from Texarkana, Texas and Texarkana, Arkansas. The plant was originally constructed in the 1980s and the last major expansion/improvements were implemented in the late 1980s. The plant was originally designed with a treatment capacity of 11.7 mgd, but current permitted capacity is 18 mgd. This report represents a Capital Improvements Plan for the plant. In addition, HDR prepared Technical Memoranda addressing several facilities and/or processes that need improvements soon.
Electrical facilities, SCADA, HVAC structures and process equipment were evaluated during this study.
Initial Design Projects
The Texarkana Water Utilities Management and Staff have indicated that the following items have a high priority for the design and construction of improvements at the South Regional WWTP.
Pump Station 200 Improvements
Types of screens that were evaluated: Perforated Plate Finescreens Reciprocating Rake Front-cleaned Screens.
Recommendation: Replace the two existing front-cleaned screens with two reciprocating rake screens, with 3/8 inch openings. It is further recommended that two washer-compactors, one for each screen, be provided to reduce the screenings organic matter and to provide a dry screened product.
Priority: Since existing screens are maintenance-intensive, and because downstream operations and treatment processes are adversely affected by the screenings that remain in the stream, it is recommended that the replacement of the screens be included in Phase 1 improvements.
Refer to TM 1 in Appendix A for additional information.
Grit Facility Evaluation
Types of grit removal equipment that were evaluated: Aerated Grit
Forced Vortex
Tray Settling Grit Removal (Eutek Headcell)
Recommendation: For 90% removal of 100 micron grit, install two- 12 ft. diameter, 15 tray Headcell grit removal units in one side of the existing aerated grit removal tank, 2-42 inch Slurry Cup Grit Classifying and Washing units, and 2 Grit Dewatering Grit Snails.

Master Plan
South Regional WWTP Improvements Project #66962 Page 2 of 12
Priority: Existing grit removal units are not designed to remove 100 micron grit. As a result, grit accumulates in downstream processes, and in anaerobic digesters. It is recommended that the installation of the Eutek Grit removal equipment be included in Phase 1 improvements.
Refer to TM 2 in Appendix A for additional information.
Refer to TM 2 in Appendix A for additional information. Disinfection Evaluation
Types of disinfection equipment that were evaluated: Gaseous Chlorination and Dechlorination
UV Disinfection
Recommendation: There are safety concerns associated with storage of hazardous gases on site. Also, disinfection by-products (DBPs) may be limited in future regulations. For these reasons, it is recommended that a UV disinfection process be retrofitted into the existing chlorine contact tank.
Priority: It is desirable to switch to UV disinfection as soon as practicable. However, because of budget constraints, it is recommended that the installation of the UV process be included in Phase 2 improvements. Refer to TM 3 in Appendix A for additional information.
Digester Mixing and Operating Temperature
Types of disinfection equipment that were considered: Gas Mixing
Slow-Speed Mechanical Mixing
Pumped Mixing with Chopper Pump Discharge through Nozzles
Recommendation: Gas mixing is not as effective as the other alternatives, Slow-Speed Mixers are more conducive to fixed cover digesters, and pumped mixing systems have been successfully utilized on numerous anaerobic digesters. Therefore, it is recommended that the pumped mixing systems be installed on the 3 primary digesters. Also, it is recommended that the existing sludge heat exchangers be replaced with new combination boilers/sludge heat exchangers, and the digesters be operated at 95 deg F, in lieu of 120 deg F.
Priority: It is recommended that the operating temperatures be changed to 95 deg F as soon as possible to reduce operating costs. The improved screenings and grit removal will lessen the debris added to the digesters. Therefore, it is recommended that the digester improvements be included in Phase 2.

Master Plan
South Regional WWTP Improvements Project #66962 Page 3 of 12
Refer to TM 4 in Appendix A for additional information.
Existing Facility Evaluation
Process Structures Process structures and buildings were reviewed and no significant deterioration was noted.
Process Equipment There are several items of process equipment needing rehabilitation and/or replacement, including:
Belt Filter Presses See Appendix I.
Fine Bubble System See Process Modeling Report, Appendix E,.
Thickening Centrifuges See Appendix H.
HVAC Systems
Overview A site visit was performed on June 8 and 9, 2009 to observe the condition of the mechanical equipment and functionality of each system. The condition of the cooling, heating, ventilation, and filtration systems were documented.
Observations
General: TWU discussed several concerns regarding the original HVAC installation and changes that have been made to keep the system operational. TWU discussed the heating hot water and chilled water distribution system throughout the plant. The existing underground distribution system has corroded and lost a majority of the capacity. Some of the taps have been capped and a small portion of the original distribution system is operational.
The existing solar panels were designed to supplement the boilers and reduce life cycle costs. The system is out-dated and parts are unavailable for repair work. The existing solar panels have uninsulated piping, broken tubes, and sun-damaged reflectors.
Master Plan
South Regional WWTP Improvements Project #66962 Page 4 of 12
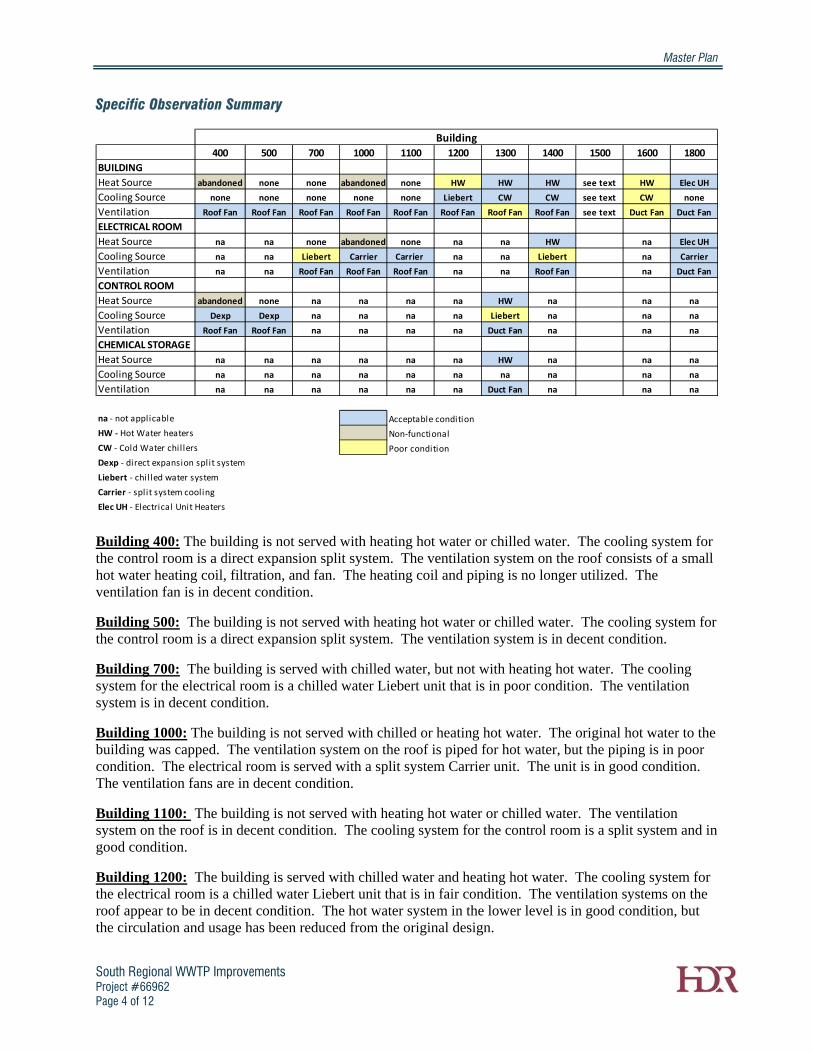
Specific Observation Summary
400 500 700 1000 1100 1200 1300 1400 1500 1600 1800
BUILDING
Heat Source abandoned none none abandoned none HW HW HW see text HW Elec UH
Cooling Source none none none none none Liebert CW CW see text CW none
Ventilation Roof Fan Roof Fan Roof Fan Roof Fan Roof Fan Roof Fan Roof Fan Roof Fan see text Duct Fan Duct Fan
ELECTRICAL ROOM
Heat Source na na none abandoned none na na HW na Elec UH
Cooling Source na na Liebert Carrier Carrier na na Liebert na Carrier
Ventilation na na Roof Fan Roof Fan Roof Fan na na Roof Fan na Duct Fan
CONTROL ROOM
Heat Source abandoned none na na na na HW na na na
Cooling Source Dexp Dexp na na na na Liebert na na na
Ventilation Roof Fan Roof Fan na na na na Duct Fan na na na
CHEMICAL STORAGE
Heat Source na na na na na na HW na na na
Cooling Source na na na na na na na na na na
Ventilation na na na na na na Duct Fan na na na
na ‐ not applicable Acceptable condition
HW ‐ Hot Water heaters Non‐functional
CW ‐ Cold Water chil lers Poor condition
Dexp ‐ direct expansion split system
Liebert ‐ chil led water system
Carrier ‐ split system cooling
Elec UH ‐ Electrical Unit Heaters
Building
Building 400: The building is not served with heating hot water or chilled water. The cooling system for the control room is a direct expansion split system. The ventilation system on the roof consists of a small hot water heating coil, filtration, and fan. The heating coil and piping is no longer utilized. The ventilation fan is in decent condition.
Building 500: The building is not served with heating hot water or chilled water. The cooling system for the control room is a direct expansion split system. The ventilation system is in decent condition.
Building 700: The building is served with chilled water, but not with heating hot water. The cooling system for the electrical room is a chilled water Liebert unit that is in poor condition. The ventilation system is in decent condition.
Building 1000: The building is not served with chilled or heating hot water. The original hot water to the building was capped. The ventilation system on the roof is piped for hot water, but the piping is in poor condition. The electrical room is served with a split system Carrier unit. The unit is in good condition. The ventilation fans are in decent condition.
Building 1100: The building is not served with heating hot water or chilled water. The ventilation system on the roof is in decent condition. The cooling system for the control room is a split system and in good condition.
Building 1200: The building is served with chilled water and heating hot water. The cooling system for the electrical room is a chilled water Liebert unit that is in fair condition. The ventilation systems on the roof appear to be in decent condition. The hot water system in the lower level is in good condition, but the circulation and usage has been reduced from the original design.

Master Plan
South Regional WWTP Improvements Project #66962 Page 5 of 12
Building 1300: The building is served with heating hot water and chilled water. The control room in the lower level is served with a chilled water Liebert unit. The unit is in poor condition. The ventilation systems for the chemical storage room and throughout the lower level is in decent condition. The scrubber ductwork and fan appear to be in decent condition. The ventilation units on the roof are in poor condition. Some of the casings have gaps around the pipe penetrations and the coils have rusted supports and guides.
Building 1400: The building is served with chilled water and heating hot water. The cooling system for the electrical room is a chilled water Liebert unit that is in poor condition. The unit is heavily rusted and the cooling coil is scaled over 25% of the face area. The ventilation system on the roof is in decent condition. The louver on the unit is rusted, but functional. The existing exhaust fans are in good condition. The lower level air devices appear to be slightly rusted, but still functional.
Building 1500: The generator room contains two 1,500 KW generators with four ventilation fans and two hot water unit heaters. The generators are fueled from an underground diesel storage tank. Each generator has a remote radiator on the South side of the building. The ventilation equipment was in decent condition and operating. There are two chillers on site, of which, one is functional and one is not. The chilled water system contains two chillers, two pumps, and two cooling towers. The existing Trane chiller does not work and the Carrier chiller maintains full capacity for the plant site. Each chiller has an associated pump and the pump associated with the Carrier unit, Paco, is sized for full capacity. The Trane pump, Peerless, does not have enough pressure or capacity to operate at full load and therefore, isn’t used. The cooling tower tops were recently replaced, but the bottom portion is part of the original unit. The tops are in good condition and the bottoms are in fair condition. The heating hot water system contains two boilers and two pumps. Both boilers operate and are in acceptable condition. The system does not allow for shut down because some of the isolation valves don’t close. Staff indicated they would shut the system down soon and replace all the valves in order to repair the hot water pumps. The existing chemical feeders are in poor condition. The water softener was in good condition.
Building 1600: The building is served with heating hot water and chilled water. The existing air handling units in the mechanical room do not have automatic ability to adjust the temperature of the air distributed to the spaces. The current configuration is a manual valve system that requires personnel to read a thermometer at the air discharge of the unit and adjust the valve accordingly. The laboratory spaces have rusted air devices. This building shows signs of improper humidity levels, insulation problems, and condensation drainage problems.
Building 1800: The building is not served with chilled or heating hot water. The original hot water unit heaters are there, but do not work since the hot water was capped-off to the building. New electric unit heaters were installed in their place. The electrical room is served with a split system Carrier unit. The unit is in good condition. The ventilation system was in decent condition.
Recommendations
General: The existing chilled water Liebert units serving the electrical/ control rooms are all in fair to poor condition and should be replaced. The units are approximately 20 years old and ASHRAE states a service life between 15 and 20 years is typical. The units can be replaced with a similar chilled water unit, or with a split system similar to the new Carrier units on site. These replacements should be high on the priority list, within 5 years. The existing Carrier units are all in good condition and installed within the last 5 years.

Master Plan
South Regional WWTP Improvements Project #66962 Page 6 of 12
The existing fans (pad-mounted or roof centrifugal) are all in acceptable condition. It appears all are functional and have a few remaining years left. The units are approximately 20 years old and ASHRAE states a service life of 25 years is standard. These units will need to be replaced over time, but be between 5-10 years on the priority list.
The roof mounted ventilation units with hot water piping are in acceptable condition. Practically all of the units do not have hot water supplied to the unit, rendering the piping and coils useless. The primary function of these large units is for ventilation purposes only. All units are approximately 20 years old and ASHRAE states a service life of 15 years is standard. The coils have not been used and show signs of weathering (seals and welds are broken). These units will need to be replaced soon and should be high on the priority list, within 5 years.
A majority of the ductwork throughout the campus was covered appropriately. Based on some exposed areas, the ductwork was in good condition. ASHRAE states a service life of 30 years is standard. The ductwork does not need to be replaced within the next 10 years unless a section fails.
The air devices, such as louvers and registers appear to be in acceptable condition throughout the site with the exception of the Building 1600, and those specifically noted. The plant site air devices are in acceptable condition but have dirt build-up and minor corrosion. ASHRAE states a service life 27 years is typical. These devices will need to be replaced over time, but should not be high on the priority list, between 5-10 years.
The hot water heating system is in overall poor condition. For the system to operate as designed, it requires a complete overhaul of equipment and appurtenances. Considering all the underground leaks the hot water system is inefficient and expensive. ASHRAE states a service life of 25 years for steel fire-tube boilers and 20 years for base mounted pumps. The heating system is currently supported with electric unit heaters located throughout the campus and minimal hot water use. The electric unit heaters have been installed within the last 5 years and have a standard life of approximately 13 years. Removing the hot water heating system and replacing with electric unit heaters is recommended. The existing system removal and unit heater replacement should be high on the priority list, within 5 years.
The chilled water system is in acceptable condition. The existing carrier chiller and pump is fairly new and handles 100% of the site’s capacity. There is no backup for the chilled water system at this time. The original Trane chiller does not work and the associated pump is not large enough to handle the distribution pressure. The existing system should remain operational with the removal of the Trane chiller and Peerless pump and with the addition of a new backup chiller and pump. This replacement should be high on the priority list, within 5 years.
The existing solar heating system is in poor condition and replacement parts are not available repairs. The existing controls are pneumatic and are operable. Some of the pneumatic lines have become hard and cracked, but still function. ASHRAE states a service life of 20 years is standard. The controls should be replaced along with the equipment or system they serve.
The Administration Building HVAC should be reconditioned so the laboratory temperature is balanced correctly with the fume hoods and so the air conditioning system can maintain a set temperature and temperatures between rooms are consistent. The existing systems serving the space are approximately 20 years old. ASHRAE states a service life between 15- 19 years is standard for typical applications. These units should be high on the priority list, within 5 years.

Master Plan
South Regional WWTP Improvements Project #66962 Page 7 of 12
Estimated Costs Immediate needs, within 5 years:
Liebert Unit Replacement- $35,000
Roof Ventilator Replacement- $70,000
New Electric Heat- $60,000
Chiller, Pump, Cooling Tower- $120,000
Miscellaneous Controls- $65,000
Administration Building- $160,000
Total- $510,000 5-10 Year Needs:
Exhaust Fans- $40,000
Demo Solar- $30,000
Demo Hot Water- $60,000
Miscellaneous Controls- $25,000
Total- $155,000
10+ Year Needs:
Ductwork and Air Devices- $30,000
Total- $30,000
SCADA System The existing plant control system is hardwired to a main plant control panel located in the Administration Building. Over the years much of the underground wiring has failed. As a result, most of the plant is operated manually due to failures of this wiring and other plant instrumentation. A plant-wide control system utilizing a SCADA System is recommended. A SCADA System is already in place at the WWTP for monitoring the various lift stations serving the WWTP. The following is recommended:
Utilize PLCs (programmable logic controllers) for the Plant Control System.
Utilize PC-based operator interfaces (HMI-Human Machine Interface) in the WWTP Control Room to provide central monitoring and control capabilities. The HMI (SCADA System) will include graphic screens to monitor and control WWTP processes/equipment.
Utilize Master PLC (programmable logic controller) controller with local PLCs/Remote I/O cabinets for plant control and monitoring.

Master Plan
South Regional WWTP Improvements Project #66962 Page 8 of 12
Provide at least one local microprocessor-based touch screen on a PLC panel for operators to monitor the plant from within the plant. Location of touch screen will be determined by the Owner.
Provide “PC Anywhere” type software such that personnel may be able to monitor the WWTP from a remote location.
Utilize fiber optic cable to provide communication between each local PLC and the WWTP Control Room Master PLC.
There has been discussion among plant staff about whether to use fiber optic as the communication medium or to use wireless. Although wireless has its advantage in that no underground ductbank system will be required, there are other factors that still lead to fiber optic as the selected medium. The wireless transmissions are affected by adverse weather. The communication speed at which data is transmitted is slower than for fiber optic so critical communications might be slower than needed. Since fiber optic is unaffected by electrical noise, it can be pulled into existing ductbanks if there are spare conduits available, or can be routed at a shallower depth so that interference with existing underground utilities can be minimized. A loop system for the fiber optic communications network can be provided to increase reliability for the case of accidental breakage of the fiber. Installation of wireless modems would be less expensive than installation of fiber optic cable, but the Owner is able to install the cable themselves, thus saving a large portion of cost associated with fiber optic systems. In addition, introducing security cameras at the WWTP and fiber will provide a better medium for transmitting the signals to the WWTP control room.
Nearly each building at the WWTP has an instrumentation/control panel. These will make convenient locations to install either PLCs or remote I/O cabinets for tying into PLCs.
Other recommendations at the WWTP for improved instrumentation include:
Eliminate the existing PLCs used for sequencing restarts during power outages at motor control centers. Use SCADA PLC for sequencing restarts.
Replace the existing level transmitters in the Primary Clarifiers’ Scum Boxes with float switches to automatically shut off the pumps on low level.
Utilize PLC logic to perform control functions rather than existing single loop controllers mounted on control panels.
Estimated Costs
Immediate needs, within 5 years:
Total- $432,000
Electrical Switchgear The majority of major electrical equipment at the plant is nearing 20 years old. It appears to be in good condition. The outdoor switchgear/switchboards should be cleaned of dirt, dust, and spider webs, and resealed at the base of the equipment to inhibit entrance of outside contaminants. There is no need at this time to do any major replacement of electrical switchgear. Plant staff report that the main 12.47 KV switchgear needs to be inspected. Because of the age of the major electrical equipment all the medium voltage switchgear and 480 volt motor control centers should be inspected and tested. This would include
Master Plan
South Regional WWTP Improvements Project #66962 Page 9 of 12
infrared testing of busses and cable terminations. This inspection and testing should be performed about every 3 years.
NFPA 70E requires labeling of electrical equipment for arc flash protection during work on energized electrical equipment. The electrical equipment at the plant does not have these labels. To determine arc flash labeling, an arc flash study must be performed to determine the amount of energy that an arc flash can produce so that appropriate PPE (personal protective equipment) may be worn.
Plant staff are concerned that none of the 480 volt motor control centers have lightning or surge protection on their busses. It is standard practice to include TVSS (transient voltage surge suppressors) equipment on all low voltage equipment (mostly 480 volt equipment) which serves as the source of power distribution within a facility. Since all the motor control centers in the plant are fed via outdoor switchgear it is recommended that all 480 volt motor control centers be provided with TVSS equipment. Where sensitive electronic equipment is located and served by low voltage panelboards it is also recommended that these panelboards also be provided with TVSS equipment.
Lighting over the clarifiers consists of fixtures mounted on 16 FT poles attached on walkways. It is recommended that these fixtures be replaced with stanchion type fixtures which then attach to the handrail. These fixtures would then be approximately 7 FT high which will make repairs and lamp replacement easier and safer.
Clarifier sludge collection equipment is controlled via Start/Stop pushbuttons. It is recommended that these pushbuttons be replaced with On/Off selector switches so that on power loss the equipment will come back on when power returns without having to manually re-start all the sludge collectors.
In the Preaeration/Grit Building No. 400 it is recommended that the existing fluorescent lighting fixtures be replaced with metal halide type fixtures to improve lighting levels and safety. Several of the fixtures are now located directly over process equipment which can make for a hazardous situation when replacing lamps. The fluorescent fixtures in the stairwell should be relocated as several of these fixtures are located too high for normal maintenance.
Lighting levels in the stairwell of Building 1200 is poor. Additional fluorescent lighting fixtures should be added or replaced with metal halide type light fixtures to improve light levels.
Existing lighting at the aeration basins should be improved by installing stanchion type light fixtures attached to the handrails. These fixtures would be approximately 7 FT high which will make maintenance easier and safer.
Electrical Lighting modifications
Switchgear inspection
Lightning/surge protection on all MCCs
Miscellaneous equipment modifications or replacement.
Costs of electrical modifications required as part of process modifications are included with the process modifications.

Master Plan
South Regional WWTP Improvements Project #66962 Page 10 of 12
Estimated Costs Immediate needs, within 5 years:
Total- $ 250,000
Process Evaluations
Process Modeling Evaluation The Process Modeling Report is included in Appendix E. The purpose of this assessment was to evaluate the operations and performance of the Texarkana South Regional Wastewater Treatment Facility (WWTF), estimate capacity for the higher system loadings, and investigate alternative flow schemes to match or improve facility performance while meeting permitted discharge requirements and reducing operations inefficiencies. In order to reduce caustic addition, minimize oxygen demand and aeration needs, and reduce overall chemical needs for the system, alternative treatment schemes were investigated. Process alternatives investigated were restricted to schemes compatible with phosphorus removal by either chemical or biological means.
Sludge Dewatering Equipment Budget prices were obtained for rehabilitating the existing Belt Filter Presses (BFP) as well as replacement costs for new equipment. Costs were also obtained for replacing the BFPs with dewatering centrifuges.
Activated Sludge Thickening Centrifuges Thickening centrifuges are in need of rehabilitation. See Centrisys and Andritz proposals in Appendix H and summarized below. It is recommended that this work be included in the Phase I contract.
Centrifuge Backdrive Evaluation Estimated cost for repairing the centrifuges have been provided by Centrisys and an estimated cost for providing a new backdrive and scroll have been provided by Andritz.
Based on Recommendations and pricing from Centrisys
Unit No. Range of Estimated
Repair Cost
11 $ 15,000 $ 25,000
12 $ 0 $ 0
13 $ 5,000 $ 9,000
$ 3,500 $ 6,500
$ 8,500 $ 15,500
14 $ 8,500 $ 15,500
Shipping and Reinstallation $ 4,000 $ 6,000
TOTAL $ 36,000 $ 62,000
Master Plan
South Regional WWTP Improvements Project #66962 Page 11 of 12
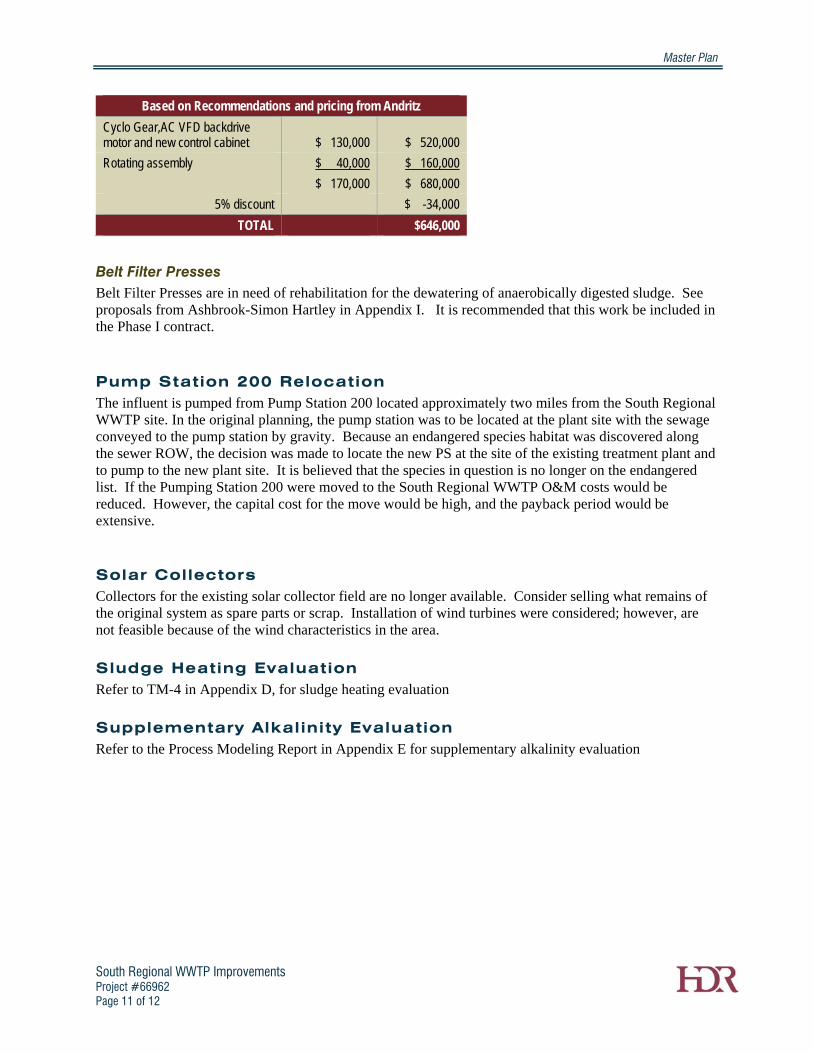
Based on Recommendations and pricing from Andritz
Cyclo Gear,AC VFD backdrive motor and new control cabinet $ 130,000 $ 520,000
Rotating assembly $ 40,000 $ 160,000
$ 170,000 $ 680,000
5% discount $ -34,000
TOTAL $646,000
Belt Filter Presses Belt Filter Presses are in need of rehabilitation for the dewatering of anaerobically digested sludge. See proposals from Ashbrook-Simon Hartley in Appendix I. It is recommended that this work be included in the Phase I contract.
Pump Station 200 Relocation The influent is pumped from Pump Station 200 located approximately two miles from the South Regional WWTP site. In the original planning, the pump station was to be located at the plant site with the sewage conveyed to the pump station by gravity. Because an endangered species habitat was discovered along the sewer ROW, the decision was made to locate the new PS at the site of the existing treatment plant and to pump to the new plant site. It is believed that the species in question is no longer on the endangered list. If the Pumping Station 200 were moved to the South Regional WWTP O&M costs would be reduced. However, the capital cost for the move would be high, and the payback period would be extensive.
Solar Collectors Collectors for the existing solar collector field are no longer available. Consider selling what remains of the original system as spare parts or scrap. Installation of wind turbines were considered; however, are not feasible because of the wind characteristics in the area.
Sludge Heating Evaluation Refer to TM-4 in Appendix D, for sludge heating evaluation
Supplementary Alkalinity Evaluation Refer to the Process Modeling Report in Appendix E for supplementary alkalinity evaluation

Master Plan
South Regional WWTP Improvements Project #66962 Page 12 of 12
Recommendations and Capital Improvements Program
Components included in each Phase of Construction are listed below:
PHASING OF PROJECTS Phase 1 HVAC Package 1 $510,000 SCADA $432,000 Electrical includes - Arc Flash & Switchgear $379,000 PS 200 Screens $1,500,000 Grit Removal $2,080,000 Sludge Thickening Centrifuges $748,000 Sludge Dewatering BFPs $852,000
Total Ph 1 w/Contingency $6,501,000 Phase 2 HVAC Package 2 $155,000 UV Disinfection $1,536,000 Digester Mixing for 3 Digesters $1,151,000 Digester Cleaning $1,026,000 Digester Sludge Heating $890,000
Total Ph 2 w/Contingency $4,758,000 Phase 3 HVAC Package 3 $30,000 Anoxic Basin $721,000 Diffusers, Blowers, and Piping $1,750,000 Miscellaneous $140,000
Total Ph 3 w/Contingency $2,641,000
Total For 3 Phases, 2009 Dollars $13,900,000
Phase 2 and 3 could be affected if changes in the existing Discharge Permit (Appendix J), are included in the next renewal. The existing discharge permit is included in Appendix J. This permit expires in 2011. TCEQ was contacted regarding changes that may be included at that time, specifically limits for phosphorus, nitrogen and Disinfection By-Products (DBPs).
The indications were that no changes are expected related to nitrogen. Phosphorus and DBPs are being reviewed state-wide at this time, but they have no specific information regarding potential changes in the Texarkana South Regional WWTP Discharge Permit.

Appendix A
APPENDIX A
APPENDIX A
TECHNICAL MEMORANDUM NO. 1
P.S. 200 SCREENING EVALUATION

South Regional WWTP Improvements Project #66962 Page 1 of 12
TM No. 1 PS 200 Evaluation
Introduction
After nearly 30 years, Pump Station 200 (PS 200), an offsite facility where influent screening and pumping takes place, is in need of improvement. The 2 chain-driven screens at this facility require extensive maintenance, especially after high flow/wet weather events. The chains that operate the screen rakes frequently break, requiring down time and time consuming maintenance after high flow periods. Screenings are lifted into trash bins that are manually rolled out and emptied into the outside dumpsters between three and twenty times per day depending on the flows. This Technical Memorandum (TM) discusses the existing facilities at PS 200, improvement alternatives, and recommendations for a more efficient and operation/maintenance-friendly facility.
Design Criteria
From 2003 through 2007, influent flows at the WWTP averaged approximately 9.0 mgd. The maximum influent flow was approximately 36 mgd in January 2007, after a 3.2 inch rainfall. PS 200 can pump up to 54 mgd, but with current operations and screen maintenance issues, gates are adjusted so that no more than 40 mgd is allowed to flow through the screens. The excess flow is forced back into the system where it is stored until the flows subside. Based on historical flows, PS 200 can handle the current influent flows. A total design capacity of 54 MGD will be used to evaluate PS 200 screening improvement alternatives. Other design criteria for the screens include the following:
Clear space between the bars: 3/8-inch spacing is recommended to protect downstream processes (existing screens have 1-inch spacing).
Materials of construction: Stainless Steel.
Dimensions of the channel: 4 feet wide maximum and 11 feet maximum depth.
Total length from bottom of channel to top of operating floor: 31 feet.
Each screen design flow: 36 mgd.
Upstream design high water level: 8 feet.
Per channel approach velocity of the wastewater stream: At 36 mgd 1.7 ft/s.
Angle of inclination of the screen: The existing screens have inclination angles of 84 degrees. Without structural modifications to PS 200, the inclination angles of any new screens will have to be at or near 84 degrees.
Current screenings volume production with 1-inch spacing and zero compaction: Average of 2.7 cubic yards per day.
Since significant improvements are required at PS 200, the alternative of abandoning PS 200, constructing a new gravity pipeline from PS 200 to the WWTP, and constructing a new pump station and screening facility at the WWTP was considered. However, the high costs associated with constructing a new pump station at the WWTP and installing a new gravity sewer main from PS 200 to the new pump station precluded this alternative from further evaluation.

TM No. 1 – PS 200 Evaluation
South Regional WWTP Improvements Project #66962 Page 2 of 12
Condition Assessment
PS 200 (as shown in Figure 1) is located about one mile north of the WWTP. The incoming flow into the pump station splits into two channels where two chain-driven screens are located. The existing one-inch spaced metal bar screens are front-cleaned. A motor driven chain mechanism moves the rake teeth through the one-inch vertical screen openings. Frequently, during high flows, when the channel receives a high volume of screening material, the rake and chain undergo a high degree of stress due to the hydraulic forces acting on it, which presumably bind the rake and, in the absence of any over-torque protection on the chain drive, often break the chain mechanism. During a chain break, the channel must be taken offline and the chain repaired before it can be operated again, which can take up to two days. During high flows there is an immediate need to repair breakdowns.
Currently at PS 200, the screened materials at each of the two screens are raked into trash bins that hold up to 0.5 cubic yards (partially visible in Figure 2). These bins, once full, are manually rolled outside of the building and emptied into the two dumpsters shown in Figure 3. During normal dry weather flows, approximately three trash bin loads are generated per day (1.5 cubic yards), and during wet weather higher flows, up to twenty trash bin loads are generated per day (10 cubic yards). Since the facility does not have the ability to wash or compact the screenings, the site produces a high volume of screened materials and generates odors.
Figure 1 – Pump Station 200

TM No. 1 – PS 200 Evaluation
South Regional WWTP Improvements Project #66962 Page 3 of 12
Figure 2: Screens at PS 200
Figure 3 – Dumpsters at PS 200
Screen Opening
Screen opening size is one of the most important design considerations for screen selection. It not only impacts screenings removal efficiency, but also the sizing of the screens, plant influent hydraulics (headloss through the screen), and screenings handling equipment capacity and facility requirements. Screen opening affects the quantity and characteristics of screenings removed from the flow stream. A smaller (closer) opening will remove more solids, providing a greater degree of protection for downstream equipment, but will generate more screening material that must be disposed of.
TM No. 1 – PS 200 Evaluation
South Regional WWTP Improvements Project #66962 Page 4 of 12
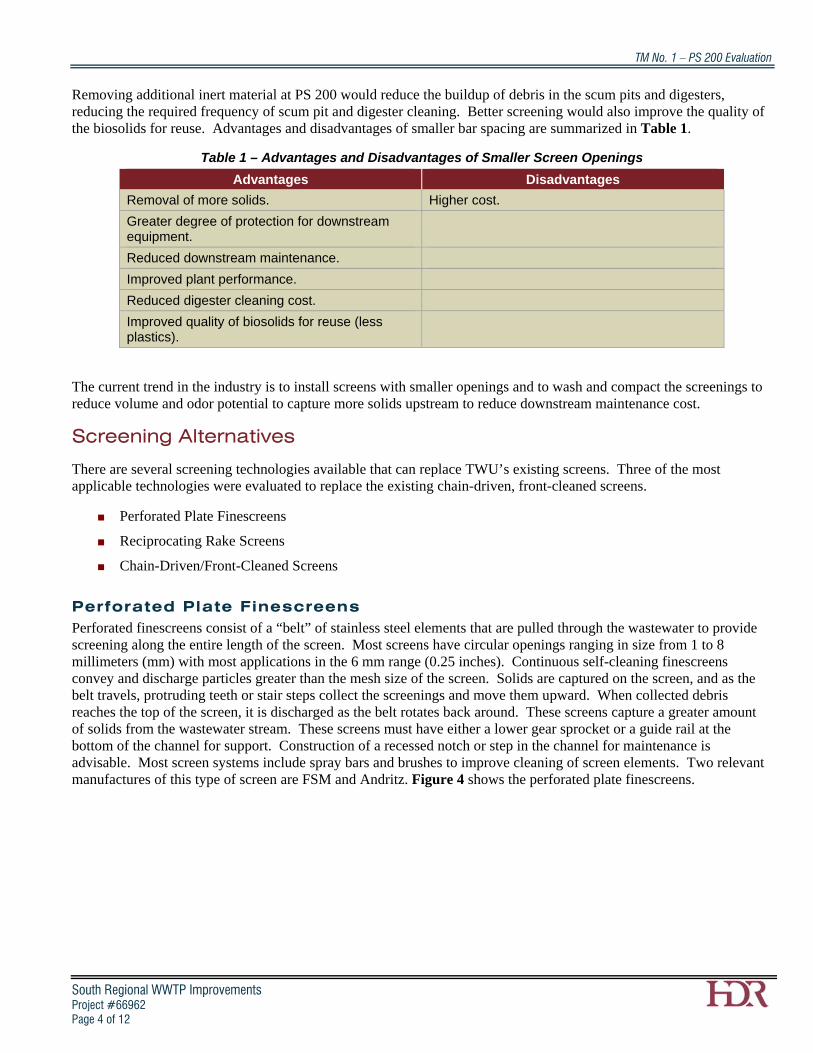
Removing additional inert material at PS 200 would reduce the buildup of debris in the scum pits and digesters, reducing the required frequency of scum pit and digester cleaning. Better screening would also improve the quality of the biosolids for reuse. Advantages and disadvantages of smaller bar spacing are summarized in Table 1.
Table 1 – Advantages and Disadvantages of Smaller Screen Openings
Advantages Disadvantages
Removal of more solids. Higher cost.
Greater degree of protection for downstream equipment.
Reduced downstream maintenance.
Improved plant performance.
Reduced digester cleaning cost.
Improved quality of biosolids for reuse (less plastics).
The current trend in the industry is to install screens with smaller openings and to wash and compact the screenings to reduce volume and odor potential to capture more solids upstream to reduce downstream maintenance cost.
Screening Alternatives
There are several screening technologies available that can replace TWU’s existing screens. Three of the most applicable technologies were evaluated to replace the existing chain-driven, front-cleaned screens.
Perforated Plate Finescreens
Reciprocating Rake Screens
Chain-Driven/Front-Cleaned Screens
Perforated Plate Finescreens Perforated finescreens consist of a “belt” of stainless steel elements that are pulled through the wastewater to provide screening along the entire length of the screen. Most screens have circular openings ranging in size from 1 to 8 millimeters (mm) with most applications in the 6 mm range (0.25 inches). Continuous self-cleaning finescreens convey and discharge particles greater than the mesh size of the screen. Solids are captured on the screen, and as the belt travels, protruding teeth or stair steps collect the screenings and move them upward. When collected debris reaches the top of the screen, it is discharged as the belt rotates back around. These screens capture a greater amount of solids from the wastewater stream. These screens must have either a lower gear sprocket or a guide rail at the bottom of the channel for support. Construction of a recessed notch or step in the channel for maintenance is advisable. Most screen systems include spray bars and brushes to improve cleaning of screen elements. Two relevant manufactures of this type of screen are FSM and Andritz. Figure 4 shows the perforated plate finescreens.

TM No. 1 – PS 200 Evaluation
South Regional WWTP Improvements Project #66962 Page 5 of 12
Figure 4 – Perforated Plate Finescreens
The FSM Finescreen consists of two parallel conveyor links attached on each side of the perforated screen element and continuously joined together engaging in a geared motor driven top drive guide and engaging in a bottom rotating guide. The unit is constructed of 304 or 316 stainless steel and can accommodate channels with widths ranging from 1’-0” to 9’-0”. Screen openings range from 0.125 inches to 0.5 inches in diameter and the angle of inclination is 60 to 75 degrees, or more.
The Andritz Aqua Screen consists of two parallel double link stainless steel chains, on stainless steel rollers and pins, attached on each side of a step-type perforated screen element. A guide is located at the channel bottom, but there is no submerged bearing. The unit is constructed of 304 or 316 stainless steel, and screen openings range from 0.2 inches to 0.5 inches. The angle of inclination ranges from 60 to 75 degrees.
Maintenance problems with these types of screens include plugging of holes with hair or other stringy material, as can be seen in the pictures in Figure 4. Additionally, the FSM Finescreens have a submerged bearing that could result in increased maintenance requirements not unlike the existing screens at PS 200. In addition, the maximum angle of inclination recommended for perforated plate finescreens is 75 to 85 degrees. Without structural modifications to PS 200, perforated plate finescreens will not be an effective alternative. At higher inclination angles, the perforated plate finescreens have difficulty conveying up large material because the steps are too steep. The large material will fall back to the bottom and create a rolling effect that will trap even more screenings causing an undesirable maintenance issue. Advantages and disadvantages of perforated plate finescreens are listed in Table 2.
Table 2 – Advantages and Disadvantages of Perforated Plate Finescreens:
Advantages Disadvantages
Greater capture of solids from the waste stream. Possible solids carry-over resulting from the front clean/back return design.
Efficient removal of large quantities of solids. Submerged moving parts (FSM only).
Low maintenance. Long screens result in several heavy plates that cause more wear on the chain.
Low overhead clearance. Plugging that could lead to screen failure.
Perforated plates not as resilient as bars and are more susceptible to damage from large objects in wastewater flow.
Maximum recommended inclination angle is 75 to 85 degrees.
Screen’s blinding factor is higher than the reciprocating rake and chain-driven screens.

TM No. 1 – PS 200 Evaluation
South Regional WWTP Improvements Project #66962 Page 6 of 12
Reciprocating Rake Screens Reciprocating rake screens have a rake mechanism that moves in an up-and-down reciprocating motion, minimizing the possibility of jamming. When the drive assembly is activated, it descends with the rake arm in the extended position. The rake arm tines are then engaged to convey the screenings upward. At the discharge position, a hinged wiper assembly helps to sweep the screenings from the rake shelf into the discharge chute. The drive assembly rests at the top of the unit when it is not in operation. Timers or differential level controls regulate the time of operation. Two of the leading manufacturers of this type of screen are Infilco Degremont, Inc. (Climber Screen) and Vulcan Industries, Inc. (Mensch Crawler Screen).
The Mensch Crawler Screens utilize a pin rack/cogwheel drive system, which requires minimal maintenance, and can be seen in Figure 5 (Note that the screenings in the figure are dumped directly into a washer compactor). Permanently submerged moving parts have been eliminated. The raking assembly is essentially jam proof and is protected by a sensing device. Mensch screens are constructed of stainless steel components and available in widths ranging from 1.5 feet to 20 feet. The need for modifications or recesses in the channel bottom is eliminated due to the arced gusset or “toe bar” attached to the bottom of each individual bar. The toe bar causes the debris in the wastewater to be swept up onto the vertical portion of the bar rack with little or no debris left behind at the channel invert. Engagement of the rake head into the bar rack assures complete cleaning on each cycle. The Mensch Crawler Screens can be designed with installation angles up to 90 degrees.
Figure 5 – Reciprocating Rake Screens (Mensch Crawler)
The Climber Screen device features cogwheels running on a pin rack. An advanced pin rack design, virtually eliminating lubrication, is available for selected screens. The Climber Rack system incorporates corrosion-resistant self-lubricating materials to provide smooth and quiet operation without weekly applications of grease. When the rake encounters an obstruction in the bar rack, the arm moves away from the bar rack to avoid the obstruction, then re-engages and continues traveling upward. Only in cases where the obstructing object is too large to go around is an overload switch activated. Once the switch is activated, the motor stops, and an alarm is sounded. Debris removed by the Climber Screen unit is positively discharged. The rake arm engages the bar screen from the front (upstream) side, eliminating possible loss of screenings back to the channel. The Climber Screen can be designed to fit a range of channel widths and depths, with installation at angles ranging from 53 degrees to 90 degrees.
Advantages and disadvantages of reciprocating rake screens are listed in Table 3.

TM No. 1 – PS 200 Evaluation
South Regional WWTP Improvements Project #66962 Page 7 of 12
Table 3 – Advantages and Disadvantages of Reciprocating Rake Screens:
Advantages Disadvantages
Solids carry-over is minimized. The single rake limits the capacity to handle extreme loads.
Low maintenance due to elimination of permanently submerged moving parts. The system requires high overhead clearance.
Inclination angles up to 90 degrees. Long travel time for deep channels, which can result in heavy screen loads.
Easy inspection because channel does not have to be dewatered.
Bar spacing limited to 3/8-inch, which results in more inorganics being transferred to the WWTP.
Chain-Driven Front Cleaned Front-cleaned screens consist of metal bar screens with a motor driven chain mechanism to move rake teeth through vertical screen openings. Two of the leading manufacturers of this type of screen are Headworks, Inc. (Mahr) and Huber (Rake Max). Figure 6 shows the Mahr screen (Note submerged sprockets and chain).
Figure 6 – Chain-Driven Front-Cleaned Screens (Mahr)
These chain-driven screens have achieved a standard bar spacing of 0.25 inches (6 mm) with a low headloss for a front clean/front return bar screen. The screen’s above ground height is determined only by the discharge level of the screen, regardless of the depth of the channel. Successful installations of the screen range from a channel 54 feet deep by 48 feet wide down to a channel 3’-4” deep by 2 feet wide. The standard angle of inclination is 75 degrees, but there are installations with 90 degree inclination angles.
The overload device can be programmed to jump the drive into a faster cleaning interval when the water differential gets too high. When the drive stops due to a stuck object in the screen field, the overload device quickly puts the screen into reverse. When the rake bar above the stuck object reaches it, the object is often dislodged. This is repeated four times before an alarm is triggered, and in most cases the object is removed before the alarm is triggered. Advantages and disadvantages of this type of screen are listed in Table 4.

TM No. 1 – PS 200 Evaluation
South Regional WWTP Improvements Project #66962 Page 8 of 12
Table 4 – Advantages and Disadvantages of Chain-Driven Front-Cleaned Screens
Advantages Disadvantages Front-Cleaned / Front Return Chain-Driven Screens
Efficiently retains captured screenings by minimizing carryover.
Possibility of bottom jamming by unusual deposits of trash.
Low headloss across the screen. Chain-driven raking mechanism consisting of submerged sprockets or other mechanical devices is subject to fouling by grit and rags.
Cleaning cycle can be automatically adjusted based on water differential in the channel.
Frequent inspection and maintenance of the drive mechanisms are required.
Low head room. Channel dewatering may be required for maintenance.
Both the Mahr and the Rake Max screens are the front clean/front return type. Both have many successful installations in the United States. These are similar technology to the type of screens at PS 200, which would make for an easy retrofit.
Screenings Conveyance & Washer / Compactors To automate the operation of transferring the screenings from the screens inside the building to the dumpsters outside the building, three relevant technologies were evaluated. The most applicable technologies available to TWU to automatically transfer the screenings outside of the building to the dumpsters, are:
Belt Conveyors
Shaftless Screw Conveyors
Washer Compactors
Belt Conveyors Screening conveyance belts are normally made of neoprene or PVC, depending on the application. To minimize belt failures, an “endless” belt is preferred. If this type of belt is impractical, stainless steel fasteners should be used. Idlers are generally constructed of carbon steel, stainless, or lubricated thermoplastic material. The supporting framework and drainage system is normally fabricated of carbon steel or hot dipped galvanized steel. A belt conveyor has several advantages and disadvantages when being considered as a mechanical means of bulk materials conveying. Table 5 lists the advantages and disadvantages of moving screenings with belt conveyors.
Table 5 – Advantages and Disadvantages of Belt Conveyors
Advantage Disadvantage
The conveyer can have changes in elevation. The normal design of a belt conveyer is open. If the product needs to be contained, covers and or drip pans can become expensive and cumbersome.
The material can be visible on the belt while being conveyed.
If the material is sticky, belt cleaning can be difficult.
Belts can be loaded virtually any place along the belt.
There is almost always material carryover from the belt discharge and this becomes a house keeping problem.
The belt can have “trippers” to unload the belt almost any place.
If the material being conveyed is sticky it will ultimately get transferred to the return side of the belt and then to the rolls, idlers, and pulleys, then belt tracking can be an ongoing issue.
Belt conveyers can pivot at one end allowing the discharge to be moved over an arc.
Odor control is difficult and expensive.
Incline belts can have cleats added to the belt to stop product roll back.
Plow system increases belt wear.
Belts can have sidewalls added to minimize product spillage.
Large number of rollers and idlers require frequent maintenance.

TM No. 1 – PS 200 Evaluation
South Regional WWTP Improvements Project #66962 Page 9 of 12
Shaftless Screw Conveyors Shaftless screw conveyors eliminate the need for intermediate hanger frames, bearings, coupling shafts, coupling bolts, end bearings, end seals, and the maintenance problems associated with them. Shaftless screw conveyors are ideally suited for the application where wet, sticky, fibrous, products are being conveyed or when full trough loading is desired. Operating at low rpm, shaftless conveyors eliminate product built up on the pipe shaft, which is common with standard screws. These conveyors can operate on an incline as well as horizontally and can use side inlets.
The shaftless screw conveyors can be made in several standard dimensions or to customized applications. The screw conveyors have a U-trough with a shaftless screw spiral inside the trough. Better performance is achieved through zero-clearance between the trough and spiral. This improves conveying efficiency and eliminates many of the flow-impending issues common with shafted screw conveyors and, also, higher trough loading allows for lower operating speeds. Several conveyor sections can be connected in series, up to a total transport length of 250 feet. The conveyors’ U-troughs are fitted with covers that can easily be opened for inspection and cleaning purposes. The U-trough has internal replaceable wear plates.
Shaftless screw conveyors may be constructed of either carbon steel or stainless steel. Depending on material conveyed, shaftless screw conveyors may be designed with either a partial or full cover to minimize odors. As a result, the cover may be enclosing a highly corrosive space. If so, either hard facing the internal parts with tungsten carbon, or fabricating the shaftless screw conveyor completely out of stainless steel will be required. Table 6 lists the advantages and disadvantages of moving screenings with shaftless screw conveyors.
Table 6 – Advantages and Disadvantages of Shaftless Screw Conveyors
Advantage Disadvantage Ability to handle varying flow rates, consistencies dry solids contents, free water, temperatures without problems from a single fixed speed.
More wear and tear on trough.
Totally enclosed – no visual or odor contact from inlet to outlet. High organics volume without washing.
Safe transportation – lids fully bolted along the length. Transition from horizontal to incline requires separate conveyors.
No ragging or blockage possible. Conveying abrasive material reduces liner life.
Low operator intervention. Can convey directly into the side of a secondary or vertical conveyer.
Washer / Compactors Washer/compactors wash, dewater, compress, and transport screenings to a conveyor, container, or other suitable receiving device. If there is a high organic content in the screenings, washing is an effective way of breaking up and reducing the amount of fecal and organic content. This will help to reduce odors within the screenings area and reduce the solid content for disposal. Washers are most efficient when used in combination with compactors, since water is added to break up organics, and the water must be removed. Screening compaction is a means to minimize the cost of disposal. Depending on the characteristics of the screenings, they can be effectively dried to 50 percent moisture content and reduced up to 75 percent of their original volume.
Washer/compactors consist of a press body with separate washing and dewatering section, hollow shaft spiral, axial thrust bearing, gear reducer and motor, drain pan, washwater headers and sequencing valves. The press body is constructed of stainless steel. A wedge wire drain constructed of individual profile bars is mounted on the bottom of the press and extends from the inlet hopper to the washing section. The wedge wire spacing assists in clog-free drainage of the washwater. The spiral, of alloy steel construction, is welded to the hollow shaft. The hollow shaft contains perforations located in the washing zone to introduce washwater to the screenings from the inside out. A nylon brush is attached to the trailing edge of the spiral to ensure debris is thoroughly removed from the drainage area. The drain pan is constructed of stainless steel, and is located directly under the press body. A flushing nozzle

TM No. 1 – PS 200 Evaluation
South Regional WWTP Improvements Project #66962 Page 10 of 12
periodically rinses the drain pan. Sealed with a gasket, and secured with a latching system, the drain pan can be easily removed for service.
The washer/compactor receives the screenings from a primary screening device (as can be seen in Figure 5) or conveyor through the inlet hopper. The spiral transports the screenings form the inlet to the washing zone where they are compacted and washed. In the washing zone, washwater is injected into the screenings from the openings in the hollow shaft of the spiral, and from a nozzle at the top of the unit.
To maximize washing after the press compacts the screenings, the spiral reverses, pulling apart the compacted screenings. The cycle is repeated a minimum of four times, re-compacting the screenings and squeezing out excess washwater. The repetition helps the press achieve up to 90 percent organics removal from the screenings. As the screenings move into the dewatering zone, the pitch of the spiral continues to decrease, which further compacts the screenings, for maximum water extraction prior to entering the discharge pipe. From inlet hopper to discharge, the screenings volume is reduced by approximately 75 percent. Table 7 lists the advantages and disadvantages of washing, compacting, and moving the screenings with washer compactors. Figure 7 shows the Vulcan Industries, Inc. washer/compactor. Figure 8 shows the Dewatered Screenings Baggy.
Table 7 – Advantages and Disadvantages of Washer/Compactors
Advantage Disadvantage Screens can be dumped directly from the screens to a hopper over the washer compactor.
More capital expense compared to simply conveying the screenings.
Low screening volume due to 75 percent compaction.
Can only convey up to 40 feet.
Minimal organics, due to washing. Totally enclosed – no visual or odor contact from inlet to outlet.
Safe transportation. No spillage of materials during transport – no carry over.
Minimized ragging and blockage. Low operator intervention. Screenings can be conveyed in any direction desired (for example up and out of the way of the operators).
Can convey directly to dumpster and be discharged into a “baggy” to contain the dewatered screenings.

TM No. 1 – PS 200 Evaluation
South Regional WWTP Improvements Project #66962 Page 11 of 12
Figure 7 – Washer Compactor (Vulcan)
Figure 8 – Dewatered Screenings “Baggy”
Economic Considerations
Equipment costs were requested and received from several of the manufacturers for the different screen alternatives and the different conveyance alternatives. Table 8 presents planning level opinions of probable construction costs (OPCC) for each screen type, which include probable equipment, demolition, electrical, installation, contractor overhead, and contractor profit costs. A 25 percent contingency is also added to the totals in the tables to account for the preliminary nature of the estimate. The costs in Table 8 for each alternative include the costs for two washer/compactors that would be used to wash, compact, and convey the screenings to the dumpsters.

TM No. 1 – PS 200 Evaluation
South Regional WWTP Improvements Project #66962 Page 12 of 12
Table 8 – OPCCs of Screen Alternatives
Screen Alternative Cost (2) Reciprocating Rake Screens $1,500,000 (2) Perforated Plate Finescreens $1,498,000* (2) Chain-Driven Front-Cleaned Screen $1,551,000
*Does not include the structural modifications that would be required to achieve the 75 degree angle of inclination.
As can be seen in Table 8, the costs are all within 4 percent of each other, which shows they are comparatively equal.
Recommendations
Three screening alternatives were evaluated to replace the existing screens at PS 200. HDR recommends that the screen spacing be reduced from the current 1-inch to 3/8-inch. The 3/8-inch screens will be capable of removing much more of the inorganic waste that is causing the problems in the downstream WWTP processes, such as the scum pits, primary clarifiers, and digesters. Since the new screens will be 3/8-inch spaced, screening volume and organic loading will be greatly increased. Table 9 below shows annual estimated screening volumes based on bar spacing.
Table 9 – Estimated Non-Compacted Annual Screenings Volume Based on Bar Spacing at PS 200 at an Average Wastewater Flow of 9 mgd
Bar Spacing (inches) Cubic Yards per Year 1 1,095
1/2 2,920 3/8 3,830
HDR recommends a washer compactors be installed at each of the two screens to reduce volume and odors. Two washer compactors (one for each screen) are required for reliability, especially needed with the increased screening to be collected.
Perforated plate fine screens are not recommended because the existing PS 200 structure would have to be modified so that at least the maximum angle of inclination of 75 degrees could be achieved. Although chain-driven, front-cleaned screens would be the easiest to retrofit, they have submerged moving parts and require channel dewatering for maintenance. Reciprocating rake screens have no submerged moving parts, and the channels will not have to be dewatered for screen inspection.
Reciprocating rake screens with 3/8-inch spacing are HDR’s initial recommendation for screen replacements. During detailed design if constraints exist that make it too difficult, inefficient, or impossible to retrofit reciprocating rake screens, the chain-driven screens may be given further consideration. Equipment procurement issues will be addressed during design, as the number of manufacturers with successful operating experience, is limited.
In summary, HDR recommendations for improvements at PS 200 are as follows:
Replace the two chain-driven screens at PS 200 with two reciprocating rake screens.
Reduce the bar spacing from 1-inch to 3/8-inch.
Because the closer bar spacing leads to more screenings and more organics, install two washer/compactors, one for each screen.
Use the two washer/compactors to convey the compacted screenings to the dumpster for final disposal southeast side of the building).

APPENDIX B
APPENDIX B
APPENDIX B
TECHNICAL MEMORANDUM NO. 2
GRIT REMOVAL EVALUATION

South Regional WWTP Improvements Project #66962 Page 1 of 9
TM No. 2 Grit Facility Evaluation
Introduction
The existing pre-aeration/grit removal facility was constructed in late 1980s and consists of a two aerated basins. The grit removal facility is becoming less efficient as evidenced over time, of grit build up in the downstream processes, such as the equalization basins, activated sludge basins, and digesters. The grit build up in these processes is increasing maintenance at the WWTP. This Technical Memorandum (TM) discusses the existing grit facility at the WWTP, potential improvement alternatives, and recommendations for a more efficient grit removal facility that will improve downstream process performance and decrease required maintenance at the WWTP.
Design Criteria
From 2003 through 2007, influent flows at the WWTP averaged approximately 9.0 mgd. If required, PS 200 can pump up to 54 mgd directly to the pre-aeration/grit facility. Wastewater from PS 200 is pumped directly to the grit facility and then distributed to the primary sedimentation basins, and the remaining processes at the WWTP. The permitted max daily average flow is 18 mgd, and the permitted 2-hour peak flow is 27 mgd at the WWTP. Since the grit facility can receive up to 54 mgd from PS 200, the total grit facility design flow used for this evaluation is 54 MGD. General design criteria used for the evaluation of grit removal improvements for the WWTP include the following:
Grit Removal Efficiencies (Typical):
1) 95% of grit greater than 50 mesh
2) 85% of grit greater than 70 mesh, but less than 50 mesh
3) 65% of grit greater than 100 mesh, but less than 70 mesh
Because the influent to the South Regional WWTP contains a high percentage of fine grit, the removal efficiencies must be greater than typically required.
Maximum headloss through the facility @ 54 MGD: 12 inches
Material of Construction: Stainless Steel and Concrete
Condition Assessment
A site visit was performed to evaluate the condition of the pre-aeration/grit removal facility. The pre-aeration /grit facility (Figure 1) is located within the WWTP boundaries. There are two aerated basins, and each basin is sloped, and the bottom is chain raked down to two grit sump collectors. Dry pit grit pumps then pump the grit slurry up to a grit beach where the grit settles and can be removed with the grit beach collector/scraper (Figure 2 and Figure 3). The grit is then dropped into a hopper (Figure 4) where it is collected/stored and then conveyed through a screw conveyor to the dumpster outside the building (Figure 5).

TM No. 2 – Grit Facility Evaluation
South Regional WWTP Improvements Project #66962 Page 2 of 9
Figure 1 – Pre Aeration Basin/Grit Removal Facility
Figure 2 – Grit Beach Collector
Figure 3

TM No. 2 – Grit Facility Evaluation
South Regional WWTP Improvements Project #66962 Page 3 of 9
Figure 3 – Grit Beach Discharge
Figure 4 – Grit Hopper
Grit Screw Conveyor

TM No. 2 – Grit Facility Evaluation
South Regional WWTP Improvements Project #66962 Page 4 of 9
Figure 5 – Grit Screw Conveyor to Dumpster
The existing grit removal facility is more of a pre-aeration facility that also removes grit. To more effectively remove grit using an aerated process, a rolling pattern must be established inside the basin to encourage the grit to settle. Figure 6 shows a typical aerated grit configuration. The existing basins do not create a rolling pattern as the diffusers are evenly spaced throughout the basin; therefore, the desired grit removal efficiency is not achieved with the current aeration configuration.
Other grit removal facility observations are that the equipment is aging, requires increasing maintenance, is losing efficiency, and is expensive to operate because of the air requirements.
Grit Removal Alternatives
Three improvement alternatives to remove grit at the WWTP were evaluated and are as follows:
Aerated Grit Removal
Forced Vortex Grit Removal
Tray Settling Grit Removal (Eutek Headcell)
Aerated Grit Removal In typical aerated grit facilities, air is introduced along one side of a rectangular tank to create a spiral flow pattern perpendicular to the flow through the tank (Figure 6). The heavier grit particles that have higher settling velocities settle to the bottom of the tank. Lighter, principally organic, particles remain in suspension and pass through the tank. The velocity of the roll or agitation governs the size of particles of a given specific gravity that will be removed. If the velocity is too great, grit will be carried out of the basin. If the velocity is too low, organic material will be removed with the grit. An advantage is that the quantity of air can be easily adjusted. With proper adjustment, high removal efficiencies can be obtained at various incoming flows, and the grit will be well washed.

TM No. 2 – Grit Facility Evaluation
South Regional WWTP Improvements Project #66962 Page 5 of 9
Figure 6 – Typical Aerated Grit Schematic
This alternative would require modifications to the existing pre-aeration/grit facility. The existing basins dimensions and the detention times are within the standards for aerated grit design, so extensive structural modifications would not be required. The most apparent modifications would include relocating the diffusers, sloping the basins to the outside walls, moving the grit collectors to the outside walls, installing new grit pumps or potentially using the existing grit pumps, and installing new grit washing and dewatering equipment.
An advantage of continuing with aerated grit removal at TWU’s WWTP is that the personnel are familiar with the operation. In addition, the existing blowers could be utilized. The disadvantage is that it requires more power then the other alternatives because of the air requirements and it is difficult to remove fine grit. Nominal aerated grit facility removal efficiencies are 95 percent of 65 mesh (208 micron) grit and greater. Table 1 compares the advantages and disadvantages associated with aerated grit removal systems.
Table 1 – Advantages and Disadvantages of Aerated Grit Removal Facilities
Advantage Disadvantage
Head loss through the grit chamber is minimal. Power consumption is higher than other grit removal processes because of the required aeration, therefore operating costs are high.
By controlling the rate of aeration, a grit of relatively low putrescible organic content may be removed.
Additional labor is required for maintenance and control of the aeration system.
Pre-aeration may alleviate septic conditions in the incoming wastewater to improve the performance of downstream treatment units.
Some confusion exists about design criteria necessary to achieve a good spiral roll pattern and proper hopper and grit removal system.
Flexibility to remove grit can adapt to verifying field conditions.
Significant quantities of potentially harmful volatile organics and odors may be released from the wastewater.
Aerated grit chambers can also be used for chemical addition, mixing, preparation, and flocculation ahead of primary treatment.
Difficulty removing fine grit.

TM No. 2 – Grit Facility Evaluation
South Regional WWTP Improvements Project #66962 Page 6 of 9
Forced Vortex Grit Removal Vortex grit removal systems utilize a mechanized vortex flow container to remove grit from the influent sewage. The wastewater flow enters and exits tangentially, while a rotating turbine creates a spiral flow pattern that promotes settling of the grit particles. The grit is transported from the hopper to the grit classifier by grit pumps. The organic material removed from the grit during the washing process is then returned to the treatment process, while the clean grit is sent to the dumpster. One manufacturer has a basin with a flat bottom, while other manufacturers use a sloped, conical bottom. Figure 7 shows a typical vortex grit removal system schematic as provided by Smith and Loveless’ Pista Grit Vortex Removal System with a flat bottom.
Vortex grit removal provides less operator adjustment control of the process than aerated grit removal, but requires less maintenance. The units are normally designed to efficiently operate within the full range expected flows without any adjustments. Table 2 presents advantages and disadvantages associated with vortex grit removal systems.
Figure 7 – Vortex Grit Removal System Schematic (Pista Grit)
Table 2 – Advantages and Disadvantages of Forced Vortex Grit Removal Systems
Advantage Disadvantage
Effective over a wide flow variation. Paddles can collect rags and debris.
No submerged bearings or parts that require maintenance.
Grit sump may become compacted and clog. The removal system requires high pressure agitation water or air. Air lift pumps are often not effective in removing grit from the sump.
Minimal space requirement, thus reducing construction costs.
Flat bottom installations have experienced grit accumulation on the basin’s flat floor during low flows, whereas, sloped floors do not experience this grit accumulation.
Energy efficient (no air requirement).

TM No. 2 – Grit Facility Evaluation
South Regional WWTP Improvements Project #66962 Page 7 of 9
Tray Settling Grit Removal (Eutek Headcell) Tray settling is a proprietary technology for grit removal consisting of a circular basin, similar to a free vortex grit removal basin, inside of which is a bank of settling trays that remove grit as small as 75 microns with minimal headloss per Eutek’s claims. The high efficiency flow distribution header evenly distributes influent onto multiple conical trays. Tangential feed establishes a vortex flow pattern where solids settle into a boundary layer on each tray, and are swept down to the center underflow collection chamber. These settled solids can be continuously pumped to a slurry cup and grit separator and classification and dewatering system. The Eutek Headcell has the capability of capturing fine particles due to large surface area and short settling distances. The Headcell can provide high performance fine grit removal in a small footprint, thus allowing an increase in capacity using existing space in land-locked wastewater treatment plants or potential retrofits. The primary disadvantages include a single proprietor (Eutek Systems Headcell) and minimal installations in the United States to date. See Figure 8. Table 3 presents the advantages and disadvantages associated with the Eutek Headcell.
Figure 8 – Eutek Headcell Schematic
Table 3 – Advantages and Disadvantages of the Eutek Headcell Tray Settling Grit Removal System
Advantage Disadvantage
Large surface area with short settling distances protects equipment and processes from abrasive wear and sedimentation.
Comparably new technology.
No submerged bearings or parts that require maintenance.
Rags and debris could get caught up in the trays, which could be a difficult maintenance issue.
Compact and expandable design. Operational flexibility for adequately handling variable flow rates is minimized.
Structured flow configuration eliminates short circuiting, which enhances grit capture.
Largest headloss of all grit removal systems.
Effective over a wide flow variation especially with multiple units.
Energy efficient (no air requirement). All hydraulic design with no moving parts makes long component life with minimal wear.
TM No. 2 – Grit Facility Evaluation
South Regional WWTP Improvements Project #66962 Page 8 of 9
Economic Considerations
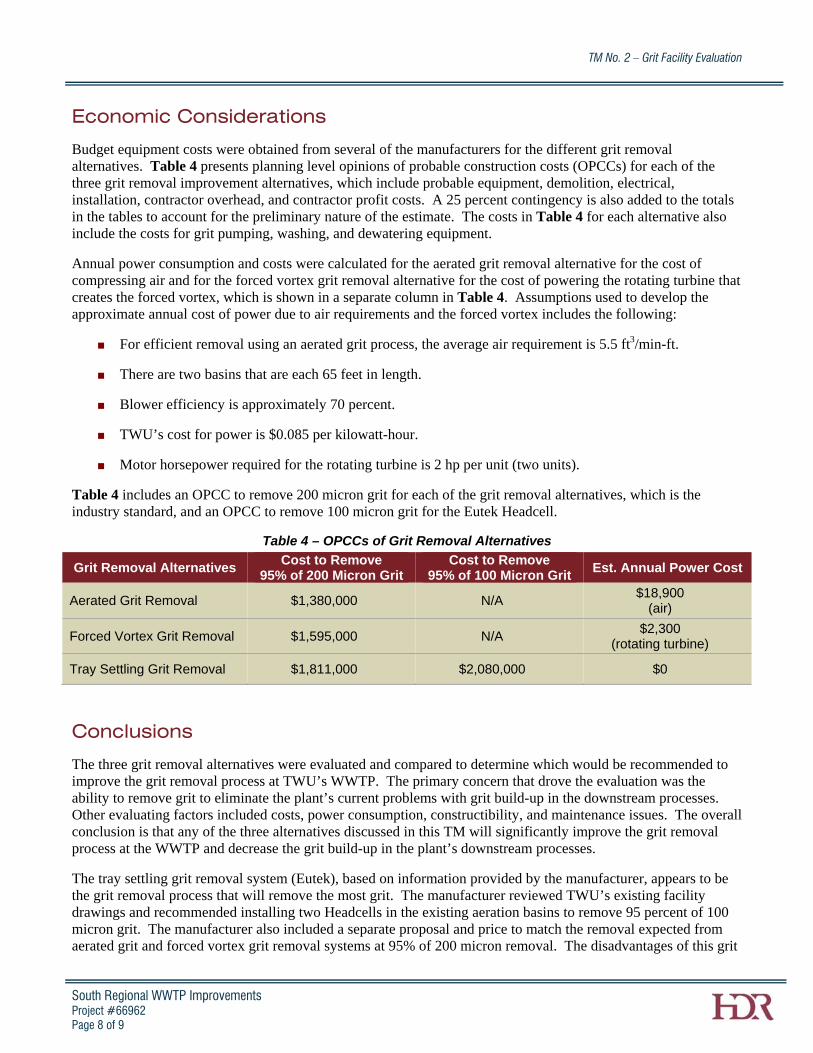
Budget equipment costs were obtained from several of the manufacturers for the different grit removal alternatives. Table 4 presents planning level opinions of probable construction costs (OPCCs) for each of the three grit removal improvement alternatives, which include probable equipment, demolition, electrical, installation, contractor overhead, and contractor profit costs. A 25 percent contingency is also added to the totals in the tables to account for the preliminary nature of the estimate. The costs in Table 4 for each alternative also include the costs for grit pumping, washing, and dewatering equipment.
Annual power consumption and costs were calculated for the aerated grit removal alternative for the cost of compressing air and for the forced vortex grit removal alternative for the cost of powering the rotating turbine that creates the forced vortex, which is shown in a separate column in Table 4. Assumptions used to develop the approximate annual cost of power due to air requirements and the forced vortex includes the following:
For efficient removal using an aerated grit process, the average air requirement is 5.5 ft3/min-ft.
There are two basins that are each 65 feet in length.
Blower efficiency is approximately 70 percent.
TWU’s cost for power is $0.085 per kilowatt-hour.
Motor horsepower required for the rotating turbine is 2 hp per unit (two units).
Table 4 includes an OPCC to remove 200 micron grit for each of the grit removal alternatives, which is the industry standard, and an OPCC to remove 100 micron grit for the Eutek Headcell.
Table 4 – OPCCs of Grit Removal Alternatives
Grit Removal Alternatives Cost to Remove
95% of 200 Micron Grit Cost to Remove
95% of 100 Micron Grit Est. Annual Power Cost
Aerated Grit Removal $1,380,000 N/A $18,900
(air)
Forced Vortex Grit Removal $1,595,000 N/A $2,300
(rotating turbine)
Tray Settling Grit Removal $1,811,000 $2,080,000 $0
Conclusions
The three grit removal alternatives were evaluated and compared to determine which would be recommended to improve the grit removal process at TWU’s WWTP. The primary concern that drove the evaluation was the ability to remove grit to eliminate the plant’s current problems with grit build-up in the downstream processes. Other evaluating factors included costs, power consumption, constructibility, and maintenance issues. The overall conclusion is that any of the three alternatives discussed in this TM will significantly improve the grit removal process at the WWTP and decrease the grit build-up in the plant’s downstream processes.
The tray settling grit removal system (Eutek), based on information provided by the manufacturer, appears to be the grit removal process that will remove the most grit. The manufacturer reviewed TWU’s existing facility drawings and recommended installing two Headcells in the existing aeration basins to remove 95 percent of 100 micron grit. The manufacturer also included a separate proposal and price to match the removal expected from aerated grit and forced vortex grit removal systems at 95% of 200 micron removal. The disadvantages of this grit

TM No. 2 – Grit Facility Evaluation
South Regional WWTP Improvements Project #66962 Page 9 of 9
removal improvement alternative are that it is proprietary, is the most expensive, and is relatively new to the United States (24 referenced installations). The advantages include manufacturer’s claimed removal efficiency, zero air requirements, and low maintenance issues. HDR recommends the Eutek Headcell be sized to remove 95% of the 100 micron grit. HDR further recommends the specification be written to require the manufacturer Eutek, be required to hire a third party to perform a comprehensive grit removal test after installation to demonstrate that the system removes 95% of 100 micron grit. The additional cost to perform the grit testing would be in the $10,500 range based on a quote from a third party grit testing company.

APPENDIX C
APPENDIX C
APPENDIX C
TECHNICAL MEMORANDUM NO. 3
DISINFECTION EVALUATION

South Regional WWTP Improvements Project #66962 Page 1 of 8
TM No. 3 Disinfection Evaluation
Introduction
New regulations affecting the management of chlorine and water quality have led to an increasing use of ultraviolet light (UV) disinfection in wastewater treatment facilities.
TWU currently disinfects with gaseous chlorine and dechlorinates with gaseous sulfur dioxide. Storage of these gaseous chemicals at the WWTP requires Risk Management Plans for both gases. If the conversion to UV disinfection is implemented, TWU desires the backup ability to use chlorine for emergency situations or intermittent problems. This TM evaluates the continued use of gaseous chlorination and dechlorination disinfection facilities and evaluates the alternative of ultraviolet disinfection.
Background
The Clean Air Act (CAA) Amendments of 1990 added Section 112(r), which required the U.S. Environmental Protection Agency (USEPA) establish a regulatory program to prevent serious chemical accidents that affect public health and the environment. In response, the USEPA prepared risk management program (RMP) regulations published on June 20, 1996. Under the RMP rule, wastewater facilities that store more than 2,500 pounds of chlorine and/or 5,000 pounds of sulfur dioxide must develop a RMP including a hazard assessment, prevention program, and emergency response plan. These requirements increase the cost of managing chlorine disinfection and sulfur dioxide dechlorination. In addition to the CAA, changes to water quality regulations are impacting wastewater treatment plants that use chlorine as a disinfectant.
To meet water quality criteria that limit effluent chlorine concentrations, most wastewater treatment plants dechlorinates. Chlorine may limit the amount of reuse wastewater that can be applied for turf irrigation. The USEPA considers UV disinfection an effective method of disinfection for secondary treated or higher quality wastewater effluent. The application of UV disinfection eliminates both air and water quality concerns and therefore is advantageous solution for many plants.
Condition Assessment
The existing gaseous chlorination and gaseous sulfur dioxide dechlorination facilities at the WWTP were originally constructed in the 1980s. Since that time, numerous repairs have been necessary. A site visit was performed to evaluate the condition of the existing disinfection system. The chlorination and dechlorination facilities are housed in two separate buildings within the WWTP boundaries (Figure 1). The chlorine contact basins consist of two serpentine three-pass aerated channels (Figure 2). All of the chlorine and SO2 evaporators and feeders are in poor conditions. The chlorine and SO2 analyzers are not operable, so the systems are controlled manually, so replacements are required for the feeders, analyzers and control systems , if gaseous chlorination is to be utilized for disinfection at the WWTP.
The chlorine gas cylinders are stored in the Solids Processing Building several hundred feet away from the chorine contact facility. This distance between the bulk storage and the feed equipment causes a delay in the feedback signal due to the time it takes for the sample to reach the analyzer and for the changed solution strength to reach the feed point, which poses somewhat of a challenge to the WWTP operating staff. Because of the chlorine storage (over 2,500 pounds), TWU is required by USEPA regulations to have and keep updated a risk management program.

TM No. 3 – Disinfection Evaluation
South Regional WWTP Improvements Project #66962 Page 2 of 8
Figure 1 – Disinfection Facilities (Sulfur Dioxide and Chlorine Contact Buildings)
Figure 2 – Chorine Building Interior & Chlorine Contact Basins
Sulfur Dioxide Chemical Building Chlorine Feed & Contact Basin Building

TM No. 3 – Disinfection Evaluation
South Regional WWTP Improvements Project #66962 Page 3 of 8
Disinfection Alternatives
Two alternatives were evaluated for disinfection at TWU’s WWTP and are as follows:
Continued Use of Gaseous Chlorination and Dechlorination
Conversion to UV Disinfection
Two additional alternatives will be evaluated during design:
Continued Use of Gaseous Chlorination and Dechlorination using in-situ chlorine gas generation, and producing NaOH as a by-product
Use of in-situ chlorine generator to produce liquid chlorine, (sodium hypochlorite).
Gaseous Chlorination and Dechlorination Both gases are stored on-site in ton cylinders that are sufficient in volume to serve the plant. Table 1 displays the advantages and disadvantages of gas chlorination and dechlorination. A major advantage of continuing the use of gaseous chlorination and dechlorination at the WWTP is that the equipment for dosing and controlling the process is readily available. The process is in use at Texarkana’s WWTP, and the operations staff is familiar with it. The primary disadvantage of the process is a safety concern regarding the storage and handling of the chlorine and sulfur dioxide gases. Another major disadvantage becoming more scrutinized by evolving government regulations is the generation of potentially carcinogenic disinfection by-products (DBPs) because of the use of chlorine for disinfection.
Table 1 – Advantages and Disadvantages of Gaseous Chlorination and Dechlorination
Advantages Disadvantages
Relatively low chemical costs. Risk of accidental chemical release (even with scrubber).
Long history of successful application in waste water treatment.
Requires risk management program that includes hazard assessments, prevention programs, and emergency response plans.
Process already in use at the WWTP. Generates DBPs.
Proven effectiveness against most pathogens. Adversely impacts environment if the dechlorination is incomplete.
Provides measurable residual disinfectant. Chlorine and sodium dioxide are readily available chemicals.
UV Disinfection UV is a physical disinfectant ion process that disrupts cellular DNA, which prevents pathogens from replicating. Ultraviolet is an effective method of disinfection as long as enough UV energy is absorbed by the target organisms. UV light is generated from electrical excitation of pressurized mercury vapor within lamp tubes. There are two types of UV lamps: medium pressure (MP) and low pressure (LP). MP lamps are more powerful than LP lamps, but MP lamps are less efficient for production of UV light in the germicidal range, have a lower operating life, and foul more readily due to high operating temperatures.
LP lamps are either low-pressure, low-output (LPLO) or low-pressure, high-output (LPHO). LPLO systems are generally more effective for small installations since more lamps are required for disinfection. Most UV systems today utilize LPHO lamps.
There are two configurations used for UV disinfection: open channel or closed vessel. In both cases, the UV lamps are submerged within the process flow. Effluent is disinfected as it flows by the energized UV lamps. Most wastewater systems are open channel designs due to easier maintenance and better hydraulics. Flow velocity in the channel is 1 to

TM No. 3 – Disinfection Evaluation
South Regional WWTP Improvements Project #66962 Page 4 of 8
2 feet per second. Open channel systems are available with horizontal or vertical lamp configurations. Either configuration is effective. The decision of which to install depends on project specific design factors and preferences.
The major UV equipment suppliers are Infilco Degremont (IDI), Trojan, UltraTech, and Calgon, and each have several installations in the United States. Each supplier also has at least one operating system in Texas.
Table 2 presents advantages and disadvantages of UV disinfection.
Table 2 – Advantages and Disadvantages of Ultraviolet Disinfection
Advantages Disadvantages No in-stream Chemical required for disinfection or dechlorination.
Higher power consumption compared to chlorination.
No Toxic DBPs from disinfection. Sensitive to transmittance of effluent. Proven effectiveness against most pathogens. Potential lamp sleeve fouling.
Short contact time (seconds). Chlorine system may still be required for other plant uses.
Simple operation and maintenance. No measurable residual. Smaller footprint than chlorination. Require measurement of fecal coliforms.
Since UV light must be absorbed by target pathogens, effective UV disinfection requires relatively good effluent quality. Most UV systems are designed to treat effluent with a transmittance of 65 percent or greater. High concentrations of total suspended solids, turbidity, dissolved iron and certain industrial organics can “blind” a UV system by directly attenuating UV light.
Dissolved inorganics like hardness and iron can indirectly affect UV disinfection by fouling quartz lamp sleeves over time. Fouling refers to deposits of minerals that can accumulate on the surfaces of quartz sleeves, blocking UV light from entering the water column. Most systems sold today include automatic wiping mechanisms that clean the quartz sleeves while the UV system is in use. Mechanical wiping systems may require periodic manual sleeve cleaning with citric acid. The Trojan LPHO UV system employs a patented mechanical/chemical cleaning system that both physically and chemically removes deposits as the wipers pass over the quartz sleeves. The Trojan automatic wiping system eliminates the need for manual sleeve cleaning and reduces the number of automatic cleaning cycles required.
Since UV leaves no measurable residual, system monitoring is done by quantifying the concentration of fecal coliforms in the treated effluent.
Technical Feasibility Determining the technical feasibility of retrofitting the existing plant with a UV disinfection system is the first step in the evaluation. Technical feasibility typically focuses on four areas:
Disinfection Performance;
Plant Hydraulics;
Structural Modifications; and
Electrical Requirements
Disinfection Performance Factors that can affect performance of a UV disinfection system include UV transmittance, flow rate, and the water quality parameters of suspended solids, turbidity, iron, and hardness. A decrease in transmittance, an increase in flow, or an increase in concentration of the water quality parameters of concern will result in a lower applied UV dose and lower performance. The desired water quality for a typical UV disinfection system is a transmittance of greater than

TM No. 3 – Disinfection Evaluation
South Regional WWTP Improvements Project #66962 Page 5 of 8
65 percent, suspended solids less than 20 mg/L, and relatively low turbidity. Iron and hardness must also be evaluated to determine if UV blocking deposits will form.
A typical month of water quality data for the effluent from the secondary clarifiers at the WWTP for total suspended solids (TSS), and UV transmittance at 254 nanometers (nm) (UVT) is presented in Table 3. A review of this data shows that TSS is well within the limits for UV disinfection, but UVT is frequently below 65 percent. Because of the lower than desired UVT, UV disinfection at TWU’s WWTP will most likely need to be designed for a 60 percent UVT. Designing for this lower UVT will increase the cost of the UV disinfection system by approximately 10 percent.
Table 3 – Secondary Clarifier Effluent Water Quality Data
Date Average %T Effluent TSS 11/19/2007 66.3 2.3 11/20/2007 64.6 1.7 11/21/2007 61.5 5.0 11/22/2007 63.4 3.9 11/23/2007 64.5 2.9 11/24/2007 65.2 2.8 11/25/2007 67.7 2.9 11/26/2007 70.4 2.7 11/27/2007 63.6 3.5 11/28/2007 66.2 2.0 11/29/2007 63.5 4.8 11/30/2007 64.7 2.7 12/01/2007 64.2 4.7 12/02/2007 64.9 3.1 12/03/2007 65.4 2.6 12/04/2007 59.5 4.1 12/05/2007 61.0 5.7 12/06/2007 63.3 4.1 12/07/2007 62.7 7.6 12/08/2007 59.0 6.8 12/09/2007 64.2 4.0 12/10/2007 64.7 3.3 12/11/2007 63.9 3.5 12/12/2007 63.9 4.0 12/13/2007 69.0 2.9 12/14/2007 63.5 4.7 12/15/2007 65.3 3.3 12/16/2007 67.2 5.2 12/17/2007 66.9 3.1 12/18/2007 67.8 2.7 12/19/2007 66.5 2.5
Plant Hydraulics Plant hydraulics must be reviewed to determine if adequate head is available for the headloss imposed by the UV equipment and if there are limitations on the type of equipment. Because of flow restrictions through the UV equipment and the need for water level control to ensure proper submergence of the UV lamps during all flow conditions, there is a greater headloss across UV disinfection systems than through chlorine contact basins. Therefore, it is important to check the hydraulics from the process upstream of the disinfection process through the effluent discharge point. It was determined that a UV disinfection system will create approximately 18 inches of headloss.

TM No. 3 – Disinfection Evaluation
South Regional WWTP Improvements Project #66962 Page 6 of 8
Structural Modifications It is critical to evaluate the structural requirements that are needed at three different stages during the installation of UV disinfection systems: 1) during demolition of elements of the existing structure to allow for installation; 2) during installation of the equipment; and 3) during operation of the facility. The best source of information on the current structure is the record drawings, which should be verified by a field investigation. It is necessary to determine what portions of the existing structure need to be removed, and to evaluate the impact of removal on the structure. The second important part of the structural evaluation is to determine if there are any interferences that limit the ability of the contractor to install the equipment. The final part of the evaluation is to ensure that operating loads, including both equipment and water, are not significantly different from the current loads on the structure or structural modifications may need to be designed. Many systems require some sort of hoist or monorail to lift the banks of lamps for maintenance, cleaning, and lamp replacement. This must be considered in the structural evaluation and design.
Electrical Requirements Chlorine disinfection has relatively low power consumption. By comparison, UV disinfection equipment requires a significant amount of power to illuminate the UV lamps. When retrofitting an existing plant, it is necessary to determine the available capacity of the electrical power distribution system. Anticipated future loads also need to be considered when evaluating the electrical requirements. Since most plants are operated continuously, the UV disinfection system needs to be connected to emergency power. Therefore, the generator or uninterruptible power supply (UPS) must be of adequate size. Once the available electrical capacity is determined, it can be compared to the power requirements of the UV equipment during the selection process, and necessary modification can be identified.
Development of Design Criteria The design criteria for South Regional WWTP was developed based on information collected during the technical feasibility portion of this analysis and is presented in Table 4.
Table 4 – South Regional WWTP Design Criteria
Criteria Value Average Design Flow Rate 10 mgd Peak Hour Design Flow Rate 27.0 mgd System Head Loss 18.36 inches TSS, Maximum 15 mg/L UV Transmittance, Minimum 60% Max Average Particle Size 30 microns Disinfection Limit – based on a 30-day Geometric Mean of consecutive daily grab samples
200 fecal coliform/100 ml
EPA Minimum UV Dose 28,000 uWs/cm2
Maximum Power Consumption 64 kW
UV lamps would be installed in the two existing concrete open channels (two lamp banks per channel). The number of UV lamps required and channel dimension will vary to some extent according to the system supplier.
Economic Considerations
Budget equipment and operation and maintenance costs were obtained from the UV manufacturers. Table 5 presents the planning level opinion of probable construction cost (OPCC) and 20-year life cycle cost for the conversion to a UV disinfection system and compares those costs to the equipment replacement cost and 20-year life cycle cost associated with the continued use of gaseous chlorination and dechlorination. UV disinfection construction costs include probable equipment, demolition, structural modifications, electrical, installation, contractor overhead, and contractor

TM No. 3 – Disinfection Evaluation
South Regional WWTP Improvements Project #66962 Page 7 of 8
profit. A 25 percent contingency is also added to the totals in the tables to account for the preliminary nature of the estimate.
To calculate 20-year present worth of each alternative, annual operation and maintenance costs were calculated for both the conversion to UV disinfection and for the continued use of the chlorination and dechlorination facilities. Annual operation and maintenance costs for each alternative were calculated using the following values:
Annual chlorine usage = 230,000 pounds @ $0.2595 per pound.
Annual sulfur dioxide usage = 106,000 pounds @ $0.2645 per pound.
Chlorination and dechlorination material maintenance cost = $18,585 per year.
Chlorination and dechlorination annual man hours = 200 hours @ $50 per hour.
TWU’s power cost = $0.085 per kilowatt-hour.
Average UV power draw @ 10 mgd = 23.9 kW
Annual UV operating hours = 8,760 hours
UV annual man hours = 300 hours @ $50 per hour.
Number of lamps to be replaced per year = 82
Price per lamp = $260
Average Projected Bond Interest Rate = 5.00 percent
Table 5 – OPCCs, Annual O&M, and 20-year Present Worth of Disinfection Alternatives
Continue Gaseous
Chlorination & Dechlorination Convert to UV Disinfection
Initial Capital Investment Cost $770,500
(est. equipment replacement) $1,536,000
Annual O&M Cost $115,400 $56,800
20-Year Present Worth Cost $2,208,600 $2,243,800

TM No. 3 – Disinfection Evaluation
South Regional WWTP Improvements Project #66962 Page 8 of 8
Conclusions
The disinfection evaluation shows that conversion to UV disinfection at Texarkana’s South Regional WWTP is a viable option for TWU consideration. The major disadvantage of converting to UV disinfection is the initial capital expenditure. However, annual operation and maintenance costs are estimated to be approximately 50 percent lower with a UV disinfection system, and the 20-year present worth cost comparison is approximately equal. See Table 5. Other non-economic advantages associated with UV disinfection include:
No in-stream chemicals required for disinfection,
No DBP formation,
Substantially decreases risks of accidental chemical releases at the WWTP,
No risk management program required, and
No labor intensive chemical cylinder change outs.
Based upon the findings of this disinfection evaluation and the conversion to UV disinfection, which includes greatly reduced O&M costs, ever-evolving DBP regulations, and several other non-economic advantages, HDR recommends that TWU convert to UV disinfection.
APPENDIX D
APPENDIX D
APPENDIX D
TECHNICAL MEMORANDUM NO. 4
DIGESTER MIXING EVALUATION
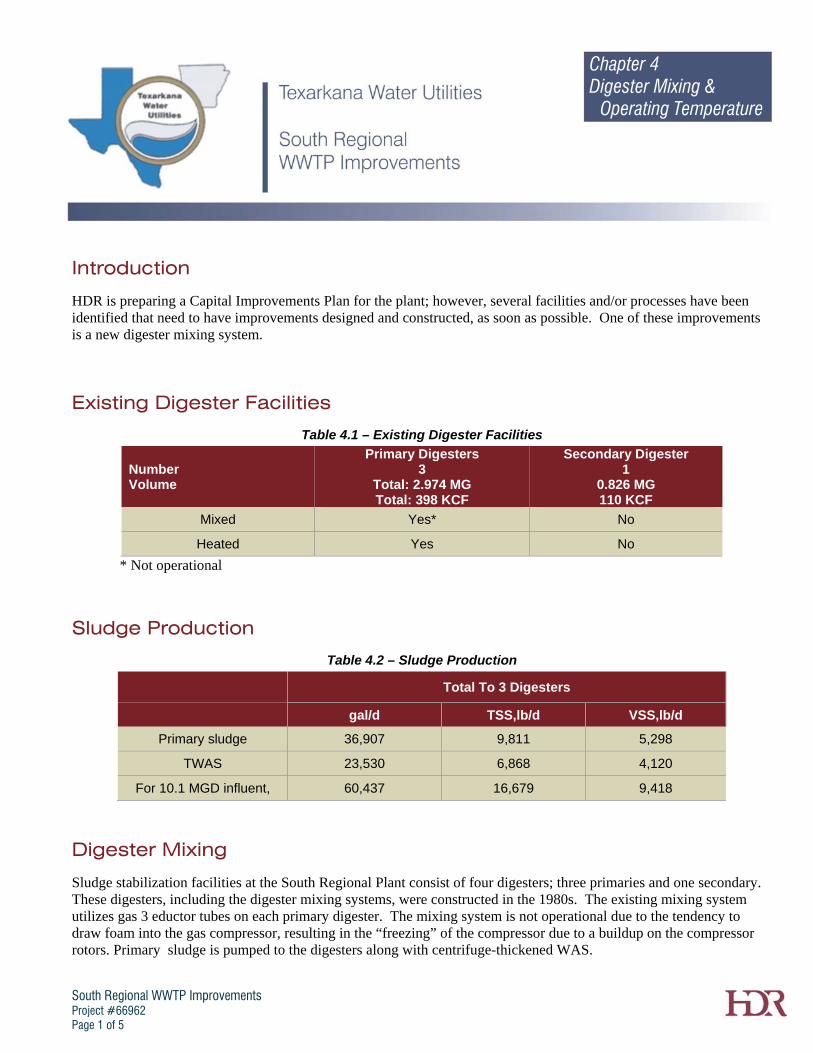
South Regional WWTP Improvements Project #66962 Page 1 of 5
Chapter 4 Digester Mixing &
Operating Temperature
Introduction
HDR is preparing a Capital Improvements Plan for the plant; however, several facilities and/or processes have been identified that need to have improvements designed and constructed, as soon as possible. One of these improvements is a new digester mixing system.
Existing Digester Facilities
Table 4.1 – Existing Digester Facilities
Number Volume
Primary Digesters 3
Total: 2.974 MG Total: 398 KCF
Secondary Digester 1
0.826 MG 110 KCF
Mixed Yes* No
Heated Yes No
* Not operational
Sludge Production
Table 4.2 – Sludge Production
Total To 3 Digesters
gal/d TSS,lb/d VSS,lb/d
Primary sludge 36,907 9,811 5,298
TWAS 23,530 6,868 4,120
For 10.1 MGD influent, 60,437 16,679 9,418
Digester Mixing
Sludge stabilization facilities at the South Regional Plant consist of four digesters; three primaries and one secondary. These digesters, including the digester mixing systems, were constructed in the 1980s. The existing mixing system utilizes gas 3 eductor tubes on each primary digester. The mixing system is not operational due to the tendency to draw foam into the gas compressor, resulting in the “freezing” of the compressor due to a buildup on the compressor rotors. Primary sludge is pumped to the digesters along with centrifuge-thickened WAS.

TM No. 4 – Digester Mixing & Operating Temperature
South Regional WWTP Improvements Project #66962 Page 2 of 5
In 1998 the digesters were cleaned. A layer of scum, grease and hair, 5 to 6 feet thick, was found to be floating on the liquid contents of the digesters. Since the gas mixing system has not been operating, the only mixing is that provided by the digester recirculation pumps, and by the gas bubbles rising through the sludge. Therefore, scum rises to the surface and is not broken up by vigorous mixing.
Adequate mixing is required for all first stage digesters. Mixing may be provided by mechanical equipment, including external pumps, or by gas recirculation.
Design Criteria
Alternative Mixing Systems
Gas Mixing Gas mixing systems have been around for many years and provide mixing through recirculation of digester gas through the digester contents. Gas removed from the head space of a digester is conveyed through a compressor and re-injected into the digester via lances mounted on the digester cover or diffusers located on the floor of the digester. Gas can also be injected for mixing using eductor tubes, which is what is presently installed.
Mechanical Mixing
There are two systems that we normally consider for mixing in anaerobic digesters. One is the slow speed large diameter mechanical type, and the other consists of an external chopper-type pump which takes suction from the tank and discharges back into the tank through nozzles which impart a high velocity and directing the flow in a manner that creates the desired mixing pattern.
Slow-Speed One type of mixer is a slow-speed large diameter mixer with various types of blades. However, since these mixers are more conducive to installation on fixed cover digesters, rather than on floating covers, they will not be considered further.
Pumped Mixing with Jet Nozzles (Liquid Dynamics, Vaughan) Pumped mixing systems, a more recent mixing technology, consist of an external pump and jet mixing nozzles located in the digester tank. For these systems, sludge is withdrawn from the digester tank and re-injected through the nozzles to achieve a bulk flow pattern in the tank, thereby providing effective digester mixing.
This system recirculates digester contents using “chopper pumps” such as those manufactured by Vaughn, Wemco, and Hayward Gordon. The chopper pump is a centrifugal pump with the ability of chopping incoming solids prior to pumping. This protects the pump from clogging and provides benefits to downstream component processes.
Both manufacturers have recommended a 60 horsepower chopper-type pump for each digester.
This equates to 18.3 BHP/MG.
The pump capacity is 3,200 gpm @ 40’ TDH.

TM No. 4 – Digester Mixing & Operating Temperature
South Regional WWTP Improvements Project #66962 Page 3 of 5
Digester Mixing System Costs
Demolition, Primary Digester Mixers, Piping and Installation $979,000
Digester Cleaning of 4 Digesters $1,026,000
Total for Mixing and Digester Cleaning $2,005,000
Digester Operating Temperature
The digesters are now being heated by natural gas, and are being operated at a target temperature of 120 deg F. The intent is to minimize fecal coliform prior to composting, for uncontrolled distribution to the public. Normally, anaerobic digesters are operated between 86 and 100 deg F (mesophillic) or between 122 and 140 deg F (thermophillic). The digesters have a detention time of over 80 days. The amount of energy required to heat the sludge to 120 deg F and to maintain the high temperature for 80 days is significant. The higher operating temperature was adopted to provide assurance that the fecal coliform levels in their composted sludge posed no health hazards to the users of the compost.
Because at the time the higher operating temperatures were adopted, the digesters were not being well mixed, it is possible that short-circuiting occurred allowing some sludge to pass through with higher fecal coliform levels, however, still below the allowable for Class B sludge. The installation of new mixing systems should address any short circuiting issues. Table 4.3 below shows digester heating requirements and associated cost if natural gas is used.
TABLE 4.3 –Digester Heating Energy Demands and Costs for Natural Gas
Digester Operating Temperature
95 Deg F 120 Deg F Winter Summer Avg Winter Summer Avg
Heat required, MMBtu/d 32.44 11.80 22.12 50.23 29.59 39.91
Average Annual Cost for Natural Gas* $90,590 $163,440
* Natural Gas Rate of $11.22/MMBTU
Using a natural gas cost of $11.22/MMBTU, based on the gas bill for the period April 8, 2008 to May 8, 2008, estimated annual cost savings would be $72,900/yr if digesters continue to be heated using natural gas, but are operated at a temperature of 95 deg F, rather than 120 deg F. If digester gas is used in lieu of natural gas, this cost of natural gas will be insignificant.
Digester Gas Production
Specific Gas Production (SGP) for municipal sludges varies between 12-17 cuft/lb VS destroyed.
Figure 4.1, based on a figure from EPA publication EPA 625/1-79-011, Process Design Manual for Sludge Treatment and Disposal, shows that, based on data from nearly 2 dozen studies, the Specific Gas Production (SGP), cubic feet per lb volatile solids destroyed, is 20 cuft/lb VS destroyed at 95 deg F, and approximately 12 cuft/lb VS destroyed at 120 deg F.
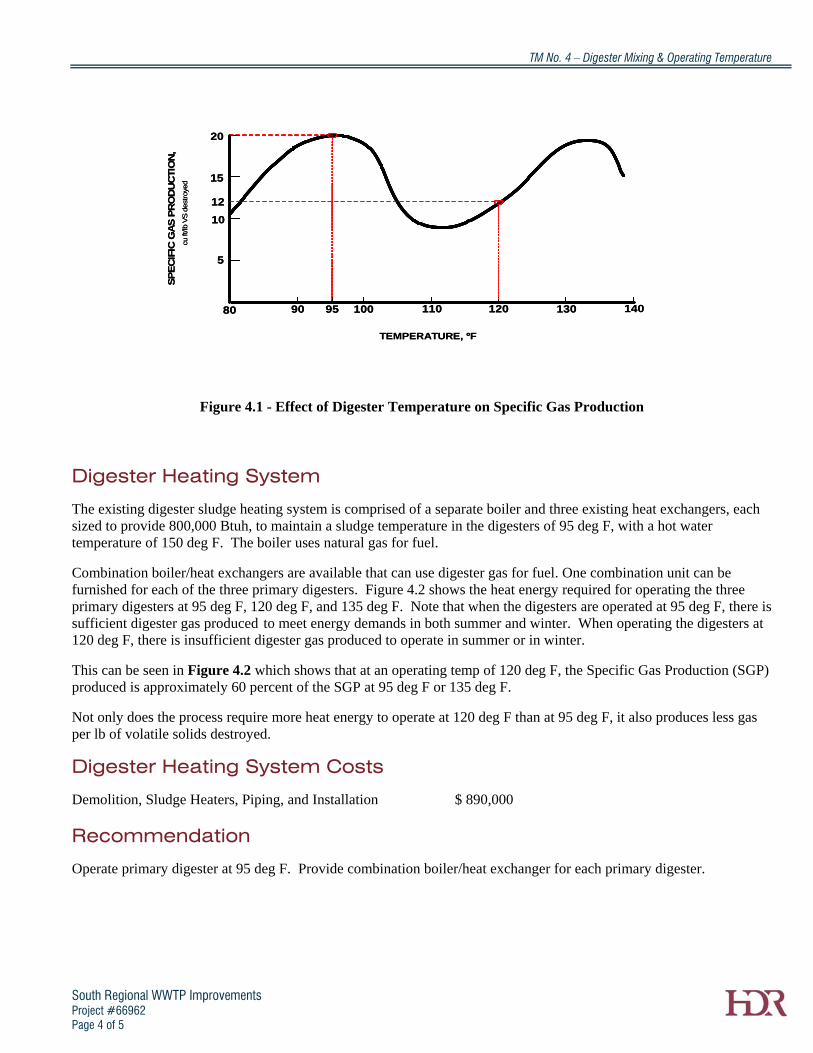
TM No. 4 – Digester Mixing & Operating Temperature
South Regional WWTP Improvements Project #66962 Page 4 of 5
80 90 100 110 120 130 14095
5
10
15
20
12
TEMPERATURE, ºF
SP
EC
IFIC
GA
S P
RO
DU
CTIO
N,
cu ft
/lb V
S d
est
roye
d
80 90 100 110 120 130 14095
5
10
15
20
12
TEMPERATURE, ºF
SP
EC
IFIC
GA
S P
RO
DU
CTIO
N,
cu ft
/lb V
S d
est
roye
d
Figure 4.1 - Effect of Digester Temperature on Specific Gas Production
Digester Heating System
The existing digester sludge heating system is comprised of a separate boiler and three existing heat exchangers, each sized to provide 800,000 Btuh, to maintain a sludge temperature in the digesters of 95 deg F, with a hot water temperature of 150 deg F. The boiler uses natural gas for fuel.
Combination boiler/heat exchangers are available that can use digester gas for fuel. One combination unit can be furnished for each of the three primary digesters. Figure 4.2 shows the heat energy required for operating the three primary digesters at 95 deg F, 120 deg F, and 135 deg F. Note that when the digesters are operated at 95 deg F, there is sufficient digester gas produced to meet energy demands in both summer and winter. When operating the digesters at 120 deg F, there is insufficient digester gas produced to operate in summer or in winter.
This can be seen in Figure 4.2 which shows that at an operating temp of 120 deg F, the Specific Gas Production (SGP) produced is approximately 60 percent of the SGP at 95 deg F or 135 deg F.
Not only does the process require more heat energy to operate at 120 deg F than at 95 deg F, it also produces less gas per lb of volatile solids destroyed.
Digester Heating System Costs
Demolition, Sludge Heaters, Piping, and Installation $ 890,000
Recommendation
Operate primary digester at 95 deg F. Provide combination boiler/heat exchanger for each primary digester.
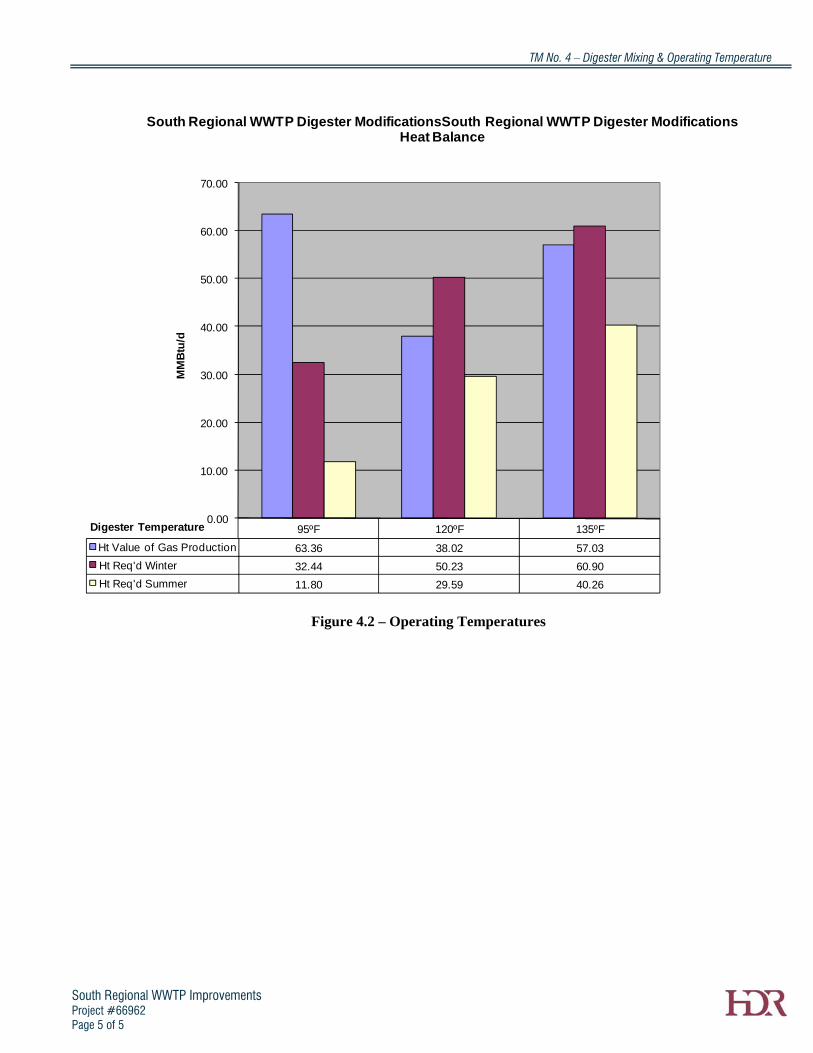
TM No. 4 – Digester Mixing & Operating Temperature
South Regional WWTP Improvements Project #66962 Page 5 of 5
95ºF 120ºF 135ºF
Ht Value of Gas Production 63.36 38.02 57.03
Ht Req'd Winter 32.44 50.23 60.90
Ht Req'd Summer 11.80 29.59 40.26
0.00
10.00
20.00
30.00
40.00
50.00
60.00
70.00M
MB
tu/d
Digester Temperature
South Regional WWTP Digester ModificationsSouth Regional WWTP Digester Modifications Heat Balance
Figure 4.2 – Operating Temperatures

APPENDIX E
APPENDIX E
APPENDIX E
PROCESS MODELING REPORT
Texarkana South Regional Wastewater Treatment Facility Assessment
Project No. 66962
Technical Memorandum
May 19, 2008
Prepared By: Eric Evans
Reviewed By: JB Neethling

Page 2 of 32
Table of Contents
Texarkana South Regional Wastewater Treatment Facility Process Evaluation .................. 3 Historical Operating Data.......................................................................................................................... 3
Current Flow and loading Summary ..................................................................................................... 6 Steady State Mass Balance Modeling ...................................................................................................... 7
Introduction ........................................................................................................................................... 7 Approach .............................................................................................................................................. 7 Process Objectives ............................................................................................................................... 9 Results .................................................................................................................................................. 9 Proposed Process Flow Scheme ....................................................................................................... 12
BioWin Modeling ..................................................................................................................................... 17 Introduction ......................................................................................................................................... 17 Approach ............................................................................................................................................ 18 Results ................................................................................................................................................ 18
Conclusions ............................................................................................................................................ 19 Recommendations .................................................................................................................................. 20
Appendix .................................................................................................................................... 22
Figures Figure 1. Influent Flow and Effluent Peak Flow ........................................................................................... 4 Figure 2. Influent BOD and TSS Loading .................................................................................................... 5 Figure 3. Primary Effluent BOD and TSS concentrations ............................................................................ 6 Figure 4. Current System Process Flow Scheme ...................................................................................... 10 Figure 5. Proposed Process Flow Scheme ................................................................................................ 14 Figure 6. BioWinTM Process Flow Scheme ................................................................................................ 18
Tables Table 1. Current Flows and Loads ............................................................................................................... 7 Table 2. Peaking Factors ............................................................................................................................. 7 Table 3. Influent Contribution from Sanitary Sewer ..................................................................................... 8 Table 4. Influent Contribution from Water Treatment Solids ........................................................................ 8 Table 5. Combined Influent .......................................................................................................................... 8 Table 6. Texarkana Effluent Design Criteria ................................................................................................ 9 Table 7. ENVision Model Calibration ......................................................................................................... 10 Table 8. Capacity of Current Processes in MGD ....................................................................................... 12 Table 9. Mass Balance and Process Analysis for Proposed Process Flow Scheme ................................ 15 Table 10. BioWinTM Output for MM1 .......................................................................................................... 18 Table 11. BioWinTM Output for MM2 .......................................................................................................... 19

Page 3 of 32
Texarkana South Regional Wastewater Treatment Facility Process Evaluation
The purpose of this assessment is to evaluate the operations and performance of the Texarkana South Regional Wastewater Treatment Facility (WWTF), estimate capacity for the higher system loadings, and investigate alternative flow schemes to match or improve facility performance while meeting permitted discharge requirements and reducing operations inefficiencies. In order to reduce caustic addition, minimize oxygen demand and aeration needs, and reduce overall chemical needs for the system, alternative treatment schemes were investigated. Process alternatives investigated are restricted to schemes compatible with phosphorus removal by either chemical or biological means.
Historical Operating Data
HDR reviewed operating data to gain an understanding of the historical influent flows and loads, to determine the effluent quality generated, to find internal process performance and to setup the mass balance for the WWTF. Simple statistical analyses were performed to find overall averages and to estimate maximum month conditions. Maximum monthly data was found by evaluating the probability distribution curves. The maximum monthly data is represented by the range that encompasses data up to 92 percent (11/12) occurrence. Data from January 1, 2005 through December 31, 2007 were used in the analysis.
Figure 1 shows the daily influent flow rate to the facility and the peak day effluent flow rate from the facility. Influent flow rate can be equalized within the facility, which results in the observed dampening between influent and effluent flows. The influent flow rate averaged 8.8 MGD over the three year period with a maximum monthly flow of 11.8 MGD. The influent peak day flow was 37.5 MGD, the influent peak flow was 39.9 MGD (data not shown), and the effluent peak day flow was 26.9 MGD.

Page 4 of 32
0
5
10
15
20
25
30
35
40
Dec-04 Jul-05 Feb-06 Aug-06 Mar-07 Sep-07
Flo
w, m
gd
Inf luent, Flow Ef fluent, Peak Flow
Figure 1. Influent Flow and Effluent Peak Flow
Influent BOD and TSS loading over the data period are shown in Figure . Based on the data, the average influent BOD load measured was 10,467 lb/d and the average influent TSS load was 19,422 lb/d. The data show an average volatile fraction for the TSS between 52 and 54 percent (data not shown), which is significantly less than a typical wastewater. A large fraction of the influent solids are contributed by the Wright Patman Water Treatment Plant, the North Texarkana Wastewater Treatment Plant, and the Waggoner Creek Wastewater Treatment Plant. These facilities discharge waste solids to sewers upstream from the South Regional WWTP. As a result of these solids discharges, the facility encounters an increase in the influent TSS concentration, a decrease in the volatile solids fraction of the influent TSS and dilution of the influent BOD concentration.

Page 5 of 32
MH
702
MH
602
RASRECYCLE
AERATION
BASINS FINAL
CLARIFIERSTRICKLING
FILTERS
PRIMARY
CLARIFIERS
PRE‐AERATION
BASIN
Figure 2. Flow Diagram
0
10,000
20,000
30,000
40,000
50,000
60,000
70,000
80,000
90,000
100,000
0
5,000
10,000
15,000
20,000
25,000
30,000
35,000
Dec-04 Jul-05 Feb-06 Aug-06 Mar-07 Sep-07
TS
S, l
b/d
BO
D, l
b/d
Inf luent, BOD Load Inf luent, TSS Load
Figure 3. Influent BOD and TSS Loading
The primary clarifier performed efficiently (Figure ) producing an average effluent TSS concentration of 81 mg/L The BOD concentration in the effluent from the primary clarifier averaged 56 mg/L. Given this data, primary clarifier performance demonstrated 70 percent TSS removal. TSS removal is slightly higher than the typical primary performance, between 60 and 65 percent removal. The primary clarifier achieved a BOD removal of 62 percent see Figure 4. Therefore, the BOD removal is significantly higher than the typical primary BOD removal efficiency, between 30 and 40 percent removal. The influent soluble component of BOD is apparently low. This explains the primary clarifier high BOD removal efficiency. Upstream solids discharge from contributing facilities may cause the observed variability in TSS settleability. Primary effluent TSS concentrations show high variability while BOD concentrations are more consistent. Primary treatment typically has a dampening effect on influent loads as shown for BOD in this case.

Page 6 of 32
0
50
100
150
200
250
300
350
400
Dec-04 Jul-05 Feb-06 Aug-06 Mar-07 Sep-07
mg
/L
702 Pri Eff, BOD 702 Pri Eff, TSS
Figure 4. Primary Effluent BOD and TSS concentrations
Additional data were collected by the operations staff during Spring 2008. Texarkana personnel measured alkalinity, influent and effluent total phosphorus, and final effluent UV transmittance. The data were averaged yielding an influent alkalinity of 84 mg CaCO3/L, an influent total phosphorus concentration of 5.9 mg P/L, an effluent total phosphorus concentration of 0.56 mg P/L, and an effluent UV transmittance of 70%.
Operations data show alkalinity addition of 57.5 dry tons caustic to the process during the year 2007. Additionally, operators indicate that alkalinity is added primarily during the seasonal swing between hot and cold weather and vice versa. Based on this information, it is estimated that the alkalinity dose was between 30 and 40 mg CaCO3/L.
Current Flow and loading Summary
Current flow rates loading rates, based on the historical operating data, are summarized in Table 1. Parameter concentrations shown are calculated based on the flow rates and loading rates found in the analysis. The TKN and total phosphorus (TP) loads are assumed values. Table 2 shows peaking factors calculated from values listed in Table 1. The data show that the loading rate increase from average to maximum month conditions follows similar proportions to the volumetric flow rate increase.

Page 7 of 32
Table 1. Current Flows and Loads
Units Average Maximum
Month Peak Hour Effluent Peak
Flow Flow Rate, MGD Mgd 8.8 11.8 39.9 26.9 BOD5 lb/d 10,467 14,267 - - TSS lb/d 19,422 27,789 - - TKN lb/d 2,200A 2,952A - - Ammonia lb/d 1,124 1,321 - - TP lb/d 290A 394A - - CONCENTRATIONS BOD5 mg/L 143 145 - - TSS mg/L 265 282 - - TKN mg/L 30 30 - - Ammonia mg/L 15 13 - - TP mg/L 4 4 - -
AEstimated
Table 2. Peaking Factors
Maximum Monthly/ Average
Peak Hour/ Average
Peak Hour/ Maximum Monthly
Effluent Peak/ Maximum Monthly
Flow 1.3 4.5 3.4 2.3 BOD5 1.4 - - - TSS 1.4 - - - TKN 1.3 - - - Ammonia 1.2 - - - TP 1.3 - - -
Steady State Mass Balance Modeling
Introduction
This section describes the mass balance evaluation performed for the South Regional WWTF. HDR’s ENVision mass balance program was used to calculate the solids balance. The program provides a mass balance for TSS and BOD through the treatment plant using simple treatment models. It provides a reasonable first estimate for the process performance, and an accurate measure of the mass balance.
The ENVision model provides an accurate and simple way to evaluate the process loading and process performance. Results from the analysis are used by design engineers to design the specific unit processes. In the design of the unit process, the designer must use judgment in extracting data from the mass balance to determine the maximum loading conditions that should be considered in the unit process detail design.
Approach
The plant model for the existing treatment plant and proposed alternatives was developed. Using the historical operating data, the existing plant model was calibrated to reflect current operation. Table 3 shows the estimated sanitary sewer component of the influent flow, Table 4 shows the estimated upstream water plant waste solids contribution to the sewer, and Table 5 shows the combined influent flow and quality that was observed in the operating data. Using

Page 8 of 32
the data, solids yield and removal efficiencies are calibrated to existing operation. Those performance parameters are then used to project plant capacity and to evaluate alternative treatment processes and mass balances for the future design condition.
Table 3. Influent Contribution from Sanitary Sewer
Units Average
Maximum Month
Peak
Flow Rate mgd 7.7 10.7 38.8 BOD5 lb/d 9,387 13,187 26,920 TSS lb/d 10,522 18,889 72,197 TKN lb/d 2,090 2,842 5,880 Ammonia lb/d 1,124 1,321 2,608 TP lb/d 290 394 799 CONCENTRATIONS BOD5 mg/L 146 148 83 TSS mg/L 164 212 223 TKN mg/L 33 32 18 Ammonia mg/L 18 15 8 TP mg/L 4.5 4.4 2.5
Table 4. Influent Contribution from Water Treatment Solids
Units Average Maximum Month
Peak
Flow Rate mgd 1.1 1.1 1.1 BOD5 lb/d 1,080 1,080 1,080 TSS lb/d 8,900 8,900 8,900 TKN lb/d 110 110 110 Ammonia lb/d 0 0 0 TP lb/d 0 0 0 CONCENTRATIONS BOD5 mg/L 120 120 120 TSS mg/L 970 970 970 TKN mg/L 12 12 12 Ammonia mg/L 0 0 0 TP mg/L 0 0 0
Table 5. Combined Influent
Units Average Maximum Month
Peak
Flow Rate, MGD Mgd 8.8 11.8 39.9 BOD5 lb/d 10,467 14,267 28,000 TSS lb/d 19,422 27,789 81,097 TKN lb/d 2,200 2,952 5,990 Ammonia lb/d 1,124 1,321 2,608 TP lb/d 290 394 799 Temperature ºC 20 20 20 CONCENTRATIONS BOD5 mg/L 143 145 84 TSS mg/L 265 282 243 TKN mg/L 30 30 18 Ammonia mg/L 15 13 7.8 TP mg/L 4 4 2.4

Page 9 of 32
Process Objectives
The objectives for this evaluation include evaluating the current system capacity, reducing caustic consumption and minimizing oxygen demand for the biological treatment system while maintaining an effluent quality that meets permitted discharge requirements and treatment goals (Table 6). One way to do this is through the addition of an anoxic (denitrifying) basin. With denitrification, nitrates replace oxygen for bacterial respiration. In the process, nitrates are converted to harmless nitrogen gas and part of the alkalinity consumed in nitrification is recovered.
Another part of the process that consumes alkalinity is the chlorine disinfection system. Therefore, alternatives to chlorine disinfection that do not consume alkalinity were considered. For this report, UV disinfection is the assumed disinfection alternative.
Phosphorus removal is the final component of the design criteria. Phosphorus removal can be accomplished using biological removal or chemical removal with metal salts; e.g. ferric chloride, alum, etc. Phosphorus removal options are presented for the alternatives.
Table 6. Texarkana Effluent Design Criteria
Parameter Units Concentration Driver Carbonaceous BOD mg/L (max) 7 Permit TSS mg/L (max) 15 Permit NH3-N mg/L (max) 2 Permit NO3-N mg/L (max) 10 Alkalinity Recovery & Aeration Savings Phosphorus-P mg/L (max) 1 Future Permit Cl2 mg/L (max) 0.099 Permit D.O. mg/L (min) 6 Permit pH S.U. (range) 6-9 Permit
Results
Calibration with Historical Operating Data Figure 2 shows the process flow scheme for the model constructed in the program representing the existing facility. The influent operating data summarized in Table 1 supplied input information for the model. Therefore, the inflow for the model matches the inflow from the data. Solids disposed from the Wright Patman Plant, the Waggoner Creek Plant, and the North Texarkana Plant were characterized and separated to allow for flexibility in the evaluation. Therefore, other key parameters that need to be matched include effluent quality, process characterizations and solids production from the facility.
Table 7 shows results for the calibration run. The predicted BOD and solids data match operating data well (Table 7). The SRT shown reflects only the aerobic retention time versus detention time in the aeration basin plus clarifier as normally calculated by Texarkana.

Page 10 of 32
Figure 2. Current System Process Flow Scheme
Table 7. ENVision Model Calibration
Location Parameter Units ENVision Model
Output Operating Data Average Values Comments
Influent
Flow Rate MGD 8.8 8.8 BOD mg/L 146 146 TSS mg/L 265 265 TKN mgN/L 30 30 Ammonia mgN/L 15 15 TP mgP/L 4 4
Effluent BOD mg/L 2.2 2.4 TSS mg/L 3.9 3.9 Ammonia mgN/L 0.1 0.1
Primary Clarifier
Effluent BOD mg/L 63 56 BOD Removal % 56 65 Effluent TSS mg/L 82 81 TSS Removal % 69 71 Sludge Concentration % 3.2 3.3 Sludge VSS/TSS % 53 54
Trickling Filter
Number of Trickling Filters unitless 3 3 Media Depth ft 7 7 Effluent BOD mg/L 37 - No TF Effluent data Effluent Ammonia mg/L N 21 - No TF Effluent data Effluent TSS mg/L 77 - No TF Effluent data
Activated Sludge
SRT days 14.0 16.6
Basins in Service
2.6 2.6
Represents average number aeration basins operating.
MLSS mg/L 3,700 4,260 MLVSS/MLSS % 62 60
Primary Digester
Solids Concentration % 2.5 2.5 VS/TS 41 46.7 VS Destruction % 40
Secondary Digester
Solids Concentration % 2.4 3.1 VS/TS % 40 45.7 VS Destruction % 5
Dewatered Biosolids
Concentration % 18.2 18.2 Total Produced lb/d 12,340 10,360

Page 11 of 32
The average values shown in Table 7 reflect operation with two, three or four aeration basins in service. Consequently, an average number of basins in service was calculated to account for the fact that not all four basins are always used. Influent quality was input based on influent flow rates and loading for the sanitary sewer and the upstream treatment plant solids data. This gives an influent composition that matches the average influent strength shown by the data. Primary clarifier performance was set to match observed primary clarifier performance based on operating data. The influent soluble BOD fraction was lowered based on the observation that the primary clarifier removes between 50 and 70 percent of the BOD on average. This yields a good match between primary clarifier effluent data and the primary clarifier effluent shown in the mass balance. The operation of the digesters for the model was set to balance the match between the solids concentrations given by the data and the total dewatered biosolids produced by the facility.
The primary digester total solids concentration matches well. The volatile solids fraction (VS/TS) predicted by the model is slightly lower. This reflects the abnormally low VS concentration in the feed solids and the VS destruction found necessary to provide satisfactory agreement between the model and the data for total solids produced by the facility. Secondary digester data produced by the mass balance shows the expected average total solids concentration and volatile solids fraction for the digester. The operational data may represent concentrated solids, and this does not match the mass balance. The secondary digester is not currently mixed, which can result in a solids gradient in the digester.
Existing System Capacity The capacity of the existing system was evaluated, and the results are shown in Table 8. For the evaluation, it is assumed that the minimum aerobic SRT needed for nitrification is 12 days. Further, it is assumed that the contribution by upstream solids disposal remains constant and that only the sanitary loading increases. Based on the analysis, the unit process constrictions for maximum month loading are as follows:
Activated Sludge System – Approaches minimum SRT (12 days) with corresponding MLSS less than 4,500 mg/L - the design limit established based on historical MLSS concentrations.
Activated Sludge System – Approximately equal to peak specific oxygen transfer rate (60mg/(L•hr))
Secondary Clarifiers – Solids loading rate approaches maximum recommended for maximum month loading (30 lb/(ft2•d))
RAS Pumping – The capacity of the RAS pumps is estimated between 15 and 17 MGD. This limits the secondary clarifier peak hydraulic capacity.
A summary of process capacities is shown in Table 8 based on typical standard loading parameters. The full ENVision analysis can be found at the end of this TM.

Page 12 of 32
Table 8. Capacity of Current Processes in MGD
Process Maximum Monthly Peak Hour
Peak Hour/ Maximum Monthly
Comment
Headworks
- ??
Primary Clarifier 23 68 3.0
1,000 gpd/sf (max month) 3,000 gpd/sf (peak hour)
Trickling Filter 17 - -
-
Activated Sludge 18 - - SRT = 12 d (max month)
Secondary Clarifier 17 27 1.6
30 lb/(ft2•d)) (max month) Typically - 2 hr detention time (peak hour with RAS); adjusted to match peak effluent flow in plant data
Disinfection - 39 - HRT: 15 min (peak hour)
The capacity evaluation shows a peak hydraulic capacity for the primary clarifiers of 68 MGD with a maximum month capacity of 23 MGD. This gives a peak hydraulic to maximum month flow ratio of 3.0, which is slightly less than the ratio of 3.4 based on the operating data. If the historic ratio holds, then the equivalent maximum month capacity should be rated at 20 MGD.
The secondary clarifier peak hydraulic capacity is estimated as 24 MGD if a minimum 2 hour detention time at the peak hour flow (including RAS flow) is used. Polymer is added to the secondary clarifiers during high flow periods, and the plant operating data show a peak effluent flow of roughly 27 MGD, or a peak flow capacity of 6.75 MGD per clarifier. Consequently, this flow rate is assumed to be the current peak capacity for the secondary clarifiers. Given the flow capacity for the secondary clarifiers, 27 MGD, and the design peak flow rate, 68 MGD, 41 MGD of equalization is needed. Consequently, 1.7 MG of equalization volume is needed for every hour the facility receives peak flow.
As indicated, adequate equalization from the influent peak hour flow, 68 MGD, to the secondary treatment peak flow, 41 MGD, is needed to ensure the secondary clarifier peak flow does not exceed 27 MGD. As indicated, a storage volume of 1.7 MG is needed for every hour that the plant receives 68 MGD of flow. With 18 MG of equalization, the facility can equalize the 41 MGD flow difference for 10 hours when starting with empty equalization basins.
Proposed Process Flow Scheme
A process flow scheme is proposed, which reflects modifying the existing activated sludge system into a nitrifying/denitrifying system with an anoxic tank. Two alternatives were investigated. Alternative one looks at operation of the facility with 50 percent of the primary

Page 13 of 32
clarifier effluent bypassing the trickling filters. Alternative two assumes 100 percent bypass of the trickling filters. Additionally, the chlorine disinfection system is replaced by a UV disinfection system in this flow scheme.
A future phosphorus limit is anticipated for the system. Data for the facility show that the effluent phosphorus concentration is currently less than 1 mg/L. Water treatment plant solids discharged to the facility bonds with the phosphorus to remove phosphorus in the clarifiers. Given the background phosphorus removal achieved by the facility, a chemical phosphorus removal would be most suitable for this system to support the existing phosphorus removal mechanism. Chemical phosphorus removal with alum is preferred to iron salts, because alum does not interfere with UV disinfection.
The flow diagram for the proposed WWTF is shown in Figure 3. The following unit processes are included:
Influent – Consists of influent wastewater and waste solids
Headworks – Consisting of screening and grit removal
Alum Dosing – Dosing point upstream of primary and secondary clarifiers
Primary clarification – Alum addition can be added to primary clarifier influent to support chemical phosphorus removal
Activated sludge – A new anoxic basin is assumed integrated into the activated sludge system to create a Modified Ludzack Ettinger (MLE) process with an anoxic zone volume of 0.75 MG and an aerobic zone volume of 2.25 MG. No additional secondary clarifiers were added based on the clarifier capacity analysis. See BioWinTM modeling for biological process analysis in the next section.
Disinfection – UV is used for disinfection. Disinfection does not impact the solids balance, but it is a consideration for alkalinity consumption
WAS thickening using existing centrifuges
Primary and secondary digesters
Biosolids dewatering using a belt filter press.
Composting dewatered biosolids

Page 14 of 32
Figure 3. Proposed Process Flow Scheme
The flow rates used for the investigation are based on the capacity evaluation. Therefore, a maximum monthly flow of 17 MGD was used and a peak hour flow of 68 MGD was applied to the primary clarifiers with half of the flow diverted to the equalization basins, resulting in 34 MGD of flow applied to the rest of the system at peak hour conditions. The proposed process flow diagram shows a trickling filter bypass and a denitrifying activated sludge system. All process return flows are directed to the influent.
Two alternatives were evaluated for the system shown in Figure 3. Alternative 1 assumes that 50 percent of primary clarifier effluent flow is bypassed around the trickling filter and the rest flows through the trickling filter. By doing this, some of the soluble BOD needed to support denitrification is bypassed directly to the activated sludge system, but the trickling filters are kept in service to accommodate part of the BOD load. Alternative 2 bypasses the entire flow around the trickling filters, effectively eliminating trickling filters. This shifts the entire treatment burden to the activated sludge system, but provides more effective denitrification. The results from the calculations are shown in Table 9 for the following conditions:
Alternative 1 – Denitrification with 50 percent trickling filter bypass
Maximum month loading (MM1)
Peak hydraulic condition (PHF1)
Alternative 2 – Denitrification with 100 percent trickling filter bypass
Maximum month loading (MM2)
Peak hydraulic condition (PHF2)
Table 9 assumes the influent maximum monthly loading conditions presented in the previous section. Based on the analysis, the peak specific oxygen demand for the maximum monthly

Page 15 of 32
condition is 57-61 mg/(L•hr), which falls near the threshold limit of 60 mg/(L•hr). During denitrification, nitrate acts as the electron acceptor in place of oxygen saving approximately 2.8 mg O2 per 1 mg NO3-N that is denitrified. This translates to an oxygen savings between 130 and 230 lb/hr. Typically, denitrification produces alkalinity according to the ratio 3.6 mg CaCO3/L per 1 mg NO3-N/L denitrified. As a result, between 30 and 50 mg CaCO3/L can be recovered by denitrification.
Table 9. Mass Balance and Process Analysis for Proposed Process Flow Scheme
Alternative 1 Alternative 2
Process/Loading Units MM1 PHF1 MM2 PHF2
Influent Flow MGD 17 68 17 68
EQ Diversion MGD 0 34 0 34
Primary Clarifiers
Flow MGD 17 68 17 68
Number of primary clarifiers None 4 4 4 4
Diameter ft 70 70 70 70
Depth ft 10 10 10 10
Clarifier area (total) sq ft 15,390 15,390 15,390 15,390
Clarifier volume (total) cu ft 153,900 153,900 153,900 153,900
Hydraulic surface loading rate gpd/sq ft 800 3,000 800 3,000
Hydraulic retention time Hr 2.4 0.6 2.4 0.6
Underflow concentration % 3.2 3.2 3.2 3.2
TF Bypass
Percentage of flow diverted to AS % 50 50 100 100
Trickling Filter Stream MGD 8.5 17 0 0
Bypass Stream MGD 8.5 17 34 34
Temperature °C 10 10 10 10
Trickling Filter
Number of trickling filters None 3 3 - -
Media depth ft 7 7 - -
Diameter ft 110 110 - -
Filter area sq ft 28,510 28,510 - -
Media volume 1000 cu ft 199.6 199.6 - -
Hydraulic loading (without recycle) gpm/sq ft 0.2 0.4 - -
Organic loading Rate lb/1000 cu ft/d 24 - - -
Effluent NH4 mg/L 21 - - -
Organic removal rate % 37 - - -
VSS/TSS % 56 - - -
Effluent total BOD mg/L 41 - - -
Activated Sludge
Number of units none 4 4 4 4
Volume of each unit Mgal 0.75 0.75 0.75 0.75
Anoxic volume fraction none 0.25 0.25 0.25 0.25
Total volume Mgal 3.0 3.0 3.0 3.0
Depth (aerobic) ft 15 15 15 15
SRT (total) without clarifier days 16 16 16 16
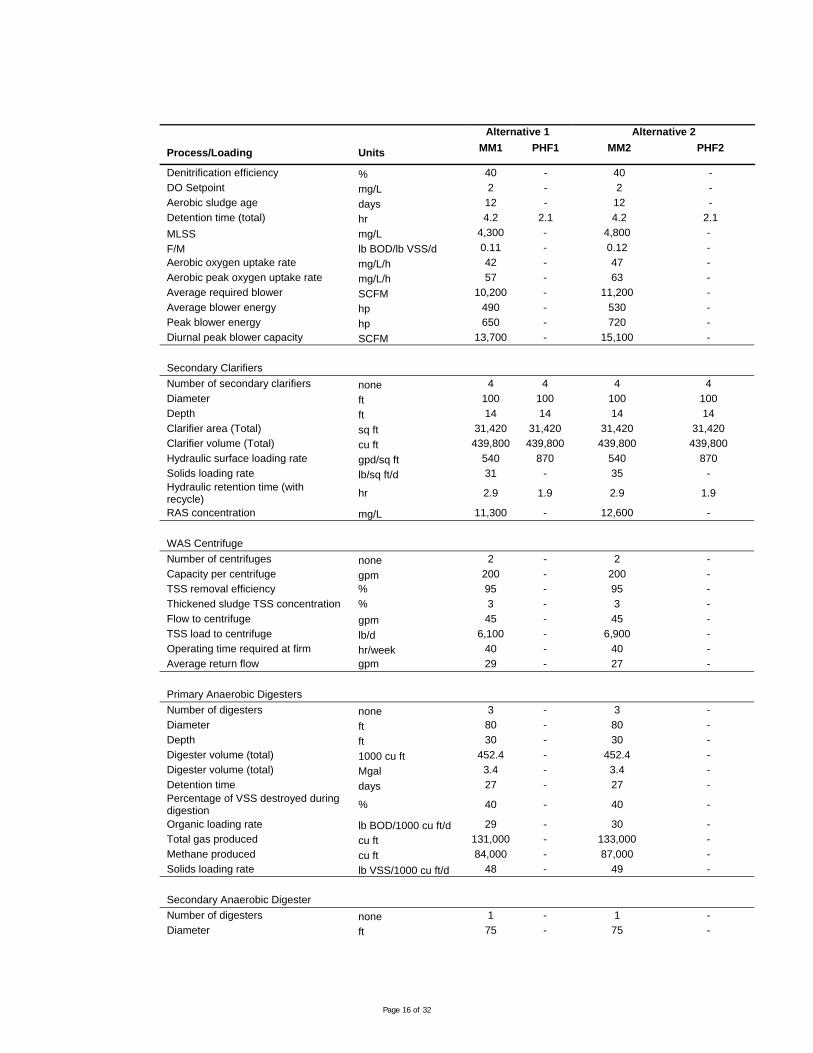
Page 16 of 32
Alternative 1 Alternative 2
Process/Loading Units MM1 PHF1 MM2 PHF2
Denitrification efficiency % 40 - 40 -
DO Setpoint mg/L 2 - 2 -
Aerobic sludge age days 12 - 12 -
Detention time (total) hr 4.2 2.1 4.2 2.1
MLSS mg/L 4,300 - 4,800 -
F/M lb BOD/lb VSS/d 0.11 - 0.12 -
Aerobic oxygen uptake rate mg/L/h 42 - 47 -
Aerobic peak oxygen uptake rate mg/L/h 57 - 63 -
Average required blower SCFM 10,200 - 11,200 -
Average blower energy hp 490 - 530 -
Peak blower energy hp 650 - 720 -
Diurnal peak blower capacity SCFM 13,700 - 15,100 -
Secondary Clarifiers
Number of secondary clarifiers none 4 4 4 4
Diameter ft 100 100 100 100
Depth ft 14 14 14 14
Clarifier area (Total) sq ft 31,420 31,420 31,420 31,420
Clarifier volume (Total) cu ft 439,800 439,800 439,800 439,800
Hydraulic surface loading rate gpd/sq ft 540 870 540 870
Solids loading rate lb/sq ft/d 31 - 35 - Hydraulic retention time (with recycle)
hr 2.9 1.9 2.9 1.9
RAS concentration mg/L 11,300 - 12,600 -
WAS Centrifuge
Number of centrifuges none 2 - 2 -
Capacity per centrifuge gpm 200 - 200 -
TSS removal efficiency % 95 - 95 -
Thickened sludge TSS concentration % 3 - 3 -
Flow to centrifuge gpm 45 - 45 -
TSS load to centrifuge lb/d 6,100 - 6,900 -
Operating time required at firm hr/week 40 - 40 -
Average return flow gpm 29 - 27 -
Primary Anaerobic Digesters
Number of digesters none 3 - 3 -
Diameter ft 80 - 80 -
Depth ft 30 - 30 -
Digester volume (total) 1000 cu ft 452.4 - 452.4 -
Digester volume (total) Mgal 3.4 - 3.4 -
Detention time days 27 - 27 - Percentage of VSS destroyed during digestion
% 40 - 40 -
Organic loading rate lb BOD/1000 cu ft/d 29 - 30 -
Total gas produced cu ft 131,000 - 133,000 -
Methane produced cu ft 84,000 - 87,000 -
Solids loading rate lb VSS/1000 cu ft/d 48 - 49 -
Secondary Anaerobic Digester
Number of digesters none 1 - 1 -
Diameter ft 75 - 75 -

Page 17 of 32
Alternative 1 Alternative 2
Process/Loading Units MM1 PHF1 MM2 PHF2
Depth ft 25 - 25 -
Digester volume (total) 1000 cu ft 110.4 - 110.4 -
Digester volume (total) Mgal 0.83 - 0.83 -
Detention time days 7 - 6 -
Belt Filter Press
Number of belt press units none 2 - 2 -
Belt width per unit m 2 - 2 -
Flow capacity per unit gpm 98 - 98 - Percentage TSS removed from influent stream %
95 - 95 -
Dewatered sludge TSS concentration % 18.2 - 18.2 -
Total installed capacity gpm 196 - 196 -
Firm installed capacity gpm 98 - 98 -
Average flow to belt filter gpm 86 - 88 -
Average TSS load to belt press lb/d 23,000 - 24,000 -
Operating time required at firm hr/week 150 - 150 -
Hydraulic loading per meter gpm/m 43 - 44 -
Solids loading per meter lb/d/m 12,000 - 12,000 -
Chlorine disinfection consumes additional alkalinity. In contrast, UV disinfection, does not consume alkalinity, and it does not require a dechlorination step. An alkalinity consumption of 1.2 mg CaCO3/L per mg/L chlorine dosed to the system is commonly accepted. Thus, if a chlorine dose between 5 and 15 mg/L is avoided, then between 6 and 18 mg CaCO3/L is saved if UV disinfection is used.
Chemical phosphorus removal requires addition of metal salts. Aluminum sulfate hydrate (alum) is applied in the proposed flow scheme. For the maximum month wastewater flow rate (17 MGD) and an influent phosphorus concentration of 4 mg P/L, the alum dosage and consumption were projected. An alum dose of approximately 40 mg/L is needed based. This means the daily alum consumption during maximum month flow conditions is 980 gallons. The drawback of using chemical phosphorus removal is that approximately 20 mg CaCO3/L alkalinity is destroyed.
BioWin Modeling
Introduction
The BioWinTM simulator provides a focused model for biological treatment processes using the activated sludge model and other biological systems models, and it is especially useful for evaluating nutrient removal systems. BioWinTM uses the wastewater knowledge base developed for these fundamental models to predict suspended solids, chemical oxygen demand (COD), BOD5, and nutrient concentrations given a detailed influent characterization and operating conditions. Output from BioWin is used to confirm system capacity and removal rates.

Page 18 of 32
Approach
Data from historical operations are used to calibrate or setup the model. For this analysis, data from ENVision, derived from the operating data, were used to characterize activated sludge influent quality. Default model coefficients were assumed to apply. Therefore, the BioWinTM model was setup to treat primary clarifier effluent and trickling filter effluent. The activated sludge system described for the proposed process flow was built into the BioWinTM model. This assumes addition of a 0.75 MG anoxic zone ahead of the existing 2.25 MG aeration basins. Additionally, it is proposed that the aeration basins split into four aerobic zones each with a volume of 0.56 MG, because the basins are configured in a quasi-plug flow manner.
Results
The activated sludge system process flow scheme BioWinTM setup is shown in Figure 4. Primary clarifier effluent shown in Table 9, for conditions MM1 and MM2, was applied to the flow scheme shown in Figure 4. The model output reflects an SRT of 12 days for the aerobic zones and a combined SRT of 18 days for the anoxic zone, the aerobic zones and the clarifier.
Figure 4. BioWinTM Process Flow Scheme
Table 10. BioWinTM Output for MM1
COD BOD TSS VSS TKN NH3 Nitrate Alkalinity
Elements mg/L mg/L mg/L mg/L mgN/L mgN/L mgN/L mgCaCO3/L
PC Effluent 140 66 81 53 25 16 - 220 TF Effluent 95 41 70 39 25 20 - 220 Anoxic 4,400 2,200 3 12 121 Aerobic Zone 1 4,400 2,200 2 13 114 Aerobic Zone 2 4,400 2,200 0.4 14 108 Aerobic Zone 3 4,400 2,200 0.2 15 104 Aerobic Zone 4 4,400 2,200 0.2 15 102 Effluent 19 3.3 6 3 0.2 15 102

Page 19 of 32
Table 11. BioWinTM Output for MM2
COD cBOD TSS VSS TKN NH3 Nitrate Alkalinity
Elements mg/L mg/L mg/L mg/L mgN/L mgN/L mgN/L mgCaCO3/
L
PC Effluent 140 66 81 53 25 16 - 220
Anoxic 4,600 2,500 3 10 135
Aerobic Zone 1 4,600 2,500 2 11 128
Aerobic Zone 2 4,600 2,500 1 12 123
Aerobic Zone 3 4,600 2,500 0.5 12 119
Aerobic Zone 4 4,600 2,500 0.2 13 117
Effluent 21 3.6 11 6 3 0.2 13 117
The system successfully denitrifies the wastewater with a maximum projected efficiency of 40 percent given a mixed liquor return flow two times the influent flow. However, denitrification is limited by the availability of organic carbon to the system even for both alternatives. Alternative 2 shows slightly better performance than Alternative 1. To improve denitrification, the deficiency may be overcome by dosing a carbon source such as methanol or molasses.
The following is concluded based on the BioWinTM simulation:
The addition of a new anoxic basin prevents nitrifier washout by not displacing aerobic volume with anoxic volume. Denitrification is possible given the addition of a 0.75 MG anoxic zone (25% of the total system volume), but it is limited by the availability of organic carbon.
A maximum denitrification efficiency of 40 percent is expected without supplementing an organic carbon source.
A total system SRT of 18 days is needed to ensure a minimum 12 day SRT in the aerobic zones for the maximum month influent load at an operating temperature of 15°C.
Feeding the system with primary clarifier effluent is typically superior to blending primary clarifier effluent with trickling filter effluent, because the trickling filter reduces the organic carbon available.
The model shows reduced alkalinity consumption by the system, which results from alkalinity recovered during denitrification. As a result, between 20 and 30 mgCaCO3/L alkalinity is recovered.
Oxygen demand credit is provided by denitrification. The oxygen demand is reduced by roughly 3,000 lb/d.
Conclusions
One objective of the analysis was to evaluate operations and performance of the facility. The data analysis shows that the South Regional WWTF currently treats an average flow of 8.8

Page 20 of 32
MGD and an average BOD load of 10,467 lb/d. The maximum monthly flow and load to the facility were 11.7 MGD and 14,267 lb/d, respectively. Primary clarifiers remove BOD and TSS with efficiencies of 65 and 71 percent, respectively. The volatile fraction of the TSS is low throughout the plant, reflecting the inert solids discharged from the upstream water treatment plant.
The second objective was to estimate the capacity of the existing system for future loadings. Using a model calibration to the data provided, the maximum month capacity for the system was projected as roughly 17 MGD based on the capacity of the primary clarifiers, the trickling filters, the activated sludge process and the final clarifiers. A peak flow capacity of 68 MGD was projected through the primary clarifiers. Primary clarifier effluent is split between equalization and downstream processes. A peak capacity of 27 MGD was projected through the trickling filters, the secondary clarifiers and the disinfection basins. Note, the peak available flow capacity estimation is based on process capacity, and it needs to be reconciled with the hydraulic profile of the system; i.e. pipe capacity, flow channel capacity, pump capacity, etc.
A third objective was to investigate an alternative process flow scheme that produces an effluent which meets or exceeds the existing effluent quality while reducing chemical consumption and/or energy costs. Based on the analysis, implementation of denitrification as part of the activated sludge process reduces oxygen consumption by roughly 3,000 lb/d and caustic demand by as much as 30 mgCaCO3/L. The alkalinity recovery largely offsets the alkalinity dosed to the system as estimated by alkalinity addition during 2007.
Treatment objectives are met through the proposed process. Removal of BOD and TSS is achieved with the trickling filter and activated sludge system. The modified activated sludge system achieves partial denitrification, which reduces oxygen consumption and recovers alkalinity.
Recommendations
The influent maximum month and peak hour flow rates were evaluated in Table 8 for the existing system. Given the model calibration, it is safe to operate the system at this loading.
The process mass balances in Table 9 show the estimated system capacity for the system designed to denitrify. The unit loadings can be used to evaluate individual processes.
Installation of a separate, 0.75 MG anoxic zone supports denitrification, and an adequately long SRT is maintained in the aerobic system to safely maintain nitrification.
Replacement of coarse bubble diffusers with fine bubble diffusers provides the improved oxygen transfer needed to meet the oxygen uptake rates found by the process calculations.

Page 21 of 32
The trickling filters consume some of the readily biodegradable component of the wastewater important for denitrification. Consequently, a trickling filter bypass is recommended for operation of the denitrifying system. It is recommended that the ability to bypass up to 100 percent of the trickling filter flow be built into the system with optimization of the bypass fraction verified during operation.
The mass quantities in Table A-1 provide a basis for process design. For example, the waste activated sludge mass is expected to be at the rates shown – 6,000-7,000 lb/d for MM1 based on the TSS Load to the centrifuge. The mass balance WAS flow is calculated from the design RAS TSS concentration. However, since operators will change the RAS setpoint based on field conditions, the design should consider the range of operating conditions. For RAS recycle rates, typical RAS TSS concentrations would range from 6,000 to 12,000 mg/L. These values should be used to bracket the WAS flow.

Page 22 of 32
Appendix Table A - 1. Full ENVision Mass Balance Results
Process/Loading Units
Existing Average
Flow
Existing Max
Monthly
Existing Peak Hour MM1 PHF1 MM2 PHF2
Temperature C 20 20 20 15 15 15 15
Influent
Flow mgd 7.7 10.7 38.8 15.9 66.9 15.9 66.9
Biochemical oxygen demand concentration (total)
mg/L 146 148 83 148 83 148 83
Biochemical oxygen demand concentration (soluble)
mg/L 33 33 23 33 23 33 23
Total suspended solids concentration
mg/L 164 212 223 212 223 212 223
Percentage of total solids consisting of volatile solids
% 82 82 82 82 82 82 82
Ammonia concentration mg N/L 18 15 8 15 8 15 8
Nitrate concentration mg N/L 0 0 0 0 0 0 0
Total Kjeldahl Nitrogen mg N/L 33 32 18 32 18 32 18
Orthophosphorous concentration
mg P/L 4.5 4.4 2.5 4.4 2.5 4.4 2.5
Chemical phosphorus mg P/L 0 0 0 0 0 0 0
Total phosphorus mg P/L 4.5 4.4 2.5 4.4 2.5 4.4 2.5
Alkalinity concentration mg/L 250 250 250 250 250 250 250
Solids Stream Influent
Flow mgd 1.1 1.1 1.1 1.1 1.1 1.1 1.1
Biochemical oxygen demand concentration (total)
mg/L 120 120 120 120 120 120 120
Biochemical oxygen demand concentration (soluble)
mg/L 0 0 0 0 0 0 0
Total suspended solids concentration
mg/L 970 970 970 970 970 970 970
Percentage of total solids consisting of volatile solids
% 18 18 18 18 18 18 18
Ammonia concentration mg N/L 0 0 0 0 0 0 0
Nitrate concentration mg N/L 0 0 0 0 0 0 0
Total Kjeldahl Nitrogen mg N/L 12 12 12 12 12 12 12
Orthophosphorous concentration
mg P/L 0 0 0 0 0 0 0
Chemical phosphorus mg P/L 0 0 0 0 0 0 0
Total phosphorus mg P/L 1.2 1.2 1.2 1.2 1.2 1.2 1.2

Page 23 of 32
Process/Loading Units
Existing Average
Flow
Existing Max
Monthly
Existing Peak Hour MM1 PHF1 MM2 PHF2
Alkalinity concentration mg/L 250 250 250 250 250 250 250
Influent Mixer
Mechanical Bar Screens
Number of screen units none 2 2 2 2 2 2 2
Screen hydraulic capacity mgd/unit 5 5 5 5 5 5 5
Screen openings in 0.375 0.375 0.375 0.375 0.375 0.375 0.375
Screenings removal rate cu yrd/MG 3 3 3 3 3 3 3
Screens installed capacity - Firm
mgd 5 5 5 5 5 5 5
Screens installed capacity - Total
mgd 10 10 10 10 10 10 10
Screenings production cu yrd/d 26.84 36.04 121.2 51.83 206.3 51.84 206.3
Number of grit units none 2 2 2 2 2 2 2
Grit basin volume (each unit) gal/unit 10,000 10,000 10,000 10,000 10,000 10,000 10,000
Grit basin area (each unit) sf/unit 160 160 160 160 160 160 160
Grit removal rate cu yrd/MG 5 5 5 5 5 5 5
Grit basin hydraulic retention time
min 3.219 2.398 0.7127 1.667 0.4188 1.667 0.4188
Grit basin overflow rate gpm/sq ft 19.41 26.07 87.69 37.49 149.2 37.5 149.2
Grit production cu yrd/d 44.73 60.06 202 86.39 343.8 86.41 343.8
Primary Clarifiers
Number of primary clarifiers none 4 4 4 4 4 4 4
Diameter ft 85 85 85 85 85 85 85
Depth ft 10 10 10 10 10 10 10
TSS removal efficiency % 70 70 70 70 70 70 70
Clarifier area (Total) sq ft 22,700 22,700 22,700 22,700 22,700 22,700 22,700
Clarifier volume (Total) cu ft 227,000 227,000 227,000 227,000 227,000 227,000 227,000
Hydraulic surface loading rate gpd/sq ft 394.1 529.2 1,780 761.2 3,030 761.4 3,030
Hydraulic retention time hr 4.555 3.392 1.008 2.358 0.5926 2.358 0.5925
Solids loading rate lb/sq ft/d 0.891 1.273 3.681 1.696 6.042 1.699 6.047
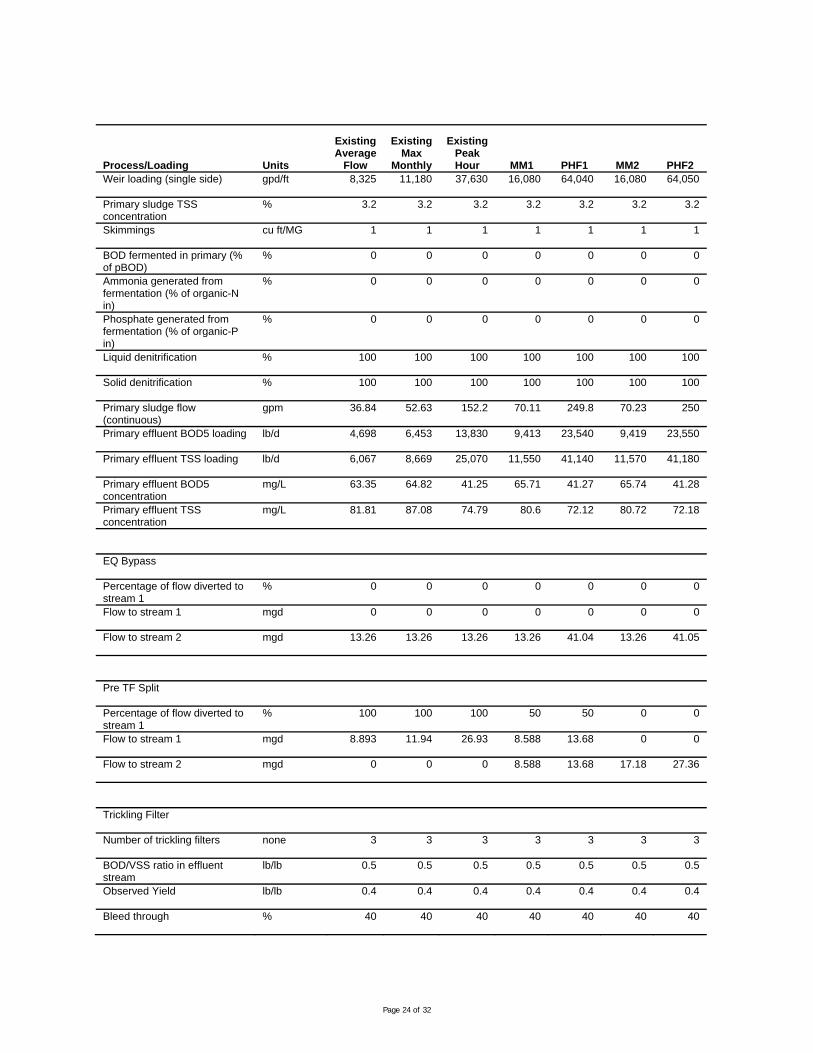
Page 24 of 32
Process/Loading Units
Existing Average
Flow
Existing Max
Monthly
Existing Peak Hour MM1 PHF1 MM2 PHF2
Weir loading (single side) gpd/ft 8,325 11,180 37,630 16,080 64,040 16,080 64,050
Primary sludge TSS concentration
% 3.2 3.2 3.2 3.2 3.2 3.2 3.2
Skimmings cu ft/MG 1 1 1 1 1 1 1
BOD fermented in primary (% of pBOD)
% 0 0 0 0 0 0 0
Ammonia generated from fermentation (% of organic-N in)
% 0 0 0 0 0 0 0
Phosphate generated from fermentation (% of organic-P in)
% 0 0 0 0 0 0 0
Liquid denitrification % 100 100 100 100 100 100 100
Solid denitrification % 100 100 100 100 100 100 100
Primary sludge flow (continuous)
gpm 36.84 52.63 152.2 70.11 249.8 70.23 250
Primary effluent BOD5 loading lb/d 4,698 6,453 13,830 9,413 23,540 9,419 23,550
Primary effluent TSS loading lb/d 6,067 8,669 25,070 11,550 41,140 11,570 41,180
Primary effluent BOD5 concentration
mg/L 63.35 64.82 41.25 65.71 41.27 65.74 41.28
Primary effluent TSS concentration
mg/L 81.81 87.08 74.79 80.6 72.12 80.72 72.18
EQ Bypass
Percentage of flow diverted to stream 1
% 0 0 0 0 0 0 0
Flow to stream 1 mgd 0 0 0 0 0 0 0
Flow to stream 2 mgd 13.26 13.26 13.26 13.26 41.04 13.26 41.05
Pre TF Split
Percentage of flow diverted to stream 1
% 100 100 100 50 50 0 0
Flow to stream 1 mgd 8.893 11.94 26.93 8.588 13.68 0 0
Flow to stream 2 mgd 0 0 0 8.588 13.68 17.18 27.36
Trickling Filter
Number of trickling filters none 3 3 3 3 3 3 3
BOD/VSS ratio in effluent stream
lb/lb 0.5 0.5 0.5 0.5 0.5 0.5 0.5
Observed Yield lb/lb 0.4 0.4 0.4 0.4 0.4 0.4 0.4
Bleed through % 40 40 40 40 40 40 40

Page 25 of 32
Process/Loading Units
Existing Average
Flow
Existing Max
Monthly
Existing Peak Hour MM1 PHF1 MM2 PHF2
Fraction of non-volatile biomass
lb/lb 0.2 0.2 0.2 0.2 0.2 0.2 0.2
Media type none 0 0 0 0 0 0 0
Media type none 0 0 0 0 0 0 0
Media type none 0 0 0 0 0 0 0
Media depth ft 7 7 7 7 7 7 7
Diameter ft 110 110 110 110 110 110 110
Internal recirculation rate % 0 0 0 0 0 0 0
Filter area sq ft 28,510 28,510 28,510 28,510 28,510 28,510 28,510
Media volume 1000 cu ft 199.6 199.6 199.6 199.6 199.6 199.6 199.6
Wetting rate (with recycle) gpm/sq ft 0.2166 0.2908 0.6559 0.2092 0.3332 0.2092 0.3332
Hydraulic loading (without recycle)
gpm/sq ft 0.2166 0.2908 0.6559 0.2092 0.3332 0.2092 0.3332
Organic loading Rate lb/1000 cu ft/d
23.54 32.33 46.42 23.58 23.59 23.58 23.59
Effluent NH4 mg/L 21.39 19.97 10.79 20.63 10.73 20.63 10.73
Nitrogen for growth lb N/lb VSS 0.1 0.1 0.1 0.1 0.1 0.1 0.1
Nitrification efficiency % 0 0 0 0 0 0 0
Denitrification efficiency % 0 0 0 0 0 0 0
Minimum P in VSS lb P/lb VSS 2.00E-02
2.00E-02
2.00E-02
2.00E-02
2.00E-02
2.00E-02
2.00E-02
Effluent TON mg/L 0 0 0 0 0 0 0
Influent soluble BOD mg/L 28.61 29.63 22.23 30.57 22.49 30.57 22.49
Effluent soluble BOD mg/L 19.35 21.14 17.75 21.87 17.25 21.87 17.25
sBOD out / sBOD in % 67.63 71.35 79.87 71.53 76.69 71.53 76.69
Effluent particulate BOD mg/L 17.37 19.38 15.85 19.44 15.96 19.44 15.96
Corrected K factor none 2.00E-03
2.00E-03
2.00E-03
1.68E-03
1.68E-03
1.68E-03
1.68E-03
Effluent inert ISS mg/L 42.5 37.36 20.89 30.77 18.24 30.77 18.24
sBOD out / tBOD in % 30.55 32.61 43.04 33.27 41.79 33.27 41.79
tBOD out / tBOD in % 57.96 62.51 81.47 62.85 80.48 62.85 80.48
Organic removal rate % 42.04 37.49 18.53 37.15 19.52 37.15 19.52
VSS/TSS % 44.97 50.92 60.28 55.81 63.64 55.81 63.64
Observed yield lb VSS/lb BOD
1.304 1.595 4.15 1.593 3.963 1.593 3.963
Recycle flow mgd 0 0 0 0 0 0 0

Page 26 of 32
Process/Loading Units
Existing Average
Flow
Existing Max
Monthly
Existing Peak Hour MM1 PHF1 MM2 PHF2
Flow bypassed mgd 0 0 0 0 0 0 0
Effluent total BOD mg/L 36.72 40.52 33.61 41.3 33.21 41.3 33.21
TKN loading rate lb N/1000 cu ft/d
9.238 11.9 15.71 8.8 7.96 8.8 7.96
NH4 loading rate lb N/1000 cu ft/d
7.57 9.371 12.24 6.963 6.204 6.963 6.204
Pre-Aeration Basin
Flow mgd 8.946 12.01 40.41 17.28 68.76 17.28 68.77
Activated Sludge
Number of units none 2.57 4 4 4 4 4 4
Volume of each unit Mgal 0.562 0.562 0.75 0.75 0.75 0.75 0.75
Anaerobic volume fraction none 0 0 0 0 0 0 0
Anoxic volume fraction none 0 0 0 0.25 0.25 0.25 0.25
Total volume Mgal 1.444 2.248 3 3 3 3 3
Depth (aerobic) ft 15 15 15 15 15 15 15
Sludge age (aerobic) days 14 14 14 12 12 12 12
SRT (total) without clarifier days 14 14 14 16 16 16 16
Effluent ammonia (when nitrifying)
mg/L 0.14 0.14 0.14 0.14 0.14 0.14 0.14
Denitrification efficiency % 0 0 40 40 40 40 40
Effluent orthophosphate (with EBPR)
mg/L 0.3 0.3 0.3 0.3 0.3 0.3 0.3
SRT (total ) with clarifier days 19.73 18.94 22.36 22.09 25.11 22.09 25.11
Mechanical aeration transfer efficiency
lb/hp-h 3 3 3 3 3 3 3
DO Setpoint mg/L 2 2 2 2 2 2 2
Blower unit energy SCFM/hp 21 21 21 21 21 21 21
Dirty/Clean water factor (diffused aeration)
none 0.5 0.5 0.5 0.5 0.5 0.5 0.5
Dirty/Clean water factor (mechanical aeration)
none 0.75 0.75 0.75 0.75 0.75 0.75 0.75
DO saturation factor none 0.99 0.99 0.99 0.99 0.99 0.99 0.99
Aerobic sludge age days 14 14 14 12 12 12 12
Detention time (total) hr 3.898 4.52 2.674 4.192 2.631 4.191 2.631
Detention time (aerobic) hr 3.898 4.52 2.674 3.144 1.974 3.143 1.973

Page 27 of 32
Process/Loading Units
Existing Average
Flow
Existing Max
Monthly
Existing Peak Hour MM1 PHF1 MM2 PHF2
Detention time (anaerobic) hr 0 0 0 0 0 0 0
Detention time (anoxic) hr 0 0 0 1.048 0.6579 1.048 0.6578
MLSS mg/L 3,705 3,224 3,906 4,258 5,269 4,755 6,130
F/M lb BOD/lb VSS/d
9.79E-02
0.1059 0.1207 0.1104 0.1008 0.1197 9.66E-02
Denitrification ratio lb N/lb VSS/d
0 0 0 0.5876 0.4144 0.5126 0.3489
BOD/P ratio lb BOD/lb P 8.778 9.606 13.29 12.3 14.76 14.99 16.29
BOD/N ratio lb BOD/lb N 1.477 1.699 2.407 2.182 2.674 2.664 2.953
Yield total lb TSS/lb BOD
1.171 1.07 0.9248 0.8686 0.9695 0.7894 1.017
Peak OUR none 1.35 1.35 1.35 1.35 1.35 1.35 1.35
Yield VSS lb VSS/lb BOD
0.7295 0.6742 0.5917 0.5663 0.6202 0.5222 0.6468
PBOD/VSS ratio lb BOD/lb VSS
0.4 0.4 0.4 0.4 0.4 0.4 0.4
Minimum P in VSS % 2.5 2.5 2.5 2.5 2.5 2.5 2.5
Maximum nitrifier growth rate per day 0.6 0.6 0.6 0.6 0.6 0.6 0.6
Nitrifier decay rate per day 0.17 0.17 0.17 0.17 0.17 0.17 0.17
Carbonaceous oxygen required
lb/d 3,157 4,698 8,614 8,639 9,330 10,620 10,340
Nitrification oxygen required lb/d 7,470 9,543 12,150 13,980 11,970 13,820 11,650
Denitrification credit lb/d 0 0 0 3,499 2,995 3,459 2,916
Total oxygen required lb/d 10,630 14,240 20,760 19,120 18,300 20,980 19,080
Aerobic oxygen uptake rate mg/L/h 36.76 31.65 34.57 42.45 40.64 46.58 42.36
Aerobic peak oxygen uptake rate
mg/L/h 49.63 42.73 46.67 57.3 54.86 62.88 57.19
SOTE % 21 21 21 21 21 21 21
OTE % 8.324 8.324 8.324 7.565 7.565 7.565 7.565
Average required blower capacity
SCFM 5,140 6,887 10,040 10,170 9,739 11,160 10,150
Average blower energy hp 244.7 328 478.1 484.4 463.8 531.5 483.4
Peak blower energy hp 330.4 442.8 645.5 654 626.1 717.6 652.6
Diurnal peak blower capacity SCFM 6,938 9,298 13,550 13,730 13,150 15,070 13,710
Anaerobic mixing required (total)
hp 0 0 0 0 0 0 0
Anoxic mixing required (total) hp 0 0 0 22.5 22.5 22.5 22.5
MLE pumping est. % 0 0 0 8.136 18.9 8.152 18.96
MLE pump req'd mgd 0 0 0 1.397 5.173 1.401 5.189

Page 28 of 32
Process/Loading Units
Existing Average
Flow
Existing Max
Monthly
Existing Peak Hour MM1 PHF1 MM2 PHF2
MLE energy est. hp 0 0 0 0.7027 2.601 0.7043 2.609
Secondary Clarifiers
Number of secondary clarifiers none 4 4 4 4 4 4 4
Diameter ft 100 100 100 100 100 100 100
Depth ft 14 14 14 14 14 14 14
Liquid denitrification % 0 0 0 0 0 0 0
Solid denitrification % 0 0 0 0 0 0 0
Phosphate released (% of organic-P in)
% 0 0 0 0 0 0 0
TSS concentration in liquid effluent stream
mg/L 3.9 3.9 3.9 3.9 3.9 3.9 3.9
Maximum MLSS mg/L 10,000 10,000 10,000 10,000 10,000 10,000 10,000
Clarifier area (Total) sq ft 31,420 31,420 31,420 31,420 31,420 31,420 31,420
Clarifier volume (Total) cu ft 439,800 439,800 439,800 439,800 439,800 439,800 439,800
Hydraulic surface loading rate gpd/sq ft 281.9 378.2 854.9 544.7 869.2 544.8 869.2
Solids loading rate lb/sq ft/d 13.96 16.3 44.6 30.99 57.33 34.61 66.7
Solids loading rate at set MLSS
lb/sq ft/d 13.96 16.3 44.6 30.99 57.33 34.61 66.7
Weir loading (single side) gpd/ft 7,048 9,455 21,370 13,620 21,730 13,620 21,730
Hydraulic retention time (with recycle)
hr 5.563 4.146 1.836 2.88 1.926 2.879 1.926
Hydraulic retention time (without recycle)
hr 8.914 6.645 2.94 4.614 2.892 4.613 2.891
RAS concentration mg/L 9,848 8,566 10,390 11,320 15,780 12,640 18,360
Max SVI allowed mL/g 101.5 116.7 96.23 88.34 63.38 79.1 54.48
Chlorination
Number of contact basins none 2 2 2 2 2 2 2
Volume of each unit 1000 cu ft 27 27 27 27 27 27 27
Chlorine dose mg/L 15 15 15 15 15 15 15
Chlorine demand mg/L 0 0 0 0 0 0 0
Number of chlorinators none 2 2 2 2 2 2 2
Capacity of each chlorinator lb Cl2/d 0 0 0 0 0 0 0
Detention time min 65.67 48.95 21.66 33.99 21.3 33.98 21.3

Page 29 of 32
Process/Loading Units
Existing Average
Flow
Existing Max
Monthly
Existing Peak Hour MM1 PHF1 MM2 PHF2
Chemical storage lb 0 0 0 0 0 0 0
Alkalinity consumption lb CaCO3/lb Cl2
0.7 0.7 0.7 0.7 0.7 0.7 0.7
Required chlorine dose lb/d 1,108 1,486 3,360 2,141 3,416 2,141 3,416
Firm dose capacity lb/d 0 0 0 0 0 0 0
Total dose capacity lb/d 0 0 0 0 0 0 0
Chlorine residual mg/L 15 15 15 15 15 15 15
CT mg-min/L 985 734.3 324.9 509.9 319.5 509.8 319.5
Chlorine refill period days 0 0 0 0 0 0 0
Alkalinity removed mg/L 10.5 10.5 10.5 10.5 10.5 10.5 10.5
Dechlorination
Sulfur dioxide dose mg/L 1 1 1 1 1 1 1
Number of sulfinators none 2 2 2 2 2 2 2
Capacity of each sulfinator lb SO2/d 40 40 40 40 40 40 40
Sulfur dioxide storage lb 0 0 0 0 0 0 0
Alkalinity consumption lb CaCO3/lb SO2
3.1 3.1 3.1 3.1 3.1 3.1 3.1
Required sulfur dioxide dose lb/d 73.87 99.09 224 142.7 227.7 142.7 227.7
Firm dose capacity lb/d 40 40 40 40 40 40 40
Total dose capacity lb/d 80 80 80 80 80 80 80
Storage refill period days 0 0 0 0 0 0 0
Alkalinity removed mg/L 3.1 3.1 3.1 3.1 3.1 3.1 3.1
Plant Discharge
WAS Centrifuge
Number of centrifuges none 4 4 4 4 4 4 4
Polymer dose lb/dry ton 2 2 2 2 2 2 2
Capacity per centrifuge gpm 60 60 60 60 60 60 60
TSS removal efficiency % 95 95 95 95 95 95 95

Page 30 of 32
Process/Loading Units
Existing Average
Flow
Existing Max
Monthly
Existing Peak Hour MM1 PHF1 MM2 PHF2
Soluble BOD concentration in centrate
mg/L 30 30 30 30 30 30 30
Thickened sludge TSS concentration
% 3 3 3 3 3.5 3 3.5
NH4 generation (liquid) % 0 0 0 0 0 0 0
NH4 generation (solid) % 0 0 0 0 0 0 0
NH4 oxidation (liquid) % 0 0 0 0 0 0 0
NH4 oxidation (solid) % 0 0 0 0 0 0 0
TON denitrification (liquid) % 0 0 0 0 0 0 0
TON denitrification (solid) % 50 50 50 50 50 50 50
Percent PO4 precipitated % 0 0 0 0 0 0 0
Percent excess P released % 0 0 0 0 0 0 0
Minimum P in VSS % 2.5 2.5 2.5 2.5 2.5 2.5 2.5
Polymer usage lb/d 2.899 3.931 6.106 6.101 7.351 6.878 8.697
Total installed capacity gpm 240 240 240 240 240 240 240
Firm installed capacity gpm 180 180 180 180 180 180 180
Flow to centrifuge gpm 24.52 38.21 48.93 44.88 38.8 45.3 39.45
TSS load to centrifuge lb/d 2,899 3,931 6,106 6,101 7,351 6,878 8,697
Operating time required at firm hr/week 22.88 35.66 45.67 41.89 36.21 42.28 36.82
Operating time required with one centrifuge
hr/week 68.64 107 137 125.7 108.6 126.8 110.5
Average return flow gpm 16.87 27.85 32.83 28.79 22.18 27.17 19.8
Return flow BOD mg/L 208.4 178.1 228.2 260.1 383 309 495.1
Primary Anaerobic Digesters
Number of digesters none 3 3 3 3 3 3 3
Diameter ft 80 80 80 80 80 80 80
Depth ft 30 30 30 30 30 30 30
Digester volume (total) 1000 cu ft 452.4 452.4 452.4 452.4 452.4 452.4 452.4
Digester volume (total) Mgal 3.384 3.384 3.384 3.384 3.384 3.384 3.384
Detention time days 52.83 37.3 13.96 27.26 8.82 26.59 8.714
Percentage of VSS destroyed during digestion
% 40 40 40 40 40 40 40
Organic loading rate lb BOD/1000 cu ft/d
14.84 20.2 36.27 29.38 59.37 29.89 60.11

Page 31 of 32
Process/Loading Units
Existing Average
Flow
Existing Max
Monthly
Existing Peak Hour MM1 PHF1 MM2 PHF2
Total gas produced cu ft 54,770 88,280 284,000 129,600 472,500 133,100 477,400
Supernatant flow (percent of influent)
% 0 0 0 0 0 0 0
Percent NH4 removed % 0 0 0 0 0 0 0
Percent oP precipitated % 10 10 10 10 10 10 10
Minimum P in VSS % 1.5 1.5 1.5 1.5 1.5 1.5 1.5
Alkalinity generated lb Alk/lb N 3.57 3.57 3.57 3.57 3.57 3.57 3.57
Methane produced cu ft 35,600 57,380 184,600 84,270 307,100 86,510 310,300
Solids loading rate lb VSS/1000 cu ft/d
20.18 32.52 104.6 47.76 174.1 49.04 175.9
Secondary Anaerobic Digester
Number of digesters none 1 1 1 1 1 1 1
Diameter ft 75 75 75 75 75 75 75
Depth ft 25 25 25 25 25 25 25
Digester volume (total) 1000 cu ft 110.4 110.4 110.4 110.4 110.4 110.4 110.4
Digester volume (total) Mgal 0.8261 0.8261 0.8261 0.8261 0.8261 0.8261 0.8261
Detention time days 12.9 9.107 3.409 6.656 2.153 6.493 2.127
Percentage of VSS destroyed during digestion
% 5 5 5 5 5 5 5
Organic loading rate lb BOD/1000 cu ft/d
38.44 52.52 132.4 70.14 208.7 71.76 211.6
Total gas produced cu ft 4,108 6,621 21,300 9,723 35,430 9,982 35,810
Supernatant flow (percent of influent)
% 0 0 0 0 0 0 0
Percent NH4 removed % 0 0 0 0 0 0 0
Percent oP precipitated % 10 10 10 10 10 10 10
Minimum P in VSS % 1.5 1.5 1.5 1.5 1.5 1.5 1.5
Alkalinity generated lb Alk/lb N 3.57 3.57 3.57 3.57 3.57 3.57 3.57
Methane produced cu ft 2,670 4,304 13,850 6,320 23,030 6,489 23,280
Solids loading rate lb VSS/1000 cu ft/d
49.59 79.93 257.1 117.4 427.8 120.5 432.3
Belt Filter Press
Number of belt press units none 2 2 2 2 2 2 2

Page 32 of 32
Process/Loading Units
Existing Average
Flow
Existing Max
Monthly
Existing Peak Hour MM1 PHF1 MM2 PHF2
Belt width per unit m 2 2 2 2 2 2 2
Soluble BOD concentration in overflow stream
mg/L 20 20 20 20 20 20 20
Flow capacity per unit gpm 98 98 98 98 98 98 98
Percentage TSS removed from influent stream
% 95 95 95 95 95 95 95
Dewatered sludge TSS concentration
% 18.2 18.2 18.2 18.2 18.2 18.2 18.2
Polymer dose lb/dry ton 25 25 25 25 25 25 25
Polymer usage lb/d 162.3 220.4 549.3 293.1 864.1 299.8 876.6
Liquid denitrification % 10 10 10 10 10 10 10
Solid denitrification % 10 10 10 10 10 10 10
Phosphate release (% of organic-P in)
% 0 0 0 0 0 0 0
Washwater flow (instantaneous)
gpm 100 100 100 100 100 100 100
Total installed capacity gpm 196 196 196 196 196 196 196
Firm installed capacity gpm 98 98 98 98 98 98 98
Average flow to belt filter gpm 44.48 63 168.3 86.19 266.4 88.36 269.7
Average TSS load to belt press
lb/d 12,990 17,630 43,940 23,450 69,130 23,980 70,130
Operating time required at firm hr/week 76.26 108 288.5 147.8 456.7 151.5 462.3
Operating time required with one belt
hr/week 76.26 108 288.5 147.8 456.7 151.5 462.3
Average return flow gpm 84.23 119.6 320.9 164 508.2 168.1 514.4
Average return flow BOD mg/L 201.8 193.4 180.3 187.9 179.2 187.5 179.6
Average return flow NH4 mg/L 359.7 378.3 279.8 409.5 288.3 410.4 289.9
Hydraulic loading per meter gpm/m 22.24 31.5 84.15 43.1 133.2 44.18 134.8
Solids loading per meter lb/d/m 6,493 8,817 21,970 11,720 34,560 11,990 35,060
Solids to Compost

APPENDIX F
APPENDIX F
APPENDIX F
ETC KHLORAGEN INFORMATION

Electrolytic Technologies Corporation ____________________________________________________________________________________
Date: December 9, 2008 Proposal No. 081211 Customer: Texarkana, TX Attention: Lee Cronister Reference/Application: On-Site Chlorine Generation – 1,000 ppd Dear Mr. Cronister, ETC is pleased to provide the following quotation for the Texarkana South Regional WWTP project, per your request. ETC specializes in the manufacture of electrochemical chlor-alkali systems that bring value to customers through savings in installation, operation and life cycle maintenance. All systems are supplied in factory manufactured modules, pre-piped and pre-wired to maximum extent to facilitate cost effective installation and operability. The attached proposal provides the base price of the system and any packaged options or alternative scope of supply. Additional data pertaining to our Klorigen technology and detailed descriptions of major components is included as addendums. Thank you for your time, consideration and interest in ETC. We take great pride in the design and performance of our equipment and the success of our customers. We will contact you to verify that you received this quotation and to answer any questions that you may have. We respectfully ask for your business and value the trust that it represents. Sincerely, Electrolytic Technologies Corporation Sean Laird Sales Engineer CONFIDENTIALITY NOTICE: This document, including any attachments, contains confidential and proprietary information which is intended solely for use by the recipient for the express purpose of evaluating this proposal. The disclosure, distribution, printing, copying or any use, other than the purpose for which it is intended, of all or any part of this information is strictly prohibited without the express written consent of Electrolytic Technologies Corporation. 19597 NE 10th Avenue, North Miami Beach, FL 33179 Tel: 305 655-2755 Fax: 305655-2669
www.electrolytictech.com

Electrolytic Technologies Corporation ____________________________________________________________________________________ SCOPE OF SUPPLY Technological Approach The Klorigen™ System specified in this proposal is capable of producing up to 1,000 pounds of chlorine equivalent per day, based on 24-hour operation at 100% system capacity. A 15% NaOH co-product will also be produced at the rate of approximately 780 gallons per day. The system is designed for operation at the full daily hypochlorite output or any increment from 10% to 100% of designed capacity. The chemical and brine tanks specified in this proposal are sufficient for a minimum of 7 days storage at the 100% production rate. For detailed technical and process information, see Addendum A. System Description Klorigen™ Systems generate elemental chlorine gas and very pure sodium hydroxide on-site using a state-of-the-art membrane cell-based process. During normal operation, chlorine (Cl2) gas is produced in the anolyte compartments of the electrolyzers and sodium hydroxide (with hydrogen gas) is produced in the catholyte compartments. Sodium hydroxide will be produced as a 15% solution. A small amount of caustic is mixed with the chlorine gas that was stripped from the brine solution to produce a small stream of 12.5% sodium hypochlorite. The byproduct hydrogen co-produced in the catholyte compartments of the electrolyzers is immediately and safely diluted with ambient air to 2% v/v or less in concentration and is safely vented to the atmosphere. The system proposed herein comprises a complete process package starting with feed salt handling through final product discharge and if applicable, storage. Deliverables to be supplied by Electrolytic Technologies Corporation ETC will provide equipment and instruments per the attached equipment and instruments more fully described in the Addendums and as follows:
a. Qty 4: Electrolyzers
b. Qty 1: Hydrogen Dilution Blower Module
c. Qty 1: Brine Treatment Unit
d. Qty 1: Stripper/Conversion Unit
e. Qty 1: Transformer/Rectifier
f. Qty 1: Master Control Panel/Motor Control Center
g. Qty 1: Brine Dissolver, 35 ton capacity
h. Qty 1: Hydrochloric Acid Tank, 150 gallons capacity
i. Qty 1: Sodium Bisulfite Tank, 150 gallons capacity
j. Qty 1: 50% Caustic Storage Tank, 150 gallons capacity
k. Qty 10: Man-days of Technical Support for commissioning and training
l. Qty 2: Sets of technical training documentation in electronic format
PRICE for the above 1,000 gpd system: $702,000.00 (FOB Texarkana, TX)

Electrolytic Technologies Corporation ____________________________________________________________________________________ Items not included in this proposal
• Chemicals used during the commissioning phase and during post-commissioning operation;
• Interconnecting piping and wiring between Klorigen modules and customer supplied equipment;
• Distribution or circuit protection equipment feeding power to ETC supplied equipment; • Hypochlorite/Sodium hydroxide storage; • Provision of suitable air/cooling water; • Insulation or heat tracing (if needed); • Taxes and permits; • Installation
Delivery Schedule Delivery of the Klorigen system proposed herein will be approximately 12 weeks following receipt of all approved drawings from Customer. Validity Period: Quoted prices are firm for thirty (30) days from the date of this proposal and are subject to change after that time. Payment terms Unless specified otherwise, progressive payments shall be as follows:
10% Paid with order; 20% Upon submittal of drawings; 25% Upon Drawing Approval and Release for procurement / fabrication; 40% At the time of shipment; 5% At the completion of commissioning or 90 days after shipment, whichever occurs first All payments shall be by bank wire transfer to an account designated by ETC.

Electrolytic Technologies Corporation ____________________________________________________________________________________ GENERAL CLARIFICATIONS AND EXCEPTIONS Unless otherwise specified, the following conditions and exceptions apply. Customer Responsibilities 1. All material & labor for interconnecting piping outside of battery limits. 2. All material & labor for interconnecting electrical and control connections outside of battery limits. 3. All receiving, offloading and rigging of skids and systems. 4. All required utilities to and from the battery limits of the system(s), e. g. 480VAC/60Hz and 120VAC/60Hz electrical
power supply, 120 psi clean instrument air supply, clean potable water supply, etc. 5. Supply of all required utilities during the installation, start-up and subsequent operation of the ETC supplied
equipment, e. g. 480VAC/60Hz and 120VAC/60Hz electrical power supply, 120 psi clean instrument air supply, potable water supply, etc.
8. Preparation of all foundations for housing the equipment including but not limited to civil, concrete work, etc. 9. Secondary containment (unless stated otherwise): individual tanks, equipment and or piping to meet local codes &
standards. 10. All labor & materials associated with chemicals and consumables required for startup, testing and operations of the
system. 11. Payment of all applicable sales, use and excise taxes. 12. All required permits for testing, design and construction associated with this project. 13. All labor and material required for storage of materials at site, if required. 14. Provide access to the site and a safe work environment for ETC representatives. General 1. Regulatory or other government permits are the responsibility of others. 2. The ETC hourly labor rate for “time and materials” work will be determined as outlined in ETC’s standard terms and
conditions. 3. Should ETC through its performance of work under this contract, identify conditions or scope not previously known or
specified in the contract documents (including but not limited to site conditions, product quality, utilities, hidden or unknown circumstances which would prevent ETC from meeting its contractual obligations or creates a cost impact for ETC), then ETC shall have the right to negotiate a change order to alleviate such conditions.)
4. ETC reserves the right to supply any equipment or components required to meet contractual performance requirements, in addition to that delineated in the scope of supply herein.
5. Any additional work required to achieve and maintain the performance of the system which is outside the scope outlined will be considered by ETC and OWNER/PURCHASER to be a change condition and the scope and price will be adjusted accordingly and mutually agreed to between ETC and OWNER/CUSTOMER in writing. Where possible, estimated hours, expenses, and material costs will be provided to OWNER/CUSTOMER for approval before work is started. Where emergency situations require immediate response by ETC without time for pre-approval by OWNER/CUSTOMER, these emergency repairs will be provided according to the time and material rates in affect at the time of event. All travel expenses for work performed at the site subsequent to the installation and commissioning phases will be for the account of the OWNER/CUSTOMER.
6. Prices/Taxes: All prices quoted are payable in United States dollars and do not include taxes or duties. Sales, use, federal, state, value added, occupational and excise taxes, import or export duties and others where applicable will be the responsibility of the Purchaser. Appropriate exemption certificates or direct pay permits must be supplied by the Purchaser at the time of the purchase order issuance for tax exempt purchases. The collection and remittance of taxes related to the price herein are the responsibility of others.
7. Tax has not been included on travel or freight. 8. ETC assumes no responsibility for work performed, materials supplied or repairs made by others or for damage to
equipment due to inadequate supports, foundations, faulty related systems or controls. 9. Back charges: ETC will not accept back charges without prior written authorization. Written notification must be
provided to ETC of any potential back charge condition and such notification must be received by ETC in advance of any corrective action initiative.
10. Wage guidelines - All ETC labor is nonunion. If union labor is required, OWNER/CUSTOMER will be required to pay the additional costs for union scale wages, benefits and other associated cost overruns. ETC does not subscribe to any voluntary state or federal wage guidelines except those required by law. If required by the Purchaser, he will pay the additional costs associated for wage scales, benefits and other associated cost overruns.
11. ETC will ordinarily provide its own labor force where applicable but reserves the right to subcontract when ETC management feels it is appropriate.
12. ETC has not included heat tracing, insulation or winterization of equipment, unless stated herein. 13. ETC has not included any on-site utilities, phone, electric or office space expenses. 14. Costs for utilities and system operational supplies will be for the account(s) of others. 15. Rigging and equipment offloading at installation site is not included in the scope of work herein. 16. ETC has not included any mandatory reporting, sampling, testing, or analytical analyses of influent or effluent water
at the installation site. Such services shall be the responsibility of others. 17. Equipment decontamination and associated sampling is the responsibility of others. 18. Secondary containment, if required will be supplied by others. 19. If ETC has provided pricing for installation of the Klorigen equipment, supply of utilities and process piping to the
system battery limits is the responsibility of others. This includes influent streams, effluent piping, electrical power,

Electrolytic Technologies Corporation ____________________________________________________________________________________
drains, chemicals etc. ETC will install within the battery limits of the equipment and all interconnection piping and electrical.
20. ETC has not provided as part of this proposal, P.E. certified drawings or seismic calculations and ETC makes no claims to meeting any seismic design or equipment codes if the specifications did not identify such seismic need. Any special regulatory requirements shall be identified in advance of contract execution.
21. Trade permits for mechanical and electrical installation are not included. 22. The design, supply of material, installation and management of the collection, transfer, storage of water and
wastewater before and after the ETC-supplied equipment is the responsibility of others. 23. ETC has not included any costs for the operation of the system but can provide pricing if required. 24. ETC Terms and Conditions are included as part of this proposal. 25. ETC packaging methodology: skid-mounted equipment and any selected options are supplied pre-piped and pre-
wired to the fullest extent possible (within shipping restrictions and or limitations) to facilitate ease of installation. Delays that occur through no fault of ETC and which delay downstream event(s) or payments, may be subject to price adjustment. Freight: Unless specifically included in the proposal, all applicable freight charges and freight insurance are for the Purchaser’s account. Freight will be billed as an extra expense, either “prepay and add” or “collect”. Freight is FOB supplier or our plant. Charges: Excess or special packaging, packing, shipping, transportation or other charges resulting from compliance with Purchaser’s request, with respect to the use of any agency or method of transportation or any item routing other than that which would otherwise be designated by ETC, shall be for Purchaser’s account. Shipment and Delivery: Unless a firm delivery date is stated on the face hereof, shipment dates are approximate and delivery made within a reasonable time thereof shall be deemed full performance of this aspect of ETC’s obligations hereunder. ETC will exert all possible effort to meet proposed shipping dates, but will not be liable for delay caused by reason of war, civil commotion, strike, fire, accident, “Acts of God”, governmental order or regulation, shortage or curtailment of material, or any other contingency beyond its reasonable control; nor will any such delay be cause for cancellation or penalty. ETC shall not be liable for consequential damages as a result of any delay. Prices / Taxes: All prices quoted are payable in United States dollars and do not include taxes or duties. Sales, uses, federal, state, value added, occupational and excise taxes, import or export duties, and the like where applicable, will be the responsibility of the Purchaser. Appropriate exemption certificates or direct pay permits must be supplied by the Purchaser at the time of the purchase order issuance for tax exempt purchases. The collection and remittance of taxes are the responsibility of others. Cancellation Charges: ETC will invoice the Purchaser at the following rates: 20% of the contract total price or for time and materials whichever is higher. The time and material charge will be calculated on net cost for materials, subcontractors, equipment and supplies less any allowance for returned goods (including freight, handling, storage, return costs and restocking charges) marked up by the factor of 1.5 for administration expenses, handling and reasonable anticipated profits. ETC direct labor (fabrication, engineering and trades) will be billed at our published rates for work completed through the date of cancellation. Warranty: Refer to Addendum G, herein. Performance - If the equipment furnished by ETC does not meet stated performance guarantees, the Purchaser agrees to advise ETC promptly and to permit ETC to make such inspections and tests as ETC deems necessary. If equipment is at fault, ETC reserves the right to make such alteration, changes or additions as it deems necessary to meet the guarantee. If any equipment or performance failure is determined by ETC to be due to the Purchaser’s incorrect installation or operation or addition of third-party supplied peripheral equipment, the Purchaser agrees to pay ETC the then current daily rate for the time expended by the investigating technical representative, together with travel and living costs. If the problem is due to a change in the raw water or influent characteristics from those determined in the water analysis on which the proposal was based, or failure to supply salt of suitable quality as specified herein, or due to other operational conditions not attributable to ETC, the Purchaser will pay for repair or replacement of any failed components and or purchase and install any additional or other equipment needed to meet such changed circumstances, otherwise the performance guarantees will be void. The guarantees furnished with this proposal are in lieu of all other warranties and guarantees, express or implied including without limitation, warranties of merchantability and fitness for a particular purpose and in no event shall ETC be liable for consequential damages. Drawings: Proposal pages, catalogs, illustrations, schematics and other preliminary drawings are submitted only to show general layout and approximate dimensions. ETC reserves the right to make such changes of design, construction or layout as it feels may represent improvements in practice over the specifications contained in the proposal. Fully dimensioned drawings of the equipment, certified if required, will be furnished after the Purchaser’s acceptance of this proposal. The Purchaser will furnish drawings of all foundations, supports, concrete reinforcements and required housings or other drawings based upon ETC’s equipment drawings. The Purchaser’s drawings must be final and subject to ETC’s approval as they relate to the installation of ETC supplied equipment. Drawings and all information contained thereon is and shall remain the property of ETC as an instrument of professional service. All disclosed technology remains the

Electrolytic Technologies Corporation ____________________________________________________________________________________ property of ETC. This information shall not be used in whole or in part without the full knowledge and prior written consent of ETC. Title: Title to equipment covered by this proposal shall not pass to the Purchaser upon delivery, but shall remain vested in ETC regardless of the manner in which it is attached to the reality until the entire purchase price is paid. However, the Purchaser agrees to take proper care of the equipment, and insure it for its full value against loss or damage with loss payable to ETC as its interest may appear. The Purchaser assumes all risk of loss or damage from time of acceptance of shipment by transporting carrier unless otherwise expressly provided in this proposal. Default: In the event of Purchaser’s breach of this contract, or upon the Purchaser’s failure to make payment of the purchase price, or any part thereof when due, the entire unpaid balance, shall - at ETC’s option, become immediately due and payable without notice. ETC may thereupon, without process of law, enter upon the Purchaser’s premises and take possession, disconnect and remove the equipment and retain all previous payments as compensation for the use of the equipment, and ETC shall have no liability for damages arising out of repossession of the equipment. If ETC must use legal means to collect funds due ETC under this agreement, then Purchaser agrees to pay all reasonable attorney fees. Purchaser’s Labor and Materials: Subject to any exceptions specified herein or in any supplemental written agreement between the Purchaser and ETC, the Purchaser will supply all labor, supervision, materials and interconnection piping except that which is integral with each unit from inlet to outlet or within “battery limits”, as may be applicable. ETC assumes no responsibility for work done, materials supplied or repairs made by others, or for damage to equipment due to inadequate supports, foundations, faulty related systems or controls or improper connections. Installation / Start-up Supervision: When ordered separately or as part of this contract, ETC will furnish experienced supervision personnel to advise the Purchaser on installation and/or start up of the equipment. Unless expressly provided, the price for such service in not included in the purchase price. When quoted as part of this proposal or in a supplemental proposal, the quotation shall be made on the basis of the then current daily charge for such services, plus actual travel and living expenses from North Miami Beach, Florida to the Purchaser’s location and return. Supervisory services preclude manual labor and all materials normally furnished as part of the installation and start-up activities and/or to remedy work performed (by others) deemed incomplete or defective. The Purchaser agrees to have the equipment ready for the supervision service and to pay additional charges when the equipment or necessary labor is not ready or available. The Purchaser must give ETC at least two (2) weeks notice to have a technical engineer on the job site by a specific date. The Purchaser agrees that this contract will be fully performed by ETC at the conclusion of a satisfactory starting date in accordance with the terms of acceptance delineated in Addendum E, attached herein. Shortages: All claims for shortages must be made by the Purchaser within five (5) days after receipt of shipment, otherwise such claims are deemed waived. Indemnity: The products furnished by ETC hereunder are sold or supplied without warranty against property damage or injuries resulting from their use. The Purchaser indemnifies and holds ETC, its employees, licenses, franchises, and agents harmless from and against any loss, cost, liability, claims, suits damage or injury resulting from the design or use or misuse of the products. Tool Rental: ETC supplies all normal hand tools to complete normal installation requirements. If any tools or equipment are required outside the scope of our normal inventory, we will charge cost plus 25%. Applicable Law: These terms and conditions shall be governed by and constructed in accordance with the laws of the State of Florida, excluding rules relating to choice or confines of law. Back Charges: ETC will not accept back charges without prior written authorization. Written notification must be provided to ETC of potential back charge condition and that notification must be in advance of any corrective action initiative.
Agreement: This proposal, when accepted by the Purchaser within the time specified, shall constitute the entire agreement between Electrolytic Technologies Corporation (ETC) and the Purchaser. No modifications or changes shall be binding on ETC unless they are in submitted in writing and approved by an officer or duly designated employee of ETC. Any subcontract or purchase order submitted by the Purchaser with respect to this proposal shall be subject to ETC’s acceptance and shall be deemed to include the Conditions of Sale and all provisions of this proposal; any provisions of the purchase order inconsistent therewith shall be null and void.

Electrolytic Technologies Corporation ____________________________________________________________________________________
ADDENDUM A. Klorigen™ Process
The ETC Klorigen System generates chlorine and sodium hydroxide on-site using a state of the art membrane cell based process. Chlorine (Cl2) gas produced in the anolyte compartments of the electrolyzers and sodium hydroxide (with hydrogen gas) produced in the catholyte compartments are reacted together in a separate conversion module to continuously produce sodium hypochlorite (NaOCl). The hypochlorite product concentration range is adjustable between 5 and 12.5 trade % (50 to 125 gm/L as NaOCl). The byproduct hydrogen co-produced in the catholyte compartments of the electrolyzers is immediately diluted with air to 2% v/v or less in concentration and is safely vented to the atmosphere. The sodium hypochlorite meets the stringent quality requirements for drinking water treatment and complies with NSF/ANSI 60.
1. Brine System The Klorigen process typically uses a food grade salt (Morton Culinox® 999 or equivalent) that is shipped by truck and pneumatically loaded into a specially designed salt holding/dissolving tank called a “briner”. In the briner, the solid salt is slowly dissolved using softened water to produce a saturated salt solution. The saturated salt solution is then pumped into the brine treatment module to remove hardness impurities from the salt solution so it can be converted to chlorine and NaOH in the electrolyzers. In larger systems, it is more economical to use a lower grade of salt (vacuum or solar) followed by a chemical treatment step with filtration to precipitate hardness (Ca, Mg, Sr, Ba) and sulfates depending on the quality of the salt. The chemicals employed in this chemical treatment step are NaOH, sodium carbonate, and calcium chloride. The resultant sludge is disposed of in a landfill. The chemical treatment generally reduces the soluble hardness concentration of the brine to about 2 ppm as Ca. 2. Brine Softening Treatment The saturated brine solution from the briner is then fed into a brine softening system located on the brine treatment module. A special chelating ion exchange resin is used to reduce the hardness in the saturated brine to a 20 ppb of Ca hardness equivalent or less. The unit consists of a set of twin brine softener units to remove Ca, Mg, Ba, and Sr. The special chelating resin used is the Bayer Lewatit TP208, Purolite S940, or equivalent. The requirements for proper resin operation are a brine pH of 10 and a temperature between 52 – 60oC. The ion exchange columns require 7% HCl and 4% NaOH for the periodic regeneration of the resin columns to remove the accumulated Ca and Mg. The regeneration period depends on the amount of brine passed through the columns, the brine Ca hardness, and the volume of the resin in the softener units. The purified, finished brine (20 ppb or less Ca) from the ion exchange columns is then sent into a finished brine storage tank in the larger systems. The finished brine storage tank is sized to provide enough purified brine to operate the electrolyzers for a period of 8 – 24 hours or more at full plant capacity. In addition, ETC also provides an option in the installation for an on-line Tytronics hardness analyzer that can monitor the brine hardness leaving the brine softeners as well as the finished brine going to the electrolyzers to ensure that there are no process hardness upsets in the brine system. 3. Softened Water The Klorigen system is designed to use softened water (0.2 ppm hardness or less) for preparing the saturated feed brine solution and for the electrolyzer catholyte system for NaOH concentration dilution control. The Kinetico (or equal) twin alternating softeners specified herein are simple to operate and require only salt solution for regeneration. The units are regenerated automatically. The salt used for regeneration depends on the water quality.

Electrolytic Technologies Corporation ____________________________________________________________________________________ 4. Electrolyzer Module Details ETC has its own proprietary electrolyzer design and is fabricated in the USA. The electrolyzer uses catalytic coated titanium anodes from Electrode Corporation and 316L SS cathodes. The cells are designed for use with DuPont Nafion 324 membranes. Cooling water is used to cool the electrolyzer anolyte loop to keep electrolyzer temperatures below 80oC. 5. Membranes Special cation ion exchange membranes are used to separate the anode reaction (chlorine generation) from the cathode reaction (caustic and hydrogen). ETC typically employs DuPont Nafion 324 membranes in the electrolyzers. These are perfluorinated sulfonic acid based membranes which tolerate chlorine and as well system process upsets and potential hardness “excursions” in the brine feed to the electrolyzers. Selected membranes such as Asahi Flemion membranes and others can also be specified or substituted for the Nafion membranes. 6. Anodes & Cathodes The electrolyzer employs long life DSA anodes with an EC521 coating on titanium from Electrode Corporation and 316L SS cathode. The anode coating life is dependant on brine quality, operating current density, and other operational factors. The advantage of using 316L SS cathodes in place of nickel cathodes is reduced contamination of the NaOH with Ni during electrolyzer shutdowns. Each electrolyzer module has an anolyte and catholyte tank. The anolyte loop has a titanium heat exchanger that uses cooling water to keep the circulating electrolyzer anolyte solution in the electrolyzers the optimum temperature. The catholyte tank collects the 18% NaOH produced from the electrolyzers. The finished brine solution (310 gm/L) is fed to the anolyte side of the electrolyzers where chlorine is produced. The chlorine is educted from the anolyte tank under negative pressure. The negative pressure is generated from a pump-operated eductor in the hypochlorite module. The depleted anolyte brine (210 - 220 gm/L) from the electrolyzers contains dissolved chlorine. It is then sent to the chlorine stripper module for de-chlorination and pH adjustment, and is recycled back to the briner for re-saturation. 7. Electrolyzer Anode Reactions The major anode reaction is the two-electron transfer oxidation of the chloride ion as in reaction (1) as follows: (1) 2Cl- ---> Cl2 + 2e- The major competing anodic side reaction is the electrolysis of water, forming byproduct oxygen gas and hydrogen ions as given in reaction (2): (2) 2H2O ---> O2 + 4H+ + 4e- The other inefficiency reaction in the anode compartment is the formation of NaClO3. This reaction is caused by the back migration of NaOH through the membrane. (3) 3Cl2 + 6NaOH < --- > NaClO3 + 5NaCl + 3H2O The chlorate formed in this reaction must be purged from the brine loop. Alternatively it can be destroyed by reacting a side stream with HCl, reducing the NaClO3 back to Cl2. Chlorine hydrolyzes in water in the anolyte compartment to form HOCl (hypochlorous acid) and HCl (hydrochloric acid as shown in equation (3): (4) 2Cl2 + H2O <---> HOCl + HCl The pH of the anolyte solution is between 3 and 5. In this pH range, there is an equilibrium between HOCl and chlorine gas. The solubility of the gaseous chlorine in the anolyte is about 1 to 3 gpl depending on the solution temperature. In the Klorigen electrolyzer module headers, the solution volume is such that the total amount of chlorine in the system is only 3 lbs or less.

Electrolytic Technologies Corporation ____________________________________________________________________________________ 8. Electrolyzer Cathode Reactions The reaction occurring at the cell cathode is the reduction of water, producing hydrogen gas (H2) and hydroxide ions (OH-) as in reaction (5): (5) 2H2O + 2e- ---> H2 + 2OH- Sodium ions (Na+) in the anode compartment migrate across the cation membrane to the cathode compartment. Each sodium ion carries with it about 3.5 molecules of water. The sodium ions and hydroxyl ions (OH-) form NaOH in the cathode compartment. Softened water is metered into the compartment to dilute and control the concentration of caustic soda in the cathode compartment at about 15%. The caustic soda concentration can be varied between 5 – 20 wt% depending on the amount of soft water that is added. The caustic soda concentration determines the sodium hypochlorite strength in the hypochlorite conversion module. The hydrogen gas produced is separated from the sodium hydroxide in the caustic head tank and is safely diluted with air to well below the explosive limits. Dual installed air blowers provide the dilution air. The installed spare blower turns on automatically in the event of failure of the operating blower. 9. Depleted Brine De-chlorination The depleted brine (210 - 220 gm/L NaCl) from the electrolyzers, which contains dissolved chlorine, is sent to the chlorine stripper tank on the hypo conversion module. 32% HCl is added to the stripper tank to reduce the pH to about 2. The acidified solution is circulated with a pump, part of the solution going to the stripper packed tower. A regenerative blower is used to pass air counter-current to the solution in order to strip the chlorine. The air stream, containing chlorine, is passed to the hypochlorite tower where it reacts with NaOH to produce bleach. The chlorine-stripped solution is pumped to the depleted brine storage tank, located on the hypochlorite conversion module.. The chlorine-stripped brine is adjusted to a pH of 10 with NaOH. Sodium bisulfite is added under ORP control to destroy residual chlorine left in the solution. The de-chlorinated brine is then recycled back to the briner for re-saturation. If the system does not use a chlorate destruction module, then a portion of the depleted brine is purged to sewer to control the sodium chlorate (NaClO3) concentration in the brine to a concentration of 30 gm/L or less.

Electrolytic Technologies Corporation ____________________________________________________________________________________
ADDENDUM B.
Equipment Description
A. Electrolyzer Module and Electrolyzers The purpose of the electrolyzer module is to supply the brine solution to the electrolyzers and remove the chlorine and caustic being produced. The electrolyzers are piped to common horizontal headers. Each Electrolyzer will be comprised of up to eight individual cells. Liquid level, temperature, pressure and density parameters are controlled by instrumentation located on the Electrolyzer Module.
B. Receiver Unit incorporating Blower Module The purpose of the blower module is to supply dilution air to reduce the discharged hydrogen to below the LEL. The blower module consists of two blowers (one is a standby blower) discharging into a common header. The blower motors are controlled by the PLC logic located in the central control panel. The blower piping is fitted with a flow sensor to assure that air is flowing at all times. Should the operating blower fail, the second blower would start within two seconds. A shutdown of the entire Klorigen system would occur if airflow is not detected.
C. Brine Softener Module The purpose of the brine purification module is to assure that the brine solution entering the electrolyzers is of a low hardness and is the proper pH. The brine purification module consists of two rubber-lined pressure vessels that contain high selectivity cation exchange resin beds. After adjustment of temperature and pH to optimum values, the brine is directed down flow to each of these columns in series in order to remove Ca/Mg impurities to a level of 20 ppb (part per billion) to ensure good performance of the membrane electrolyzers. The two columns are arranged in series flow so that any “break through” of hardness is captured in the second column, ensuring the integrity of the process. Regeneration of the spent ion exchange resin is done automatically in place with sequential addition of rinse water, HCl, Caustic Soda and Brine. The entire chemical regeneration process is controlled automatically by a dedicated microprocessor. The flow to the regenerated column is then redirected so that the freshly regenerated column is placed in a secondary flow position in the series arrangement. This design ensures that the feed brine to the electrolyzers always sees freshly regenerated resin as just before entry to the electrolyzers.
D. Chlorine Stripper Module The purpose of the stripper module is to remove the chlorine gas dissolved in the brine
solution. The stripped brine solution is then returned via the purification module to the electrolyzer module. A small amount of the caustic soda being produced is mixed with the chlorine gas that was stripped from the brine solution to form a small stream of 12.5% sodium hypochlorite. The module is fitted with pumps, tanks, piping, pH and ORP controls.
E. Transformer/Rectifier The rectifier feeds direct current to the electrolyzers located on the electrolyzer module. (Changing the current delivered to the electrolyzers changes the amount of chlorine and caustic being produced and ultimately the hypochlorite production. There is a direct relationship between the DC electrical current and chlorine production. The master control panel controls the rectifiers and adjustment of the current can be made manually or automatically.
F. Master Control Panel The control panel contains the imbedded logic controller that manages the entire
Klorigen system when in the automatic mode. The panel also contains selector switches that allows for manual operation of each piece of equipment. When the control system is in the automatic mode, initiating the start command will allow the system to ramp up to a predetermined production level.

Electrolytic Technologies Corporation ____________________________________________________________________________________ G. Motor Control Center
The MCC houses the motor starters (motor controllers) which supplies electrical power to the electric motors driving the pumps and blowers. Feeder breakers supplying other electrical loads are also located in the MCC. The master control panel controls the motor starters.
H. Brine Dissolver/Storage Tank The brine dissolver provides the saturated brine solution, which is pumped to the brine treatment unit and on to the electrolyzers. The tank will be supplied with automatic water level control and a brine transfer pump.
I. Finished Brine Storage Vessel Rotationally molded of linear high density polyethylene; a high quality, chemically resistant plastic with high stress crack and impact resistance. Service: Vessel is designed for storage of brine, specific gravity 1.9, ambient temperature, atmospheric pressure, seismic zone 1, and outdoor installation.
J. Hydrochloric Acid Tank The acid tank supplies the brine purification units for the regeneration process and the stripper units for brine Ph control.
K. Sodium Bisulfite Tank The sodium bisulfite tank supplies solution to the stripper units to de-chlorinate the stripped brine prior to it returning to the electrolyzer modules.
Technical Support Factory-trained technicians will be made available for installation support. Tasks to be performed as “Installation support” shall include supervision of the physical installation by Customer supplied personnel, interconnection of Klorigen components and final checkout and startup of the installed system. In addition, technical support shall include on-site and/or classroom training, which shall encompass fundamental and “hands-on” instruction in the operation, maintenance, troubleshooting and repair of the system. Additional time in excess of that included in the proposal shall be provided at rates current at time of request.
Documentation and Submittals 1. P&IDs
2. General Arrangement Drawings
3. Equipment literature
4. Operation and Maintenance Manual
5. Instructions for mechanical operation of equipment
6. Manufacturers’ literature
7. Process and electrical drawings
8. Factory Acceptance Tests to validate equipment functions according to process description
and agreed performance criteria (in accordance with Addendum E, herein).

Electrolytic Technologies Corporation ____________________________________________________________________________________ Materials of Construction
Process Contents
Pipe Materials and Gaskets Used on
Modules Gaskets Piping
Isolation Valves
Specialty Valves and Comments
Brine, Hot Brine, Finished Brine, Depleted Brine (pH 10)
TEG* CPVC CPVC w/EPDM o-rings
Depleted Brine (pH 10) TEG* CPVC CPVC w/Viton o-rings
PTFE Diaphragm valve in a specific process location
Depleted Chlorinated Brine (anolyte to chlorine stripper tank, chlorine stripper tank loop)
TEG* CPVC PTFE Diaphragm valve and CPVC w/ Viton O-rings
PTFE Diaphragm valves
Chlorine Gas – operated under negative pressure
TEG* CPVC CPVC w/ Viton O-rings
PTFE Diaphragm valves
Caustic Head and Intermediate Tanks (Electrolyzer module)
TEG* CPVC
P-72
CPVC w/EPDM o-rings
Polypropylene is used for the electrolyzer system caustic head and intermediate tanks
32% HCl TEG* and 1/2” FEP Tubing
CPVC CPVC w/Viton o-rings
FEP Tubing used for the metering pumps
Softened Water TEG* CPVC/PVC CPVC w/EPDM o-rings
Inlet water lines may be PVC with PVC valves and EPDM gaskets
Electrolyzer Module Vent (caustic tank)
TEG* CPVC/PVC none PVC to outside
Conversion Module Vent (hypo tower)
TEG* CPVC/PVC none PVC to outside
Sodium Hypochlorite TEG* CPVC CPVC w/Viton O-rings
Ball valves are vented
Sodium Bisulfite TEG* and 1/2” FEP Tubing
CPVC 3/8” FEP Tubing
CPVC w/Viton O-rings
FEP Tubing used for the metering pumps

Electrolytic Technologies Corporation ____________________________________________________________________________________ TEG* - Teflon Envelope Gasket (PTFE with a 1/8” EPDM gasket backing is the main gasket material. Potable water and some other input streams may have EPDM gaskets without the PTFE envelope. Piping, Module Construction, Connections and Gaskets: All of the ETC piping is constructed of NSF 61 approved schedule 80 CPVC and PVC. CPVC is the major construction material for piping. The piping uses flanged and union connections with a minimum of threaded connections. The Caustic head tanks on the electrolyzer modules are constructed of polypropylene. The fittings are either fusion bonded or welded. The piping section connections are cemented (glued) with manufacturer approved cement (for Corzan brand CPVC and PVC) – IPS Weld On CPVC 724 and Weld On PVC 717 cements. In addition, ETC does a thermal back weld of all of the cemented joints and connections in the system to reduce the possibility of solution leakage. ETC utilizes “TEG”s – Teflon Envelope Gaskets with a 1/8” EPDM rubber gasket backing - in the flanged connections. The Teflon envelope provides the chemical resistance to all of the chemicals used in the process.

Electrolytic Technologies Corporation ____________________________________________________________________________________
ADDENDUM C. Utilities, Chemical Requirements and Process Flows
Table C.1 depicts the utility requirements for the full 1,000 PPD chlorine facility capacity.
Table C.1 Utility Requirements
Utility Type Quantity at Specified Rate 1,000 PPD
Cooling water for: Anolyte heat exchanger
Cooling tower, 30oC
(85oF), 60 psig
20 GPM
Emergency eductor water, OR
Emergency caustic scrubber
Cooling or potable water @ 60 psig
No water needed
15 – 25 GPM Capacity
Needs no water
Potable water For feed water to softeners, and ion
exchange columns,
1,405 GPD At 60 psig
Instrument air Compressed air, dry -40oF dew point
5 CFM at 120 psig
Table C.2 provides information on the chemical requirements of the system at a total facility level.
Table C.2 Chemical Requirements
Chemical Type Quantity at Specified Rate 1,000 PPD
NaCl (100% basis) For electrolyzer operation 1,664 lb/day
NaCl (100% basis) For water softeners 16 lb/day NaCl (100% Basis) Brine purge for chlorate
control 133 lb/day
32% HCl
Food grade, for brine de-chlorination, ion exchange column regeneration, and chlorate destruction system
17 GPD
38 – 40% Sodium Bisulfite Solution
Food grade quality 8 GPD
Additional Brine Treatment Chemicals If Needed To Treat Low Quality Salt Feedstock
Na2CO3 (Sodium Carbonate)
Brine Chemical Treatment
NaOH Brine Chemical Treatment
CaCl2 Calcium Chloride) Brine Chemical Treatment
Chemical Quantity
Depends on Brine Quality

Electrolytic Technologies Corporation ____________________________________________________________________________________ Table C.3 provides information on the system effluents of the system on a total facility level.
Table C.3 System Effluents
Chemical Type Quantity at Specified Rate 1,000 PPD
Hydrogen Vent (total)
Diluted hydrogen in air, 2% H2 v/v or less at maximum
production rate, continuous
180 CFM
System Brine Purge (If No Chlorate Destruction
System is Installed)
NaCl (100%) NaClO3 (100%)
Solution Volume
133 lb/day 16 lb/day 80 GPD
Brine Ion Exchange Column Regeneration
(Per regeneration)
7% HCl 4% NaOH
Brine Water
40 gal 77 gal 48 gal 85 gal
Bi-weekly

Electrolytic Technologies Corporation ____________________________________________________________________________________ Electrical Requirements - Rectifier AC service requirement per 1,000 PPD chlorine system. Table C.4 Electrical Characteristics and Requirements
Electrolyzer Model Number EL-800-MK2 Configuration: 7 Cells per Electrolyzer Operating Current Density: 3.19 kA/m2 at full rate
Klorigen Hypo Typical Product Range 5 to 12.5 trade % Sodium Hypochlorite (50 to 125 gm/L NaOCl)
Control Power V/Ph/Hz/Amps 480/1/60/60
Number of Rectifiers One
Rectifier Manufacture - Model
Zinex Rectifier (Oil Cooled) or Darrah Electric – 700-130/160-480-3-SCR (Air Cooled)
Rectifier Input: V/Ph/Hz/Amps 480/3/60/75
Rectifier Output: VDC Maximum Tap Maximum Amperage
595 amps 150 Volts DC 700 Amps DC
Rated Output 1,000 GPD of chlorine equivalent, 780 GPD of 15% NaOH
Process Control Type Allen Bradley SLC500 DH+, Automation Direct Modem
Water Softeners Kinetico, Commercial Series Model, Dual Column Softener
Brine Softener System
ETC, One system, Two columns, Chelating ion exchange resin: Bayer Lewatit TP208 or Purolite S940.
Brine Maker (Briner) Plastanks Bryneer or similar – specification number, and sizes dependent on specific installation or in ground briner pits.
Salt Quality Morton Culinox 999 or equivalent OR vacuum or solar salt which needs chemical pretreatment for hardness
Other Chemical Requirements 32% HCl, 40% Sodium Bisulfite and additionally Na2CO3, NaOH, and CaCl2 for brine chemical treatment if required for low purity salt feedstock.
Table C.5 Electrolyzer Amperage Requirements 1,000 gpd system # of cells per electrolyzer 7 # of electrolyzers per system 4 Cell Voltage 4 Volts per DC circuit 112 Amps per DC circuit 595 DC circuit Kilowatts 67 AC input voltage 480 Total number of rectifiers 1 Total Rectifier AC input amperage 95 Total Service Amps required 119
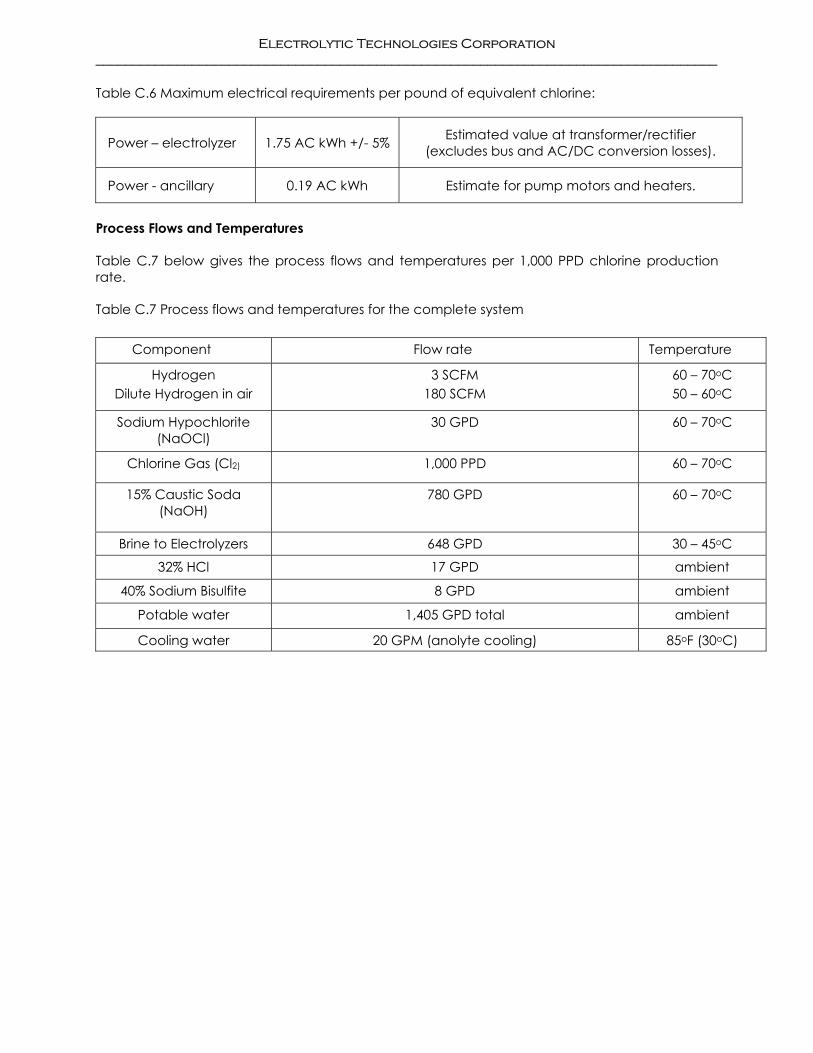
Electrolytic Technologies Corporation ____________________________________________________________________________________ Table C.6 Maximum electrical requirements per pound of equivalent chlorine:
Power – electrolyzer 1.75 AC kWh +/- 5% Estimated value at transformer/rectifier (excludes bus and AC/DC conversion losses).
Power - ancillary 0.19 AC kWh Estimate for pump motors and heaters.
Process Flows and Temperatures Table C.7 below gives the process flows and temperatures per 1,000 PPD chlorine production rate.
Table C.7 Process flows and temperatures for the complete system
Component Flow rate Temperature
Hydrogen Dilute Hydrogen in air
3 SCFM 180 SCFM
60 – 70oC 50 – 60oC
Sodium Hypochlorite (NaOCl)
30 GPD 60 – 70oC
Chlorine Gas (Cl2) 1,000 PPD 60 – 70oC
15% Caustic Soda (NaOH)
780 GPD 60 – 70oC
Brine to Electrolyzers 648 GPD 30 – 45oC
32% HCl 17 GPD ambient
40% Sodium Bisulfite 8 GPD ambient
Potable water 1,405 GPD total ambient
Cooling water 20 GPM (anolyte cooling) 85oF (30oC)

Electrolytic Technologies Corporation ____________________________________________________________________________________
ADDENDUM D. Klorigen™ On-site Sodium Hypochlorite/Chlorine Process Flow Diagram
BrinerTank
Sof tWater
NaClSolid Sof t
Water32%HCl
15%NaOH
Brine Head Tank NaOH Head Tank
Air(Hy drogen
DilutionBlower)
Air DilutedHy drogen
Anoly teTank
Catholy teTank15%
NaOH
BrineDechlorination
Tank
BrineChlorineStripper
Tank
CityWater
Water Softener PackagePotableWater
Chlorinein
Water
Eductor
Eductor
Hy poTower &
Tank
Air(ChlorineStripperBlower)
15%NaOH
BrineSof tener
IonExchangeColumns
WaterRinse
ToDrain
BrineRinse
ToDrain
NaOHRinse
ToDrain
HClRinse
ToDrain
Sof tWater
BrineRecircTank
Salt orBrine
BrineRinse
ToDrain
Sof t WaterTo Various
ProcessPoints
HeatExchanger
CoolingWater
38%Bisulf ite
Electroly zers
H2&
NaOH
Cl2&
Brine
Air and Cl2
VentTo Air
Na+H2O
OH-
Anoly te Catholy te
Mem
bran
e
WaterRinse
ToDrain
In Out
32%HCl
Depleted Brine Recy cle to Brine Tank
Sof tWater
50%NaOH
Additional NaOHRequired For90 - 100%Productionas Bleach
Brine
Sof t Water For Process Process Or PotableWater
EmergencyChlorineEductor Chlorine
inWater
Emergency Chlorine Eductor System
HeatExchanger
CoolingWater
In OutChlorate DestructSystem Option32% HCl
Cl2 To HypoSystem
Regeneration Chemicals
15%CausticMake-up
Brine Purge (Sulfate)
Chlorine Gas
Chlorine Gas ToHypochlorite Production
12.5%Bleach(NaOCl)
Chlorine Gas User Option(For Water Treatment)
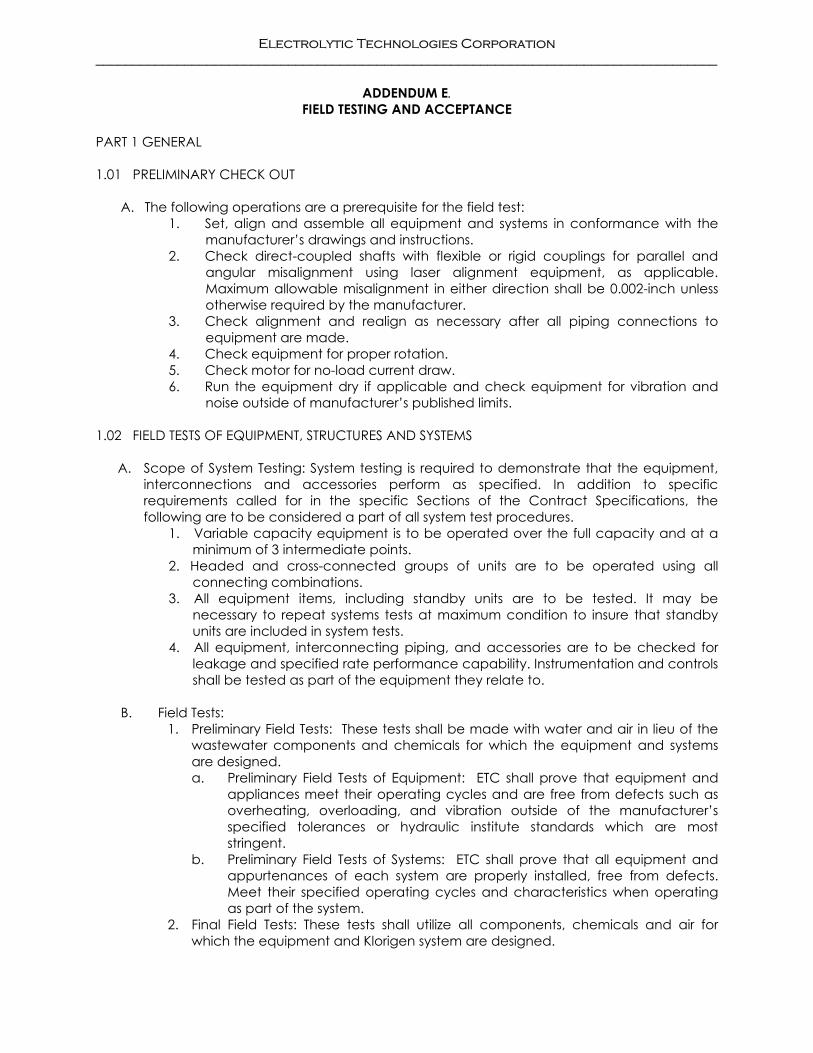
Electrolytic Technologies Corporation ____________________________________________________________________________________
ADDENDUM E. FIELD TESTING AND ACCEPTANCE
PART 1 GENERAL 1.01 PRELIMINARY CHECK OUT
A. The following operations are a prerequisite for the field test: 1. Set, align and assemble all equipment and systems in conformance with the
manufacturer’s drawings and instructions. 2. Check direct-coupled shafts with flexible or rigid couplings for parallel and
angular misalignment using laser alignment equipment, as applicable. Maximum allowable misalignment in either direction shall be 0.002-inch unless otherwise required by the manufacturer.
3. Check alignment and realign as necessary after all piping connections to equipment are made.
4. Check equipment for proper rotation. 5. Check motor for no-load current draw. 6. Run the equipment dry if applicable and check equipment for vibration and
noise outside of manufacturer’s published limits. 1.02 FIELD TESTS OF EQUIPMENT, STRUCTURES AND SYSTEMS A. Scope of System Testing: System testing is required to demonstrate that the equipment,
interconnections and accessories perform as specified. In addition to specific requirements called for in the specific Sections of the Contract Specifications, the following are to be considered a part of all system test procedures.
1. Variable capacity equipment is to be operated over the full capacity and at a minimum of 3 intermediate points.
2. Headed and cross-connected groups of units are to be operated using all connecting combinations.
3. All equipment items, including standby units are to be tested. It may be necessary to repeat systems tests at maximum condition to insure that standby units are included in system tests.
4. All equipment, interconnecting piping, and accessories are to be checked for leakage and specified rate performance capability. Instrumentation and controls shall be tested as part of the equipment they relate to.
B. Field Tests:
1. Preliminary Field Tests: These tests shall be made with water and air in lieu of the wastewater components and chemicals for which the equipment and systems are designed. a. Preliminary Field Tests of Equipment: ETC shall prove that equipment and
appliances meet their operating cycles and are free from defects such as overheating, overloading, and vibration outside of the manufacturer’s specified tolerances or hydraulic institute standards which are most stringent.
b. Preliminary Field Tests of Systems: ETC shall prove that all equipment and appurtenances of each system are properly installed, free from defects. Meet their specified operating cycles and characteristics when operating as part of the system.
2. Final Field Tests: These tests shall utilize all components, chemicals and air for which the equipment and Klorigen system are designed.

Electrolytic Technologies Corporation ____________________________________________________________________________________
a. Final Field Tests of Equipment: Shall prove that equipment and appliances meet their operating cycles and are free from defects such as overheating, overloading and undue vibration.
b. Final Field Tests of Systems: Shall prove that all equipment and appurtenances of each system are properly installed free from defects, meet their specified operating cycles and characteristics when operating as part of the system.
c. Operate the equipment as a unit with all related piping, valves, ducting, electrical controls, instrumentation and mechanical operation.
3. ETC’s Responsibilities
a. Prepare and submit testing schedule. b. Prepare and submit Test Procedures and Manpower Schedule for all
equipment items and systems. c. Coordinate with customer and/or Owner representative. d. Furnish all labor, unskilled and skilled, necessary for testing. e. Ensure the presence of all manufacturers’ representative(s). f. Provide lubricants, fuel and chemical as required for testing. g. Conduct tests. h. Prepare and submit Test Reports.
4. Customers Responsibilities
a. Review and approve Testing Schedules. b Review and approve Test Procedures c. Witness all tests. d. Certify Test results e. Review Test Reports f. Approve Test results. g. Provide power, water and other process materials, plant and instrument air,
as required for testing performance. h. Provide personnel as required for training.
5. Conduct of Tests: ETC shall conduct the tests and be responsible for all
operational decisions associated with the system. 6. Presence of ETC’s Representative(s): This is a prerequisite for the tests. No test shall
be performed in the absence of the ETC’s Representative, who shall ensure availability for the entire duration of the test.
7. Field Test Reports: Test report forms will be prepared by the customers Engineer for
the preliminary and final tests. These forms shall be used by the ETC’s Representative for data recording and notes during the tests. When the tests have been completed and accepted by the Engineer, the ETC’s Representative shall sign the Test Report; the witnessing Engineer will initial the report and take it with him/her foe an analysis of the test data.
PART 2 - EXECUTION 2.01 PRELIMINARY FIELD TESTS A. Preliminary Field Tests of Equipment: A successful test shall consist of at least one
continuous hour, or longer if so specified, of trouble free operation. B. Preliminary Field Tests of System:

Electrolytic Technologies Corporation ____________________________________________________________________________________
1. Test all systems by operating the systems equipment together as a unit with all related piping, valves, electrical controls and mechanical operations.
2. For a successful test, run each system with water and air trouble free for four continuous hours.
2.02 FINAL FIELD TESTS AND ACCEPTANCE A. Final Field Tests of Equipment or Individuals Subsystems: A successful test shall consist
of at least 24 continuous hours of trouble free operation. B. Final Field Tests of the System: Test all systems by operating the equipment as a
complete unit inclusive of all related piping, valves, ducting, electrical controls, instrumentation and mechanical operation. For a successful test, the Klorigen system shall run trouble free for a minimum of three (3) consecutive days, during which at least 24 continuous hours shall be at maximum designed capacity.
C. Acceptance: Completion of operations in accordance with Section 2.02,
paragraphs A. and B. above shall be sufficient for release of any and all outstanding funds held by customer or customer’s bank and due ETC. Deficiencies associated with work conducted by others shall not prevent release of outstanding funds due ETC.

Electrolytic Technologies Corporation ____________________________________________________________________________________
ADDENDUM F SALT SPECIFICATIONS
Suitable salt procurement is the responsibility of others. Morton Culinox® 999 has the required purity, as depicted below. Pre-treatment to establish brine purity of equal or better quality will be the sole responsibility of the end-user. Deviation from these specifications may void manufacturer’s warranty. Culinox® 999® Food Grade Salt is high purity, food grade granulated sodium chloride produced in vacuum pans from chemically purified brine. The crystals are cubic in structure. Brine treatment, crystallizing technique, and post-crystallizing washing substantially reduce calcium, magnesium, iron, copper and other heavy metals, sulfate and carbonate impurities. High purity helps assure consistent saltiness intensity, and there are stringent standards on visible, insoluble extraneous material. There are no additives. TFC 999® Salt is prepared by adding a trace of Yellow Prussiate of Soda (Sodium Ferrocyanide), a water soluble anti-caking agent used in accordance with 21 CFR Sec. 172.490 is not recommended.
Chemical Properties Sodium sulfate is major impurity with traces of calcium carbonate and magnesium hydroxide. Complies to Food Chemicals Codex tolerances and federal GMP standards. Typical Maximum 1Sodium Chloride (%) 99.98 >99.95 Sulfate (%) 0.01 <0.02 Ca/Mg as Ca (ppm) 12.00 <60*
Insolubles (ppm) - <20.0
Moisture (%) - <0.1
Copper (ppm) 0.00 <0.2
Iron (ppm) Free 0.2 <0.7 2Complexed 1.1 <2.3 3Sodium Ferrocyanide (ppm) 6.0 <13.0
1 By difference of impurities, moisture-free basis (ASTM procedures). 2 Contributed by sodium ferrocyanide (18% Fe). 3 Used in TFC 999 only. *<30 ppm for chemical grade.
Nutrient Content (per 100g) Ash (g) >99.9 Magnesium (mg) nil Calcium (mg) 2.0 Potassium (mg) 3
Chloride (g) 60.6 Sodium (g) 39.3
Iodine (µg) <100.0 Moisture (g) <0.1

Electrolytic Technologies Corporation ____________________________________________________________________________________
ADDENDUM G. STANDARD WARRANTY
Electrolytic Technologies Corporation (ETC) warrants the equipment of its manufacture to be free from defects in workmanship and materials. ETC also warrants that when installed and operated according to ETC’s written instructions, equipment and components will perform as specified for the following period of time: System—Guaranteed for a period of eighteen (18) months from date of shipment or one year from first date of operation, whichever first occurs. “System” includes transformer/rectifier, piping, valves, motors, peripheral monitoring and salt handling equipment. Components not included in the above interval include:
• Anodes - Guaranteed for a period of five (5) years of operation, they will be replaced on a straight-line pro-rata basis. Replacements shall be warranted for two (2) years thereafter on a straight-line pro-rata basis.
• Membrane - Guaranteed for a period of two (2) years of operation and replaced on a straight-line pro-rata basis. Replacements shall be warranted for one (1) year thereafter on a straight-line pro-rata basis.
• Operating supplies and consumables – such as filter elements, pH and ORP probes, replaceable fuses, testing chemicals, gaskets, seals and sealants used during normal course of operation and maintenance.
Where equipment sold hereunder is used with attachments and/or modifications that were not recommended by, or have not been approved by ETC in writing, such use shall not be considered normal and said warranty shall not apply. ETC’s liability is limited to the supply or repair of defective parts returned, freight prepaid by buyer, to a location specified by ETC. Repaired parts shall be returned to buyer free on board (f.o.b.) shipping point. On-site labor shall be the responsibility of the buyer. When circumstances permit, ETC will invoke for the benefit of the buyer, the guarantee or warranty of ETC’s vendor for equipment or materials furnished but not manufactured by ETC. This warranty does not extend to, and ETC assumes no liability for, consequential and/or secondary damages or losses of any kind sustained directly or indirectly as a result of a defect in any equipment, material or installation. ETC shall in no event be liable in an amount exceeding the purchase price of the equipment. ETC makes no warranties regarding equipment manufactured by it or others (including without limitation, warranties as to merchantability and fitness for a purpose), either expressed or implied, except as provided herein. The foregoing shall constitute the exclusive remedies of purchaser for any breach by seller of its warranties herein. Disclaimer of Warranties Electrolytic Technologies Corporation shall not under any circumstances be liable for any incidental or consequential damages arising from loss, damage to property, personal injury or other damage or losses owing to the failure of ETC’s products. The liability of Electrolytic Technologies Corporation is limited as set forth above to the cost of repair or replacement of defective products within the time period set forth above. This warranty is made in lieu of all other warranties, either express or implied, whether of fitness for a particular purpose or merchantability, whether oral or written. 0AItem}………………………………………………………………………………...……$ …………………………………………………………………...……$ -

Klorigen Operating Cost Analysis
1 0.75 0.5Chlorine daily capacity 1,000 lbs 750 lbs 500 lbs
Maximum daily operating costsSalt 0.070$ 126.00$ 94.50$ 63.00$ Water 0.001$ 0.95$ 0.71$ 0.48$ Power 0.045$ 81.00$ 60.75$ 40.50$ 38% Bisulfite 1.660$ 11.62$ 8.72$ 5.81$ 32% HCL 1.090$ 18.53$ 13.90$ 9.27$ Maintenance 0.045$ 45.00$ 33.75$ 22.50$ Total daily operating costs 283.10$ 212.33$ 141.55$
Cost per lb of chlorine including NaOH 0.28$ lb 0.28$ lb 0.28$ lb
Sodium Hydroxide CreditSodium Hydroxide Produced ( NaOH basis) 7,521.33 lbs 5,641.00 lbs 3,760.67 lbsValue of Sodium hydroxide / lb solution (15%) * 0.075$ 564.10$ 423.08$ 282.05$
Cost of chlorine per day (281.00)$ (210.75)$ (140.50)$ Cost of chlorine per pound after NaOH credit (0.281)$ lb (0.281)$ lb (0.281)$ lb
or (562.00)$ per ton Cl
*NaOH value: 1000 $/ton 100% NaOH
Salt 1.8 lbs per lb chlorinePower 1.8 Kwh per lb chlorine
100% Capacity 75% Capacity 50% Capacity
Operating Rates:
1/21/2009

Klorigen Operating Cost Analysis
Water 0.95 gal per lb chlorine
Chemical Consumptions Factor
32% HCl 0.017 lb chlorine38% Na2SO3 0.007 lb chlorine
1/21/2009


Electrolytic Technologies Corporation ____________________________________________________________________________________
Date: December 16, 2008 Proposal No. 081221 Customer: Texarkana, TX Attention: Lee Cronister Reference/Application: On-Site Sodium Hypochlorite Generation – 1,000 gpd Dear Mr. Cronister, ETC is pleased to provide the following quotation for the Texarkana South Regional WWTP project, per your request. ETC specializes in the manufacture of electrochemical chlor-alkali systems that bring value to customers through savings in installation, operation and life cycle maintenance. All systems are supplied in factory manufactured modules, pre-piped and pre-wired to maximum extent to facilitate cost effective installation and operability. The attached proposal provides the base price of the system and any packaged options or alternative scope of supply. Additional data pertaining to our Klorigen technology and detailed descriptions of major components is included as addendums. Thank you for your time, consideration and interest in ETC. We take great pride in the design and performance of our equipment and the success of our customers. We will contact you to verify that you received this quotation and to answer any questions that you may have. We respectfully ask for your business and value the trust that it represents. Sincerely, Electrolytic Technologies Corporation Sean Laird Sales Engineer CONFIDENTIALITY NOTICE: This document, including any attachments, contains confidential and proprietary information which is intended solely for use by the recipient for the express purpose of evaluating this proposal. The disclosure, distribution, printing, copying or any use, other than the purpose for which it is intended, of all or any part of this information is strictly prohibited without the express written consent of Electrolytic Technologies Corporation. 19597 NE 10th Avenue, North Miami Beach, FL 33179 Tel: 305 655-2755 Fax: 305655-2669
www.electrolytictech.com

Electrolytic Technologies Corporation ____________________________________________________________________________________ SCOPE OF SUPPLY Technological Approach The Klorigen™ System specified in this proposal is capable of producing up to 1,000 pounds of equivalent chlorine per day, based on 24-hour operation at 100% system capacity. System output at the full production rate will be 1,000 gallons of 12.5 trade % (125 g/L) sodium hypochlorite, for direct use or storage as necessary. The Klorigen™ system is designed for operation at the full daily output; or, any increment from 10% to 100% of designed capacity at its normal efficiencies. The chemical tanks specified in this proposal are sufficient for a minimum of seven days storage at 100% production rate. (For detailed technical and process information, see Addendum A.) System Description Klorigen™ Systems generate elemental chlorine gas and very pure sodium hydroxide on-site using a state-of-the-art membrane cell-based process. During normal operation, chlorine (Cl2) gas is produced in the anolyte compartments of the electrolyzers and sodium hydroxide (with hydrogen gas) is produced in the catholyte compartments. Sodium hydroxide will be produced as a 15% solution. A small amount of caustic is mixed with the chlorine gas that was stripped from the brine solution to produce a small stream of 12.5% sodium hypochlorite. The byproduct hydrogen co-produced in the catholyte compartments of the electrolyzers is immediately and safely diluted with ambient air to 2% v/v or less in concentration and is safely vented to the atmosphere. The system proposed herein comprises a complete process package starting with feed salt handling through final product discharge to your existing storage tank. Deliverables to be supplied by Electrolytic Technologies Corporation ETC will provide equipment and instruments per the attached equipment and instruments more fully described in the Addendums and as follows:
a. Qty 4: Electrolyzers
b. Qty 1: Hydrogen Dilution Blower Module
c. Qty 1: Brine Treatment Unit
d. Qty 1: Stripper/Conversion Unit
e. Qty 1: Transformer/Rectifier
f. Qty 1: Master Control Panel/Motor Control Center
g. Qty 1: Brine Dissolver, 35 ton capacity
h. Qty 1: Hydrochloric Acid Tank, 150 gallons capacity
i. Qty 1: Sodium Bisulfite Tank, 150 gallons capacity
j. Qty 1: 50% Caustic Storage Tank, 150 gallons capacity
k. Qty 10: Man-days of Technical Support for commissioning and training
l. Qty 2: Sets of technical training documentation in electronic format
PRICE for the above 1,000 gpd system: $702,000.00 (FOB Texarkana, TX)
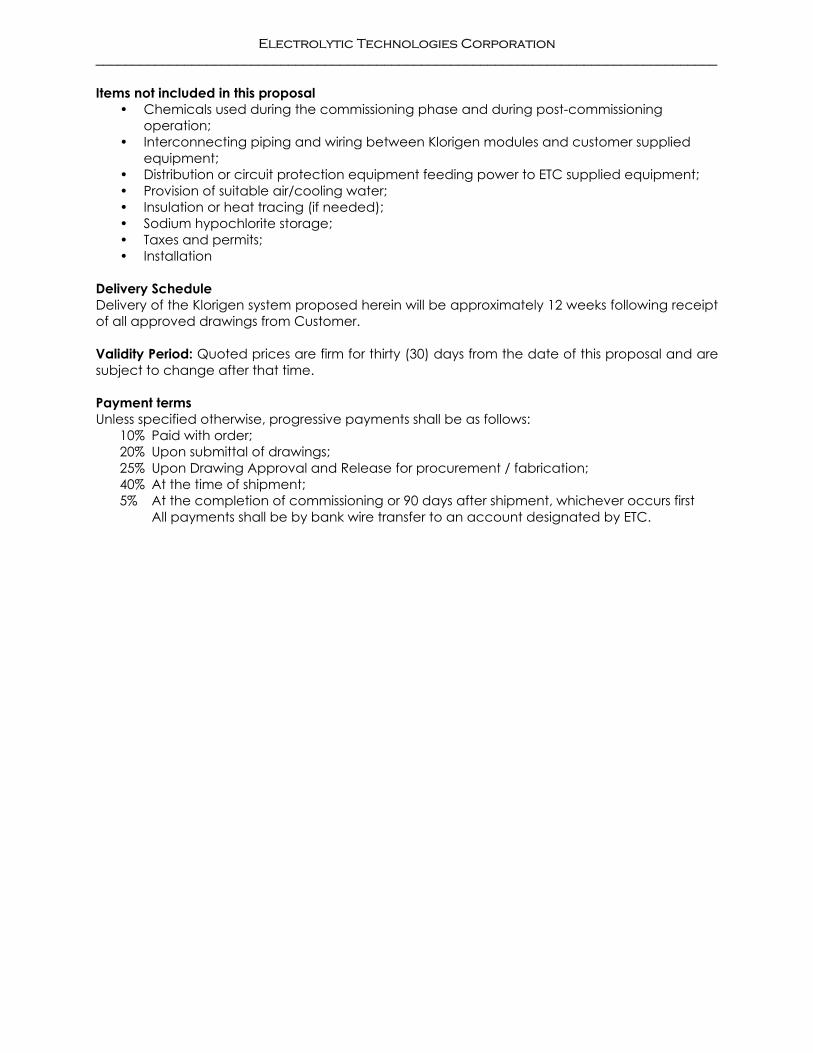
Electrolytic Technologies Corporation ____________________________________________________________________________________ Items not included in this proposal
• Chemicals used during the commissioning phase and during post-commissioning operation;
• Interconnecting piping and wiring between Klorigen modules and customer supplied equipment;
• Distribution or circuit protection equipment feeding power to ETC supplied equipment; • Provision of suitable air/cooling water; • Insulation or heat tracing (if needed); • Sodium hypochlorite storage; • Taxes and permits; • Installation
Delivery Schedule Delivery of the Klorigen system proposed herein will be approximately 12 weeks following receipt of all approved drawings from Customer. Validity Period: Quoted prices are firm for thirty (30) days from the date of this proposal and are subject to change after that time. Payment terms Unless specified otherwise, progressive payments shall be as follows:
10% Paid with order; 20% Upon submittal of drawings; 25% Upon Drawing Approval and Release for procurement / fabrication; 40% At the time of shipment; 5% At the completion of commissioning or 90 days after shipment, whichever occurs first All payments shall be by bank wire transfer to an account designated by ETC.

Electrolytic Technologies Corporation ____________________________________________________________________________________ GENERAL CLARIFICATIONS AND EXCEPTIONS Unless otherwise specified, the following conditions and exceptions apply. Customer Responsibilities 1. All material & labor for interconnecting piping outside of battery limits. 2. All material & labor for interconnecting electrical and control connections outside of battery limits. 3. All receiving, offloading and rigging of skids and systems. 4. All required utilities to and from the battery limits of the system(s), e. g. 480VAC/60Hz and 120VAC/60Hz electrical
power supply, 120 psi clean instrument air supply, clean potable water supply, etc. 5. Supply of all required utilities during the installation, start-up and subsequent operation of the ETC supplied
equipment, e. g. 480VAC/60Hz and 120VAC/60Hz electrical power supply, 120 psi clean instrument air supply, potable water supply, etc.
8. Preparation of all foundations for housing the equipment including but not limited to civil, concrete work, etc. 9. Secondary containment (unless stated otherwise): individual tanks, equipment and or piping to meet local codes &
standards. 10. All labor & materials associated with chemicals and consumables required for startup, testing and operations of the
system. 11. Payment of all applicable sales, use and excise taxes. 12. All required permits for testing, design and construction associated with this project. 13. All labor and material required for storage of materials at site, if required. 14. Provide access to the site and a safe work environment for ETC representatives. General 1. Regulatory or other government permits are the responsibility of others. 2. The ETC hourly labor rate for “time and materials” work will be determined as outlined in ETC’s standard terms and
conditions. 3. Should ETC through its performance of work under this contract, identify conditions or scope not previously known or
specified in the contract documents (including but not limited to site conditions, product quality, utilities, hidden or unknown circumstances which would prevent ETC from meeting its contractual obligations or creates a cost impact for ETC), then ETC shall have the right to negotiate a change order to alleviate such conditions.)
4. ETC reserves the right to supply any equipment or components required to meet contractual performance requirements, in addition to that delineated in the scope of supply herein.
5. Any additional work required to achieve and maintain the performance of the system which is outside the scope outlined will be considered by ETC and OWNER/PURCHASER to be a change condition and the scope and price will be adjusted accordingly and mutually agreed to between ETC and OWNER/CUSTOMER in writing. Where possible, estimated hours, expenses, and material costs will be provided to OWNER/CUSTOMER for approval before work is started. Where emergency situations require immediate response by ETC without time for pre-approval by OWNER/CUSTOMER, these emergency repairs will be provided according to the time and material rates in affect at the time of event. All travel expenses for work performed at the site subsequent to the installation and commissioning phases will be for the account of the OWNER/CUSTOMER.
6. Prices/Taxes: All prices quoted are payable in United States dollars and do not include taxes or duties. Sales, use, federal, state, value added, occupational and excise taxes, import or export duties and others where applicable will be the responsibility of the Purchaser. Appropriate exemption certificates or direct pay permits must be supplied by the Purchaser at the time of the purchase order issuance for tax exempt purchases. The collection and remittance of taxes related to the price herein are the responsibility of others.
7. Tax has not been included on travel or freight. 8. ETC assumes no responsibility for work performed, materials supplied or repairs made by others or for damage to
equipment due to inadequate supports, foundations, faulty related systems or controls. 9. Back charges: ETC will not accept back charges without prior written authorization. Written notification must be
provided to ETC of any potential back charge condition and such notification must be received by ETC in advance of any corrective action initiative.
10. Wage guidelines - All ETC labor is nonunion. If union labor is required, OWNER/CUSTOMER will be required to pay the additional costs for union scale wages, benefits and other associated cost overruns. ETC does not subscribe to any voluntary state or federal wage guidelines except those required by law. If required by the Purchaser, he will pay the additional costs associated for wage scales, benefits and other associated cost overruns.
11. ETC will ordinarily provide its own labor force where applicable but reserves the right to subcontract when ETC management feels it is appropriate.
12. ETC has not included heat tracing, insulation or winterization of equipment, unless stated herein. 13. ETC has not included any on-site utilities, phone, electric or office space expenses. 14. Costs for utilities and system operational supplies will be for the account(s) of others. 15. Rigging and equipment offloading at installation site is not included in the scope of work herein. 16. ETC has not included any mandatory reporting, sampling, testing, or analytical analyses of influent or effluent water
at the installation site. Such services shall be the responsibility of others. 17. Equipment decontamination and associated sampling is the responsibility of others. 18. Secondary containment, if required will be supplied by others. 19. If ETC has provided pricing for installation of the Klorigen equipment, supply of utilities and process piping to the
system battery limits is the responsibility of others. This includes influent streams, effluent piping, electrical power,

Electrolytic Technologies Corporation ____________________________________________________________________________________
drains, chemicals etc. ETC will install within the battery limits of the equipment and all interconnection piping and electrical.
20. ETC has not provided as part of this proposal, P.E. certified drawings or seismic calculations and ETC makes no claims to meeting any seismic design or equipment codes if the specifications did not identify such seismic need. Any special regulatory requirements shall be identified in advance of contract execution.
21. Trade permits for mechanical and electrical installation are not included. 22. The design, supply of material, installation and management of the collection, transfer, storage of water and
wastewater before and after the ETC-supplied equipment is the responsibility of others. 23. ETC has not included any costs for the operation of the system but can provide pricing if required. 24. ETC Terms and Conditions are included as part of this proposal. 25. ETC packaging methodology: skid-mounted equipment and any selected options are supplied pre-piped and pre-
wired to the fullest extent possible (within shipping restrictions and or limitations) to facilitate ease of installation. Delays that occur through no fault of ETC and which delay downstream event(s) or payments, may be subject to price adjustment. Freight: Unless specifically included in the proposal, all applicable freight charges and freight insurance are for the Purchaser’s account. Freight will be billed as an extra expense, either “prepay and add” or “collect”. Freight is FOB supplier or our plant. Charges: Excess or special packaging, packing, shipping, transportation or other charges resulting from compliance with Purchaser’s request, with respect to the use of any agency or method of transportation or any item routing other than that which would otherwise be designated by ETC, shall be for Purchaser’s account. Shipment and Delivery: Unless a firm delivery date is stated on the face hereof, shipment dates are approximate and delivery made within a reasonable time thereof shall be deemed full performance of this aspect of ETC’s obligations hereunder. ETC will exert all possible effort to meet proposed shipping dates, but will not be liable for delay caused by reason of war, civil commotion, strike, fire, accident, “Acts of God”, governmental order or regulation, shortage or curtailment of material, or any other contingency beyond its reasonable control; nor will any such delay be cause for cancellation or penalty. ETC shall not be liable for consequential damages as a result of any delay. Prices / Taxes: All prices quoted are payable in United States dollars and do not include taxes or duties. Sales, uses, federal, state, value added, occupational and excise taxes, import or export duties, and the like where applicable, will be the responsibility of the Purchaser. Appropriate exemption certificates or direct pay permits must be supplied by the Purchaser at the time of the purchase order issuance for tax exempt purchases. The collection and remittance of taxes are the responsibility of others. Cancellation Charges: ETC will invoice the Purchaser at the following rates: 20% of the contract total price or for time and materials whichever is higher. The time and material charge will be calculated on net cost for materials, subcontractors, equipment and supplies less any allowance for returned goods (including freight, handling, storage, return costs and restocking charges) marked up by the factor of 1.5 for administration expenses, handling and reasonable anticipated profits. ETC direct labor (fabrication, engineering and trades) will be billed at our published rates for work completed through the date of cancellation. Warranty: Refer to Addendum G, herein. Performance - If the equipment furnished by ETC does not meet stated performance guarantees, the Purchaser agrees to advise ETC promptly and to permit ETC to make such inspections and tests as ETC deems necessary. If equipment is at fault, ETC reserves the right to make such alteration, changes or additions as it deems necessary to meet the guarantee. If any equipment or performance failure is determined by ETC to be due to the Purchaser’s incorrect installation or operation or addition of third-party supplied peripheral equipment, the Purchaser agrees to pay ETC the then current daily rate for the time expended by the investigating technical representative, together with travel and living costs. If the problem is due to a change in the raw water or influent characteristics from those determined in the water analysis on which the proposal was based, or failure to supply salt of suitable quality as specified herein, or due to other operational conditions not attributable to ETC, the Purchaser will pay for repair or replacement of any failed components and or purchase and install any additional or other equipment needed to meet such changed circumstances, otherwise the performance guarantees will be void. The guarantees furnished with this proposal are in lieu of all other warranties and guarantees, express or implied including without limitation, warranties of merchantability and fitness for a particular purpose and in no event shall ETC be liable for consequential damages. Drawings: Proposal pages, catalogs, illustrations, schematics and other preliminary drawings are submitted only to show general layout and approximate dimensions. ETC reserves the right to make such changes of design, construction or layout as it feels may represent improvements in practice over the specifications contained in the proposal. Fully dimensioned drawings of the equipment, certified if required, will be furnished after the Purchaser’s acceptance of this proposal. The Purchaser will furnish drawings of all foundations, supports, concrete reinforcements and required housings or other drawings based upon ETC’s equipment drawings. The Purchaser’s drawings must be final and subject to ETC’s approval as they relate to the installation of ETC supplied equipment. Drawings and all information contained thereon is and shall remain the property of ETC as an instrument of professional service. All disclosed technology remains the

Electrolytic Technologies Corporation ____________________________________________________________________________________ property of ETC. This information shall not be used in whole or in part without the full knowledge and prior written consent of ETC. Title: Title to equipment covered by this proposal shall not pass to the Purchaser upon delivery, but shall remain vested in ETC regardless of the manner in which it is attached to the reality until the entire purchase price is paid. However, the Purchaser agrees to take proper care of the equipment, and insure it for its full value against loss or damage with loss payable to ETC as its interest may appear. The Purchaser assumes all risk of loss or damage from time of acceptance of shipment by transporting carrier unless otherwise expressly provided in this proposal. Default: In the event of Purchaser’s breach of this contract, or upon the Purchaser’s failure to make payment of the purchase price, or any part thereof when due, the entire unpaid balance, shall - at ETC’s option, become immediately due and payable without notice. ETC may thereupon, without process of law, enter upon the Purchaser’s premises and take possession, disconnect and remove the equipment and retain all previous payments as compensation for the use of the equipment, and ETC shall have no liability for damages arising out of repossession of the equipment. If ETC must use legal means to collect funds due ETC under this agreement, then Purchaser agrees to pay all reasonable attorney fees. Purchaser’s Labor and Materials: Subject to any exceptions specified herein or in any supplemental written agreement between the Purchaser and ETC, the Purchaser will supply all labor, supervision, materials and interconnection piping except that which is integral with each unit from inlet to outlet or within “battery limits”, as may be applicable. ETC assumes no responsibility for work done, materials supplied or repairs made by others, or for damage to equipment due to inadequate supports, foundations, faulty related systems or controls or improper connections. Installation / Start-up Supervision: When ordered separately or as part of this contract, ETC will furnish experienced supervision personnel to advise the Purchaser on installation and/or start up of the equipment. Unless expressly provided, the price for such service in not included in the purchase price. When quoted as part of this proposal or in a supplemental proposal, the quotation shall be made on the basis of the then current daily charge for such services, plus actual travel and living expenses from North Miami Beach, Florida to the Purchaser’s location and return. Supervisory services preclude manual labor and all materials normally furnished as part of the installation and start-up activities and/or to remedy work performed (by others) deemed incomplete or defective. The Purchaser agrees to have the equipment ready for the supervision service and to pay additional charges when the equipment or necessary labor is not ready or available. The Purchaser must give ETC at least two (2) weeks notice to have a technical engineer on the job site by a specific date. The Purchaser agrees that this contract will be fully performed by ETC at the conclusion of a satisfactory starting date in accordance with the terms of acceptance delineated in Addendum E, attached herein. Shortages: All claims for shortages must be made by the Purchaser within five (5) days after receipt of shipment, otherwise such claims are deemed waived. Indemnity: The products furnished by ETC hereunder are sold or supplied without warranty against property damage or injuries resulting from their use. The Purchaser indemnifies and holds ETC, its employees, licenses, franchises, and agents harmless from and against any loss, cost, liability, claims, suits damage or injury resulting from the design or use or misuse of the products. Tool Rental: ETC supplies all normal hand tools to complete normal installation requirements. If any tools or equipment are required outside the scope of our normal inventory, we will charge cost plus 25%. Applicable Law: These terms and conditions shall be governed by and constructed in accordance with the laws of the State of Florida, excluding rules relating to choice or confines of law. Back Charges: ETC will not accept back charges without prior written authorization. Written notification must be provided to ETC of potential back charge condition and that notification must be in advance of any corrective action initiative.
Agreement: This proposal, when accepted by the Purchaser within the time specified, shall constitute the entire agreement between Electrolytic Technologies Corporation (ETC) and the Purchaser. No modifications or changes shall be binding on ETC unless they are in submitted in writing and approved by an officer or duly designated employee of ETC. Any subcontract or purchase order submitted by the Purchaser with respect to this proposal shall be subject to ETC’s acceptance and shall be deemed to include the Conditions of Sale and all provisions of this proposal; any provisions of the purchase order inconsistent therewith shall be null and void.

Electrolytic Technologies Corporation ____________________________________________________________________________________
ADDENDUM A. Klorigen™ Process
The ETC Klorigen System generates chlorine and sodium hydroxide on-site using a state of the art membrane cell based process. Chlorine (Cl2) gas produced in the anolyte compartments of the electrolyzers and sodium hydroxide (with hydrogen gas) produced in the catholyte compartments are reacted together in a separate conversion module to continuously produce sodium hypochlorite (NaOCl). The hypochlorite product concentration range is adjustable between 5 and 12.5 trade % (50 to 125 gm/L as NaOCl). The byproduct hydrogen co-produced in the catholyte compartments of the electrolyzers is immediately diluted with air to 2% v/v or less in concentration and is safely vented to the atmosphere. The sodium hypochlorite meets the stringent quality requirements for drinking water treatment and complies with NSF/ANSI 60.
1. Brine System The Klorigen process typically uses a food grade salt (Morton Culinox® 999 or equivalent) that is shipped by truck and pneumatically loaded into a specially designed salt holding/dissolving tank called a “briner”. In the briner, the solid salt is slowly dissolved using softened water to produce a saturated salt solution. The saturated salt solution is then pumped into the brine treatment module to remove hardness impurities from the salt solution so it can be converted to chlorine and NaOH in the electrolyzers. In larger systems, it is more economical to use a lower grade of salt (vacuum or solar) followed by a chemical treatment step with filtration to precipitate hardness (Ca, Mg, Sr, Ba) and sulfates depending on the quality of the salt. The chemicals employed in this chemical treatment step are NaOH, sodium carbonate, and calcium chloride. The resultant sludge is disposed of in a landfill. The chemical treatment generally reduces the soluble hardness concentration of the brine to about 2 ppm as Ca. 2. Brine Softening Treatment The saturated brine solution from the briner is then fed into a brine softening system located on the brine treatment module. A special chelating ion exchange resin is used to reduce the hardness in the saturated brine to a 20 ppb of Ca hardness equivalent or less. The unit consists of a set of twin brine softener units to remove Ca, Mg, Ba, and Sr. The special chelating resin used is the Bayer Lewatit TP208, Purolite S940, or equivalent. The requirements for proper resin operation are a brine pH of 10 and a temperature between 52 – 60oC. The ion exchange columns require 7% HCl and 4% NaOH for the periodic regeneration of the resin columns to remove the accumulated Ca and Mg. The regeneration period depends on the amount of brine passed through the columns, the brine Ca hardness, and the volume of the resin in the softener units. The purified, finished brine (20 ppb or less Ca) from the ion exchange columns is then sent into a finished brine storage tank in the larger systems. The finished brine storage tank is sized to provide enough purified brine to operate the electrolyzers for a period of 8 – 24 hours or more at full plant capacity. In addition, ETC also provides an option in the installation for an on-line Tytronics hardness analyzer that can monitor the brine hardness leaving the brine softeners as well as the finished brine going to the electrolyzers to ensure that there are no process hardness upsets in the brine system. 3. Softened Water The Klorigen system is designed to use softened water (0.2 ppm hardness or less) for preparing the saturated feed brine solution and for the electrolyzer catholyte system for NaOH concentration dilution control. The Kinetico (or equal) twin alternating softeners specified herein are simple to operate and require only salt solution for regeneration. The units are regenerated automatically. The salt used for regeneration depends on the water quality.

Electrolytic Technologies Corporation ____________________________________________________________________________________ 4. Electrolyzer Module Details ETC has its own proprietary electrolyzer design and is fabricated in the USA. The electrolyzer uses catalytic coated titanium anodes from Electrode Corporation and 316L SS cathodes. The cells are designed for use with DuPont Nafion 324 membranes. Cooling water is used to cool the electrolyzer anolyte loop to keep electrolyzer temperatures below 80oC. 5. Membranes Special cation ion exchange membranes are used to separate the anode reaction (chlorine generation) from the cathode reaction (caustic and hydrogen). ETC typically employs DuPont Nafion 324 membranes in the electrolyzers. These are perfluorinated sulfonic acid based membranes which tolerate chlorine and as well system process upsets and potential hardness “excursions” in the brine feed to the electrolyzers. Selected membranes such as Asahi Flemion membranes and others can also be specified or substituted for the Nafion membranes. 6. Anodes & Cathodes The electrolyzer employs long life DSA anodes with an EC521 coating on titanium from Electrode Corporation and 316L SS cathode. The anode coating life is dependant on brine quality, operating current density, and other operational factors. The advantage of using 316L SS cathodes in place of nickel cathodes is reduced contamination of the NaOH with Ni during electrolyzer shutdowns. Each electrolyzer module has an anolyte and catholyte tank. The anolyte loop has a titanium heat exchanger that uses cooling water to keep the circulating electrolyzer anolyte solution in the electrolyzers the optimum temperature. The catholyte tank collects the 18% NaOH produced from the electrolyzers. The finished brine solution (310 gm/L) is fed to the anolyte side of the electrolyzers where chlorine is produced. The chlorine is educted from the anolyte tank under negative pressure. The negative pressure is generated from a pump-operated eductor in the hypochlorite module. The depleted anolyte brine (210 - 220 gm/L) from the electrolyzers contains dissolved chlorine. It is then sent to the chlorine stripper module for de-chlorination and pH adjustment, and is recycled back to the briner for re-saturation. 7. Electrolyzer Anode Reactions The major anode reaction is the two-electron transfer oxidation of the chloride ion as in reaction (1) as follows: (1) 2Cl- ---> Cl2 + 2e- The major competing anodic side reaction is the electrolysis of water, forming byproduct oxygen gas and hydrogen ions as given in reaction (2): (2) 2H2O ---> O2 + 4H+ + 4e- The other inefficiency reaction in the anode compartment is the formation of NaClO3. This reaction is caused by the back migration of NaOH through the membrane. (3) 3Cl2 + 6NaOH < --- > NaClO3 + 5NaCl + 3H2O The chlorate formed in this reaction must be purged from the brine loop. Alternatively it can be destroyed by reacting a side stream with HCl, reducing the NaClO3 back to Cl2. Chlorine hydrolyzes in water in the anolyte compartment to form HOCl (hypochlorous acid) and HCl (hydrochloric acid as shown in equation (3): (4) 2Cl2 + H2O <---> HOCl + HCl The pH of the anolyte solution is between 3 and 5. In this pH range, there is an equilibrium between HOCl and chlorine gas. The solubility of the gaseous chlorine in the anolyte is about 1 to 3 gpl depending on the solution temperature. In the Klorigen electrolyzer module headers, the solution volume is such that the total amount of chlorine in the system is only 3 lbs or less.

Electrolytic Technologies Corporation ____________________________________________________________________________________ 8. Electrolyzer Cathode Reactions The reaction occurring at the cell cathode is the reduction of water, producing hydrogen gas (H2) and hydroxide ions (OH-) as in reaction (5): (5) 2H2O + 2e- ---> H2 + 2OH- Sodium ions (Na+) in the anode compartment migrate across the cation membrane to the cathode compartment. Each sodium ion carries with it about 3.5 molecules of water. The sodium ions and hydroxyl ions (OH-) form NaOH in the cathode compartment. Softened water is metered into the compartment to dilute and control the concentration of caustic soda in the cathode compartment at about 15%. The caustic soda concentration can be varied between 5 – 20 wt% depending on the amount of soft water that is added. The caustic soda concentration determines the sodium hypochlorite strength in the hypochlorite conversion module. The hydrogen gas produced is separated from the sodium hydroxide in the caustic head tank and is safely diluted with air to well below the explosive limits. Dual installed air blowers provide the dilution air. The installed spare blower turns on automatically in the event of failure of the operating blower. 9. Hypochlorite Conversion Module The hypochlorite conversion module pulls the chlorine gas generated in the electrolyzers with a vacuum of about -5 to -20 inches of water. The Cl2 reacts with a nominal 15% NaOH produced from the electrolyzers to form NaOCl. The reaction between chlorine and NaOH to form sodium hypochlorite (NaOCl) is shown in reaction (6): (6) Cl2 + 2NaOH ---> NaOCl + NaCl + H2O The concentration of the sodium hypochlorite solution is determined by the NaOH concentration. If higher strength NaOCl concentrations are required, the NaOH strength can be adjusted in the electrolyzer operation up to about 20 wt% (with a small amount of membrane efficiency loss) or by vacuum evaporating the NaOH to get the desired concentration. The hypochlorite conversion module uses a pump and eductor to provide the negative pressure to draw the chlorine gas from the electrolyzers and chlorine stripper tank into the hypochlorite module for the reaction with NaOH. The hypochlorite production is continuous, and is controlled using ORP electrodes. The sodium hypochlorite solution product is pumped to the hypochlorite storage tank on level control. A titanium plate and frame heat exchanger is used to remove the heat of reaction between the NaOH and chlorine gas. The hypochlorite heat exchanger uses cooling water to cool the reaction mixture to a temperature below 40oC. For hypochlorite concentrations of 150 gm/L and above, a chilled water supply is required for the hypochlorite module to maintain temperatures at about 20oC. 10. Depleted Brine De-chlorination The depleted brine (210 - 220 gm/L NaCl) from the electrolyzers, which contains dissolved chlorine, is sent to the chlorine stripper tank on the hypo conversion module. 32% HCl is added to the stripper tank to reduce the pH to about 2. The acidified solution is circulated with a pump, part of the solution going to the stripper packed tower. A regenerative blower is used to pass air counter-current to the solution in order to strip the chlorine. The air stream, containing chlorine, is passed to the hypochlorite tower where it reacts with NaOH to produce bleach. The chlorine-stripped solution is pumped to the depleted brine storage tank, located on the hypochlorite conversion module.. The chlorine-stripped brine is adjusted to a pH of 10 with NaOH. Sodium bisulfite is added under ORP control to destroy residual chlorine left in the solution. The de-chlorinated brine is then recycled back to the briner for re-saturation. If the system does not use a chlorate destruction module, then a portion of the depleted brine is purged to sewer to control the sodium chlorate (NaClO3) concentration in the brine to a concentration of 30 gm/L or less.
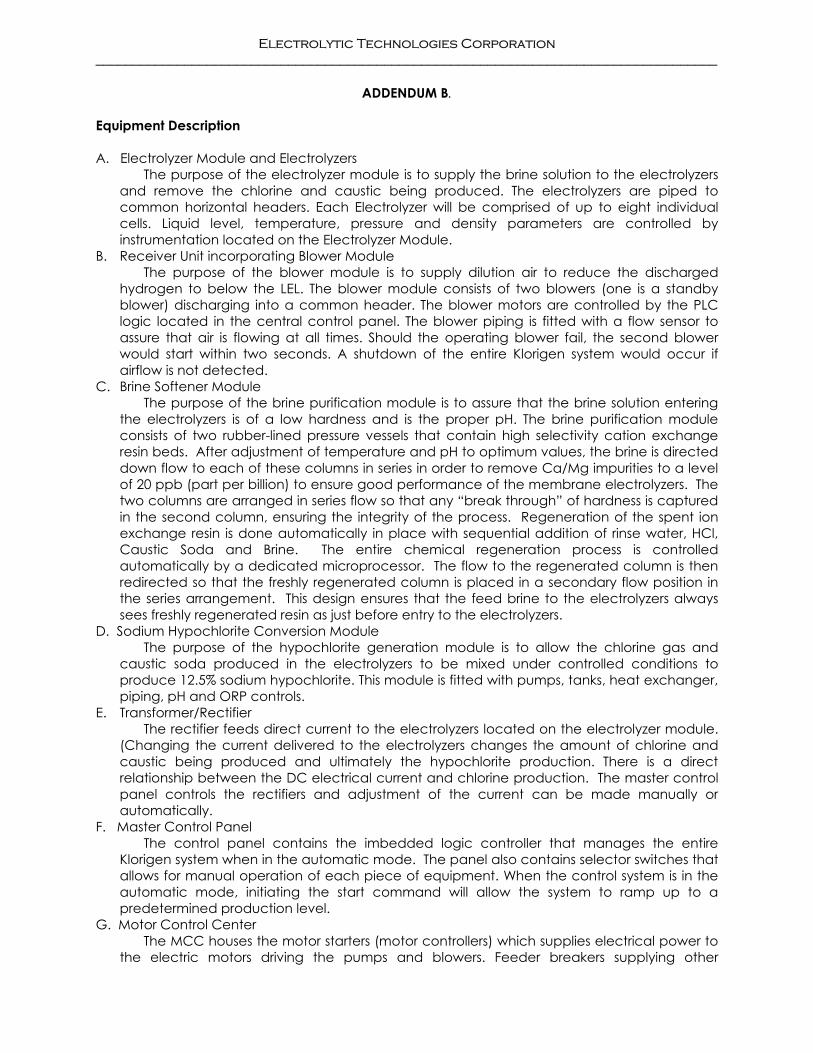
Electrolytic Technologies Corporation ____________________________________________________________________________________
ADDENDUM B.
Equipment Description
A. Electrolyzer Module and Electrolyzers The purpose of the electrolyzer module is to supply the brine solution to the electrolyzers and remove the chlorine and caustic being produced. The electrolyzers are piped to common horizontal headers. Each Electrolyzer will be comprised of up to eight individual cells. Liquid level, temperature, pressure and density parameters are controlled by instrumentation located on the Electrolyzer Module.
B. Receiver Unit incorporating Blower Module The purpose of the blower module is to supply dilution air to reduce the discharged hydrogen to below the LEL. The blower module consists of two blowers (one is a standby blower) discharging into a common header. The blower motors are controlled by the PLC logic located in the central control panel. The blower piping is fitted with a flow sensor to assure that air is flowing at all times. Should the operating blower fail, the second blower would start within two seconds. A shutdown of the entire Klorigen system would occur if airflow is not detected.
C. Brine Softener Module The purpose of the brine purification module is to assure that the brine solution entering the electrolyzers is of a low hardness and is the proper pH. The brine purification module consists of two rubber-lined pressure vessels that contain high selectivity cation exchange resin beds. After adjustment of temperature and pH to optimum values, the brine is directed down flow to each of these columns in series in order to remove Ca/Mg impurities to a level of 20 ppb (part per billion) to ensure good performance of the membrane electrolyzers. The two columns are arranged in series flow so that any “break through” of hardness is captured in the second column, ensuring the integrity of the process. Regeneration of the spent ion exchange resin is done automatically in place with sequential addition of rinse water, HCl, Caustic Soda and Brine. The entire chemical regeneration process is controlled automatically by a dedicated microprocessor. The flow to the regenerated column is then redirected so that the freshly regenerated column is placed in a secondary flow position in the series arrangement. This design ensures that the feed brine to the electrolyzers always sees freshly regenerated resin as just before entry to the electrolyzers.
D. Sodium Hypochlorite Conversion Module The purpose of the hypochlorite generation module is to allow the chlorine gas and
caustic soda produced in the electrolyzers to be mixed under controlled conditions to produce 12.5% sodium hypochlorite. This module is fitted with pumps, tanks, heat exchanger, piping, pH and ORP controls.
E. Transformer/Rectifier The rectifier feeds direct current to the electrolyzers located on the electrolyzer module. (Changing the current delivered to the electrolyzers changes the amount of chlorine and caustic being produced and ultimately the hypochlorite production. There is a direct relationship between the DC electrical current and chlorine production. The master control panel controls the rectifiers and adjustment of the current can be made manually or automatically.
F. Master Control Panel The control panel contains the imbedded logic controller that manages the entire
Klorigen system when in the automatic mode. The panel also contains selector switches that allows for manual operation of each piece of equipment. When the control system is in the automatic mode, initiating the start command will allow the system to ramp up to a predetermined production level.
G. Motor Control Center The MCC houses the motor starters (motor controllers) which supplies electrical power to the electric motors driving the pumps and blowers. Feeder breakers supplying other

Electrolytic Technologies Corporation ____________________________________________________________________________________
electrical loads are also located in the MCC. The master control panel controls the motor starters.
H. Brine Dissolver/Storage Tank The brine dissolver provides the saturated brine solution, which is pumped to the brine treatment unit and on to the electrolyzers. The tank will be supplied with automatic water level control and a brine transfer pump.
I. Finished Brine Storage Vessel Rotationally molded of linear high density polyethylene; a high quality, chemically resistant plastic with high stress crack and impact resistance. Service: Vessel is designed for storage of brine, specific gravity 1.9, ambient temperature, atmospheric pressure, seismic zone 1, and outdoor installation.
J. Hydrochloric Acid Tank The acid tank supplies the brine purification units for the regeneration process and the stripper units for brine Ph control.
K. Sodium Bisulfite Tank The sodium bisulfite tank supplies solution to the stripper units to de-chlorinate the stripped brine prior to it returning to the electrolyzer modules.
Technical Support Factory-trained technicians will be made available for installation support. Tasks to be performed as “Installation support” shall include supervision of the physical installation by Customer supplied personnel, interconnection of Klorigen components and final checkout and startup of the installed system. In addition, technical support shall include on-site and/or classroom training, which shall encompass fundamental and “hands-on” instruction in the operation, maintenance, troubleshooting and repair of the system. Additional time in excess of that included in the proposal shall be provided at rates current at time of request.
Documentation and Submittals 1. P&IDs
2. General Arrangement Drawings
3. Equipment literature
4. Operation and Maintenance Manual
5. Instructions for mechanical operation of equipment
6. Manufacturers’ literature
7. Process and electrical drawings
8. Factory Acceptance Tests to validate equipment functions according to process description
and agreed performance criteria (in accordance with Addendum E, herein).

Electrolytic Technologies Corporation ____________________________________________________________________________________ Materials of Construction
Process Contents
Pipe Materials and Gaskets Used on
Modules Gaskets Piping
Isolation Valves
Specialty Valves and Comments
Brine, Hot Brine, Finished Brine, Depleted Brine (pH 10)
TEG* CPVC CPVC w/EPDM o-rings
Depleted Brine (pH 10) TEG* CPVC CPVC w/Viton o-rings
PTFE Diaphragm valve in a specific process location
Depleted Chlorinated Brine (anolyte to chlorine stripper tank, chlorine stripper tank loop)
TEG* CPVC PTFE Diaphragm valve and CPVC w/ Viton O-rings
PTFE Diaphragm valves
Chlorine Gas – operated under negative pressure
TEG* CPVC CPVC w/ Viton O-rings
PTFE Diaphragm valves
Caustic Head and Intermediate Tanks (Electrolyzer module)
TEG* CPVC
P-72
CPVC w/EPDM o-rings
Polypropylene is used for the electrolyzer system caustic head and intermediate tanks
32% HCl TEG* and 1/2” FEP Tubing
CPVC CPVC w/Viton o-rings
FEP Tubing used for the metering pumps
Softened Water TEG* CPVC/PVC CPVC w/EPDM o-rings
Inlet water lines may be PVC with PVC valves and EPDM gaskets
Electrolyzer Module Vent (caustic tank)
TEG* CPVC/PVC none PVC to outside
Conversion Module Vent (hypo tower)
TEG* CPVC/PVC none PVC to outside
Sodium Hypochlorite TEG* CPVC CPVC w/Viton O-rings
Ball valves are vented
Sodium Bisulfite TEG* and 1/2” FEP Tubing
CPVC 3/8” FEP Tubing
CPVC w/Viton O-rings
FEP Tubing used for the metering pumps

Electrolytic Technologies Corporation ____________________________________________________________________________________ TEG* - Teflon Envelope Gasket (PTFE with a 1/8” EPDM gasket backing is the main gasket material. Potable water and some other input streams may have EPDM gaskets without the PTFE envelope. Piping, Module Construction, Connections and Gaskets: All of the ETC piping is constructed of NSF 61 approved schedule 80 CPVC and PVC. CPVC is the major construction material for piping. The piping uses flanged and union connections with a minimum of threaded connections. The Caustic head tanks on the electrolyzer modules are constructed of polypropylene. The fittings are either fusion bonded or welded. The piping section connections are cemented (glued) with manufacturer approved cement (for Corzan brand CPVC and PVC) – IPS Weld On CPVC 724 and Weld On PVC 717 cements. In addition, ETC does a thermal back weld of all of the cemented joints and connections in the system to reduce the possibility of solution leakage. ETC utilizes “TEG”s – Teflon Envelope Gaskets with a 1/8” EPDM rubber gasket backing - in the flanged connections. The Teflon envelope provides the chemical resistance to all of the chemicals used in the process.
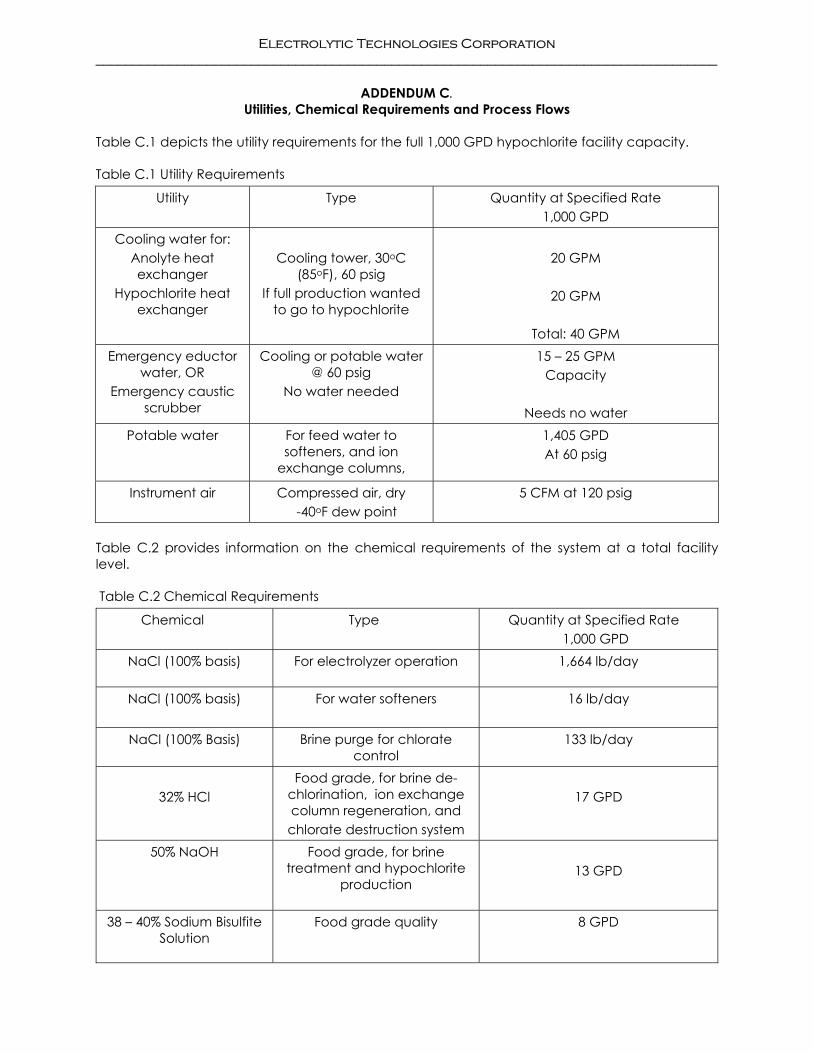
Electrolytic Technologies Corporation ____________________________________________________________________________________
ADDENDUM C. Utilities, Chemical Requirements and Process Flows
Table C.1 depicts the utility requirements for the full 1,000 GPD hypochlorite facility capacity.
Table C.1 Utility Requirements
Utility Type Quantity at Specified Rate 1,000 GPD
Cooling water for: Anolyte heat exchanger
Hypochlorite heat exchanger
Cooling tower, 30oC
(85oF), 60 psig If full production wanted
to go to hypochlorite
20 GPM
20 GPM
Total: 40 GPM
Emergency eductor water, OR
Emergency caustic scrubber
Cooling or potable water @ 60 psig
No water needed
15 – 25 GPM Capacity
Needs no water
Potable water For feed water to softeners, and ion
exchange columns,
1,405 GPD At 60 psig
Instrument air Compressed air, dry -40oF dew point
5 CFM at 120 psig
Table C.2 provides information on the chemical requirements of the system at a total facility level.
Table C.2 Chemical Requirements
Chemical Type Quantity at Specified Rate 1,000 GPD
NaCl (100% basis) For electrolyzer operation 1,664 lb/day
NaCl (100% basis) For water softeners 16 lb/day
NaCl (100% Basis) Brine purge for chlorate control
133 lb/day
32% HCl
Food grade, for brine de-chlorination, ion exchange column regeneration, and chlorate destruction system
17 GPD
50% NaOH
Food grade, for brine treatment and hypochlorite
production
13 GPD
38 – 40% Sodium Bisulfite Solution
Food grade quality 8 GPD

Electrolytic Technologies Corporation ____________________________________________________________________________________
Additional Brine Treatment Chemicals If Needed To Treat Low Quality Salt Feedstock
Na2CO3 (Sodium Carbonate)
Brine Chemical Treatment
NaOH Brine Chemical Treatment
CaCl2 Calcium Chloride) Brine Chemical Treatment
Chemical Quantity
Depends on Brine Quality
Table C.3 provides information on the system effluents on a total facility level.
Table C.3 System Effluents
Chemical Type Quantity at Specified Rate 1,000 GPD
Hydrogen Vent (total)
Diluted hydrogen in air, 2% H2 v/v or less at maximum
production rate, continuous
180 CFM
Hypochlorite Vent (total) Air from hypochlorite tower, continuous, water
saturated air
30 CFM
System Brine Purge (If No Chlorate Destruction
System is Installed)
NaCl (100%) NaClO3 (100%)
Solution Volume
133 lb/day 16 lb/day 80 GPD
Brine Ion Exchange Column Regeneration
(Per regeneration)
7% HCl 4% NaOH
Brine Water
40 gal 77 gal 48 gal 85 gal
Bi-weekly

Electrolytic Technologies Corporation ____________________________________________________________________________________ Electrical Requirements - Rectifier AC service requirement per 1,000 GPD hypochlorite system. Table C.4 Electrical Characteristics and Requirements
Table C.5 Electrolyzer Amperage Requirements 1,000 gpd system # of cells per electrolyzer 7 # of electrolyzers per system 4 Cell Voltage 4 Volts per DC circuit 112 Amps per DC circuit 595 DC circuit Kilowatts 67 AC input voltage 480 Total number of rectifiers 1 Total Rectifier AC input amperage 95 Total Service Amps required 119
Electrolyzer Model Number EL-800-MK2 Configuration: 7 Cells per Electrolyzer Operating Current Density: 3.19 kA/m2 at full rate
Klorigen Hypo Typical Product Range 5 to 12.5 trade % Sodium Hypochlorite (50 to 125 gm/L NaOCl)
Control Power V/Ph/Hz/Amps 480/1/60/60
Number of Rectifiers One
Rectifier Manufacture - Model
Zinex Rectifier (Oil Cooled) or Darrah Electric – 700-130/160-480-3-SCR (Air Cooled)
Rectifier Input: V/Ph/Hz/Amps 480/3/60/75
Rectifier Output: VDC Maximum Tap Maximum Amperage
595 amps 150 Volts DC 700 Amps DC
Rated Output 1,000 GPD of 12.5 trade % Sodium Hypochlorite equivalent
Process Control Type Allen Bradley SLC500 DH+, Automation Direct Modem
Water Softeners Samco or Kinetico, Commercial Series Model, Dual Column Softener
Brine Softener System
ETC, One system, Two columns, Chelating ion exchange resin: Bayer Lewatit TP208, Or Purolite S940.
Brine Maker (Briner) Plastanks Bryneer or similar – specification number, and sizes dependent on specific installation or in ground briner pits.
Salt Quality Morton Culinox 999 or equivalent OR vacuum or solar salt which needs chemical pretreatment for hardness
Other Chemical Requirements 32% HCl, 50% NaOH, 40% Sodium Bisulfite and additionally Na2CO3, NaOH, and CaCl2 for brine chemical treatment if required for low purity salt feedstock.

Electrolytic Technologies Corporation ____________________________________________________________________________________ Table C.6 Maximum electrical requirements per pound of equivalent chlorine:
Power – electrolyzer 1.75 AC kWh +/- 5% Estimated value at transformer/rectifier (excludes bus and AC/DC conversion losses).
Power - ancillary 0.19 AC kWh Estimate for pump motors and heaters.
Process Flows and Temperatures Table C.7 below gives the process flows and temperatures per 1,000 PPD hypochlorite production rate.
Table C.7 Process flows and temperatures for the complete system
Component Flow rate Temperature
Hydrogen Dilute Hydrogen in air
3 SCFM 180 SCFM
60 – 70oC 50 – 60oC
Sodium Hypochlorite (NaOCl)
1,000 GPD 60 – 70oC
Chlorine Gas (Cl2) 1,000 PPD (converted to sodium hypochlorite)
60 – 70oC
15% Caustic Soda (NaOH)
778 GPD (converted to sodium hypochlorite)
60 – 70oC
Brine to Electrolyzers 648 GPD 30 – 45oC
32% HCl 17 GPD ambient
50% NaOH 13 GPD ambient
40% Sodium Bisulfite 8 GPD ambient
Potable water 1,405 GPD total ambient

Electrolytic Technologies Corporation ____________________________________________________________________________________
ADDENDUM D. Klorigen™ On-site Sodium Hypochlorite/Chlorine Process Flow Diagram
BrinerTank
Sof tWater
NaClSolid Sof t
Water32%HCl
15%NaOH
Brine Head Tank NaOH Head Tank
Air(Hy drogen
DilutionBlower)
Air DilutedHy drogen
Anoly teTank
Catholy teTank15%
NaOH
BrineDechlorination
Tank
BrineChlorineStripper
Tank
CityWater
Water Softener PackagePotableWater
Chlorinein
Water
Eductor
Eductor
Hy poTower &
Tank
Air(ChlorineStripperBlower)
15%NaOH
BrineSof tener
IonExchangeColumns
WaterRinse
ToDrain
BrineRinse
ToDrain
NaOHRinse
ToDrain
HClRinse
ToDrain
Sof tWater
BrineRecircTank
Salt orBrine
BrineRinse
ToDrain
Sof t WaterTo Various
ProcessPoints
HeatExchanger
CoolingWater
38%Bisulf ite
Electroly zers
H2&
NaOH
Cl2&
Brine
Air and Cl2
VentTo Air
Na+H2O
OH-
Anoly te Catholy te
Mem
bran
e
WaterRinse
ToDrain
In Out
32%HCl
Depleted Brine Recy cle to Brine Tank
Sof tWater
50%NaOH
Additional NaOHRequired For90 - 100%Productionas Bleach
Brine
Sof t Water For Process Process Or PotableWater
EmergencyChlorineEductor Chlorine
inWater
Emergency Chlorine Eductor System
HeatExchanger
CoolingWater
In OutChlorate DestructSystem Option32% HCl
Cl2 To HypoSystem
Regeneration Chemicals
15%CausticMake-up
Brine Purge (Sulfate)
Chlorine Gas
Chlorine Gas ToHypochlorite Production
12.5%Bleach(NaOCl)
Chlorine Gas User Option(For Water Treatment)

Electrolytic Technologies Corporation ____________________________________________________________________________________
ADDENDUM E. FIELD TESTING AND ACCEPTANCE
PART 1 GENERAL 1.01 PRELIMINARY CHECK OUT
A. The following operations are a prerequisite for the field test: 1. Set, align and assemble all equipment and systems in conformance with the
manufacturer’s drawings and instructions. 2. Check direct-coupled shafts with flexible or rigid couplings for parallel and
angular misalignment using laser alignment equipment, as applicable. Maximum allowable misalignment in either direction shall be 0.002-inch unless otherwise required by the manufacturer.
3. Check alignment and realign as necessary after all piping connections to equipment are made.
4. Check equipment for proper rotation. 5. Check motor for no-load current draw. 6. Run the equipment dry if applicable and check equipment for vibration and
noise outside of manufacturer’s published limits. 1.02 FIELD TESTS OF EQUIPMENT, STRUCTURES AND SYSTEMS A. Scope of System Testing: System testing is required to demonstrate that the equipment,
interconnections and accessories perform as specified. In addition to specific requirements called for in the specific Sections of the Contract Specifications, the following are to be considered a part of all system test procedures.
1. Variable capacity equipment is to be operated over the full capacity and at a minimum of 3 intermediate points.
2. Headed and cross-connected groups of units are to be operated using all connecting combinations.
3. All equipment items, including standby units are to be tested. It may be necessary to repeat systems tests at maximum condition to insure that standby units are included in system tests.
4. All equipment, interconnecting piping, and accessories are to be checked for leakage and specified rate performance capability. Instrumentation and controls shall be tested as part of the equipment they relate to.
B. Field Tests:
1. Preliminary Field Tests: These tests shall be made with water and air in lieu of the wastewater components and chemicals for which the equipment and systems are designed. a. Preliminary Field Tests of Equipment: ETC shall prove that equipment and
appliances meet their operating cycles and are free from defects such as overheating, overloading, and vibration outside of the manufacturer’s specified tolerances or hydraulic institute standards which are most stringent.
b. Preliminary Field Tests of Systems: ETC shall prove that all equipment and appurtenances of each system are properly installed, free from defects. Meet their specified operating cycles and characteristics when operating as part of the system.
2. Final Field Tests: These tests shall utilize all components, chemicals and air for which the equipment and Klorigen system are designed.

Electrolytic Technologies Corporation ____________________________________________________________________________________
a. Final Field Tests of Equipment: Shall prove that equipment and appliances meet their operating cycles and are free from defects such as overheating, overloading and undue vibration.
b. Final Field Tests of Systems: Shall prove that all equipment and appurtenances of each system are properly installed free from defects, meet their specified operating cycles and characteristics when operating as part of the system.
c. Operate the equipment as a unit with all related piping, valves, ducting, electrical controls, instrumentation and mechanical operation.
3. ETC’s Responsibilities
a. Prepare and submit testing schedule. b. Prepare and submit Test Procedures and Manpower Schedule for all
equipment items and systems. c. Coordinate with customer and/or Owner representative. d. Furnish all labor, unskilled and skilled, necessary for testing. e. Ensure the presence of all manufacturers’ representative(s). f. Provide lubricants, fuel and chemical as required for testing. g. Conduct tests. h. Prepare and submit Test Reports.
4. Customers Responsibilities
a. Review and approve Testing Schedules. b Review and approve Test Procedures c. Witness all tests. d. Certify Test results e. Review Test Reports f. Approve Test results. g. Provide power, water and other process materials, plant and instrument air,
as required for testing performance. h. Provide personnel as required for training.
5. Conduct of Tests: ETC shall conduct the tests and be responsible for all
operational decisions associated with the system. 6. Presence of ETC’s Representative(s): This is a prerequisite for the tests. No test shall
be performed in the absence of the ETC’s Representative, who shall ensure availability for the entire duration of the test.
7. Field Test Reports: Test report forms will be prepared by the customers Engineer for
the preliminary and final tests. These forms shall be used by the ETC’s Representative for data recording and notes during the tests. When the tests have been completed and accepted by the Engineer, the ETC’s Representative shall sign the Test Report; the witnessing Engineer will initial the report and take it with him/her foe an analysis of the test data.
PART 2 - EXECUTION 2.01 PRELIMINARY FIELD TESTS A. Preliminary Field Tests of Equipment: A successful test shall consist of at least one
continuous hour, or longer if so specified, of trouble free operation. B. Preliminary Field Tests of System:

Electrolytic Technologies Corporation ____________________________________________________________________________________
1. Test all systems by operating the systems equipment together as a unit with all related piping, valves, electrical controls and mechanical operations.
2. For a successful test, run each system with water and air trouble free for four continuous hours.
2.02 FINAL FIELD TESTS AND ACCEPTANCE A. Final Field Tests of Equipment or Individuals Subsystems: A successful test shall consist
of at least 24 continuous hours of trouble free operation. B. Final Field Tests of the System: Test all systems by operating the equipment as a
complete unit inclusive of all related piping, valves, ducting, electrical controls, instrumentation and mechanical operation. For a successful test, the Klorigen system shall run trouble free for a minimum of three (3) consecutive days, during which at least 24 continuous hours shall be at maximum designed capacity.
C. Acceptance: Completion of operations in accordance with Section 2.02,
paragraphs A. and B. above shall be sufficient for release of any and all outstanding funds held by customer or customer’s bank and due ETC. Deficiencies associated with work conducted by others shall not prevent release of outstanding funds due ETC.

Electrolytic Technologies Corporation ____________________________________________________________________________________
ADDENDUM F SALT SPECIFICATIONS
Suitable salt procurement is the responsibility of others. Morton Culinox® 999 has the required purity, as depicted below. Pre-treatment to establish brine purity of equal or better quality will be the sole responsibility of the end-user. Deviation from these specifications may void manufacturer’s warranty. Culinox® 999® Food Grade Salt is high purity, food grade granulated sodium chloride produced in vacuum pans from chemically purified brine. The crystals are cubic in structure. Brine treatment, crystallizing technique, and post-crystallizing washing substantially reduce calcium, magnesium, iron, copper and other heavy metals, sulfate and carbonate impurities. High purity helps assure consistent saltiness intensity, and there are stringent standards on visible, insoluble extraneous material. There are no additives. TFC 999® Salt is prepared by adding a trace of Yellow Prussiate of Soda (Sodium Ferrocyanide), a water soluble anti-caking agent used in accordance with 21 CFR Sec. 172.490 is not recommended.
Chemical Properties Sodium sulfate is major impurity with traces of calcium carbonate and magnesium hydroxide. Complies to Food Chemicals Codex tolerances and federal GMP standards. Typical Maximum 1Sodium Chloride (%) 99.98 >99.95 Sulfate (%) 0.01 <0.02 Ca/Mg as Ca (ppm) 12.00 <60*
Insolubles (ppm) - <20.0
Moisture (%) - <0.1
Copper (ppm) 0.00 <0.2
Iron (ppm) Free 0.2 <0.7 2Complexed 1.1 <2.3 3Sodium Ferrocyanide (ppm) 6.0 <13.0
1 By difference of impurities, moisture-free basis (ASTM procedures). 2 Contributed by sodium ferrocyanide (18% Fe). 3 Used in TFC 999 only. *<30 ppm for chemical grade.
Nutrient Content (per 100g) Ash (g) >99.9 Magnesium (mg) nil Calcium (mg) 2.0 Potassium (mg) 3
Chloride (g) 60.6 Sodium (g) 39.3
Iodine (µg) <100.0 Moisture (g) <0.1

Electrolytic Technologies Corporation ____________________________________________________________________________________
ADDENDUM G. STANDARD WARRANTY
Electrolytic Technologies Corporation (ETC) warrants the equipment of its manufacture to be free from defects in workmanship and materials. ETC also warrants that when installed and operated according to ETC’s written instructions, equipment and components will perform as specified for the following period of time: System—Guaranteed for a period of eighteen (18) months from date of shipment or one year from first date of operation, whichever first occurs. “System” includes transformer/rectifier, piping, valves, motors, peripheral monitoring and salt handling equipment. Components not included in the above interval include:
• Anodes - Guaranteed for a period of five (5) years of operation, they will be replaced on a straight-line pro-rata basis. Replacements shall be warranted for two (2) years thereafter on a straight-line pro-rata basis.
• Membrane - Guaranteed for a period of two (2) years of operation and replaced on a straight-line pro-rata basis. Replacements shall be warranted for one (1) year thereafter on a straight-line pro-rata basis.
• Operating supplies and consumables – such as filter elements, pH and ORP probes, replaceable fuses, testing chemicals, gaskets, seals and sealants used during normal course of operation and maintenance.
Where equipment sold hereunder is used with attachments and/or modifications that were not recommended by, or have not been approved by ETC in writing, such use shall not be considered normal and said warranty shall not apply. ETC’s liability is limited to the supply or repair of defective parts returned, freight prepaid by buyer, to a location specified by ETC. Repaired parts shall be returned to buyer free on board (f.o.b.) shipping point. On-site labor shall be the responsibility of the buyer. When circumstances permit, ETC will invoke for the benefit of the buyer, the guarantee or warranty of ETC’s vendor for equipment or materials furnished but not manufactured by ETC. This warranty does not extend to, and ETC assumes no liability for, consequential and/or secondary damages or losses of any kind sustained directly or indirectly as a result of a defect in any equipment, material or installation. ETC shall in no event be liable in an amount exceeding the purchase price of the equipment. ETC makes no warranties regarding equipment manufactured by it or others (including without limitation, warranties as to merchantability and fitness for a purpose), either expressed or implied, except as provided herein. The foregoing shall constitute the exclusive remedies of purchaser for any breach by seller of its warranties herein. Disclaimer of Warranties Electrolytic Technologies Corporation shall not under any circumstances be liable for any incidental or consequential damages arising from loss, damage to property, personal injury or other damage or losses owing to the failure of ETC’s products. The liability of Electrolytic Technologies Corporation is limited as set forth above to the cost of repair or replacement of defective products within the time period set forth above. This warranty is made in lieu of all other warranties, either express or implied, whether of fitness for a particular purpose or merchantability, whether oral or written. 0AItem}………………………………………………………………………………...……$ …………………………………………………………………...……$ -
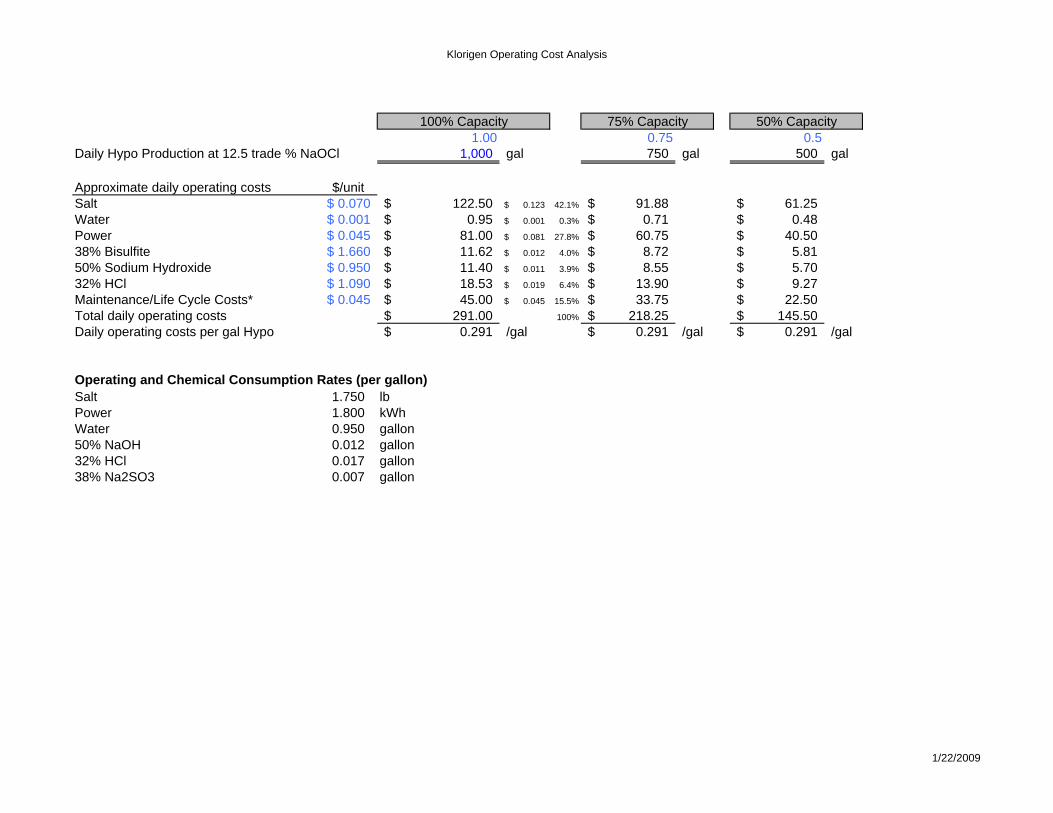
Klorigen Operating Cost Analysis
1.00 0.75 0.5Daily Hypo Production at 12.5 trade % NaOCl 1,000 gal 750 gal 500 gal
Approximate daily operating costs $/unitSalt 0.070$ 122.50$ 0.123$ 42.1% 91.88$ 61.25$ Water 0.001$ 0.95$ 0.001$ 0.3% 0.71$ 0.48$ Power 0.045$ 81.00$ 0.081$ 27.8% 60.75$ 40.50$ 38% Bisulfite 1.660$ 11.62$ 0.012$ 4.0% 8.72$ 5.81$ 50% Sodium Hydroxide 0.950$ 11.40$ 0.011$ 3.9% 8.55$ 5.70$ 32% HCl 1.090$ 18.53$ 0.019$ 6.4% 13.90$ 9.27$ Maintenance/Life Cycle Costs* 0.045$ 45.00$ 0.045$ 15.5% 33.75$ 22.50$ Total daily operating costs 291.00$ 100% 218.25$ 145.50$ Daily operating costs per gal Hypo 0.291$ /gal 0.291$ /gal 0.291$ /gal
Operating and Chemical Consumption Rates (per gallon)Salt 1.750 lbPower 1.800 kWhWater 0.950 gallon50% NaOH 0.012 gallon32% HCl 0.017 gallon38% Na2SO3 0.007 gallon
100% Capacity 75% Capacity 50% Capacity
1/22/2009

APPENDIX G
APPENDIX G
APPENDIX G
CHARACTERIZING MUNICIPAL GRIT ENTERING
THE SOUTH REGIONAL WWTP

1
Characterizing Municipal Grit Entering the Texarkana Water Utilities’ South Regional WWTP in Texarkana, Texas
DRAFT
Study Conducted by Grit Solutions
2402 E. 2659th Rd. Marseilles, IL 61341
Study Prepared for Texarkana Water Utilities
Texarkana Texas and Arkansas
November 21, 2008
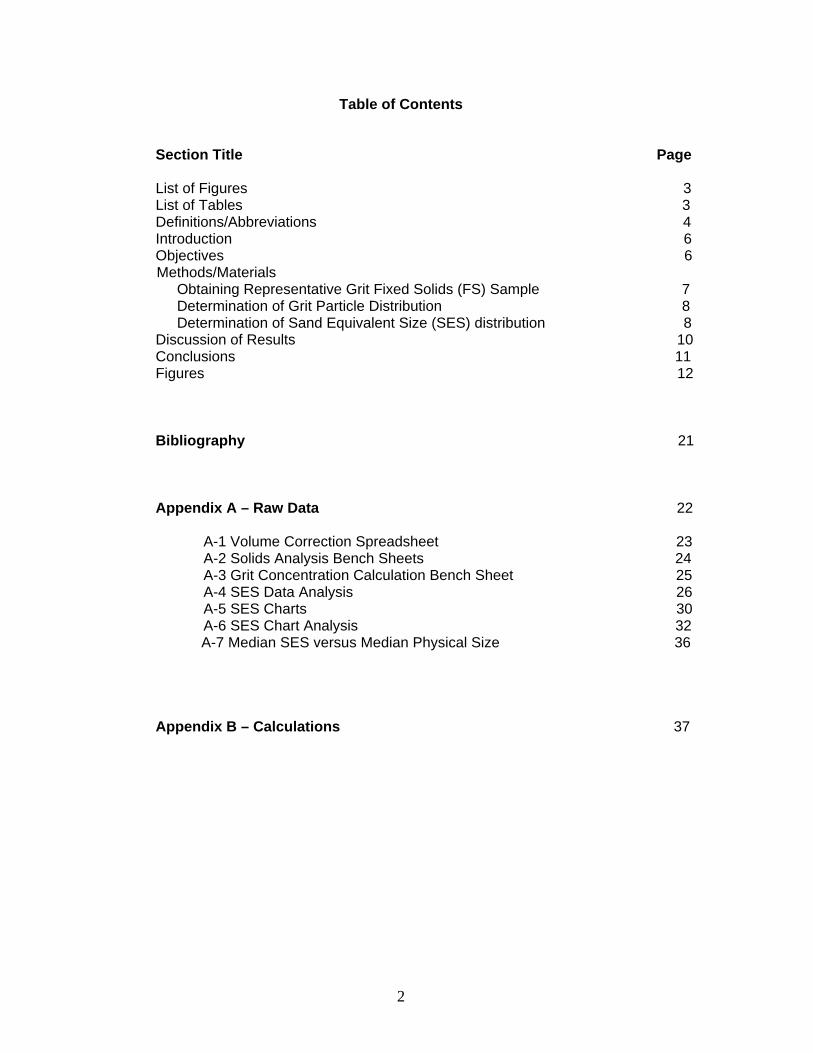
2
Table of Contents
Section Title Page List of Figures 3 List of Tables 3 Definitions/Abbreviations 4 Introduction 6 Objectives 6
Methods/Materials Obtaining Representative Grit Fixed Solids (FS) Sample 7 Determination of Grit Particle Distribution 8 Determination of Sand Equivalent Size (SES) distribution 8 Discussion of Results 10
Conclusions 11 Figures 12 Bibliography 21
Appendix A – Raw Data 22 A-1 Volume Correction Spreadsheet 23
A-2 Solids Analysis Bench Sheets 24 A-3 Grit Concentration Calculation Bench Sheet 25 A-4 SES Data Analysis 26 A-5 SES Charts 30 A-6 SES Chart Analysis 32
A-7 Median SES versus Median Physical Size 36
Appendix B – Calculations 37

3
List of Figures
1. Vertically Integrated Sampler 2. VIS Installed 3. 50-Micron Grit Settler 4. Settler Weir 5. Wet Sieve System 6. Modified Imhoff Cone for SES Measurements 7. Sampling Setup 8. Fractional Distribution of Influent Grit Fixed Solids Entering the South Regional
WWTP 9. Concentration of Influent Grit Fixed Solids Entering the South Regional WWTP
10. Comparison of the South Regional WWTP Influent Grit Physical Size and Sand Equivalent Size on November 3, 2008
11. Comparison of the South Regional WWTP Influent Grit Physical Size and Sand Equivalent Size on November 4, 2008
12. Comparison of the South Regional WWTP Influent Grit Physical Size and Sand Equivalent Size on November 5, 2008
13. Comparison of the South Regional WWTP Influent Grit Physical Size and Sand Equivalent Size on November 6, 2008
14. Median Size Distribution of Grit Entering the South Regional WWTP vs. Clean Sand Distribution
List of Tables
1. Sieve Size Equivalents 2. South Regional WWTP Sampling Period 3. Amounts of Grit Fixed Solids Entering the South Regional WWTP 4. Predicted Removal Efficiencies (%) of a System Designed To Remove Grit of a
Specific SES Entering the South Regional WWTP
Definitions/Abbreviations

4
gpm - gallons per minute. Grit – A settleable inorganic kernel with attached organics larger than 50 microns and characterized by physical size and settling velocity. Grit Concentration – the amount of grit present in the wastestream based on the fixed solids measurements Grit Fixed Solids (FS) – also expressed as “fixed solids” - the inorganic portion of sample remaining after organics are removed by ashing in a muffle furnace at 550oC. lbs./MG – Pounds per Million Gallons MG - Million Gallons MGD – Million Gallons per Day NR1 – the Reynolds number for the trial SES NR2 – the Revised Reynolds number SAA – Surface Active Agents – material affixed to the grit particle, such as organics, fats, oils, and greases that may affect the settling velocity of municipal grit. Sample – All material accumulated in the bottom of the grit settler which includes settleable organics. Sand Equivalent Size (SES) - The sand particle size, measured in microns, having the same settling velocity as the selected grit particle. SARA – San Antonio River Autthority Sed h, cm – The height of water in the Imhoff cone through which the sediment passed to reach the surface of accumulated material during SES determination Sed Time, sec – The time required for sediment to reach the recorded volume during SES determination Sed vel, cm/s – the settling velocity (v) of the sediment reaching a particular settled volume Sed. Vol., cc – Sedimentation Volume (cc or ml) – The amount of material that settles in the Imhoff Cone during SES determinations SES, d1, u – Trial Sand Equivalent Size, in microns
Definitions/Abbreviations Continued

5
SES, d2, u – Revised Reynolds Number based on NR2 and d1 VIS – Vertically Integrated Sampler Vol Frac, % - the cumulative sedimentation percentage occurring during SES determination WWTP – Wastewater Treatment Plant
Introduction

6
The City of Texarkana, Texas is evaluating the characteristics and volumes of grit entering their South Regional Wastewater Plant. This information will be used to design and select new headworks equipment. In removal system design, grit has commonly been treated as clean sand with a specific gravity of 2.65. Metcalf and Eddy’s Wastewater Engineering: Treatment and Reuse says “Grit consists of sand, gravel, cinders, or other heavy materials that have specific gravities or settling velocities considerably greater than those of organic particles”. These inorganics are often associated with Surface Active Agents (SAA) that include fats, oils, greases, and other organic materials can lower the specific gravity to 1.3 (Tchobanoglous, 2003). The shape and composition of grit may also affect settling velocities. When determining quantities of grit during this study, grit will be defined as settleable inorganic material larger than 50 microns. However, settling velocities, attached organics and SAA will be considered during the on-site laboratory analyses. The settling velocity is expressed as the Sand Equivalent Size (SES), which is the sand particle size having the same settling velocity as the more buoyant grit particle. Materials less than 50 microns are considered silt or clay and will be excluded from the data. Downstream deposition of grit can be prevented by removing grit 100 microns and larger. Knowing the volumes and characteristics of grit entering the wastewater treatment facilities will help determine the level of protection required and aid in selecting the appropriate removal method and equipment.
Study Objectives
The purpose of this study is to determine the amounts and characteristics of grit entering the treatment facility.
Methods/Materials

7
Obtaining Representative Grit Fixed Solids (FS) Sample The volume and characteristics of grit received at wastewater treatment facilities can vary widely depending on the characteristics of the collection system, weather conditions, septic waste haulers, and industrial activities. The analytical procedures used in compiling these data take into account and compensate for the non-homogeneity of the grit. During the influent grit characterization, the wastestream was sampled by placing a Vertically Integrated Sampler (VIS) in the influent channel before the introduction of facility recycle flows (See Figures 1 and 2). A VIS is constructed from a section of six-inch diameter PVC pipe with a sealed bottom and a slot cut along the length of the pipe. The VIS is secured in the middle of the wastestream and the suction end of a trash pump is placed inside the pipe two-inches from the bottom. The VIS is designed to collect sample from the entire height of the water column. The slot width is determined by the velocity present in the channel during maximum flows. Since the pump rate and the channel depth are known, it is possible to calculate the width of slot required to match the velocity across the slot with the velocity in the wastestream. If a slot is too wide, the slow velocity may create a non-isokinetic condition that may cause a grit particle to go around the VIS and avoid being sampled. A slot that is too thin can always be widened or, if the pump is starving, reduce the speed of the pump. During the start of the sampling event, the trash pump will often remove wastewater at a rate higher than can flow through the slot; therefore the pump speed is lowered until the plant flow increases. The pump is plumbed into the side of a 50-micron settler (See Figure 3) and equipped with a 90o elbow to divert the incoming sample laterally and slow the velocity. The 50-micron grit settlers are constructed from 50-gallon plastic storage tanks with an influent port and a discharge weir (See Figure 4). Flow enters the tank and is diverted to the side to reduce the velocity. Grit settles to the bottom, and wastewater exits over the weir. In order to settle 50-micron grit with a specific gravity of 2.65, the overflow rate must be less than three-gallons/ft2 of surface area. Each settler has a diameter of 24-inches, or a surface area of 3.14 ft2. At ten-gpm, the overflow rate is 3.18 gallons/ft2. The settler feed velocity is adjusted to less than eight-gpm to insure settling of fine grit and checked by timing the overflow rate of the settler. This is repeated every 30 minutes to insure stability. The excess flow provided by the pump is bypassed back into the wastestream. Excess flow from the sample pump is bypassed. At the end of the sampling period, the settler contents are allowed to settle for 20 minutes. The supernatant is discarded and grit that has accumulated in the bottom of the settler is rinsed into buckets. The liquid portions of the grit samples are gradually poured off until the remaining grit/sludge samples are thick enough to obtain a homogenous mixture without grit settling out of the slurry. The entire volume of each sample is recorded before being split for analysis. Since bacteria will reduce the organics that are attached to the grit particles, it’s important to perform the analyses on fresh grit immediately after collection. If immediate analysis is not possible, samples may be stored at 4OC for no longer than 12 hrs. Determination of Grit Particle Distribution

8
A 200-gram or smaller portion of the sample collected by the 50-micron Grit Settler is placed in the Wet Sieve System for immediate sieving of the solids (See Figure 5). Wet sieving for size fractions and the SES settling tests are conducted on fresh grit from the sewer waste stream samples. The Surface Active Agents (SAA) attached to the grit kernel may substantially reduce the specific gravity and consequently it’s settling velocity. The Grit Solutions stacked sieve unit uses a combination of “gold panning” motion and falling water level in the stack of ten sieves (listed below in Table 1 “Sieve Size Equivalents”) for rapid and reproducible wet sieving of the municipal grit sample. Using this procedure, wet sieve size fractions can be obtained within 20 minutes.
Table 1. Sieve Size Equivalents
Opening
U.S. Sieve Size Tyler Equivalent microns inches
1/4 3.25 mesh 6300 0.2500
1/8 6.5 mesh 3180 0.1250
#12 10 mesh 1680 0.0661
#20 20 mesh 841 0.0331
#50 48 mesh 297 0.0117
#70 65 mesh 210 0.0083
#100 100 mesh 149 0.0059
#140 150 mesh 105 0.0041
#200 200 mesh 74 0.0029 #270 270 mesh 53 0.0021
Determination of Sand Equivalent Size (SES) distribution
Settling tests were conducted immediately on solids passing the U.S. #20 sieve and sequentially retained on the #50, #70, #100, #150, #200, and #270 sieves. Large organics often interfere with the settling of grit on screens larger than #50. A portion of the retained material is placed into a modified Imhoff cone filled with water (See Figure 6). The column is inverted and as the grit settles in the cone corresponding time and volume measurements are recorded. The objective of these measurements is to determine the size of a sand sphere having the same settling velocity as the collected grit fraction. The weight measurements of the grit particles retained on each of the ten sieves were determined according to methods 2540B and 2540G as outlined in Standard Methods for the Examination of Water and Wastewater, 1998 APHA, AWWA, WEF, 20th edition. Fixed solids fractions were arranged into fractional and cumulative distributions. From this data a cumulative curve factoring physical size and weight of fixed solids is generated. Data from the settling tests are entered into a spreadsheet for each size fraction that converts the settling velocities and volumes into Sand Equivalent Size. The SES value generated is plotted against the corresponding volume fraction to generate a series of

9
SES charts. Each chart is divided into 20-micron SES intervals and the percentages of grit falling within each interval are entered into a spreadsheet for analysis. From this data, a cumulative curve factoring SES and weight of fixed solids per size fraction is generated. By comparing the “SES” curve with the “Physical Size” curve, we can determine the amount of grit that can bypass a grit removal system designed around a known sand particle size. The SES charts are also used to compare the average SES within a sieve fraction with the average physical size of clean, round silica sand for that same sieve fraction. To calculate the concentration of grit present in the sewer during normal flow conditions, the volume of wastewater sampled each day is compared to the measured volume of wastewater passing through the sewer during the sampling periods. The total amount of grit collected during each sampling period is applied to the total volume of wastewater to determine the lbs/MG of grit present in the sewer.
Discussion of Results

10
The entire sampling setup can be seen in Figure 7. Sampling conditions are presented below in Table 2 “South Regional WWTP Sampling Period”. Sampling was performed an extra day, November 6, to include a rain event in the hopes that increased flow would produce an increase in grit volume.
Table 2. South Regional WWTP Sampling Period
Date
Average Flow During Sampling
(MGD) Start Time Finish Time Hours November 3, 2008 12.080 7:55 13:55 6.00 November 4, 2008 10.630 7:00 13:00 6.00 November 5, 2008 9.900 7:05 13:05 6.00 November 6, 2008 13.210 7:45 10:30 2.75
Table 3 below summarizes the amount of Grit Fixed Solids (FS) obtained from the influent sampling location.
Table 3. Amounts of Grit Fixed Solids Entering the South Regional WWTP
Date Settler Feed Rate
(gpm)
Total Grit FS Entering Channel During Sampling
(lbs.)
Grit FS Concentration
(lbs./MG) November 3, 2008 7.89 40.0 13.2 November 4, 2008 7.93 6.4 2.4 November 5, 2008 8.04 12.9 5.2 November 6, 2008 7.85 19.7 13.0
Physical size distributions were similar for all four days. According to Figure 8 “Fractional Distribution of Influent Grit Fixed Solids Entering the South Regional WWTP”, between 3.6 and 6.6% of grit was larger than 297-microns physical size. Grit smaller than 297-microns accounted for between 93.4 and 96.4% of the total amount. Figure 9 “Concentration of Influent Grit Fixed Solids Entering the South Regional WWTP” charts the fractional amounts of grit FS collected from the influent channel. Although a rain event occurred on November 6, the concentration of grit entering the facility remained relatively low. This suggests that grit accumulating in the collection system during periods of low flow will require large and extended high flow events for re-suspension and transport. Concentrations were significantly higher on November 3 and 6 which also provided the highest flows, peaking at over 16 MGD. It is possible that flows approaching of exceeding 20 MGD could transport significant quantities of accumulated grit into the facility. Sand Equivalent Size (SES) vs. Physical Size plots can be used to determine grit removal system design parameters. The following table lists theoretical removal

11
efficiencies for a system designed to remove grit based on the SES data collected from the influent sampling site.
Table 4. Predicted Removal Efficiencies (%) of a System Designed to Remove Grit of a Specific SES Entering the South Regional WWTP
Sample Date 300-micron SES
Design 150-micron SES
Design 100-micron SES
Design 75-micron SES
Design November 3, 2008 1.9 60.0 94.2 99.0 November 4, 2008 1.1 67.0 96.0 100 November 5, 2008 0 54.0 93.6 100 November 6, 2008 0.9 59.0 96.2 100
Efficiencies listed in Table 4 are found in Figures 10 through 13 “Comparison of the South Regional WWTP Influent Grit Physical Size and Sand Equivalent Size”. These figures also demonstrate the differences in Physical Size and Sand Equivalent Size. For example, from Figure 10, 150-micron Physical Size grit comprises 33.0% of the physical size distribution. From the corresponding Sand Equivalent Size (SES) line, 150-micron Sand Equivalent Size grit comprises 60.0% of the distribution. By subtracting the % SES from the % Physical size, the resulting 27.0% is the estimated amount of grit that may bypass a Grit Removal System if the physical size distribution is used for design. Figure 14 “Median Size Distribution of Grit Entering the South Regional WWTP vs. Clean Sand Distribution” compares the difference in settling velocity between the influent grit collected during the study and clean sand with a specific gravity of 2.65. The settling velocities of grit larger than 200-microns slows considerably, possibly due to shape
Conclusions
1. Between 3.6 and 6.6% of grit was larger than 297-microns physical size. Grit smaller than 297-microns accounted for 93.4 to 96.4% of the total amount. (See Figure 8).
2. The concentration of grit FS entering the WWTP was between 2.4 and 13.2
lbs/MG. (Table 3, Figure 9)
3. A Grit Removal System design based on 150-micron Sand Equivalent Size would collect between 54.0 and 67.0% of influent grit while a 100-micron SES system would improve to between 93.6 and 96.2% efficiency. A 75-micron SES system would collect from 99.0 to 100% of influent grit (See Figures 10 through 13).
Figure 1 – Vertically Integrated Sampler

12
Figure 2 – VIS Installed
Figure 3 – 50-micron Grit Settler

13
Figure 4 – Settler Weir
Figure 5 – Wet Sieve System

14
Figure 6 – Modified Imhoff Cone for SES Measurements

15
Figure 7 – Sampling Setup

16

17

18

19

20

21
Bibliography
Clesceri, L., Greenberg, A. and Eaton, A., “Standard Methods for the Examination of Water and Wastewater”, 20th Edition, 1998, American Public Health Association, Washington, DC
Tchobanoglous, G., Burton, F.L. and Stensel, H.D., “Wastewater Engineering: Treatment and Reuse”, 4th Edition, 2003. TATA McGraw-Hill

22
Appendix A – Raw Data 22 A-1 Volume Correction Spreadsheet 23
A-2 Solids Analysis Bench Sheets 24 A-3 Grit Concentration Calculation Bench Sheet 25 A-4 SES Data Analysis 26 A-5 SES Charts 30 A-6 SES Chart Analysis 32
A-7 Median SES versus Median Physical Size 36

23
A-1 Volume Correction Spreadsheet

24
A-2 Solids Analysis Bench Sheets

25
A-3 Fractional Grit Concentration Calculation Bench Sheet

26
A-4 SES Data Analysis

27
A-4 SES Data Analysis
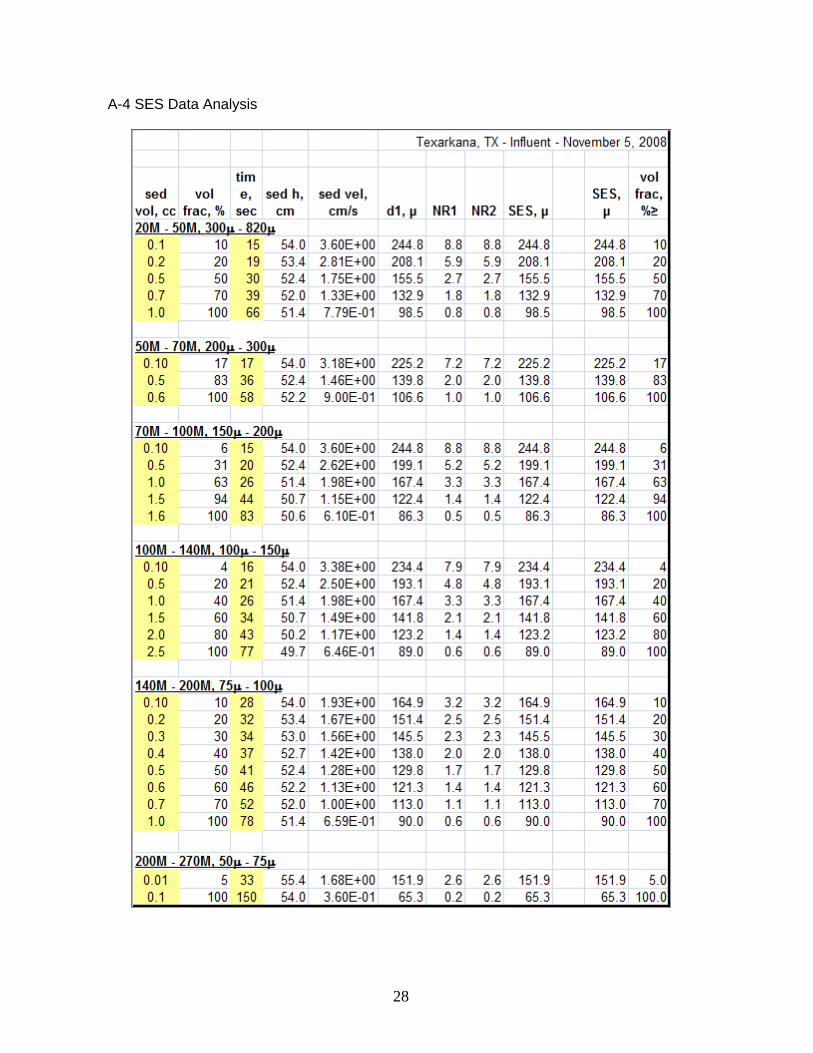
28
A-4 SES Data Analysis

29
A-4 SES Data Analysis

30
A-5 SES Charts

31
A-5 SES Charts

32
A-6 SES Chart Analysis

33
A-6 SES Chart Analysis

34
A-6 SES Chart Analysis

35
A-6 SES Chart Analysis

36
A-7 Median SES versus Median Physical Size

37
Appendix F – Calculations
Drag Coefficient (Cd) 24/NR + 3/sqrt NR + 0.34 Reynolds number (NR) (settling velocity of particle)(diameter of particle)/kinematic viscosity Stoke’s Law Settling velocity (m/s) = g(sgp – 1)d2
p/18v Where g = acceleration due to gravity (9.81 m/s2) sgp = specific gravity of particle
dp = diameter of particle v = kinematic viscosity (m2/s) % Total Solids (grams dry weight/grams wet weight)*100 % Total Volatile Solids [(grams dry weight - grams ash weight)/ grams dry weight]*100

APPENDIX H
APPENDIX H
APPENDIX H
THICKENING CENTRIFUGES
Centrisys & Andritz

___________________________________________________________________________________________________
ISO 9001:2000 Certified
Centrisys Corporation 9586 58th Place
Kenosha, WI 53144 Phone: 262-654-6006 Fax: 262-654-6063
www.centrifuge-systems.com
Centrisys West Service & Repair Center
825 Performance Drive Stockton, CA 95206
Phone: 209-983-0800 Fax: 209-983-0888
[email protected] December 2, 2008 Lee Cronister HDR Engineering 17111 Preston Road Suite 200 Dallas, TX 75248-1232 USA Re: Texarkana Water Utilities – Humboldt S3-0 Thickening Centrifuges Lee: On Tuesday November 18, 2008, I made a visit to the Texarkana Water Utilities Pollution Control Plant to inspect the Humboldt S3-0 Thickening Centrifuges. There are a number of items found following my inspection that need attention to continue on with their safe and effective. With the items being corrected, the machines can continue to provide thickening for the plant for the next 3 to 5 years, possibly longer. The machines were installed by Humboldt Decanter in approximately 1984-1985 for sludge thickening. They were manufactured from stainless steel and provided originally with Alumina Oxide Ceramic flight tiles. All units have been subsequently retrofitted with Tungsten Carbide flight tiles which are the standard used today for centrifuge flight wear protection. The units have been repaired and service by several different shops since originally installed. Most recently, they have been serviced by Jenkins Centrifuge. In our opinion, Jenkins is a reputable company typically found servicing slower speed decanters centrifuges with older gear style scroll drive systems most commonly found in the rendering industries. The Humboldt machines installed at the Texarkana Water Utilities have Viscotherm Hydraulic drives installed and it is suspect that these drives were not serviced properly therefore they are not running at their best. Currently only one of the machines is running (unit 12). Most of the time during the inspection was spent with Unit 11. Plant staff indicated that it was making quite a noise during operation. The machine was also inspected recently by the OEM - Andritz Ruthner. The Andritz technician was unable to find the problem and the apparent noise coming from the machine when rolled by hand.

___________________________________________________________________________________________________
ISO 9001:2000 Certified
Centrisys Corporation 9586 58th Place
Kenosha, WI 53144 Phone: 262-654-6006 Fax: 262-654-6063
www.centrifuge-systems.com
Centrisys West Service & Repair Center
825 Performance Drive Stockton, CA 95206
Phone: 209-983-0800 Fax: 209-983-0888
[email protected] Immediately upon my inspection, the staff brought to my attention the loose metallic sound coming from the solids discharge end of the machine. Upon listening to the sound, I immediately removed one of the plugs from the positioning pin holes and found the problem. The hardened steel pin that sets the scroll in a fixed axial position had come loose. With the pin coming loose, the scroll has likely moved both axially and radially as the pin is no longer securing tightly its position. With the free movement of the scroll, this is the likely cause of the unit vibrating. Repair for this type of damage cannot be done in place. Machines 13 was recently repaired by Jenkins, however following startup and initial run on sludge, the machine will typically plug up. Machine 14 has the same issues and has not been running for some time. It is likely the scroll drive motor that is failing thus not conveying solids ultimately ending in plugging. It is suspect that the scroll drive motors were not correctly rebuilt on units 13 & 14. It is also possible that the hydraulic pump units need inspection and possibly gear pump replacements. Specifically if there is internal leakage on one of the mechanical seal components of the scroll drives, the unit will start to fill up with solids and the torque and resultant pressure will come to a point that the internal mechanical seal will leak and the unit will lose differential and result in plugging. I would recommend the following service: Unit 11: Remove rotating assembly and ship to Wisconsin for repair of the pin for positioning of the scroll. I would also check balance the bowl and scroll. Cost will depend on the damage to the solid end drive shaft fit. Estimate: $15,000 to $25,000 Unit 12: No Service at this time. Unit performing well according to plant staff, however vibration levels and machine condition is unknown. Estimate: $ No Associated Charges

___________________________________________________________________________________________________
ISO 9001:2000 Certified
Centrisys Corporation 9586 58th Place
Kenosha, WI 53144 Phone: 262-654-6006 Fax: 262-654-6063
www.centrifuge-systems.com
Centrisys West Service & Repair Center
825 Performance Drive Stockton, CA 95206
Phone: 209-983-0800 Fax: 209-983-0888
[email protected] Unit 13: Send the pump unit and rotodiff in for service and repair in Kenosha, Wisconsin. Rotodiff Repair Cost $5,000 to 9,000 Pump Unit Service and Manual Control Valve Retrofit $3,500 to 6,500 Unit 14: Send the pump unit and rotodiff in for service and repair in Kenosha, Wisconsin. Rotodiff Repair Cost $5,000 to 9,000 Pump Unit Service and Manual Control Valve Retrofit $3,500 to 6,500 *** The above pricing does not include the shipping of the units or reinstallation. I would think the reinstallation of the units following shop service could be done in 2 to 3 days. For budgeting, plan on $2,000 per day to include time and expenses and related travel (flights, hotel, rental car, etc.). If you have any further questions, please do not hesitate to contact me @ 209-304-2200. Sincerely,
Chris Gatewood Chris Gatewood

ENVIRONMENT AND PROCESS TECHNOLOGIES
ANDRITZ BIRD INC.
1010 Commercial Blvd S Arlington, TX 76001 Tel. (817) 465-5611 Fax (817) 468-3961
October 20, 2008
Proposal for Sole Source for Electrical Upgrades to City of Texarkana WTP Humboldt S3 Decanter Centrifuges
Odis Tyler Pollution Control Manager Texarkana Water Utilities 4000 S. State Line Texarkana, TX 75501 The following proposal is to convert the existing Humboldt S3-01 Decanter Centrifuges from a Hydraulic driven back drive system to an AC VFD control back drive system. The purpose of this change would be to replace the old hydraulic system which has had many issues with leaks and reliability to the latest reliable technology presently offered with new equipment. The proposed modification would encompass the removal of the hydraulic back drive and pump unit and replace it with a cyclo gear to give you a turn down ratio. The old control panel would be replaced with a new state of the art control panel. This panel will include the starters and VFD’s for both the main motor and the new AC back drive (10 hp) motor. The control panel will incorporate the latest in power regeneration technology allowing the benefit of 10% to 20% power savings back to the common bus. The proposed modifications are unique to your facility and will be designed specifically for your machines. Based on the technical difficulties involved in these modifications, it can not be easily outsourced to any repair or electrical shop and expect to complete without major issues and complications during the startup process. Andritz Bird offers the following references and job scope to demonstrate our ability to provide a smooth and efficient upgrade modification. Andritz Bird is currently working with the NYC DEP on the Oakwood Beach OB-121 project. This project requires the supply of four (4) new rotating assemblies. Andritz Bird will work with the awarded contractor to install these new rotating assemblies, as well as the refurbishment of the base, isolators and discharge connects to the chutes. Andritz Bird will provide electrical assistance in upgrading the four control panels with new Allen Bradley PLC’s and touch screens and will perform the integration with the ancillary equipment. Andritz Bird will also perform mechanical and process tests once the new machines have been installed.

ENVIRONMENT AND PROCESS TECHNOLOGIES
ANDRITZ BIRD INC.
1010 Commercial Blvd S Arlington, TX 76001 Tel. (817) 465-5611 Fax (817) 468-3961
This upgrade is intended to be used as the basis for the remaining CP4-1 dewatering centrifuges. Andritz Bird does recognize that their may be other companies capable of supplying the mechanical portion of the scope of supply. Andritz Bird feels that it is in the best interest to the DEP and its operational personnel to limit the number of centrifuge operating control systems. The ultimate goal is to have a smooth overhaul, installation and integration of the complete system. The concern any potential contractor would have dealing with multiple centrifuge vendors would be the smooth resolutions during the integration process between mechanical and electrical interfaces. In 2005 Andritz Bird completed a project for the County Sanitation District of Los Angeles were we replaced (8) control panels with new upgraded controls and provided training for the operators. Andritz Bird currently holds the service contract for the City of Philadelphia Bird centrifuges and has completed the VFD upgrade to several of the existing M6400 centrifuges. The scope of supply consisted of installing (4) new VFD’s replacing the eddy current back drive systems. Andritz Bird has also completed a project for Los Angeles County in replacing the local control cabinet panels for eight (8) of the Humboldt centrifuges. This project did not require the mechanical portion and allowed for combining several control stations inside one cabinet. This Proposal and any resulting contract shall be referred to hereinafter as “this Contract”.

ENVIRONMENT AND PROCESS TECHNOLOGIES
ANDRITZ BIRD INC.
1010 Commercial Blvd S Arlington, TX 76001 Tel. (817) 465-5611 Fax (817) 468-3961
Section: Mechanical The below figure illustrates the current configuration of the centrifuge:
The proposed mechanical changes would be to replace the hydraulic back drive with a new cyclo gear: The overhaul of the rotating assembly is not part of the scope of supply in this proposal but can be added.

ENVIRONMENT AND PROCESS TECHNOLOGIES
ANDRITZ BIRD INC.
1010 Commercial Blvd S Arlington, TX 76001 Tel. (817) 465-5611 Fax (817) 468-3961
The cyclo gear will be mounted in the current location as the back drive motor. A new AC back drive motor will be installed in line with the cyclo gear: There will be some foundation work required to secure the new AC VFD back drive motor. The following illustrates the location of the new motor to be inline with the new cyclo gear.
The control cabinets will be replaced with new control cabinets. The removal of the old and the installation and electrical hook up are normally out of the scope of supply but can be quoted if required. The following is a standard electrical control specification for your review. The electrical submittal will be designed specifically for your facility.

ENVIRONMENT AND PROCESS TECHNOLOGIES
ANDRITZ BIRD INC.
1010 Commercial Blvd S Arlington, TX 76001 Tel. (817) 465-5611 Fax (817) 468-3961
Scope of supply The existing Centrifuge will be supplied with a new Centrifuge Control Panel and a new AC induction motor for the back drive. The existing bowl drive motor and machine wiring will be used. removal of existing panel and motor, and connection of new panel and motor is not included in this proposal. 3 days on site start-up is included. CONTROL SYSTEM DESCRIPTION The Centrifuge Control Panel (CCP), will be a the same size as the current cabinet. The assembly will be C.U.L. 508 listed. The following major components will be mounted within the CCP: • Main power disconnect switch, accepts 460 VAC, 3 Phase • Control voltage transformer • Primary and secondary control voltage fuses • Lube Oil pump motor starter • Variable frequency drives for
- Centrifuge bowl drive 40HP - Centrifuge back drive (scroll) 10HP - DC buss fuses
• PLC processor, power supply, I/O cards. • 24 VDC power supply. • Control relays. • Terminal strip for external connections. The following controls shall be mounted on the CCP: • System control power on-off illuminated selector switch • Emergency Stop: Maintained position mushroom head pushbutton. • Main disconnect: operator handle with tripped indication • Operator Interface Terminal (OIT), TFT color touch screen The following controls shall be provided for the centrifuge control system via the panel mounted OIT: • Centrifuge start/stop • Lube oil pump start/stop • CIP start/stop • Back drive PID Manual/Auto selection • Back drive relative speed set-point (PID manual mode) • Back drive torque set-point (PID auto mode) • Wash-water valve open/close

ENVIRONMENT AND PROCESS TECHNOLOGIES
ANDRITZ BIRD INC.
1010 Commercial Blvd S Arlington, TX 76001 Tel. (817) 465-5611 Fax (817) 468-3961
The following indicators shall be provided for the centrifuge control system via the panel mounted OIT: • Start – in progress • Stop – in progress • Ready for Sludge • CIP selected – on • CIP start – in progress with countdown timer • CIP stop • Wash-water valve – open • Centrifuge – on/ready • Bowl drive VFD fault – alarm • Back drive VFD fault – alarm • Centrifuge high torque – alarm • Centrifuge high-high torque – alarm • Bearing temperature - high • Horn audible alarm signal The following digital meters shall be provided on the CCP via the panel mounted OIT: • Centrifuge bowl drive speed – RPM • Centrifuge back drive speed – RPM • Centrifuge back drive relative speed – RPM • Centrifuge back drive torque – % full load CENTRIFUGE CONTROL PANEL INTERFACE REQUIREMENTS • Power input from customer supply:
• 460 VAC, 3 Phase, 60 HZ, 125 amps • Power output from CCP to centrifuge motors:
• Bowl drive motor (40 HP) • Back drive motor (10 HP)
• Inputs to CCP from centrifuge motors: (dry contact)
• Bowl drive motor thermostat • Back drive motor thermostat
• Outputs from CCP to customer supplied equipment: (dry contact) • Centrifuge ready for sludge

ENVIRONMENT AND PROCESS TECHNOLOGIES
ANDRITZ BIRD INC.
1010 Commercial Blvd S Arlington, TX 76001 Tel. (817) 465-5611 Fax (817) 468-3961
SEQUENCE OF OPERATION
The centrifuge control system consists of a Centrifuge Control panel (CCP) which houses the variable frequency drives, programmable logic controller (PLC) and operator interface terminal (OIT), and terminal strips. The polymer feed system, sludge feed systems and conveyor systems are provided with their own control panels that allow for individual and independent control and will not be controlled by the CCP. It is important to insure that all control switches are in proper position and equipment is ready to operate. CCP emergency stop will de-energize the master control relay to interrupt all run commands for immediate shutdown. To restart system, the emergency stop must be manually reset. OIT SCREENS • Main- this screen provides a system overview of Centrifuge, mode selection touch zones,
start and stop touch zones, and access to other system screens. • Torque Control- this screen allows selection of PID auto or manual mode, entry of relative
speed or torque setpoint, and numeric and bargraph representation of setpoints and actual values.
• Alarms- this screen provides indication for all Centrifuge system alarms including • Torque Control Setup- this screen is password protected and provides entry for PID tuning
parameters for the torque control loop. • Setup1- this screen is password protected and provides entry for centrifuge specific
machine and motor data for PLC program use. • Setup2- this screen is password protected and provides entry for start, stop, and CIP cycle
parameters. • Setup3- this screen is password protected and provides CIP settings. STARTING/STOPPPING MODES - On the “Main” screen select the system-operating mode by touching one of the mode
select touch zones. All equipment must be stopped to change modes this will be indicated by the mode select enabled indicator.
Start / Stop – In this mode, start-up and shutdown can be controlled from the start/ stop pushbuttons. Operating the start pushbutton will initiate the sequence of events described below. At any time while in the Start mode the operator can begin a shutdown.

ENVIRONMENT AND PROCESS TECHNOLOGIES
ANDRITZ BIRD INC.
1010 Commercial Blvd S Arlington, TX 76001 Tel. (817) 465-5611 Fax (817) 468-3961
Operating the Start pushbutton will initiate the following sequence of events:
1. Lube oil system starts (instantly) 2. Centrifuge bowl drive starts (120 second delay from Lube system start) 3. Centrifuge back drive starts (3 second delay from bowl starting) 4. Centrifuge Ready permit contact closes (once bowl and scroll come to speed) *While start is in progress the start indicator light will flash “STARTING”. After start-up is complete the indicator light will stay on steady “RUNNING”. Operating the Stop pushbutton will initiate the following sequence of events: 1. Centrifuge Ready permit contact opens (instantly) 2. Centrifuge goes to relative speed control (instantly) 3. Centrifuge goes to stop preset speed #1 (at normal deceleration ramp) 4. Wash water valve opens (once centrifuge is at preset speed #1) 5. Centrifuge remains at this preset speed #1 (duration as set on “Setup 2” screen) 6. Centrifuge goes to stop preset speed #2 (at normal deceleration ramp) 7. Centrifuge remains at this preset speed #2 (duration as set on “Setup 2” screen) 8. Centrifuge stops (at normal deceleration ramp) 9. Wash water valve closes (at bowl speed set on “Setup 2” screen) 10. Lube oil pump stops ( after bowl stops) Stop indicator light will flash “STOPPING” while in progress and go on steady “STOPPED” when complete.
CIP mode – In this mode, start-up and shutdown can be controlled from the CIP start/ stop pushbuttons. Operating the CIP start pushbutton will initiate the following sequence of events.
Operating the CIP Start pushbutton will initiate the following sequence of events:
1. Centrifuge bowl drive starts (instantly) 2. Centrifuge back drive starts (3 second delay from bowl run confirm) 3. Wash water valve opens (once bowl and scroll come to speed) The duration and speeds for the CIP cycle are set on “Setup 2” screen. Operating the CIP Stop pushbutton will initiate the following sequence of events:
1. Wash water valve closes (instantly) 2. Stop centrifuge (at normal deceleration ramp)
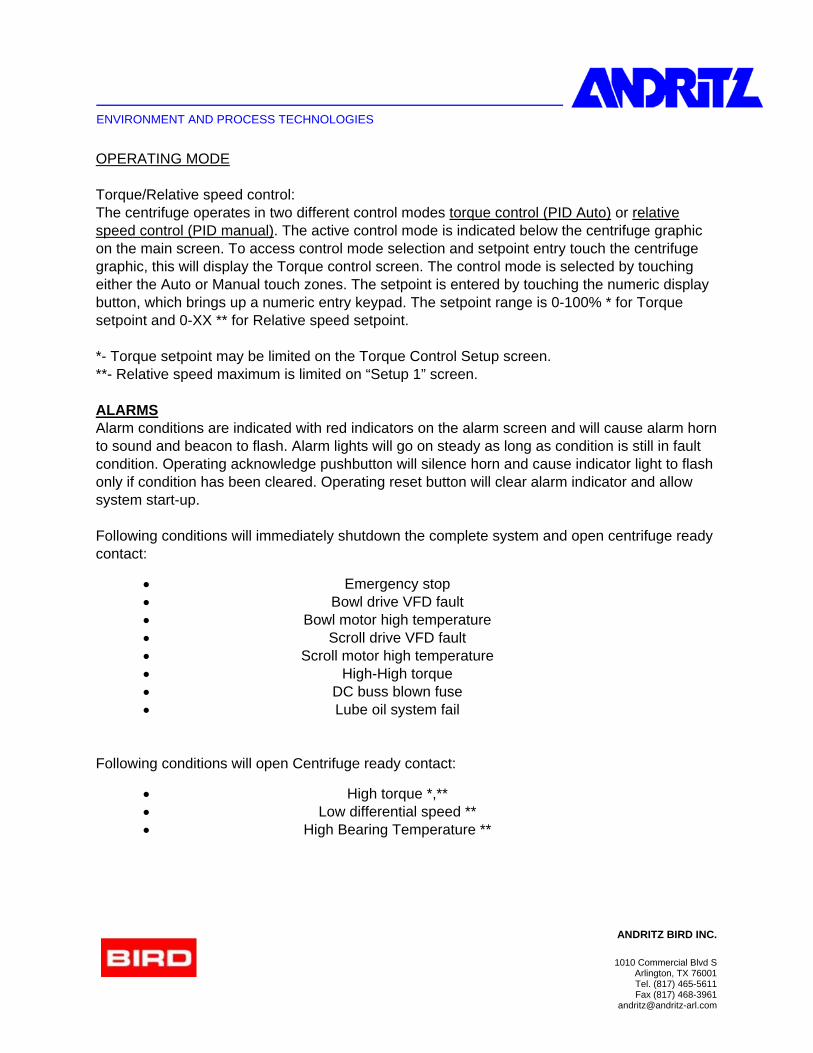
ENVIRONMENT AND PROCESS TECHNOLOGIES
ANDRITZ BIRD INC.
1010 Commercial Blvd S Arlington, TX 76001 Tel. (817) 465-5611 Fax (817) 468-3961
OPERATING MODE Torque/Relative speed control: The centrifuge operates in two different control modes torque control (PID Auto) or relative speed control (PID manual). The active control mode is indicated below the centrifuge graphic on the main screen. To access control mode selection and setpoint entry touch the centrifuge graphic, this will display the Torque control screen. The control mode is selected by touching either the Auto or Manual touch zones. The setpoint is entered by touching the numeric display button, which brings up a numeric entry keypad. The setpoint range is 0-100% * for Torque setpoint and 0-XX ** for Relative speed setpoint. *- Torque setpoint may be limited on the Torque Control Setup screen. **- Relative speed maximum is limited on “Setup 1” screen. ALARMS Alarm conditions are indicated with red indicators on the alarm screen and will cause alarm horn to sound and beacon to flash. Alarm lights will go on steady as long as condition is still in fault condition. Operating acknowledge pushbutton will silence horn and cause indicator light to flash only if condition has been cleared. Operating reset button will clear alarm indicator and allow system start-up. Following conditions will immediately shutdown the complete system and open centrifuge ready contact:
• Emergency stop • Bowl drive VFD fault • Bowl motor high temperature • Scroll drive VFD fault • Scroll motor high temperature • High-High torque • DC buss blown fuse • Lube oil system fail Following conditions will open Centrifuge ready contact:
• High torque *,** • Low differential speed ** • High Bearing Temperature **
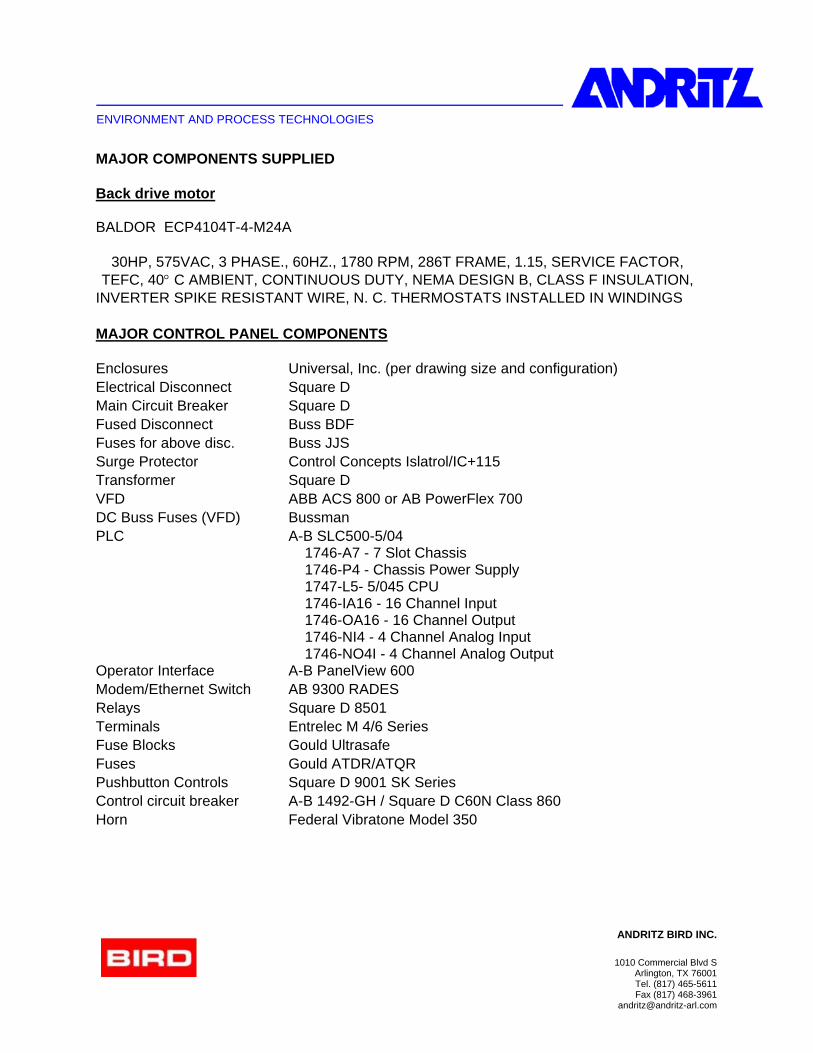
ENVIRONMENT AND PROCESS TECHNOLOGIES
ANDRITZ BIRD INC.
1010 Commercial Blvd S Arlington, TX 76001 Tel. (817) 465-5611 Fax (817) 468-3961
MAJOR COMPONENTS SUPPLIED Back drive motor BALDOR ECP4104T-4-M24A 30HP, 575VAC, 3 PHASE., 60HZ., 1780 RPM, 286T FRAME, 1.15, SERVICE FACTOR, TEFC, 40° C AMBIENT, CONTINUOUS DUTY, NEMA DESIGN B, CLASS F INSULATION, INVERTER SPIKE RESISTANT WIRE, N. C. THERMOSTATS INSTALLED IN WINDINGS MAJOR CONTROL PANEL COMPONENTS Enclosures Universal, Inc. (per drawing size and configuration) Electrical Disconnect Square D Main Circuit Breaker Square D Fused Disconnect Buss BDF Fuses for above disc. Buss JJS Surge Protector Control Concepts Islatrol/IC+115 Transformer Square D VFD ABB ACS 800 or AB PowerFlex 700 DC Buss Fuses (VFD) Bussman PLC
A-B SLC500-5/04 1746-A7 - 7 Slot Chassis 1746-P4 - Chassis Power Supply 1747-L5- 5/045 CPU 1746-IA16 - 16 Channel Input 1746-OA16 - 16 Channel Output 1746-NI4 - 4 Channel Analog Input 1746-NO4I - 4 Channel Analog Output
Operator Interface A-B PanelView 600 Modem/Ethernet Switch AB 9300 RADES Relays Square D 8501 Terminals Entrelec M 4/6 Series Fuse Blocks Gould Ultrasafe Fuses Gould ATDR/ATQR Pushbutton Controls Square D 9001 SK Series Control circuit breaker A-B 1492-GH / Square D C60N Class 860 Horn Federal Vibratone Model 350

ENVIRONMENT AND PROCESS TECHNOLOGIES
ANDRITZ BIRD INC.
1010 Commercial Blvd S Arlington, TX 76001 Tel. (817) 465-5611 Fax (817) 468-3961
The following is a view of the Touch Panel outline for a centrifuge application:
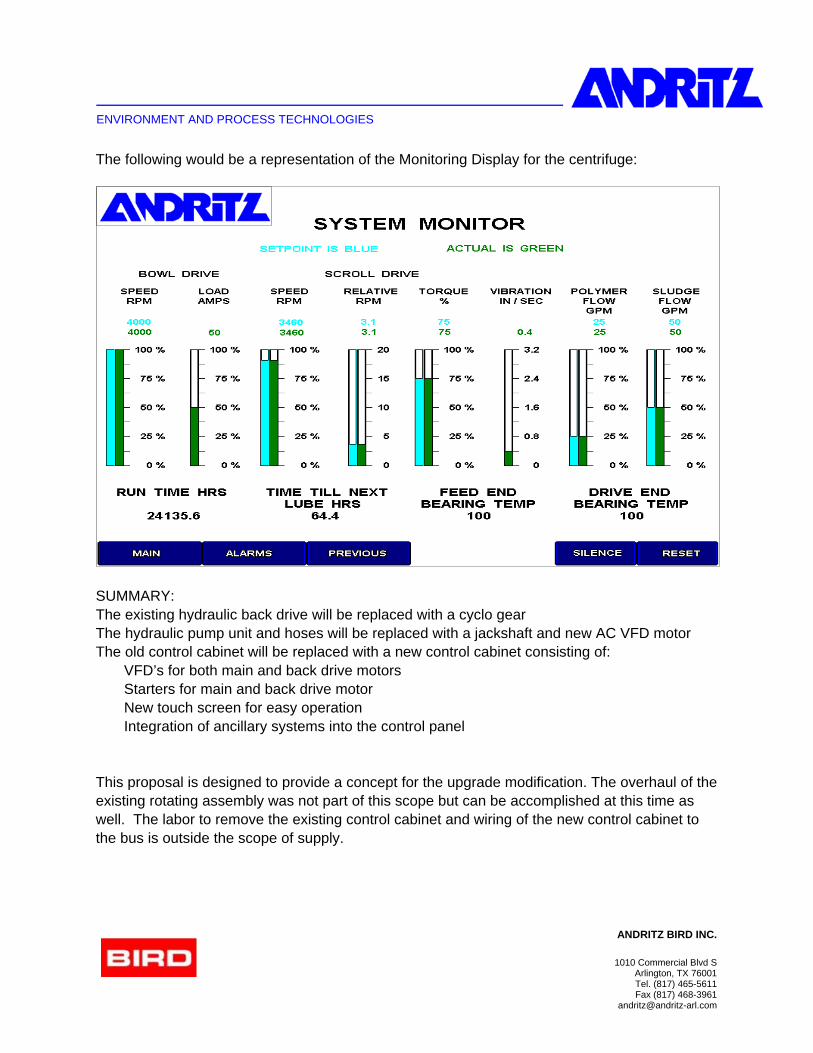
ENVIRONMENT AND PROCESS TECHNOLOGIES
ANDRITZ BIRD INC.
1010 Commercial Blvd S Arlington, TX 76001 Tel. (817) 465-5611 Fax (817) 468-3961
The following would be a representation of the Monitoring Display for the centrifuge:
SUMMARY: The existing hydraulic back drive will be replaced with a cyclo gear The hydraulic pump unit and hoses will be replaced with a jackshaft and new AC VFD motor The old control cabinet will be replaced with a new control cabinet consisting of: VFD’s for both main and back drive motors Starters for main and back drive motor New touch screen for easy operation Integration of ancillary systems into the control panel This proposal is designed to provide a concept for the upgrade modification. The overhaul of the existing rotating assembly was not part of this scope but can be accomplished at this time as well. The labor to remove the existing control cabinet and wiring of the new control cabinet to the bus is outside the scope of supply.

ENVIRONMENT AND PROCESS TECHNOLOGIES
ANDRITZ BIRD INC.
1010 Commercial Blvd S Arlington, TX 76001 Tel. (817) 465-5611 Fax (817) 468-3961
The following is a brief scope of supply for a standard overhaul that would apply: Definition Of Standard Repair: • A standard repair to a centrifuge entails the full dismantle, clean, and inspection to O.E.M.
standards of all critical components. • Critical stress areas of components are checked using nondestructive test procedures. • The re-machining of all close tolerance fit diameters to maintain the required T.I.R. (Total
Indicator Run-out) and fit of the components. • The replacement of all seals, o-rings, bearings, bushings, and fasteners. • The high speed balancing of the Conveyor and Bowl Assemblies. • A four hour acceptance test performed with the Rotating Assembly run dry, then with a flow
of water. This applies for only units were test stand capacity is not an issue. • Any other repair that does not fall within the above description will be defined as an Optional
Repair. See below. Optional Repair:
The price for Optional Repairs is difficult to determine until all components are inspected, and a determination of additional rework is reported. Once a report is compiled, the customer will be notified of the price for the additional rework to the required components.
For budgetary purposed, the price for the installation of the cyclo gear, AC VFD backdrive motor, and new control cabinet is $130,000 ea. If you require the rotating assemblies to be overhauled at the same time, the budget price would be $40,000 ea. If the city elects to perform the upgrade and overhauls and issues a contract for all four centrifuges at the same time. Andritz Bird will apply a 5% discount to the above prices. Andritz Bird would be available to meet to discuss details please feel free to contact Andritz Bird if you have any further questions. Regards, Alan Schnupp Andritz Separation Inc. 12734 Tanner Road Houston, TX 77041 Tel (713) 856-1750 Fax (713) 856-1751 Cell (713) 598-1091 [email protected]

ENVIRONMENT AND PROCESS TECHNOLOGIES
S:\T&Cs\Aftermarket TCs.doc Rev. 2/08
ANDRITZ SEPARATION INC.
STANDARD TERMS AND CONDITIONS OF SALE 1. TERMS APPLICABLE The Terms and Conditions of Sale listed below are the exclusive terms and conditions applicable to quotations made and orders acknowledged by Andritz Separation Inc. ("Seller") for the sales of products, equipment and parts relating thereto ("Products"). This quotation or acknowledgment is expressly made conditional upon Buyer's assent to such terms and conditions. Any of Buyer's terms and conditions which are in addition to or different from those contained herein, which are not separately agreed to by Seller in writing, are hereby objected to and shall be of no effect. Objections to any terms and conditions contained herein shall be deemed waived if Seller does not receive written notice thereof within 20 days of the date of this quotation or acknowledgment. Buyer in any event will be deemed to have assented to the terms and conditions contained herein if delivery of any Product is accepted. The term "this Agreement" as used herein means this quotation or acknowledgment or purchase order, together with any attachment hereto, any documents expressly incorporated by reference and these Standard Terms and Conditions of Sale. 2. DELIVERY Delivery dates are good faith estimates and do not mean that "time is of the essence". Buyer's failure to promptly make advance or interim payments, supply technical information, drawings and approvals will result in a commensurate delay in delivery. Upon and after delivery, title and risk of loss or damage to the Products shall be Buyer's. Unless otherwise agreed in writing by Seller, delivery of the Products hereunder will be made F.O.B., Seller's plant (or F.O.B., point of manufacture for any Product shipped direct to Buyer from any location other than Seller's plant). 3. WARRANTY In the case of the purchase of NEW EQUIPMENT the Seller warrants to Buyer that the NEW EQUIPMENT manufactured by it will be delivered free from defects in material and workmanship. This warranty shall commence upon delivery of the NEW EQUIPMENT to the buyer and shall expire on the earlier to occur of 12 months from initial operation of the NEW EQUIPMENT and 18 months from delivery thereof (the "Warranty Period"). In the case of PARTS or used or reconditioned machinery or equipment, and unless otherwise indicated, Seller warrants to Buyer that the PARTS or the used or reconditioned machinery or equipment manufactured by it will be delivered free from defects in material and workmanship. This warranty shall commence upon delivery of the PARTS or the used or reconditioned machinery or equipment to the buyer and shall expire six (6) months from delivery thereof (the “Warranty Period”). If during the Warranty Period Buyer discovers a defect in material or workmanship and gives Seller written notice thereof within 10 days of such discovery, Seller will, at its option, either deliver to Buyer, F.O.B., point of shipment, a replacement part or repair the defect in place, where applicable. Seller will have no warranty obligations under this paragraph 3(a): (i) if the Products have not been operated and maintained by competent personnel and in accordance with generally approved industry practice and with Seller's specific written instructions; (ii) if the Products are used in connection with any mixture or substance or operating condition other than that for which they were designed; (iii) if Buyer fails to give Seller such written 10 day notice; (iv) if the Products are repaired by someone other than Seller or have been intentionally or accidentally damaged, (v) for corrosion, erosion, ordinary wear and tear or in respect of any parts which by their nature are exposed to severe wear and tear or are considered expendable or (vi) for expenses incurred for work in connection with the removal of the defective articles and reinstallation following repair or replacement. (b) Seller further warrants to Buyer that at delivery, the Products manufactured by it will be free of any liens or encumbrances. If there are any such liens or encumbrances, Seller will cause them to be discharged promptly after notification from Buyer of their existence. (c) THE EXPRESS WARRANTIES SELLER MAKES IN THIS PARAGRAPH 3 ARE THE ONLY WARRANTIES IT WILL MAKE. THERE ARE NO OTHER WARRANTIES, WHETHER STATUTORY, ORAL, EXPRESS OR IMPLIED. IN PARTICULAR, THERE ARE NO IMPLIED WARRANTIES OF MERCHANTABILITY OR FITNESS FOR A PARTICULAR PURPOSE. (d) The remedies provided in paragraphs 3(a) and 3(b) are Buyer's exclusive remedy for breach of warranty. (e) With respect to any Product or part thereof not manufactured by Seller, Seller shall pass on to Buyer only those warranties made to Seller by the manufacturer of such Product or part which are capable of being so passed on. 4. LIMITATION OF LIABILITY The remedies of Buyer set forth herein are exclusive and the aggregate liability of Seller and its affiliated companies or subcontractors for any claim of any kind for any loss or damage resulting from, arising out of or connected with this Agreement or from the performance or breach thereof, or from the manufacture, sale, delivery, resale, repair or use of any Product, whether based on contract, warranty, tort (including negligence), fault, strict liability, indemnity, or otherwise, shall in no event exceed the price allocable to Product which gave rise to the claim. In no event shall Seller or its affiliated companies or subcontractors be liable to Buyer or any party for special, incidental or consequential damages of any nature or for loss of profits or revenue or business opportunity, loss by reason of shutdown of facilities or inability to operate any facility at full capacity, or for increased expenses of plant operations. All liability of Seller under this Agreement for any claim of any kind shall terminate on that date which is the third anniversary of the date of this Agreement. The provisions of this Paragraph 4 shall supersede any inconsistent provisions in any instrument forming part of this Agreement. 5. TAXES Seller's prices do not include any sales, use, excise or other taxes. In addition to the price specified herein, the amount of any present or future sales, use, excise or other tax applicable to the sale or use of the Products shall be billed to and paid by Buyer unless Buyer provides to Seller a tax-exemption certificate acceptable to the relevant taxing authorities. 6. SECURITY INTEREST Seller shall retain a purchase money security interest and Buyer hereby grants Seller a lien upon and security interest in the Products until all payments hereunder have been made in full. Buyer acknowledges that Seller may file a Form UCC-1 financing statement and may take all other action it deems reasonably necessary to perfect and maintain such security interest in Seller and to protect Seller's interest in the Products. 7. SET OFF Neither Buyer nor any of its affiliates shall have any right to set off claims against Seller or any of its affiliates for amounts owed under this Agreement or otherwise. 8. PATENTS Unless the Products or any part thereof are designed to Buyer's specifications and provided the Product or any part thereof is not used in any manner other than as specified or approved by Seller in writing, (i) Seller shall defend against any suit or proceeding brought against Buyer to the extent based on a claim that any Product, or any part thereof, infringes any United States device patent; provided Seller is notified promptly in writing and given the necessary authority, information and assistance for the defense of such suit or proceeding; (ii) Seller shall satisfy any judgment for damages entered against Buyer in such suit; and (iii) if such judgment enjoins Buyer from using any product or a part thereof, then Seller shall, at its option: (a) obtain for Buyer the right to continue using such Product or part; (b) eliminate the infringement by replacing or modifying all or part of the Products; or (c) take back such Product or part and refund to Buyer all payments on the purchase price which Seller has received, in which case neither Buyer nor Seller will have any claim against the other under this Agreement or arising out of the subject matter of this Agreement. The foregoing states Seller's entire liability for patent infringement by any Product or part thereof. 9. TERMINATION Buyer may only terminate its order upon written notice to Seller and upon payment to Seller of Seller's termination charges, which shall be specified to Buyer and shall take into account among other things expenses (direct and indirect) incurred and commitments already made by Seller and an appropriate profit; provided, that in no event shall Seller’s termination charges be less than 25% of the contract price. In the event of the bankruptcy or insolvency of Buyer or in the event of any bankruptcy or insolvency proceeding brought by or against Buyer, Seller shall be entitled to terminate any order outstanding at any time during the period allowed for filing claims against the estate and shall receive reimbursement for its cancellation charges.
10. CHANGES Seller will not make changes in the Products unless Buyer and Seller have executed a written Change Order for such change. Such Change Order will include an appropriate adjustment to price and delivery terms. If the change impairs Seller's ability to satisfy any of its obligations to Buyer, the Change Order will include appropriate modifications to this Agreement. If, after the date of this quotation or acknowledgment, new or revised governmental requirements should require a change in the Products, the change will be subject to this paragraph 10. 11. CONFIDENTIALITY Buyer acknowledges that the information which Seller submits to Buyer in connection with this quotation or acknowledgment includes Seller's confidential and proprietary information, both of a technical and commercial nature. Buyer agrees not to disclose such information to third parties without Seller's prior written consent. Seller grants to Buyer a non-exclusive, royalty-free, perpetual license to use Seller’s confidential and proprietary information for purposes of this specific order and the Products that are the subject hereof only. Buyer further agrees not to permit any third party to fabricate the Products or any parts thereof from Seller's drawings or to use the drawings other than in connection with this specific order. Buyer will defend and indemnify Seller from any claim, suit or liability based on personal injury (including death) or property damage related to any Product or part thereof which is fabricated by a third party without Seller's prior written consent and from and against related costs, charges and expenses (including attorneys fees). All copies of Seller's drawings shall remain Seller's property and may be reclaimed by Seller at any time. 12. END USER If Buyer is not the end user of the Products sold hereunder (the "End User"), then Buyer will use its best efforts to obtain the End User's written consent to be bound to Seller by the provisions of paragraphs 3, 4, 5 and 11 hereof. If Buyer does not obtain such End User's consent, Buyer shall defend and indemnify Seller and Seller's agents, employees, subcontractors and suppliers from any action, liability, cost, loss, or expense for which Seller would not have been liable or from which Seller would have been indemnified if Buyer had obtained such End User's consent. 13. FORCE MAJEURE (a) Force Majeure Defined. For the purpose of this Agreement "Force Majeure" will mean all unforeseeable events, beyond the reasonable control of either party which affect the performance of this Agreement, including, without limitation, acts of God, acts or advisories of governmental or quasi-governmental authorities, laws or regulations, strikes, lockouts or other industrial disturbances, acts of public enemy, wars, insurrections, riots, epidemics, pandemics, outbreaks of infectious disease or other threats to public health, lightning, earthquakes, fires, storms, severe weather, floods, sabotage, delays in transportation, rejection of main forgings and castings, lack of available shipping by land, sea or air, lack of dock lighterage or loading or unloading facilities, inability to obtain labor or materials from usual sources, serious accidents involving the work of suppliers or sub-suppliers, thefts and explosions. (b) Suspension of Obligations. If either Buyer or Seller is unable to carry out its obligations under this Agreement due to Force Majeure, other than the obligation to make payments due hereunder, and the party affected promptly notifies the other of such delay, then all obligations that are affected by Force Majeure will be suspended or reduced for the period of Force Majeure and for such additional time as is required to resume the performance of its obligations, and the delivery schedule will be adjusted to account for the delay. (c) Option to Terminate. If the period of suspension or reduction of operations will extend for more than four (4) consecutive months or periods of suspension or reduction total more than six (6) months in any twelve (12) month period, then either Buyer or Seller may terminate this Agreement. 14. INDEMNIFICATION AND INSURANCE (a) Indemnification. Seller agrees to defend and indemnify Buyer from and against any third-party claim for bodily injury or physical property damage ("Loss") arising in connection with the goods provided by Seller hereunder or the Work performed by Seller hereunder, but only to the extent such Loss has been caused by the negligence, willful misconduct or other legal fault ("Fault") of Seller. Buyer shall promptly tender the defense of any such third-party claim to Seller. Seller shall be entitled to control the defense and resolution of such claim, provided that Buyer shall be entitled to be represented in the matter by counsel of its choosing at Buyer’s sole expense. Where such Loss results from the Fault of both Seller and Buyer or a third party, then Seller’s defense and indemnity obligation shall be limited to the proportion of the Loss that Seller’s Fault bears to the total Fault. (b) Insurance. Seller shall maintain commercial general liability insurance with limits of not less than $2,000,000 per occurrence and in the aggregate covering claims for bodily injury (including death) and physical property damage arising out of the Work. Seller shall also provide workers’ compensation insurance or the like as required by the laws of the jurisdiction where the Work will be performed, and owned and non-owned auto liability insurance with limits of not less than $1,000,000 combined single limit. Buyer shall be designated as an additional insured under Seller’s commercial general liability insurance and auto liability insurance coverages, and Seller will provide a Certificate of Insurance certifying the existence of such coverages upon request. 15. GENERAL (a) Seller represents that any Products or parts thereof manufactured by Seller will be produced in compliance with all applicable Federal, State and local laws applicable to their manufacture and in accordance with Seller's engineering standards. Seller shall not be liable for failure of the Products to comply with any other specifications, standards, laws or regulations. (b) This Agreement shall inure only to the benefit of Buyer and Seller and their respective successors and assigns. Any assignment of this Agreement or any of the rights or obligations hereunder, by either party without the written consent of the other party shall be void. (c) This Agreement contains the entire and only agreement between the parties with respect to the subject matter hereof and supersedes all prior oral and written understandings between Buyer and Seller concerning the Products, and any prior course of dealings or usage of the trade not expressly incorporated herein. (d) This Agreement (including these standard terms and conditions of sale) may be modified, supplemented or amended only by a writing signed by an authorized representative of Seller. Seller’s waiver of any breach by Buyer of any terms of this Agreement must also be in writing and any waiver by Seller or failure by Seller to enforce any of the terms and conditions of this Agreement at any time, shall not affect, limit or waive Seller’s right thereafter to enforce and compel strict compliance with every term and condition thereof. (e) This Agreement and the performance thereof will be governed by and construed according to the laws of the State of Texas. The parties hereto irrevocably submit to the jurisdiction of the appropriate state and federal courts sitting in the State of Texas and waive any claims as to inconvenient forum. In the event this Agreement pertains to the sale of any goods outside the United States, the parties agree that the United Nations Convention for the International Sale of Goods shall not apply to this Agreement.

APPENDIX I
APPENDIX I
APPENDIX I
BELT FILTER PRESSES
ASHBROOK SIMON-HARTLEY BFP PROPOSAL

November 13, 2008 HDR Inc. Texarkana Water Utilities P.O. Box 2008 Texarkana, TX 77504-2008 Attention: Lee Cronister Reference: Budget Rebuild Proposal for Belt Filter Press (1) Klampress Mark II Size 3 (2.0 meter) Quote# 2003-7517 Rev. 1 Dear Mr. Cronister, Ashbrook Simon-Hartley (“Ashbrook”) is pleased to offer its budget proposal on new upgrade replacement parts and factory machine reconditioning for the above referenced location. Ashbrook's experience in designing and building new belt filter presses and repairing/rebuilding earlier model belt filter presses, can only enhance our position in offering the services and parts needed to provide additional years of service to your Ashbrook Klampress. Ashbrook started its "Rebuild Program" to provide customers with "today's technology" on earlier model belt filter presses as an alternative to purchasing new replacement equipment. Over the past fifteen years Ashbrook Simon-Hartley has completed rebuild projects consisting of partial site repairs, complete site machine reconditioning, complete factory machine reconditioning, partial factory machine reconditioning and site machine upgrades. Equipment on these projects included Bellmer Winklepresses (German), English Belt Filter Presses, Ashbrook's MKII & Type 85 Klampresses, and other Belt Filter Presses. All parts supplied by Ashbrook for reconditioning your machine(s), shall meet Ashbrook’s latest O.E.M. design standards. All parts will be made to Ashbrook’s standard level of quality under ISO9001 certified procedures. All labor shall be performed by qualified Ashbrook trained service technicians who are experienced in the disassembly/reassembly of the Klampress. Scope of Supply: Recondition one (1) Klampress Mark II Size 3 (2.0 meter) at Ashbrook’s factory. Ashbrook's scope for reconditioning the Klampress includes using only new O.E.M. (Original Equipment Manufacturer) parts, removal/installation, inbound/outbound freight charges and start-up services. Ashbrook will provide freight carrier to transport machine between job site and Ashbrook’s factory. Ashbrook shall be responsible for removing the belt press and reinstalling the belt press after factory rebuild is complete.
11600 East Hardy Houston, TX 77093
(800)362-9041

“Budget Proposal – Texarkana, TX” Page 2 of 5
Some of the items listed below consist of new machine upgrades designed to both enhance your machine’s performance and lower its operational and maintenance costs. Klampress Rebuild: QUANTITY DESCRIPTION Rebuild one (1) Klampress Mark II Size 3 (2.0 meter). The list below details
the labor, parts and service that shall be provided on this project.
(1) Regalvanizing of carbon steel main frame and all other carbon steel components on the machine.
(1) Clean and sugar-blast all existing drain pans.
Complete set of new 2 9/16” stub shaft/forged end rollers consisting of the following:
(6) 8" Plain rollers (steering/guide) (2) 12" Drive rollers (4) 12" Plain pressure rollers (1) 12” Perforated roller (1) 6” Guide rollers
Drive rollers shall be coated with ¼” Buna-N rubber. All other rollers coated with 30 mils of thermoplastic nylon. The new Ashbrook rollers shall be warranted for a period of three (3) years against failure from defects in material and workmanship under normal use and service when used and maintained per Ashbrook’s published operation and maintenance procedures.
(28) New Ashbrook/Dodge 2 9/16” bearing housing assemblies. New Ashbrook/Dodge bearing assemblies consist of housing, triple labyrinth seal, bearing with steel bronze machined cage, 316 stainless steel hardware and taper lock nut assembly. Housings will be nylon coated for maximum protection against corrosion. Housing shall have a triple labyrinth seal for superior sealing against contaminants. Greasing intervals every 6 months. Bearing assemblies are warranted for 5 years as long as assemblies are maintained per Ashbrook’s published operation and maintenance procedures.
(1) Lot New 316 stainless steel mounting hardware for Ashbrook/Dodge bearing
assemblies.

“Budget Proposal – Texarkana, TX” Page 3 of 5
QUANTITY DESCRIPTION
(1) New 1.5” Guide roller (Buna-N rubber coated) with new flanged bearings. (1) Lot Replace worn electrical switches (no cake, belt misalignment and belt
breakage switches). (1) New emergency trip cord assembly consisting of trip cord switch,
galvanized guide cable brackets, pull cable, switch support bracket and 316 stainless steel mounting hardware.
(4) Replace worn hydraulic cylinders with new fiberglass steering and tensioning
cylinders. New hydraulic cylinders shall have fiberglass outer casing, laminated phenolic heads, stainless steel tie rods and 316 stainless steel piston rods.
(4) New steering pivot plate assemblies.
(1) Lot Install new complete hydraulic system. New hydraulic system shall
consist of new tensioning valve, 316 stainless steel rigid tubing and fittings and new 316 stainless steel steering valves/paddle. New valves warranted for 5 years.
(1) New single stage press mounted hydraulic unit for control of the automatic
steering and tensioning systems on the belt press. Unit will include new one gallon hydraulic reservoir, pump and motor assembly. All tubing connecting the hydraulic unit will be stainless steel. Complete replacement of the existing 20 gallon unit.
(1) New set of main drive bull gears. New secondary pinion gear and drive
bushings 2 9/16”. (2) Spray shower washbar brushes. (44) New spray nozzle assemblies. Nozzle assemblies consist of spray nozzles,
gaskets and retaining rings. (2) New 316 stainless steel washbox assemblies with adjustable panels. (Note
assemblies do not include wash tubes). (1) New upper and lower gravity deck assemblies. Includes new grid frames,
brackets, hardware and replacement of poly wear bars (UHMWPE) on upper and lower gravity section.

“Budget Proposal – Texarkana, TX” Page 4 of 5
QUANTITY DESCRIPTION
(1) New adjustable wedge plate/scraper assembly. Wedge plate shall be
adjustable to vary the pressure applied to the sludge prior to the shear/pressure section of the machine. Wedge plate shall be fabricated from A-36 carbon steel then nylon coated.
(2) New adjustable scraper blade assemblies. (2) Install new tension yoke bearings.
(1) Lot Install new rubber seals on washboxes, gravity and wedge section sludge
restrainers. (1) Site labor for disassembly/assembly.
(1) Inbound/outbound freight charges. (Offloading to be by others).
Total Budget Sell Price per Klampress: $160,000.00, F.O.B. Origin with freight allowed to jobsite. Adder: 1.) New K87 gear reducer and 5hp D.C motor. Complete replacement of existing gear box unit and D.C drive motor. Total Budget sell price per K87 Drive Assembly: $ 8,505.00. 2.) New Ashbrook Gravity Retrofit Extension consisting of the following. Pricing below only good if purchased with the above rebuild.
New set of filter belts. New set of frame and cross members fabricated from A-36 carbon steel. Parts coated
with hot dip galvanizing. New 316 stainless steel gravity and wedge section drain trays. New drainage piping
Sch 40 PVC. New 316 stainless steel tension drip tray. New gravity and wedge section grid extensions with poly wear bars. Grid weldments
fabricated from 316 stainless steel. New 316 stainless steel upper sludge restrainer extensions. Lot new 316 stainless steel mounting hardware for all new parts. New chicane assemblies (4 rows) for new upper extended gravity section. Assemblies
shall consist of: carbon steel galvanized chicane rod castings and chicane blade

“Budget Proposal – Texarkana, TX” Page 5 of 5
castings, poly blades, 316 stainless steel set collars and 316 stainless steel hardware. Rubber seal for extended gravity/wedge sludge restrainers.
Total Budget Sell Price per Gravity Retrofit Extension: $ 15,000.00 . Terms and Conditions: Shipment of Klampress can be made within 8-10 weeks after belt press has arrived at Ashbrook’s factory. Invoice(s) are due after receipt of parts on site and/or after completion of site work. Payment terms are net 30 days. Ashbrook’s “Standard Terms and Conditions” are enclosed and apply in their entirety. Customer shall be responsible for loading and off loading of belt press at job site and placing crates in the work area adjacent to the machine where work will be performed. Customer electrician shall be responsible for disconnecting and reconnecting all electrical conduit and wiring. Ashbrook Simon-Hartley will warrant, unless otherwise indicated, the new parts, of its own manufacture, for a period of (1) one year from date of delivery. Ashbrook's obligation under this warranty being limited to repairing or replacing, at its option, any part found to its satisfaction to be so defective, provided that such part is, upon request, returned to Ashbrook's factory, freight prepaid. This warranty does not cover parts damaged by decomposition from chemical reaction or wear caused by abrasive materials, nor does it cover damage resulting from misuse, accident, neglect, or from improper operation, maintenance, modification or adjustment. The quoted pricing does not include any state prevailing wage rate requirements. Pricing is subject to review and adjustment if project must meet prevailing wage rate requirements. The quoted prices do not include any bonding, local, state or federal taxes, permits or other fees. Any bonding, taxes or fees that may apply must be added to the quoted price and paid by the buyer. This proposal is offered for acceptance within sixty (60) days from date of quotation. Prices are subject to review thereafter. Prices are firm, based upon receipt of Letter of Intent or Purchase Order and notice to proceed within this sixty (60) day period. We wish to thank you for the opportunity to provide this budget rebuild proposal. Should you have any questions, please feel free to contact the factory (800) 362-9041. Best regards, Larry Packard Larry Packard Retrofit/Rebuild Manager cc: Paul Bland / Ashbrook Bill Noxon / Ashbrook

APPENDIX J
APPENDIX J
APPENDIX J
DISCHARGE PERMIT
