south puget sound regional background - fortress.wa.gov · south puget sound regional background:...
TRANSCRIPT

South Puget Sound Regional
Background
Final Data Evaluation and Summary Report
May 2018 Publication no. 18-09-117

Publication and Contact Information
This report is available on the Department of Ecology’s website at https://fortress.wa.gov/ecy/gsp/DocViewer.ashx?did=74297
For more information contact: Toxics Cleanup Program P.O. Box 47600 Olympia, WA 98504-7600
Phone: 800-826-7716
Washington State Department of Ecology - www.ecy.wa.gov
o Headquarters, Olympia 360-407-6000
o Northwest Regional Office, Bellevue 425-649-7000
o Southwest Regional Office, Olympia 360-407-6300
o Central Regional Office, Yakima 509-575-2490
o Eastern Regional Office, Spokane 509-329-3400 Accommodation Requests: To request ADA accommodation including materials in a format for the visually impaired, call Ecology at 800-826-7716. Persons with impaired hearing may call Washington Relay Service at 711. Persons with speech disability may call TTY at 877-833-6341.


South Puget Sound
Regional Background
Final Data Evaluation and Summary Report
Washington State Department of Ecology
Toxics Cleanup Program
Olympia, WA
Teresa Michelsen, Farallon Consulting, L.L.C
Will Hafner, NewFields
Lorraine Read, TerraStat Consulting Group

South Puget Sound Regional Background: Data Evaluation & Summary Report
Washington State Department of Ecology i Publication No. 18-09-117
Table of Contents Page
List of Tables ..................................................................................................................... iii
List of Figures .................................................................................................................... iii
Acknowledgments.............................................................................................................. iv
Acronyms and Abbreviations ..............................................................................................v
1.0 Introduction ...........................................................................................................1 1.1 Regional Background...............................................................................................1
1.2 South Puget Sound Regional Background ...............................................................2
2.0 Conceptual Model .................................................................................................5
2.1 Geography and Land Use .................................................................................5 2.2 Hydrology and Bathymetry..............................................................................7 2.3 Sedimentation, Grain Size, and Organic Carbon .............................................8 2.4 Unrepresentative Areas ....................................................................................9
2.5 Sites and Sources ...........................................................................................10 2.5.1 Oakland Bay ...............................................................................................10
2.5.2 Budd Inlet...............................................................................................11 2.5.3 Henderson Inlet and Other Areas ...........................................................14
2.6 Regional Background Data Sets ....................................................................14
2.6.1 cPAHs ....................................................................................................15 2.6.2 Dioxins/furans ........................................................................................16
3.0 Data Screening and Analysis ...............................................................................19
3.1 Quality Control/Assurance.............................................................................19
3.1.1 Data Recency .........................................................................................19 3.1.2 Detection Limits.....................................................................................19 3.1.3 Depths, Time Series, and Replicates......................................................19
3.2 Statistical Analysis ........................................................................................20 3.2.1 cPAH and Dioxin/Furan TEQ Summing ...............................................20
3.2.2 Sample Independence ............................................................................20 3.2.3 Identification of Subpopulations and Outliers .......................................21 3.2.4 Precision .................................................................................................22
4.0 Regional Background Concentrations .................................................................23 4.1 Data Distributions ..........................................................................................23
4.2 South Puget Sound Regional Background Values .........................................23
5.0 References ...........................................................................................................24
Tables .................................................................................................................................27
Figures................................................................................................................................29
Appendix A. Data Tables ..................................................................................................43
Appendix B. Statistical Methods and Analysis Used to Characterize the South Puget Sound
Regional Background Data Set ..........................................................................................70

South Puget Sound Regional Background: Data Evaluation & Summary Report
Washington State Department of Ecology ii Publication No. 18-09-117
B.1 Introduction ....................................................................................................70
B.2 Methods..........................................................................................................70 B.2.1 Outlier Analysis .....................................................................................71 B.2.2 Autocorrelation Analysis ......................................................................71
B.2.3 Population Separation ...........................................................................72 B.3 Results ............................................................................................................73
B.3.1 Outlier Identification .............................................................................73 B.3.2 Autocorrelation Distance ......................................................................73 B.3.3 Population Separation ...........................................................................74

South Puget Sound Regional Background: Data Evaluation & Summary Report
Washington State Department of Ecology iii Publication No. 18-09-117
List of Tables
Table 1: Summary statistics and precision for South Puget Sound regional background data sets.
List of Figures
Figure 1: South Puget Sound
Figure 2: Circulation in Budd Inlet
Figure 3: Total Organic Carbon
Figure 4: Percent Fines
Figure 5: Sites and Sources
Figure 6: Initial cPAH Data Set
Figure 7: Final cPAH Data Set
Figure 8: Initial Dioxin/Furan Data Set
Figure 9: Dioxin/Furan Factor Concentrations
Figure 10: Dioxin/Furan Factor Relative Percentages
Figure 11: Final Dioxin/Furan Data Set

South Puget Sound Regional Background: Data Evaluation & Summary Report
Washington State Department of Ecology iv Publication No. 18-09-117
Acknowledgments
The Department of Ecology (Ecology) would like to thank the following authors of this report:
Teresa Michelsen, Farallon Consulting, L.L.C.
Will Hafner, NewFields
Lorraine Read, TerraStat Consulting Group
Ecology would like to thank the following for their significant and expert analytical and
technical support to this study:
Connie Groven, Ecology
Pete Striplin, Ecology
Chance Asher, Ecology
Russ McMillan, Ecology
Laura Inouye, Ecology
Leon Delwiche, NewFields

South Puget Sound Regional Background: Data Evaluation & Summary Report
Washington State Department of Ecology v Publication No. 18-09-117
Acronyms and Abbreviations
AICc Aikake Information Criterion
COCs contaminants of concern
cPAH carcinogenic polycyclic aromatic hydrocarbon
CSL Cleanup Screening Level
Ecology Washington State Department of Ecology
EIM Environmental Information Management System
EM expectation-maximization
i.i.d independently and identically distributed
KM Kaplan-Meier
LOTT Lacey, Olympia, Tumwater, and Thurston County [Wastewater Treatment Plant]
m meter
NADA Nondetects and Data Analysis statistical software package
ng/kg nanograms per kilogram
PCB polychlorinated biphenyl
PQL practical quantitation limit
ProUCL statistical software package for analyzing environmental data sets
QQ Quantile-Quantile
SCO sediment cleanup objective
SCUM II Sediment Cleanup User’s Manual II
SD standard deviation
SMS Sediment Management Standards
SVOCs semivolatile organic compounds
TBT tributyltin
TEC toxic equivalent concentration
TEQ toxic equivalent quotient
TOC total organic carbon
UCL upper confidence limit
µg/kg micrograms per kilogram
UTL upper tolerance limit
WAC Washington Administrative Code
South Puget Sound Regional Background: Data Evaluation & Summary Report
Washington State Department of Ecology 1 Publication No. 18-09-117
1.0 Introduction
In early 2013, the Washington State Department of Ecology (Ecology) revised the Sediment
Management Standards (SMS) (Chapter 173-204 WAC) to establish a new framework for
identifying and cleaning up contaminated sediment sites. A key component of this framework is
the concept of regional background sediment concentrations, which can serve as the Cleanup
Screening Level (CSL) for sediment sites. During the rule revision, the advisory group
recommended that Ecology be responsible for establishing regional background sediment
concentrations for areas of the state. This report provides Ecology’s evaluation of existing data
for South Puget Sound to establish regional background.
1.1 Regional Background
For a number of bioaccumulative chemicals, risk-based values protective of human health and
upper trophic levels fall below the natural and regional background concentrations defined in the
SMS (WAC 173-204-505). Sediments receive chemical inputs from hundreds of potential
sources, including a mix of permitted and unpermitted stormwater, atmospheric deposition, and
current and historical releases from industrial activities. In urban areas with developed
shorelines, chemical concentrations in sediment are frequently higher than natural background
concentrations.
The SMS rule includes a two-tiered framework used to establish sediment cleanup levels.
It incorporates natural background as one component of the Sediment Cleanup Objective (SCO),
and regional background as one component of the CSL. The SMS rule provides a definition for
regional background in WAC 173-204-505(16) and parameters for establishing it in WAC 173-
204-560(5):
“Regional Background” means the concentration of a contaminant within a
department defined geographic area that is primarily attributable to diffuse
sources, such as atmospheric deposition or storm water, not attributable to a
specific source or release.
The SMS provides flexibility in establishing regional background on a case-by-case basis and
does not prescribe specifically how regional background should be established. Ecology’s
approach to establishing regional background has evolved over time by working on various areas
and receiving comments from numerous stakeholders and tribes. Current guidance for
establishing regional background is based on these discussions.

South Puget Sound Regional Background: Data Evaluation & Summary Report
Washington State Department of Ecology 2 Publication No. 18-09-117
Ecology has established regional background concentrations for Port Gardner, Bellingham Bay,
and the North Olympic Peninsula (Ecology 2014, 2015b, 2016) using methods that rely primarily
on collecting new data. However, SCUM II also allows regional background to be established
using existing data if the data are sufficient and statistically robust. A regional background
concentration for cPAHs has been developed for the Lake Washington Area using existing data
(Ecology 2017). Based on the Lake Washington Area approach, Chapter 10 in SCUM II
(Ecology 2015a) is being revised to include an updated summary of the recommended approach
for using existing data to calculate regional background concentrations, along with important
limitations for using this approach.
In addition, in cases where an entire water body may be directly influenced by identifiable sites
and sources, the SMS includes a provision to establish regional background using data from an
alternative but similar geographic area(s) that is not directly influenced by known sources as a
substitute:
WAC 173-204-560 (5)(f): If a water body is not beyond the direct influence of
a significant contaminant source, the department may use alternative
geographic approaches to determine regional background for a contaminant.
Several factors must be evaluated when determining an alternate geographic
approach including:
(i) Proximity of sampling to the site;
(ii) Similar geologic origins as the site sediment;
(iii) Similar fate and transport and biological activities as the site; and
(iv) Chemical similarity with the site.
This approach was used in both the North Olympic Peninsula and Lake Washington Area
approaches to calculate regional background for a larger area than would otherwise have been
possible.
1.2 South Puget Sound Regional Background
This report establishes regional background concentrations for dioxins/furans and cPAHs in
South Puget Sound using existing data. Existing data were analyzed from portions of South
Puget Sound (see Section 2), including:
Henderson Inlet
Budd Inlet (Olympia)
Eld Inlet
Totten Inlet
South Puget Sound Regional Background: Data Evaluation & Summary Report
Washington State Department of Ecology 3 Publication No. 18-09-117
Oakland Bay (Shelton)
These inlets in the South Puget Sound are geographically proximate and have similar fjord-like
hydrogeologic and biological characteristics. The bays have been impacted by similar regional
stormwater runoff and atmospheric deposition sources.
After analyzing this existing data set, Ecology determined that sufficient data were available to
evaluate whether regional background could be established for dioxins/furans and cPAHs.
However, there are insufficient congener data for PCBs to calculate regional background.
Metals and other chemicals were not evaluated.
Ecology has determined that regional background generally applies to the following areas in
South Puget Sound as follows (Figure 1):
For cPAHs and dioxins/furans:
o Budd Inlet (Olympia)
o Shelton Harbor in Oakland Bay
For dioxins/furans only:
o Oakland Bay outside Shelton Harbor
Ecology will consider whether regional background for dioxins/furans and cPAHs applies to
other areas of South Puget Sound on a site-specific basis. Some of the more undeveloped areas
within South Puget Sound area may have ambient sediment concentrations closer to natural
background (SCUM II, Table 10-1). For example, existing data in Oakland Bay outside of
Shelton Harbor shows that ambient sediment concentrations for cPAHs are near natural
background. In the event that a cleanup site is identified in these areas, Ecology will likely
require data to be collected during the remedial investigation to determine whether natural or
regional background applies.
The SMS rule allows Ecology to determine if regional background can be used as a sediment
cleanup level for a particular site (WAC 173-204-560) as follows:
When setting site-specific sediment cleanup levels, the SCO and CSL are first identified.
Natural and regional background are one component of determining the SCO and CSL,
respectively (WAC 173-204-560(3) – (4)).
The sediment cleanup level is initially set at the SCO (which may be natural background)
and can be adjusted upwards to the CSL (which may be regional background).

South Puget Sound Regional Background: Data Evaluation & Summary Report
Washington State Department of Ecology 4 Publication No. 18-09-117
This upwards adjustment from the SCO is based upon whether:
o It is technically possible to meet and maintain the sediment cleanup level (WAC
173-204-560(a)(i)(A)). This decision can be informed by the potential for
recontamination by ambient sediment concentrations that are not part of the site
(SCUM II Chapter 7, subsection 7.2.3).
o Meeting the cleanup level will have a net adverse environmental impact (WAC
173-204-560(a)(i)(B); SCUM II Chapter 7, subsection 7.2.3).
If a cleanup site is located in an area with ambient sediment concentrations near natural
background, Ecology may determine that an upwards adjustment of the sediment cleanup level is
not appropriate due to the high potential of meeting and maintaining the sediment cleanup level
at the SCO.

South Puget Sound Regional Background: Data Evaluation & Summary Report
Washington State Department of Ecology 5 Publication No. 18-09-117
2.0 Conceptual Model
Existing data were reviewed within South Puget Sound to evaluate regional background
concentrations, including data from areas surrounding Squaxin Island, south of Harstine Island,
and five fjord-like inlets that are hydrologically connected to this central area (Figure 1):
Hammersley Inlet and Oakland Bay, including the Shelton waterfront,
Totten Inlet and Oyster Bay,
Eld Inlet,
Budd Inlet, including the Olympia waterfront, and
Henderson Inlet.
Concentrations of PAHs above natural background have been measured in areas of all five inlets.
Dioxin/furan concentrations were also elevated above natural background in Oakland Bay and
Budd Inlet, the only inlets for which there were data. The central areas had few data with
varying concentrations, some within natural background and some somewhat elevated.
The following conceptual model describes features of the South Puget Sound area and the
screening process that was used to identify the regional background data sets for dioxins/furans
and cPAHs. These data were subjected to further statistical tests and evaluations described in
Section 3.
2.1 Geography and Land Use
The five inlets included in the South Puget Sound area are fjord-like inlets formed by glaciation,
surrounded by relatively low-elevation topography in the former glacial basin. The inlets are
generally long, narrow, and shallow, and have extensive mudflats near their headwaters. The
majority of the shorelines surrounding the inlets are residential, forested, agricultural, or
recreational, with occasional smaller commercial and industrial businesses. Oakland Bay,
Hammersley Inlet, and the northwestern portion of Totten Inlet are located in Mason County,
while the southeastern portion of Totten Inlet, Eld Inlet, Budd Inlet, and Henderson Inlet are
located in Thurston County.
Larger cities include Shelton, located on the west end of Oakland Bay, and Olympia, at the head
of Budd Inlet, which both have commercial and industrial areas along their inner harbors.
Residential areas of Olympia and Lacey extend to the western shoreline of Eld Inlet and the
southern portion of Henderson Inlet. Highway 101 runs northwest from Olympia and crosses the
southwestern ends of Eld and Totten Inlets, and State Route 3 runs along the length of Oakland
Bay to the northeast.

South Puget Sound Regional Background: Data Evaluation & Summary Report
Washington State Department of Ecology 6 Publication No. 18-09-117
Shelton’s downtown area lies to the west of Shelton Harbor. Historical and current land uses in
Shelton Harbor have been industrial, centering on wood products industries such as sawmills;
plywood, insulation board, and fiberboard manufacturing; pulp and paper mills; and log rafting,
log transfer, and chip loading operations. Other industries currently or historically present in the
harbor include a wastewater treatment plant, a bulk fuel facility, fueling stations, a marine
railway, a marina, and a power plant (Herrera 2010). An upland gravel mine operates a barge
loading facility for aggregate on the western shore of Oakland Bay.
Olympia’s downtown commercial area lies at the south end of Budd Inlet, with the Port of
Olympia occupying the northern half of the peninsula between East Bay and West Bay.
Relatively dense residential areas line the east side of East Bay and the west side of West Bay,
along with a number of parks. The middle and outer areas of Budd Inlet are more suburban or
rural in nature, similar to the other inlets. Boston Harbor is a small community that is located at
the mouth of Budd Inlet on the eastern shoreline.
The inner portion of Budd Inlet has supported a variety of industries, including lumber mills,
plywood mills, Cascade Pole (wood treating), shipping operations, marinas and boat repair, and
steel fabrication and painting. Olympia has the only deep water port in the South Puget Sound
area, which has operated since 1922 (Port of Olympia 2017). Several large marinas are present
in East Bay, West Bay, and Boston Harbor. The Lacey, Olympia, Tumwater, and Thurston
County (LOTT) wastewater treatment plant is located on the central peninsula, and the
Tamoshan/Beverly Beach and Seashore Villa treatment plants are located on the west and east
sides of the inlet, respectively. Each of these treatment plants discharges into the inlet.
Numerous wood waste burners (hog fuel boilers), as well as other emissions sources associated
with the mills, were historically present in both Shelton and Olympia (NewFields 2016; Anchor
QEA 2016).
Nearly all of these inlets have extensive mudflats at low tide, as well as shorelines and spits that
support tribal, commercial, and recreational shellfishing, as well as abundant fisheries, bird life,
and marine mammals. Manila clams and oysters are the primary shellfish harvested
commercially. Shelton Harbor, the northeastern portion of Oakland Bay, and Budd Inlet are
closed to shellfishing due to fecal coliform contamination. Additional shellfishing areas are
closed seasonally due to biotoxins. Despite closures, shellfish restoration efforts are occurring in
many of these bays, including attempts to restore populations of the Olympia Oyster (Herrera
2010).
The Squaxin Island Tribal Reservation is located between Oyster Bay and Little Skookum Inlet
in Mason County. The South Puget Sound area is within the Squaxin Island Tribe’s usual and
accustomed fishing area, and the Tribe harvests and manages shellfish for commercial and

South Puget Sound Regional Background: Data Evaluation & Summary Report
Washington State Department of Ecology 7 Publication No. 18-09-117
subsistence harvest and for restoration. The Squaxin Island Tribe also operates a salmon net pen
facility between Squaxin and Harstine Islands (Squaxin Island Tribe 2017). Many commercial
shellfish growers also operate in the various inlets and own or lease tidelands, the largest of
which is Taylor Shellfish (Taylor Shellfish 2017).
2.2 Hydrology and Bathymetry
All five of the inlets in the study area are long, narrow, and generally quite shallow. The inlets
are typically wider and deeper at their mouths and narrow to mudflat estuaries at their heads.
Each has a number of small rivers and streams that contribute fresh water at the head and along
the shorelines (Ecology 2006). Budd Inlet receives substantial freshwater inputs, primarily from
the Deschutes River, but also from several smaller creeks that drain the Olympia and Black Lake
areas. With a watershed of 420 km2, the Deschutes River flows over 83 km from the
Snoqualmie National Forest into Capitol Lake, which was once part of the Deschutes River
estuary, and from there into Budd Inlet (Thurston County 2009).
South Puget Sound has a large tidal range of approximately 4.4 m (14 ft). However, due to
stratification and the narrow and complex geomorphology of the inlets and passages, the water in
South Puget Sound has a relatively long residence time of 1-2 months. Stratification in the inlets
can persist for most of the year, particularly in Budd Inlet, which has relatively large freshwater
input from the Deschutes River. The strong stratification in Budd Inlet results in very low
dissolved oxygen in bottom waters of the inner Inlet, improving toward the outer Inlet where the
water is more mixed. Many of the shallower inlets are nutrient-rich and support large
populations of plankton, which are a primary food source for bivalves. This is one reason that
shellfish are abundant in South Puget Sound (Ecology 2002).
Oakland Bay is quite shallow, ranging from less than 3 m throughout most of the bay to 11 m in
depth near the confluence with Hammersley Inlet. Nine major creeks empty into Oakland Bay,
with Goldsborough and Shelton Creeks discharging through the city of Shelton. Oakland Bay is
connected to Pickering Passage by Hammersley Inlet. Due to the long, narrow geomorphology
of Hammersley Inlet, sediments are largely retained within Oakland Bay and there is little
flushing of water out of the bay (Herrera 2010).
Budd Inlet is about 30 m deep at its mouth, is about 10 m deep in mid-Inlet, and shallows to
sandy beaches near Priest Point Park and extensive mudflats through most of the rest of the inner
inlet. Budd Inlet can be divided into three hydrodynamic regimes (Figure 2). In the inner Inlet,
there is very little circulation or sediment transport, other than episodic fluxes from Capitol Lake
into West Bay. There is freshwater flow into West Bay from the Deschutes River through the
Capitol Lake dam, which then flows up the east side of the Inlet past Priest Point. In the central
Inlet, more saline water flows in at depth to the west, while freshwater flows out to the east,

South Puget Sound Regional Background: Data Evaluation & Summary Report
Washington State Department of Ecology 8 Publication No. 18-09-117
setting up a central gyre. Finer-grained sediments transported to this area of the Inlet eventually
settle out, forming fairly homogeneous conditions in bottom sediments. The western outer Inlet
receives inputs from Dana Passage, with water flowing out to the east, in the vicinity of Boston
Harbor.
A federal navigation channel extends from near Big Tykle Cove near the middle of the western
shoreline to the Port of Olympia in the West Bay and the marinas in the East Bay. The federally
authorized depth of the turning basin near the Port of Olympia is -30 MLLW plus 2’ overdredge,
and the maintenance depth of the berth areas is -40 MLLW plus 2’ overdredge. A smaller
channel extends across the top of the peninsula and into East Bay, which is maintained to -15
MLLW (SAIC 2008).
2.3 Sedimentation, Grain Size, and Organic Carbon
Figures 3 and 4 show grain size and total organic carbon for locations sampled in the South
Puget Sound area, using data downloaded from Ecology's Environmental Information
Management System (EIM). Much of the South Puget Sound area has high percent fines (silt
and clay), typically ranging from 60 to 100%. Exceptions include the following areas:
Hammersley Inlet has strong tidal currents, which scour the bottom sediments at its
confluence with Oakland Bay. This area of Oakland Bay has fines ranging from 5 to
40%.
Just north of East Bay in Budd Inlet, there is a sandy beach surrounding the mouth of
Ellis Creek near Priest Point Park.
North of the peninsula in inner Budd Inlet, there is a sandy intertidal cap placed as part of
cleanup of the Cascade Pole site.
There are additional sandier areas immediately along the west shoreline of West Bay and
the east shoreline of East Bay. A railroad trestle runs shoreward of the southwest corner
of West Bay, bordering a shoreline lagoon.
Areas with lower fines are present along the east shoreline of Henderson Inlet, within and
downstream of Woodard Bay. This area has a large historic railway trestle and some
shoreline modification by homeowners.
The majority of the South Puget Sound area has TOC concentrations ranging from 2 to 3%.
Exceptions include:

South Puget Sound Regional Background: Data Evaluation & Summary Report
Washington State Department of Ecology 9 Publication No. 18-09-117
TOC is much lower in the scoured area of Oakland Bay near the entrance to Hammersley
Inlet.
TOC is 3 to 6% in quiescent areas of Shelton Harbor and mudflats on the east side of
Oakland Bay. TOC concentrations may be elevated by wood waste deposition in Shelton
Harbor.
TOC is low in Budd Inlet in the sandy beach near Ellis Creek at Priest Point and in the
sand cap offshore of the former Cascade Pole site.
TOC is typically 3 to 4% in the southern half of Budd Inlet, with some areas along the
shoreline ranging up to 6%. Some of these higher TOC concentrations are in areas of
known wood waste deposits associated with cleanup sites.
TOC is highly variable in Woodard Bay in the vicinity of the old railroad trestle. This
could in part be due to the historic use of the trestle for log transfer and the associated
rafting activities in the bay.
The most significant source of sedimentation to inner Budd Inlet is from Capitol Lake outflows,
and is highly dependent on tides and lake flushing events. Deposition of up to 20 cm in just over
a year has been documented following several flushing events in dredged berthing areas in West
Bay. Deposition rates in other areas of inner Budd Inlet are estimated to range from 0.12 to 1.2
cm/yr (Anchor QEA 2016). There is little sedimentation information for other areas of Budd
Inlet, or other adjacent inlets. Sedimentation rates in central Oakland Bay range from 0.25 to
0.51 cm/yr, and up to 1 cm/yr near creek deltas (Herrera 2010).
2.4 Unrepresentative Areas
Samples from some areas were considered unrepresentative of regional background and were
removed from the data set:
Priest Point. Sediments in the delta around Ellis Creek at Priest Point were removed from
the data set, because they had uncharacteristically low percent fines and low TOC for
Budd Inlet, and had concentrations of dioxins/furans in the natural background range.
Southwest Shoreline of West Bay, Budd Inlet. Several samples in both the cPAH and
dioxin/furan data set were located immediately along the southwestern shoreline of West
Bay in Budd Inlet. These samples were collected along an old railroad trestle in an
intertidal zone constructed of non-native material, and varied widely in TOC. The trestle
could also be a potential source of cPAHs to sediments nearby. Additional beach

South Puget Sound Regional Background: Data Evaluation & Summary Report
Washington State Department of Ecology 10 Publication No. 18-09-117
samples along the shoreline north of the trestle were also removed due to uncertainty
about the nature of the substrate and representativeness of subtidal areas.
2.5 Sites and Sources
The SMS rule states that areas primarily influenced by cleanup sites and known sources cannot
be used to establish regional background. Sediment cleanup sites and other sources historically
or currently present within South Puget Sound are mainly located in Shelton Harbor and inner
Budd Inlet (Figure 5).
2.5.1 Oakland Bay
Known sites and potential sources of contamination in Oakland Bay are described in detail in
NewFields (2010) and Herrera (2010) and are summarized below:
The Rayonier Pulp Mill operated on the south side of Shelton Harbor from the 1920s
through the late 1950s, and discharged untreated chlorine bleaching process wastewater
and sulfite waste liquor into the harbor. The Rayonier Mill likely used pentachlorophenol
in its industrial processes, and burned salt-laden wood and other process wastes.
The Rayonier and Simpson Mills, Simpson Power Plant, Olympic Plywood, and other
smaller wood products industries contributed to air emissions containing dioxins/furans
from mill stacks and wood-fired power plant/hog fuel boiler emissions.
Fly ash from the Simpson hog fuel power plant containing dioxins/furans were
discharged in slurries to the former and current wastewater treatment plants at the
northeast and southeast ends of Shelton Harbor, respectively.
The ITT Rayonier Research Laboratory discharged laboratory wastes to the harbor from
the 1930s to the mid-1990s.
The Simpson Timber Company used a product containing pentachlorophenol (Permatox)
as a wood preservative, and a dip tank was located on the property.
Disposal of pulp mill sulfite liquor wastes occurred in a variety of other ways over the
years, including burning, landfilling, spraying onto roadways, and disposal at the Goose
Lake site.
Wastes from the sulfite liquor burner at the Rayonier pulp mill were landfilled at the
shoreline of Oakland Bay at the Bayshore Golf Course, and were documented to have
leached into the bay.

South Puget Sound Regional Background: Data Evaluation & Summary Report
Washington State Department of Ecology 11 Publication No. 18-09-117
Approximately 30,000 cubic yards of dredge spoils from an area close to the outfall of
the Rayonier Pulp mill were discharged to a location at the intersection of Shelton
Harbor, Oakland Bay, and Hammersley Inlet.
Bunker C fuel oil leaked from above-ground tanks in the Simpson log sort yard adjacent
to Goldsborough Creek. Limited soil was removed but contamination remained in place
due to concerns about stability of nearby site structures. Groundwater testing did not
reveal groundwater contamination. The site received a No Further Action determination
and is subject to a restrictive covenant.
Numerous other spills have been reported at the Simpson log sort yard and other
waterfront locations of various petroleum products and PCB-containing products.
Log-rafting occurred widely in the harbor, and over 4,000 creosote and
pentachlorophenol-treated pilings have been installed in the harbor. Thick deposits of
wood waste are present in certain areas, such as near the chip loading area at Simpson.
Several bulk fuel storage facilities operated along northern Shelton Harbor.
Simpson operated a marine railway along northern Shelton Harbor where TBT, copper
and petroleum products have been identified.
A landfill of solidified residues from incomplete combustion in wood fired boilers (aka
“clinker”) is present adjacent to Shelton Creek, close to where the creek discharges to the
northeast part of Shelton Harbor. Tests of this material contained elevated
dioxins/furans. Leaching or erosion from this pile likely contributed dioxins/furans to the
harbor.
Shelton Harbor has had a variety of additional point and non-point discharges, including
storm drains, industrial discharges, wastewater treatment plant outfalls, septic system
discharges, and creeks carrying industrial wastes.
2.5.2 Budd Inlet
Known sites and potential sources of contamination in Budd Inlet are described in detail in
NewFields (2016) and Anchor QEA (2016) and are summarized below:
From 1940 to 1986, the Cascade Pole Company operated on the peninsula separating East
Bay and West Bay in inner Budd Inlet. Prior to 1967, creosote was the primary wood
preservative used, and after that date, pentachlorophenol (containing dioxins/furans) was

South Puget Sound Regional Background: Data Evaluation & Summary Report
Washington State Department of Ecology 12 Publication No. 18-09-117
used at the facility to treat wood. Process water and waste products were discharged to
the inlet, and soil, groundwater, and sediments were contaminated with oil, creosote,
pentachlorophenol, and dioxins/furans. The following cleanup actions have been
conducted since 1993 at the Cascade Pole Site:
o Installation of the sheet pile wall to provide a physical barrier to DNAPL
migration into Budd Inlet, and to minimize the amount of seawater infiltration
from Budd Inlet into groundwater.
o Installation of a 3,600-linear-feet slurry cut-wall to provide containment for the
groundwater contamination.
o Dredging 40,000 cubic yards of contaminated sediment from Budd Inlet and
storing it in an upland sediment containment cell.
o Installation of a second sheet pile wall in front of the first sheet pile wall.
o Storm water runoff control and storm drain remediation.
o Capping the site.
o On-going semiannual groundwater monitoring program and sediment monitoring
in the excavated area every five years, annual cathodic protection testing of the
sheet pile wall, and operation of the groundwater treatment system to provide
hydraulic control of the groundwater.
o Soil removal from the North Point area to MTCA Method A cleanup levels.
The Port of Olympia has an uncovered log storage yard on the peninsula on which sap-
stain treated wood products were stored in the 1980s and 1990s. Concentrations of
dioxins/furans in Port of Olympia storm drains are elevated, indicating potential ongoing
sources on the property. An opening in the pier (historical pit) is associated with
sediments contaminated with dioxins/furans, SVOCs, metals, PAHs, and PCBs. High
concentrations of dioxins have also been measured in sediments along the berthing areas
and sloughing into the berthing areas.
The East Bay Redevelopment Site is located on the peninsula at the southwest end of
East Bay and is currently undergoing a cleanup (uplands only) for total petroleum
hydrocarbons, cPAHs, dioxins and furans, arsenic, lead, and total naphthalene
contamination.
Surface sediments in the south part of East Bay have some of the highest remaining
concentrations of dioxins/furans and PCBs in Budd Inlet.
Several marinas and the Swantown Boat Works surround the peninsula in East and West
Bays, and may be sources of lower levels of PAHs and metals to sediments.

South Puget Sound Regional Background: Data Evaluation & Summary Report
Washington State Department of Ecology 13 Publication No. 18-09-117
Elevated concentrations of COCs are present near the outlets of some municipal storm
drains and creeks, particularly Moxlie Creek, in inner Budd Inlet. It is uncertain whether
the origin of the COCs is from these sources or from sediments in the Inlet. Other areas,
such as that near the mouth of Ellis Creek at Priest Point, have very low concentrations of
dioxins/furans.
The LOTT wastewater treatment plant has an outfall discharging treated municipal
sewage off the north end of the peninsula, as well as smaller outfalls in the vicinity.
Sediment data in the vicinity does not suggest that sediments near the outfall have been
significantly impacted.
The Tamoshan/Beverly Beach treatment plant located on the west side of the inlet
discharges into the shallow subtidal area, while the Seashore Villa plant and outfall
discharges along the east side of Budd Inlet.
Solid Wood Inc./West Bay Park was a small lumber mill with a railroad, remnants of
which still run along the west shoreline of West Bay. An interim Action was performed
in 2009 during city park construction, which included removal of contaminated soil and
sediment. Ecology is currently reviewing the remedial investigation/feasibility study
report for the remaining portions of the site. Concentrations of total petroleum
hydrocarbons and cPAHs in soil remain above cleanup levels in areas outside the park.
The draft remedial investigation/feasibility study report does not propose additional
sediment cleanup.
Reliable Steel was also a lumber mill until 1941, after which the property was used for
boatbuilding, welding, and steel fabrication. Site soils contain concentrations of arsenic,
cadmium, lead, mercury, total petroleum hydrocarbons, and cPAHs above MTCA
cleanup levels. Groundwater at the site contains total petroleum hydrocarbons and metals
above MTCA cleanup levels. Site sediments contain total petroleum hydrocarbons,
mercury, PAHs, and phthalates above SMS cleanup levels. A draft Cleanup Action Plan
was prepared in 2013, but needs to be revised to incorporate the 2013 SMS revisions.
Hardel Mutual Plywood was another lumber mill located just north of Reliable Steel.
The facility was destroyed by fire in 1996, which may have contributed contaminants to
Budd Inlet. Although this site has undergone cleanup, hog fuel boiler ash is still present
in soils and dioxin/furan concentrations are elevated in offshore areas of the property.
West Bay Marina/Buchanan Lumber Company. This marina is currently located on the
west shoreline of central Budd Inlet, north of Hardel Mutual Plywood. A lumber mill was
formerly located here, along with a hog fuel burner. Ash is present in the upland areas

South Puget Sound Regional Background: Data Evaluation & Summary Report
Washington State Department of Ecology 14 Publication No. 18-09-117
and wood waste is present in the intertidal and subtidal sediments between the marina and
Buchanan Lumber. The property has elevated concentrations of dioxins/furans in soils
and sediments.
At least 9 hog fuel burners have been identified as formerly located along the shoreline of
inner Budd Inlet, and historical photos suggest that additional burners and smokestacks
were likely present throughout Budd Inlet’s early history. The hog fuel burners are likely
significant sources of dioxins/furans through air emissions and direct deposition to
aquatic environments, aerial deposition to soils followed by stormwater runoff, and ash
piles in soils and sediments.
2.5.3 Henderson Inlet and Other Areas
The only additional known source identified is the large historical railroad trestle located in
Woodard Bay in Henderson Inlet. Sporadically elevated levels of cPAHs near the trestle could
be related to deterioration of the treated wood structure or diffusion of creosote into sediments.
Henderson Inlet also receives stormwater from more commercial and heavily residential areas of
Lacey through its headwaters. All of the inlets receive stormwater and overland runoff from
light residential, agricultural, and forested areas in the watershed, and some receive runoff from
Interstate 5, Highway 101, State Route 3, and/or local arterials.
2.6 Regional Background Data Sets
The intent of the SMS definition of regional background is to identify areas primarily influenced
by diffuse sources rather than within the direct influence of known sites and sources. In South
Puget Sound, differentiating these areas presented challenges due to the long narrow morphology
of the inlets and the magnitude of historical discharges to the inlets. In both Budd Inlet and
Oakland Bay, the chemical signatures of identifiable historical sources were overlain on that of
diffuse sources throughout much of these areas, with few areas that could be considered
unimpacted by specific and overlapping sites and sources. Concentrations of COCs remain
elevated in these areas long after discontinuation of industrial activities at the sites due to limited
sediment transport, mixing, and sediment deposition.
Nevertheless, Ecology determined that regional background concentrations consistent with the
SMS rule can be identified in the South Puget Sound area. Multiple lines of evidence were used
to distinguish these more diffuse concentrations from the signatures of individual sites and
sources. cPAHs and dioxins/furans are discussed separately below, as the data sets and lines of
evidence differ for these COCs.

South Puget Sound Regional Background: Data Evaluation & Summary Report
Washington State Department of Ecology 15 Publication No. 18-09-117
2.6.1 cPAHs
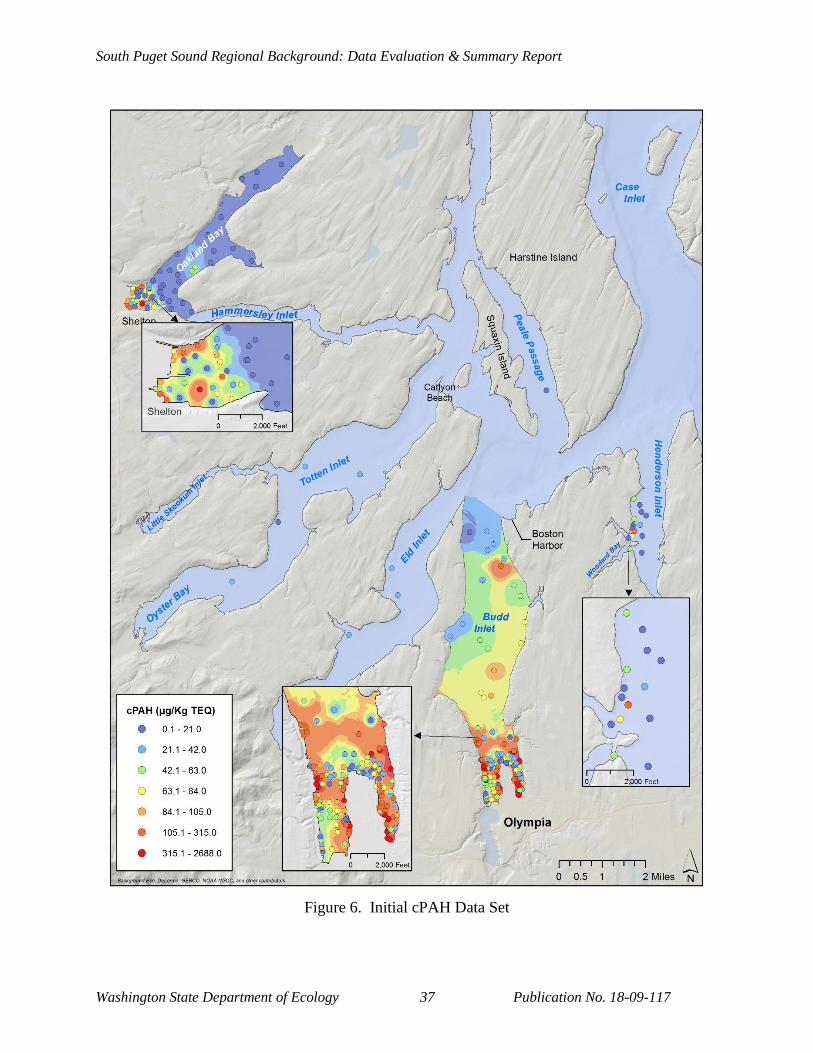
Figure 6 shows the data set available for cPAHs in the South Puget Sound Area. Most of the
data are located in Oakland Bay and Budd Inlet, with a few data points in Totten, Eld, and
Henderson Inlets.
Oakland Bay data were excluded from the data set, because the cPAH data in Shelton Harbor
were determined to be primarily influenced by known sites and sources in that area, while the
cPAHs in the remaining areas of Oakland Bay had concentrations within the natural background
range. There did not appear to be an intermediate area of diffuse regional background
concentrations in Oakland Bay, potentially due to the strong currents and scouring that occurs at
the confluence of Oakland Bay with Hammersley Inlet.
Budd Inlet presented a difficult challenge due to the magnitude of historical cPAH and
dioxin/furan discharges from the former Cascade Pole and other sites, potentially overwhelming
cPAH signatures from diffuse urban sources, as well as smaller sediment sites in inner Budd
Inlet. Both of these COCs have gradual south to north concentration gradients away from the
former Cascade Pole site, with higher concentrations along the eastern shore, consistent with
circulation patterns. There is no clear break point defining where the primary influence of
Cascade Pole ends and regional background begins. However, at some point, the cPAH
concentration likely approaches that of regional background that would be expected to be present
in the more urbanized areas of Budd Inlet, were it not for Cascade Pole and other large sources.
Totten and Eld Inlets were included as candidate regional background areas because cPAH
concentrations were elevated above natural background concentrations and were not directly
influenced by known sites or sources.
Much of Henderson Inlet was within the natural background distribution, with a few elevated
stations in and downstream of Woodard Bay and Chapman Bay. These stations were adjacent to
or downstream of the large former rail trestle that is currently in deteriorating condition.
Therefore, the data from Henderson Inlet were excluded from the regional background data set.
Given the above, the following cPAH data were included in the regional background distribution
for South Puget Sound (Figure 7):
Data from Totten and Eld Inlets were included, as these areas clearly met the SMS
definition of regional background.
Data from the outer portion of Budd Inlet were included, based on the following:
o cPAH concentrations were similar to those within Totten and Eld Inlets.

South Puget Sound Regional Background: Data Evaluation & Summary Report
Washington State Department of Ecology 16 Publication No. 18-09-117
o The samples were collected from areas north of the central gyre in Budd Inlet that
tends to retain sediments from more contaminated areas in inner Budd Inlet.
Samples collected within the western half of West Bay within inner Budd Inlet were also
included. This area receives sedimentation from Capitol Lake and is considered to be
representative of urban background in areas that may recover more quickly than other
areas of inner Budd Inlet. A 750-foot buffer from the eastern shoreline of West Bay was
established, and intertidal areas along the former railway along the southwestern
shoreline were excluded.
2.6.2 Dioxins/furans
Figure 8 shows the data set available for dioxins/furans in the South Puget Sound Area. No
dioxin/furan data were available for Totten Inlet, Eld Inlet, or Henderson Inlet.
In Oakland Bay, dioxin/furan concentrations were elevated throughout Oakland Bay, both in
Shelton Harbor as well as in the northeastern portions of the Bay. Only a small area scoured by
high currents from Hammersley Inlet fell within the natural background range, with no
intermediate areas. Therefore, data from Oakland Bay were excluded from the regional
background data set, as it has apparently been influenced throughout by known sites and sources.
Budd Inlet presented similar challenges for dioxins/furans as for cPAHs, in that a clear south to
north concentration gradient was apparent away from Cascade Pole, diminishing gradually and
without obvious break points to levels that remained above natural background at the outlet of
Budd Inlet.
Chemometric analyses have been conducted using dioxin/furan congener data for both Oakland
Bay and Budd Inlet (NewFields 2014, 2017). Chemometrics, or environmental forensics, is a
term that encompasses several multivariate statistical methods used with the goal of reducing the
complexity of the data set. The chemometric analyses identified three different factors that
represent unique dioxin/furan sources.
Factors identified for Budd Inlet and/or Oakland Bay included:
Factor 1, correlated with hog fuel boiler ash and emissions. Nine hog fuel boilers
historically operated in Budd Inlet, with an additional five in Oakland Bay (Figure 5).
Individual hog fuel boilers represent point sources, while combined emissions from hog
fuel boilers at locations where they can no longer be traced to their sources may be
considered part of diffuse sources on a regional scale.

South Puget Sound Regional Background: Data Evaluation & Summary Report
Washington State Department of Ecology 17 Publication No. 18-09-117
Factor 2, correlated with pentachlorophenol, which was used for wood treatment at
Cascade Pole in Budd Inlet and at Simpson Timber and Johns Prairie Industrial Park in
Oakland Bay, as well as other possible sites. Factor 2 was the dominant contributor to
dioxin/furan TEQ in most samples.
Factor 3, containing furan peaks representative of PCBs, as well as additional
unidentified congener peaks. The presence of this factor was limited to Budd Inlet,
where the greatest contributions were found near Berth 3 in the West Bay and at the south
end of East Bay (Figure 5).
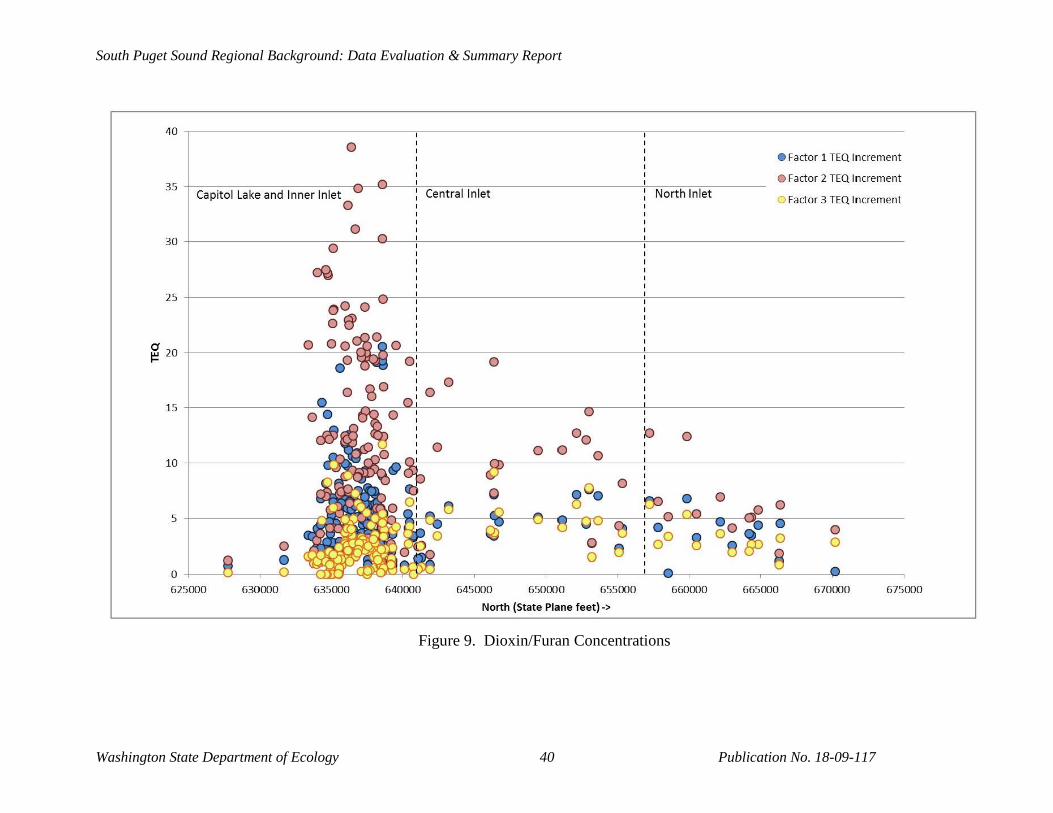
Figure 9 shows the TEQ concentrations and Figure 10 shows the relative contributions of Factors
1, 2, and 3 in surface sediments in Budd Inlet, moving south to north along the x-axis. As
expected, there was a large amount of variability in each factor in the inner inlet given the
presence of direct sources. The contribution of Factor 2 diminished somewhat to the north, but
remained higher than the other two factors even in outer Budd Inlet, likely indicating a large
impact from Cascade Pole. As with cPAHs, however, the outer area of Budd Inlet was
considered representative of regional background, in that it showed a mix of diffuse urban
sources and other non-direct influences from identifiable sources.
Given the above, the following dioxin/furan data were included in the regional background
distribution for South Puget Sound (Figure 11):
Data from the outer portion of Budd Inlet were included, based on the following:
o The overall patterns and distributions of dioxins/furans and cPAHs were very
similar in Budd Inlet. The cPAH data in outer Budd Inlet was found appropriate
for use as regional background based on data from Totten and Eld Inlets.
o The samples were collected from areas north of the central gyre in Budd Inlet that
tends to retain sediments from more contaminated areas in inner Budd Inlet.
o The total dioxin/furan and individual factor TEQ concentrations (Figure 9) were
highly variable in the inner inlet due to the presence of direct sources. These
concentrations decreased moving north toward the outer inlet, but remained above
natural background concentrations and are likely representative of regional
background concentrations.
o Figure 10 shows the relative percentage of each factor approaching a stable level
in the outer harbor. These concentrations are above natural background levels
and likely include the contributions from diffuse sources along with some
influence from specific sources, but this influence can no longer be considered a
direct or primary influence.
Data from the western half of West Bay within inner Budd Inlet were also included. This
area receives sedimentation from Capitol Lake and is considered to be representative of

South Puget Sound Regional Background: Data Evaluation & Summary Report
Washington State Department of Ecology 18 Publication No. 18-09-117
urban background in areas that may recover more quickly than other areas of inner Budd
Inlet. A 750-foot buffer from the eastern shoreline of West Bay was established, and
intertidal areas along the former railway along the southwestern shoreline were excluded.

South Puget Sound Regional Background: Data Evaluation & Summary Report
Washington State Department of Ecology 19 Publication No. 18-09-117
3.0 Data Screening and Analysis
To ensure consistency with the SMS, existing data for South Puget Sound were downloaded
from EIM and screened to develop the data sets used to calculate regional background. The
entire unscreened data set for this geographic region can be downloaded from EIM using the
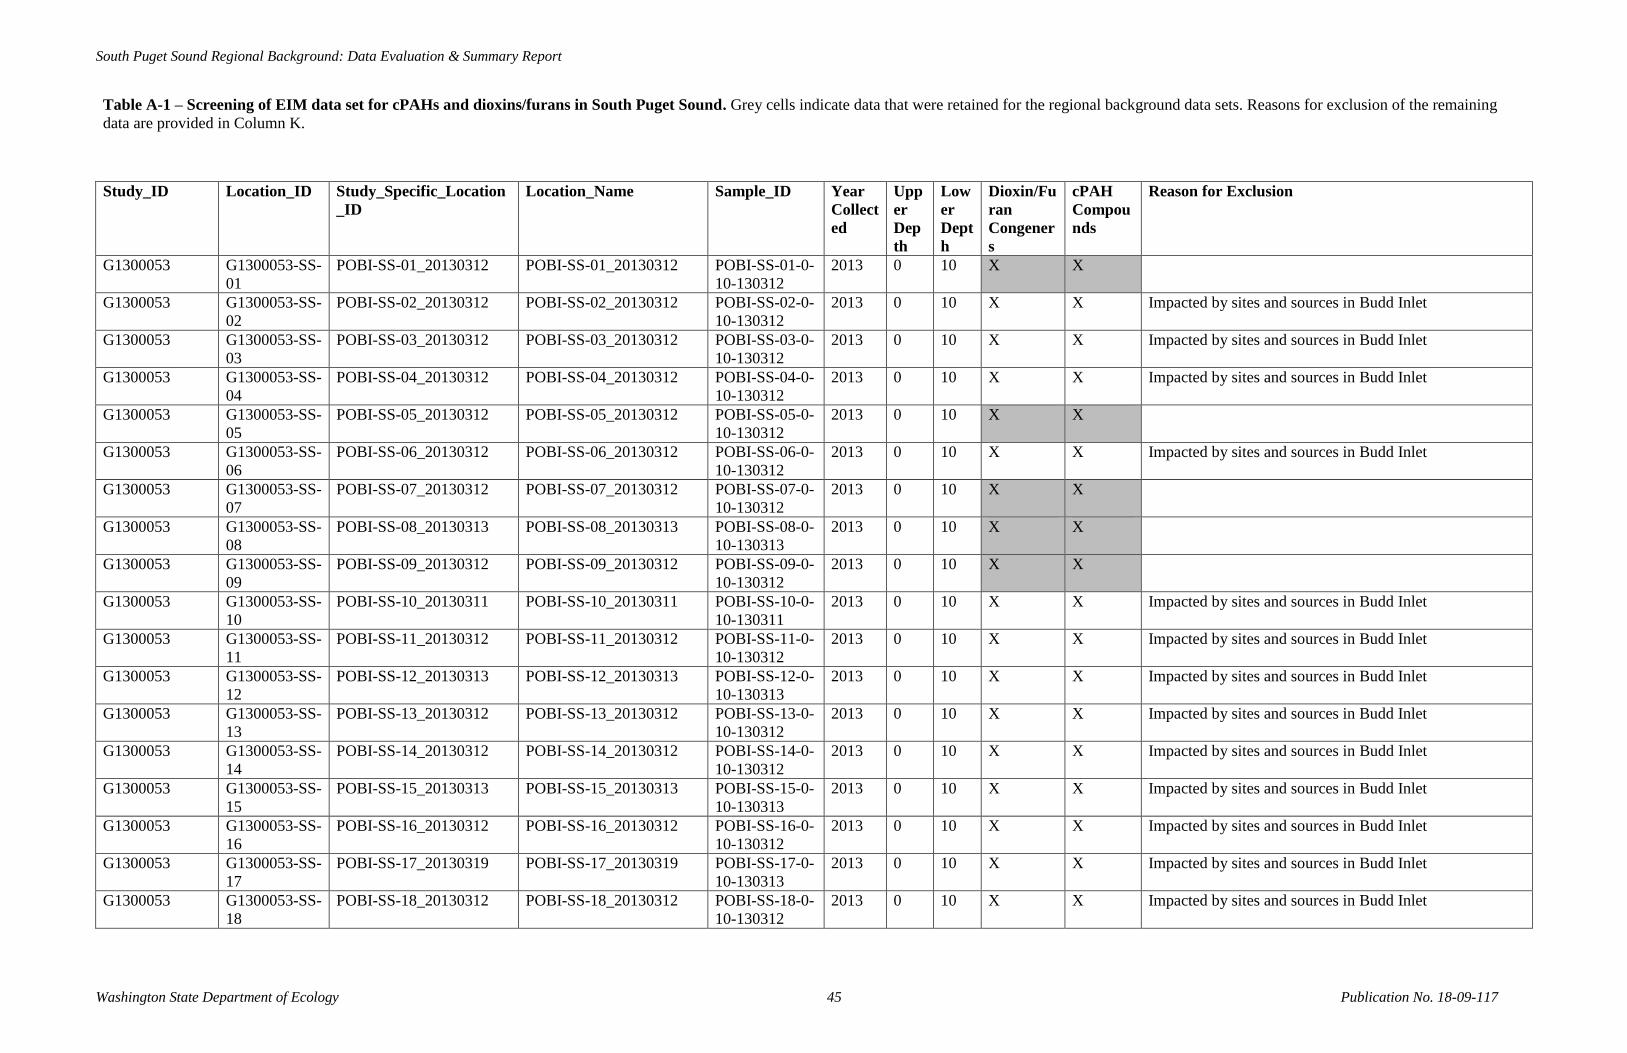
study and location IDs listed in Table A-1. Table A-1 shows the data that were screened out and
the reasons for screening. Table A-2 and Figures 7 and 11 show the final data sets for
dioxin/furan TEQ and cPAH TEQ after screening and statistical analysis.
The data set was first screened to ensure that samples were of appropriate quality with respect to
recency, depth, replicates, and detection limit issues (Section 3.1). The data set was
subsequently screened through statistical analysis, including sample independence, population
analysis, outlier identification, and calculation of precision (Section 3.2, Appendix B).
3.1 Quality Control/Assurance
3.1.1 Data Recency
The standard 10-year cutoff was used for this analysis, incorporating data from 2007 and later.
3.1.2 Detection Limits
Sample results for cPAH TEQ or dioxin/furan TEQ influenced by non-detected values above the
PQL-based cleanup levels identified in SCUM II, Chapter 11 were excluded to avoid bias from
elevated detection limits.
3.1.3 Depths, Time Series, and Replicates
Several initial screens were applied to obtain the most recent and representative surface sediment
samples at each station:
Data that were not collected from within the top 0 to 10 cm in depth were excluded.
When multiple samples were collected at different depths at the same location, data were
averaged or the most representative depth (0 to 10 cm) was selected.
When multiple samples were collected at the same location over time, only the most
recent sample was used.
When replicate samples were collected at the same location at the same time, the data
were averaged.

South Puget Sound Regional Background: Data Evaluation & Summary Report
Washington State Department of Ecology 20 Publication No. 18-09-117
3.2 Statistical Analysis
The resulting data set was evaluated further from a statistical perspective to address issues
specific to using existing data, as described below and in Appendix B.
3.2.1 cPAH and Dioxin/Furan TEQ Summing
Kaplan-Meier (KM) TEQs were calculated for the dioxins/furans and cPAHs in each sample
consistent with the recommendations in SCUM II. The KM sums reported for the retained TEQ
data were calculated using R version 3.2.2 (R Core Team 2016) using the cenfit function from
the NADA package (Lee 2013). The KM sum was calculated as the KM mean multiplied by the
number of congeners (Helsel 2012). The following rules were applied to calculate and qualify
the final KM TEQs:
If the number of non-detected values for a sample exceeded 50 percent (4 or more out of
7), the KM TEQ was qualified as a "less than" value (L-qualified), followed by the
number of non-detected values. For example, if 4 of the 7 cPAHs were undetected, the
detection frequency would be 57% and the KM TEQ would be calculated and qualified
with "L4."
If the lowest toxic equivalent concentration (TEC) was based on a non-detected value, the
positive bias in the KM estimate was adjusted downwards using Efron’s bias correction
(Klein and Moeschberger 2003). This method treats the lowest ranked value as detected
even if it was reported as a non-detected value.
Normally, if the highest value is a non-detect, it is excluded by the statistical software
used to conduct KM calculations. However, all of the dioxins/furans or cPAHs must be
included when calculating a TEQ value. Therefore, the highest TEC value was always
treated as a detected value (at the detection limit) for calculating the KM TEQ. The TEQ
was qualified with an L if the highest TEC was originally a non-detected value.
All L-qualified TEQ values were treated as censored (upper-bound) values in the
distributional assessments and when calculating summary statistics across samples.
The final data sets used to calculate regional background concentrations are shown in Figures 7
and 11 and in Table A-2. Summary statistics for the dioxin/furan and cPAH data sets are shown
in Table 1.
3.2.2 Sample Independence
A spatial autocorrelation analysis was conducted to identify the autocorrelation distance, which
is the minimum distance required between samples to consider the results statistically
South Puget Sound Regional Background: Data Evaluation & Summary Report
Washington State Department of Ecology 21 Publication No. 18-09-117
independent. Samples that were spatially isolated or clear outliers were temporarily removed for
this analysis, to reduce variability that would disproportionately affect the model.
The analytes were not expected to have identical spatial concentration distributions, because of
differing sources. For this data set, there was no evidence of spatial autocorrelation for either
dioxin/furan TEQ or cPAH TEQ. A detailed description of the autocorrelation analysis methods
and results can be found in Appendix B.
3.2.3 Identification of Subpopulations and Outliers
A detailed analysis of the data set for each analyte was conducted to exclude outliers and isolate
the subset of data that most closely represents the SMS definition of regional background
(Appendix B, Tables B-1 and B-2).
A population separation analysis was conducted to identify the regional background population
from any subpopulations present in the data set. This analysis used likelihood methods to find
the most likely breakpoints for mixtures of subpopulations. Both the cPAH and dioxin/furan
data sets were determined to be best addressed as single populations and did not require
population separation.
A single cPAH outlier of 240 µg/kg TEQ was identified by the QQ plots and outlier analysis.
This cPAH value was more than 3 times greater than the next highest value and reduced the
goodness of fit of the distribution. Therefore, it was removed from the data set prior to
calculating precision and the regional background 90/90 UTL (see Appendix B, Section B.3.1).
A single possible dioxin/furan outlier of 25 ng/kg TEQ was also identified by a statistical outlier
test. This dioxin/furan value was further evaluated using the outlier evaluation process outlined
in SCUM II, Section 10.3.3. This value was retained in the data set based on the following
considerations:
The station is not near any identified source.
The sample does not appear to be influenced by another factor that could influence the
concentration (e.g., TOC, grain size).
The fit to a normal distribution with this value retained is acceptable (correlation
coefficient of 0.97) and similar to that with the value excluded (0.99).
The precision of the distribution with the value retained is 20%, well within Ecology’s
acceptability guidelines of 25%. Removing the outlier improves the precision by only
2%.
The 90/90 UTL with the value is 19 ng/kg TEQ, and without the value is 17 ng/kg TEQ.
These values are similar and within analytical variability.

South Puget Sound Regional Background: Data Evaluation & Summary Report
Washington State Department of Ecology 22 Publication No. 18-09-117
3.2.4 Precision
In the evaluations above, the precision of the resulting data set was used as one measure of
whether the data set a) could be considered a single population, and b) was sufficiently cohesive
to represent regional background. This is important because a data set with poor precision will
have broader tails and higher upper percentiles. Ecology’s target precision for regional
background data sets is 25%, although it is recognized that data sets made up of existing data
may have poorer precision than those collected through a single field study.
After identifying the regional background data sets through the evaluations described above, the
precision of each data set was calculated as the width of the 95 percent upper confidence limit
(95 UCL) on the mean divided by the mean (%), where a lower percent value indicates greater
precision. Precision of the mean expressed in this way is a common method for quantifying
uncertainty in the data set used to calculate the 90/90 UTL.
The data sets representing regional background for dioxin/furan TEQ and cPAH TEQ were
evaluated in ProUCL to determine the most appropriate distributions, then associated summary
statistics were calculated (Table 1). The precision for both dioxin/furan TEQ and cPAH TEQ
data sets is 20%.
South Puget Sound Regional Background: Data Evaluation & Summary Report
Washington State Department of Ecology 23 Publication No. 18-09-117
4.0 Regional Background Concentrations
4.1 Data Distributions
Overall, the following observations regarding the South Puget Sound regional background data
sets can be made.
cPAH TEQs
The cPAH TEQ concentrations within the South Puget Sound regional background data
set were fairly consistent, with one notable exception (240 µg/kg TEQ in northeast Budd
Inlet).
There was a tendency toward slightly higher concentrations in the West Bay near the
outlet from Capitol Lake, but these concentrations as a group were not identified as a
distinctly different subpopulation from the remainder of the South Puget Sound regional
background dataset. A few locations in the northeast portion of Budd Inlet had similar
concentrations to those in the West Bay.
Dioxin/Furan TEQs
The dioxin/furan TEQ values within the South Puget Sound regional background data set
had a very smooth distribution. There was one slightly elevated value (25 ng/kg TEQ) in
northeast Budd Inlet that was retained in the data set (see Section 3.2.3).
4.2 South Puget Sound Regional Background Values
Table 1 presents the South Puget Sound 90/90 UTL values for dioxin/furan and cPAH TEQs
alongside the Puget Sound 90/90 UTL natural background value (SCUM II, Chapter 10). The
90/90 UTL values were calculated in ProUCL 5.0 (USEPA 2013) consistent with the
recommendations in SCUM II, Chapter 10.
The regional background concentrations are as follows:
The regional background value for dioxin/furan TEQ based on the 90/90 UTL is 19 ng/kg
TEQ. The data set on which this value is based is fairly limited in size (n = 26) for the
area it is intended to characterize and is best described by a normal distribution.
The regional background value for cPAH TEQ based on the 90/90 UTL is 78 μg/kg TEQ.
The data set on which this value is based is fairly limited in size (n = 22) for the area it is
intended to characterize and is best described by a gamma distribution, after excluding
one clear outlier.

South Puget Sound Regional Background: Data Evaluation & Summary Report
Washington State Department of Ecology 24 Publication No. 18-09-117
5.0 References
Anchor QEA. (2016). Identification and evaluation of interim action alternatives memorandum,
Budd Inlet sediment site, Olympia, Washington. Draft Report. Prepared for the Port of
Olympia, Olympia, WA.
Benaglia, T., Chauveau, D., Hunter, D.R., Young, D. (2009). mixtools: An R Package for
Analyzing Finite Mixture Models. Journal of Statistical Software, 32(6), 1-29.
Retrieved from: http://www.jstatsoft.org/v32/i06/
Burnam, K.P., Anderson, D.R. (2002). Model selection and multimodal inference: A practical
information-theoretic approach (2nd ed.) New York: Springer-Verlag.
DMMP. (2009). OSV Bold summer 2008 survey: Data report. Prepared by the Washington
State Dredged Material Management Program, with assistance from Science Applications
International, Avocet Consulting, TerraStat Consulting Group. (Ecology Publication No.
09-09-226). Olympia, WA: Washington State Department of Ecology, Toxics Cleanup
Program. (June 25, 2009).
Ecology. (2002). Summary of South Puget Sound water quality study. Publication No. 02-03-
020. Olympia, WA: Washington State Department of Ecology, Environmental
Assessment Program. (September 2002).
Ecology. (2006). Henderson Inlet watershed fecal coliform bacteria, dissolved oxygen, pH, and
temperature total maximum daily load study. (Ecology Publication No. 06-03-012).
Olympia, WA: Washington State Department of Ecology, Environmental Assessment
Program. (March 2006).
Ecology. (2014). Port Gardner Bay regional background sediment characterization, Everett,
WA: Data evaluation and summary report: Final. (Ecology Publication No. 14-09-339).
Olympia, WA: Washington State Department of Ecology, Toxics Cleanup Program.
Ecology. (2015a). Sediment Cleanup User’s Manual II: Guidance for implementing the
Sediment Management Standards, Chapter 173-204 WAC. (Ecology Publication No. 12-
09-057). Olympia, WA: Washington State Department of Ecology, Toxics Cleanup
Program.
Ecology. (2015b). Bellingham Bay regional background sediment characterization,
Bellingham, WA: Data evaluation and summary report: Final. (Ecology Publication No.

South Puget Sound Regional Background: Data Evaluation & Summary Report
Washington State Department of Ecology 25 Publication No. 18-09-117
15-09-044). Olympia, WA: Washington State Department of Ecology, Toxics Cleanup
Program.
Ecology. (2016). North Olympic Peninsula regional background sediment characterization,
Port Angeles – Port Townsend, WA: Data and evaluation report: Final. (Ecology
Publication No. 16-09-142). Olympia, WA: Washington State Department of Ecology,
Toxics Cleanup Program.
Ecology. (2017). Lake Washington area regional background, Seattle, WA: Data evaluation
and summary report: Final. (Ecology Publication No. 16-09-064). Olympia, WA:
Washington State Department of Ecology, Toxics Cleanup Program.
Helsel, D.R. (2012). Statistics for censored environmental data using Minitab and R. (2nd ed.).
New Jersey: Wiley & Sons. (324 pp.).
Herrera. (2010). Oakland Bay sediment characterization study, Mason County, Washington.
Sediment investigation report. Prepared for the Washington Department of Ecology,
Toxics Cleanup Program, Olympia, WA.
Journel, A.G. and Huijbregts, Ch.J. (1978). Mining Geostatistics. Academic Press, San Diego,
California.
Klein, J.P. and Moeschberger, M.L. (2003). Survival analysis: Techniques for censored and
truncated data (2nd ed.). New York: Springer (536 pp.).
Lee, L. (2013). NADA: Nondetects and data analysis for environmental data. R package
version 1.5-6. Retrieved from: http://CRAN.R-project.org/package=NADA
NewFields. (2014). Oakland Bay sediment dioxin source study, Oakland Bay, WA. Prepared for
the Washington Department of Ecology, Toxics Cleanup Program, Olympia, WA.
NewFields. (2017). Budd Inlet sediment dioxin source study, Olympia, WA. Prepared for the
Washington Department of Ecology, Toxics Cleanup Program, Olympia, WA.
Port of Olympia. (2017). History. http://www.portolympia.com/105/History. Accessed on 16
May 2017.
R Core Team. (2016). R: A language and environment for statistical computing. Version 3.3.2.
Vienna, Austria: R Foundation for Statistical Computing. Retrieved from:
http://www.R-project.org/

South Puget Sound Regional Background: Data Evaluation & Summary Report
Washington State Department of Ecology 26 Publication No. 18-09-117
SAIC. (2008). Sediment characterization study, Budd Inlet, Olympia, WA. Final data report.
Prepared for the Washington Department of Ecology, Toxics Cleanup Program, Olympia,
WA.
Squaxin Island Tribe. (2017). Natural Resources.
http://squaxinisland.org/government/departments/natural-resources/. Accessed 16 May
2017.
Taylor Shellfish. (2017). About our farms. https://www.taylorshellfishfarms.com/about-us/our-
farms. Accessed 15 May 2017.
Thurston Conservation District. (2017a). Eld Inlet watershed.
https://www.thurstoncd.com/index.php/south-sound-green/eld-inlet-watershed/. Accessed
16 May 2017.
Thurston Conservation District. (2017b). Totten Inlet watershed.
https://www.thurstoncd.com/index.php/south-sound-green/totten-inlet-watershed/.
Accessed 15 May 2017.
Thurston County Department of Health. (2009). Budd/Deschutes watershed WRIA 13.
www.co.thurston.wa.us/health/ehrp/pdf/AR07-09/AR07_09_budd.pdf.
USEPA. (2013). ProUCL Version 5.0.00: Statistical software for environmental applications
for data sets with and without nondetect observations. (EPA/600/R-07/041).
Washington, D.C.: United States Environmental Protection Agency.
Venables, W.N. and Ripley, B.D. (2002). Modern applied statistics with S (4th ed.). New York:
Springer. ISBN 0-387-95457-0.
South Puget Sound Regional Background: Data Evaluation & Summary Report
Washington State Department of Ecology 27 Publication No. 18-09-117
Tables

South Puget Sound Regional Background: Data Evaluation & Summary Report
Washington State Department of Ecology 28 Publication No. 18-09-117
Table 1: Summary statistics and precision for South Puget Sound regional background data sets.
Analyte N Detection Frequency Distribution Mean SD
South Puget Sound Regional Background 90/90 UTL
Puget Sound Natural Background 90/90 UTL Precision
Dioxins/furans 26 23/26 Normal 9.6 5.6 19 ng/kg TEQ 4 ng/kg TEQ 20%
cPAHs 221 22/22 Gamma 41 18 78 μg/kg TEQ 21 μg/kg TEQ 20%
1 After excluding one elevated value with 240 µg/kg TEQ.

South Puget Sound Regional Background: Data Evaluation & Summary Report
Washington State Department of Ecology 29 Publication No. 18-09-117
Figures

South Puget Sound Regional Background: Data Evaluation & Summary Report
Washington State Department of Ecology 30 Publication No. 18-09-117
Figure 1. South Puget Sound

South Puget Sound Regional Background: Data Evaluation & Summary Report
Washington State Department of Ecology 31 Publication No. 18-09-117
Figure 2. Circulation in Budd Inlet

South Puget Sound Regional Background: Data Evaluation & Summary Report
Washington State Department of Ecology 32 Publication No. 18-09-117
Figure 3. Total Organic Carbon

South Puget Sound Regional Background: Data Evaluation & Summary Report
Washington State Department of Ecology 33 Publication No. 18-09-117
Figure 4. Percent Fines
South Puget Sound Regional Background: Data Evaluation & Summary Report
Washington State Department of Ecology 34 Publication No. 18-09-117
This page left intentionally blank.

South Puget Sound Regional Background: Data Evaluation & Summary Report
Washington State Department of Ecology 35 Publication No. 18-09-117
Figure 5. Sites and Sources

South Puget Sound Regional Background: Data Evaluation & Summary Report
Washington State Department of Ecology 36 Publication No. 18-09-117
This page left intentionally blank.
South Puget Sound Regional Background: Data Evaluation & Summary Report
Washington State Department of Ecology 37 Publication No. 18-09-117
Figure 6. Initial cPAH Data Set

South Puget Sound Regional Background: Data Evaluation & Summary Report
Washington State Department of Ecology 38 Publication No. 18-09-117
Figure 7. Final cPAH Data Set

South Puget Sound Regional Background: Data Evaluation & Summary Report
Washington State Department of Ecology 39 Publication No. 18-09-117
Figure 8. Initial Dioxin/Furan Data Set
South Puget Sound Regional Background: Data Evaluation & Summary Report
Washington State Department of Ecology 40 Publication No. 18-09-117
Figure 9. Dioxin/Furan Concentrations

South Puget Sound Regional Background: Data Evaluation & Summary Report
Washington State Department of Ecology 41 Publication No. 18-09-117
Figure 10. Dioxin/Furan Factor Relative Percentages

South Puget Sound Regional Background: Data Evaluation & Summary Report
Washington State Department of Ecology 42 Publication No. 18-09-117
Figure 11. Final Dioxin/Furan Data Set

South Puget Sound Regional Background: Data Evaluation & Summary Report
Washington State Department of Ecology 43 Publication No. 18-09-117
Appendix A. Data Tables
Table A-1: Screening of EIM data set for cPAHs and dioxins/furans in South Puget Sound.
Table A-2: Summary of dioxin/furan congener and cPAH data used to calculate South Puget Sound Regional Background.

South Puget Sound Regional Background: Data Evaluation & Summary Report
Washington State Department of Ecology 44 Publication No. 18-09-117
This page left intentionally blank.
South Puget Sound Regional Background: Data Evaluation & Summary Report
Washington State Department of Ecology 45 Publication No. 18-09-117
Table A-1 – Screening of EIM data set for cPAHs and dioxins/furans in South Puget Sound. Grey cells indicate data that were retained for the regional background data sets. Reasons for exclusion of the remaining
data are provided in Column K.
Study_ID Location_ID Study_Specific_Location
_ID
Location_Name Sample_ID Year
Collect
ed
Upp
er
Dep
th
Low
er
Dept
h
Dioxin/Fu
ran
Congener
s
cPAH
Compou
nds
Reason for Exclusion
G1300053 G1300053-SS-
01
POBI-SS-01_20130312 POBI-SS-01_20130312 POBI-SS-01-0-
10-130312
2013 0 10 X X
G1300053 G1300053-SS-
02
POBI-SS-02_20130312 POBI-SS-02_20130312 POBI-SS-02-0-
10-130312
2013 0 10 X X Impacted by sites and sources in Budd Inlet
G1300053 G1300053-SS-
03
POBI-SS-03_20130312 POBI-SS-03_20130312 POBI-SS-03-0-
10-130312
2013 0 10 X X Impacted by sites and sources in Budd Inlet
G1300053 G1300053-SS-
04
POBI-SS-04_20130312 POBI-SS-04_20130312 POBI-SS-04-0-
10-130312
2013 0 10 X X Impacted by sites and sources in Budd Inlet
G1300053 G1300053-SS-
05
POBI-SS-05_20130312 POBI-SS-05_20130312 POBI-SS-05-0-
10-130312
2013 0 10 X X
G1300053 G1300053-SS-
06
POBI-SS-06_20130312 POBI-SS-06_20130312 POBI-SS-06-0-
10-130312
2013 0 10 X X Impacted by sites and sources in Budd Inlet
G1300053 G1300053-SS-
07
POBI-SS-07_20130312 POBI-SS-07_20130312 POBI-SS-07-0-
10-130312
2013 0 10 X X
G1300053 G1300053-SS-
08
POBI-SS-08_20130313 POBI-SS-08_20130313 POBI-SS-08-0-
10-130313
2013 0 10 X X
G1300053 G1300053-SS-
09
POBI-SS-09_20130312 POBI-SS-09_20130312 POBI-SS-09-0-
10-130312
2013 0 10 X X
G1300053 G1300053-SS-
10
POBI-SS-10_20130311 POBI-SS-10_20130311 POBI-SS-10-0-
10-130311
2013 0 10 X X Impacted by sites and sources in Budd Inlet
G1300053 G1300053-SS-
11
POBI-SS-11_20130312 POBI-SS-11_20130312 POBI-SS-11-0-
10-130312
2013 0 10 X X Impacted by sites and sources in Budd Inlet
G1300053 G1300053-SS-
12
POBI-SS-12_20130313 POBI-SS-12_20130313 POBI-SS-12-0-
10-130313
2013 0 10 X X Impacted by sites and sources in Budd Inlet
G1300053 G1300053-SS-
13
POBI-SS-13_20130312 POBI-SS-13_20130312 POBI-SS-13-0-
10-130312
2013 0 10 X X Impacted by sites and sources in Budd Inlet
G1300053 G1300053-SS-
14
POBI-SS-14_20130312 POBI-SS-14_20130312 POBI-SS-14-0-
10-130312
2013 0 10 X X Impacted by sites and sources in Budd Inlet
G1300053 G1300053-SS-
15
POBI-SS-15_20130313 POBI-SS-15_20130313 POBI-SS-15-0-
10-130313
2013 0 10 X X Impacted by sites and sources in Budd Inlet
G1300053 G1300053-SS-
16
POBI-SS-16_20130312 POBI-SS-16_20130312 POBI-SS-16-0-
10-130312
2013 0 10 X X Impacted by sites and sources in Budd Inlet
G1300053 G1300053-SS-
17
POBI-SS-17_20130319 POBI-SS-17_20130319 POBI-SS-17-0-
10-130313
2013 0 10 X X Impacted by sites and sources in Budd Inlet
G1300053 G1300053-SS-
18
POBI-SS-18_20130312 POBI-SS-18_20130312 POBI-SS-18-0-
10-130312
2013 0 10 X X Impacted by sites and sources in Budd Inlet

South Puget Sound Regional Background: Data Evaluation & Summary Report
Washington State Department of Ecology 46 Publication No. 18-09-117
Table A-1 – Screening of EIM data set for cPAHs and dioxins/furans in South Puget Sound. Grey cells indicate data that were retained for the regional background data sets. Reasons for exclusion of the remaining
data are provided in Column K.
Study_ID Location_ID Study_Specific_Location
_ID
Location_Name Sample_ID Year
Collect
ed
Upp
er
Dep
th
Low
er
Dept
h
Dioxin/Fu
ran
Congener
s
cPAH
Compou
nds
Reason for Exclusion
G1300053 G1300053-SS-
19
POBI-SS-19_20130311 POBI-SS-19_20130311 POBI-SS-19-0-
10-130311
2013 0 10 X X Impacted by sites and sources in Budd Inlet
G1300053 G1300053-SS-
20
POBI-SS-20_20130311 POBI-SS-20_20130311 POBI-SS-20-0-
10-130311
2013 0 10 X X Impacted by sites and sources in Budd Inlet
G1300053 G1300053-SS-
21
POBI-SS-21_20130306 POBI-SS-21_20130306 POBI-SS-21-0-
10-130306
2013 0 10 X X Impacted by sites and sources in Budd Inlet
G1300053 G1300053-SS-
22
POBI-SS-22_20130306 POBI-SS-22_20130306 POBI-SS-22-0-
10-130306
2013 0 10 X X Impacted by sites and sources in Budd Inlet
G1300053 G1300053-SS-
23
POBI-SS-23_20130311 POBI-SS-23_20130311 POBI-SS-23-0-
10-130311
2013 0 10 X X Impacted by sites and sources in Budd Inlet
G1300053 G1300053-SS-
24
POBI-SS-24_20130311 POBI-SS-24_20130311 POBI-SS-24-0-
10-130311
2013 0 10 X X Impacted by sites and sources in Budd Inlet
G1300053 G1300053-SS-
25
POBI-SS-25_20130311 POBI-SS-25_20130311 POBI-SS-25-0-
10-130311
2013 0 10 X X Impacted by sites and sources in Budd Inlet
G1300053 G1300053-SS-
26
POBI-SS-26_20130306 POBI-SS-26_20130306 POBI-SS-26-0-
10-130306
2013 0 10 X X Impacted by sites and sources in Budd Inlet
G1300053 G1300053-SS-
27
POBI-SS-27_20130306 POBI-SS-27_20130306 POBI-SS-27-0-
10-130306
2013 0 10 X X Impacted by sites and sources in Budd Inlet
G1300053 G1300053-SS-
28
POBI-SS-28_20130311 POBI-SS-28_20130311 POBI-SS-28-0-
10-130311
2013 0 10 X X Impacted by sites and sources in Budd Inlet
G1300053 G1300053-SS-
29
POBI-SS-29_20130311 POBI-SS-29_20130311 POBI-SS-29-0-
10-130311
2013 0 10 X X Impacted by sites and sources in Budd Inlet
G1300053 G1300053-SS-
30
POBI-SS-30_20130311 POBI-SS-30_20130311 POBI-SS-30-0-
10-130311
2013 0 10 X X Collected from low concentration area in the vicinity of
the LOTT outfall in Budd Inlet
G1300053 G1300053-SS-
31
POBI-SS-31_20130306 POBI-SS-31_20130306 POBI-SS-31-0-
10-130306
2013 0 10 X X Collected from low concentration area in the vicinity of
the LOTT outfall in Budd Inlet
G1300053 G1300053-SS-
32
POBI-SS-32_20130308 POBI-SS-32_20130308 POBI-SS-32-0-
10-130308
2013 0 10 X X Collected from low concentration area in the vicinity of
the LOTT outfall in Budd Inlet
G1300053 G1300053-SS-
33
POBI-SS-33_20130308 POBI-SS-33_20130308 POBI-SS-33-0-
10-130308
2013 0 10 X X Collected from low concentration area in the vicinity of
the LOTT outfall in Budd Inlet
G1300053 G1300053-SS-
34
POBI-SS-34_20130311 POBI-SS-34_20130311 POBI-SS-34-0-
10-130311
2013 0 10 X X Collected from low concentration area in the vicinity of
the LOTT outfall in Budd Inlet
G1300053 G1300053-SS-
35
POBI-SS-35_20130311 POBI-SS-35_20130311 POBI-SS-35-0-
10-130311
2013 0 10 X X Impacted by sites and sources in Budd Inlet
G1300053 G1300053-SS-
36
POBI-SS-36_20130307 POBI-SS-36_20130307 POBI-SS-36-0-
10-130307
2013 0 10 X X Impacted by sites and sources in Budd Inlet

South Puget Sound Regional Background: Data Evaluation & Summary Report
Washington State Department of Ecology 47 Publication No. 18-09-117
Table A-1 – Screening of EIM data set for cPAHs and dioxins/furans in South Puget Sound. Grey cells indicate data that were retained for the regional background data sets. Reasons for exclusion of the remaining
data are provided in Column K.
Study_ID Location_ID Study_Specific_Location
_ID
Location_Name Sample_ID Year
Collect
ed
Upp
er
Dep
th
Low
er
Dept
h
Dioxin/Fu
ran
Congener
s
cPAH
Compou
nds
Reason for Exclusion
G1300053 G1300053-SS-
37
POBI-SS-37_20130311 POBI-SS-37_20130311 POBI-SS-37-0-
10-130311
2013 0 10 X X Impacted by sites and sources in Budd Inlet
G1300053 G1300053-SS-
38
POBI-SS-38_20130307 POBI-SS-38_20130307 POBI-SS-38-0-
10-130307
2013 0 10 X X Impacted by sites and sources in Budd Inlet
G1300053 G1300053-SS-
39
POBI-SS-39_20130307 POBI-SS-39_20130307 POBI-SS-39-0-
10-130307
2013 0 10 X X Impacted by sites and sources in Budd Inlet
G1300053 G1300053-SS-
40
POBI-SS-40_20130307 POBI-SS-40_20130307 POBI-SS-40-0-
10-130307
2013 0 10 X X Impacted by sites and sources in Budd Inlet
G1300053 G1300053-SS-
41
POBI-SS-41_20130307 POBI-SS-41_20130307 POBI-SS-41-0-
10-130307
2013 0 10 X X Impacted by sites and sources in Budd Inlet
G1300053 G1300053-SS-
42
POBI-SS-42_20130307 POBI-SS-42_20130307 POBI-SS-42-0-
10-130307
2013 0 10 X X Impacted by sites and sources in Budd Inlet
G1300053 G1300053-SS-
43
POBI-SS-43_20130307 POBI-SS-43_20130307 POBI-SS-43-0-
10-130307
2013 0 10 X X Impacted by sites and sources in Budd Inlet
G1300053 G1300053-SS-
44
POBI-SS-44_20130306 POBI-SS-44_20130306 POBI-SS-44-0-
10-130306
2013 0 10 X X Impacted by sites and sources in Budd Inlet
G1300053 G1300053-SS-
45
POBI-SS-45_20130308 POBI-SS-45_20130308 POBI-SS-45-0-
10-130308
2013 0 10 X X Impacted by sites and sources in Budd Inlet
G1300053 G1300053-SS-
46
POBI-SS-46_20130307 POBI-SS-46_20130307 POBI-SS-46-0-
10-130307
2013 0 10 X X Impacted by sites and sources in Budd Inlet
G1300053 G1300053-SS-
47
POBI-SS-47_20130308 POBI-SS-47_20130308 POBI-SS-47-0-
10-130308
2013 0 10 X X Impacted by sites and sources in Budd Inlet
G1300053 G1300053-SS-
48
POBI-SS-48_20130308 POBI-SS-48_20130308 POBI-SS-48-0-
10-130308
2013 0 10 X X Impacted by sites and sources in Budd Inlet
G1300053 G1300053-SS-
49
POBI-SS-49_20130308 POBI-SS-49_20130308 POBI-SS-49-0-
10-130308
2013 0 10 X X Impacted by sites and sources in Budd Inlet
G1300053 G1300053-SS-
50
POBI-SS-50_20130307 POBI-SS-50_20130307 POBI-SS-50-0-
10-130307
2013 0 10 X X Impacted by sites and sources in Budd Inlet
G1300053 G1300053-SS-
51
POBI-SS-51_20130311 POBI-SS-51_20130311 POBI-SS-51-0-
10-130311
2013 0 10 X X Impacted by sites and sources in Budd Inlet
G1300053 G1300053-SS-
52
POBI-SS-52_20130311 POBI-SS-52_20130311 POBI-SS-52-0-
10-130311
2013 0 10 X X Impacted by sites and sources in Budd Inlet
G1300053 G1300053-SS-
53
POBI-SS-53_20130308 POBI-SS-53_20130308 POBI-SS-53-0-
10-130308
2013 0 10 X X Impacted by sites and sources in Budd Inlet
G1300053 G1300053-SS-
54
POBI-SS-54_20130308 POBI-SS-54_20130308 POBI-SS-54-0-
10-130308
2013 0 10 X X Impacted by sites and sources in Budd Inlet

South Puget Sound Regional Background: Data Evaluation & Summary Report
Washington State Department of Ecology 48 Publication No. 18-09-117
Table A-1 – Screening of EIM data set for cPAHs and dioxins/furans in South Puget Sound. Grey cells indicate data that were retained for the regional background data sets. Reasons for exclusion of the remaining
data are provided in Column K.
Study_ID Location_ID Study_Specific_Location
_ID
Location_Name Sample_ID Year
Collect
ed
Upp
er
Dep
th
Low
er
Dept
h
Dioxin/Fu
ran
Congener
s
cPAH
Compou
nds
Reason for Exclusion
G1300053 G1300053-SS-
55
POBI-SS-55_20130307 POBI-SS-55_20130307 POBI-SS-55-0-
10-130307
2013 0 10 X X Impacted by sites and sources in Budd Inlet
G1300053 G1300053-SS-
56
POBI-SS-56_20130311 POBI-SS-56_20130311 POBI-SS-56-0-
10-130311
2013 0 10 X X Impacted by sites and sources in Budd Inlet
G1300053 G1300053-SS-
57
POBI-SS-57_20130307 POBI-SS-57_20130307 POBI-SS-57-0-
10-130307
2013 0 10 X X Impacted by sites and sources in Budd Inlet
G1300053 G1300053-SS-
58
POBI-SS-58_20130312 POBI-SS-58_20130312 POBI-SS-58-0-
10-130312
2013 0 10 X X Impacted by sites and sources in Budd Inlet
G1300053 G1300053-SS-
59
POBI-SS-59_20130307 POBI-SS-59_20130307 POBI-SS-59-0-
10-130307
2013 0 10 X X Impacted by sites and sources in Budd Inlet
G1300053 G1300053-SS-
60
POBI-SS-60_20130307 POBI-SS-60_20130307 POBI-SS-60-0-
10-130307
2013 0 10 X X Impacted by sites and sources in Budd Inlet
G1300053 G1300053-SS-
61
POBI-SS-61_20130522 POBI-SS-61_20130522 POBI-SS-61-0-
10-130522
2013 0 10 X X Impacted by sites and sources in Budd Inlet
G1300053 G1300053-SS-
62
POBI-SS-62_20130522 POBI-SS-62_20130522 POBI-SS-62-0-
10-130522
2013 0 10 X X Impacted by sites and sources in Budd Inlet
G1300053 G1300053-SS-
63
POBI-SS-63_20130522 POBI-SS-63_20130522 POBI-SS-63-0-
10-130522
2013 0 10 X X Impacted by sites and sources in Budd Inlet
G1300053 G1300053-SS-
64
POBI-SS-64_20130522 POBI-SS-64_20130522 POBI-SS-64-0-
10-130522
2013 0 10 X X Impacted by sites and sources in Budd Inlet
G1300053 G1300053-SS-
65
POBI-SS-65_20130522 POBI-SS-65_20130522 POBI-SS-65-0-
10-130522
2013 0 10 X X Impacted by sites and sources in Budd Inlet
AODE5272 HC-WB-SS-
001
HC-Westbay-SS-001 HC-WESTBAY-SS-001 HC-WB-SS-
001
2011 0 10 X X Impacted by sites and sources in Budd Inlet
AODE5272 HC-WB-SS-
002
HC-Westbay-SS-002 HC-WESTBAY-SS-002 HC-WB-SS-
002
2011 0 10 X X Impacted by sites and sources in Budd Inlet
AODE5272 HC-WB-SS-
003
HC-Westbay-SS-003 HC-WESTBAY-SS-003 HC-WB-SS-
003
2011 0 10 X X Impacted by sites and sources in Budd Inlet
AODE5272 HC-WB-SS-
004
HC-Westbay-SS-004 HC-WESTBAY-SS-004 HC-WB-SS-
004
2011 0 10 X X Impacted by sites and sources in Budd Inlet
AODE5272 HC-WB-SS-
005
HC-Westbay-SS-005 HC-WESTBAY-SS-005 HC-WB-SS-
005
2011 0 10 X X Impacted by sites and sources in Budd Inlet
AODE5272 HC-WB-SS-
006
HC-Westbay-SS-006 HC-WESTBAY-SS-006 HC-WB-SS-
006
2011 0 10 X X Impacted by sites and sources in Budd Inlet
AODE5272 HC-WB-SS-
007
HC-Westbay-SS-007 HC-WESTBAY-SS-007 HC-WB-SS-
007
2011 0 10 X X Impacted by sites and sources in Budd Inlet

South Puget Sound Regional Background: Data Evaluation & Summary Report
Washington State Department of Ecology 49 Publication No. 18-09-117
Table A-1 – Screening of EIM data set for cPAHs and dioxins/furans in South Puget Sound. Grey cells indicate data that were retained for the regional background data sets. Reasons for exclusion of the remaining
data are provided in Column K.
Study_ID Location_ID Study_Specific_Location
_ID
Location_Name Sample_ID Year
Collect
ed
Upp
er
Dep
th
Low
er
Dept
h
Dioxin/Fu
ran
Congener
s
cPAH
Compou
nds
Reason for Exclusion
AODE5272 HC-WB-SS-
008
HC-Westbay-SS-008 HC-WESTBAY-SS-008 HC-WB-SS-
008
2011 0 10 X X Impacted by sites and sources in Budd Inlet
AJOH0049 SWANTOWN
2
SWANTOWN2 SWANTOWN
BOATWORKS
6080402 2006 0 2
X Impacted by sites and sources in Budd Inlet
BOLD 2008 SS_0 SS_0 SS_0 SS_0 2008 0 14 X X Impacted by sites and sources in Budd Inlet
Budd Inlet
Hardel 07
C396_HRDL_
GS-01
GS-1 Station GS-01 off Hardel GS-1 2007 0 10 X X Impacted by sites and sources in Budd Inlet
Budd Inlet
Hardel 07
C396_HRDL_
GS-02
GS-2 Station GS-02 off Hardel GS-2 2007 0 10 X X Impacted by sites and sources in Budd Inlet
Budd Inlet
Hardel 07
C396_HRDL_
GS0-3
GS-4 Station GS-03 off Hardel GS-4 2007 0 10 X
Impacted by sites and sources in Budd Inlet
BUDD07 BI-C10-0-
10cm
BI-C10-0-10cm SBI, EB BI-C10-0-10cm SBI, EB BI-C10 2007 0 10 X X Impacted by sites and sources in Budd Inlet
BUDD07 BI-C1-0-10cm BI-C1-0-10cm SBI,
turning basin
BI-C1-0-10cm SBI,
turning basin
BI-C1 2007 0 10 X
BUDD07 BI-C12-0-
10cm
BI-C12-0-10cm NBI BI-C12-0-10cm NBI BI-C12 2007 0 10 X
Impacted by sites and sources in Budd Inlet
BUDD07 BI-C13-0-
10cm
BI-C13-0-10cm SBI, near
Cascade Pole
BI-C13-0-10cm SBI, near
Cascade Pole
BI-C13 2007 0 10 X
Impacted by sites and sources in Budd Inlet
BUDD07 BI-C14-0-
10cm
BI-C14-0-10cm SBI, PO BI-C14-0-10cm SBI, PO BI-C14 2007 0 10 X X Impacted by sites and sources in Budd Inlet
BUDD07 BI-C15-0-
10cm
BI-C15-0-10cm SBI, PO
berth
BI-C15-0-10cm SBI, PO
berth
BI-C15 2007 0 10 X
Impacted by sites and sources in Budd Inlet
BUDD07 BI-C16-0-
10cm
BI-C16-0-10cm SBI, PO
berth
BI-C16-0-10cm SBI, PO
berth
BI-C16 2007 0 10 X
Impacted by sites and sources in Budd Inlet
BUDD07 BI-C17-0-
10cm
BI-C17-0-10cm SBI BI-C17-0-10cm SBI BI-C17 2007 0 10 X
Impacted by sites and sources in Budd Inlet
BUDD07 BI-C18-0-
10cm
BI-C18-0-10cm SBI, inner
EB
BI-C18-0-10cm SBI, inner
EB
BI-C18 2007 0 10 X X Impacted by sites and sources in Budd Inlet
BUDD07 BI-C2-0-10cm BI-C2-0-10cm SBI, WB BI-C2-0-10cm SBI, WB BI-C2 2007 0 10 X
Impacted by sites and sources in Budd Inlet
BUDD07 BI-C5-0-10cm BI-C5-0-10cm SBI, PO
berth
BI-C5-0-10cm SBI, PO
berth
BI-C5 2007 0 10 X
Impacted by sites and sources in Budd Inlet
BUDD07 BI-C6-0-10cm BI-C6-0-10cm SBI, mouth
of WB
BI-C6-0-10cm SBI, mouth
of WB
BI-C6 2007 0 10 X
Impacted by sites and sources in Budd Inlet
BUDD07 BI-C7-0-10cm BI-C7-0-10cm SBI, north
of peninsula
BI-C7-0-10cm SBI, north
of peninsula
BI-C7 2007 0 10 X
Collected from low concentration area in the vicinity of
the LOTT outfall in Budd Inlet

South Puget Sound Regional Background: Data Evaluation & Summary Report
Washington State Department of Ecology 50 Publication No. 18-09-117
Table A-1 – Screening of EIM data set for cPAHs and dioxins/furans in South Puget Sound. Grey cells indicate data that were retained for the regional background data sets. Reasons for exclusion of the remaining
data are provided in Column K.
Study_ID Location_ID Study_Specific_Location
_ID
Location_Name Sample_ID Year
Collect
ed
Upp
er
Dep
th
Low
er
Dept
h
Dioxin/Fu
ran
Congener
s
cPAH
Compou
nds
Reason for Exclusion
BUDD07 BI-C8-0-10cm BI-C8-0-10cm SBI, north
of peninsula
BI-C8-0-10cm SBI, north
of peninsula
BI-C8 2007 0 10 X
Collected from low concentration area in the vicinity of
the LOTT outfall in Budd Inlet
BUDD07 BI-C9-0-10cm BI-C9-0-10cm SBI, mouth
of EB
BI-C9-0-10cm SBI, mouth
of EB
BI-C9 2007 0 10 X
Impacted by sites and sources in Budd Inlet
BUDD07 BI-S1-0-10cm BI-S1-0-10cm SBI, inner
WB
BI-S1-0-10cm SBI, inner
WB
BI-S1 2007 0 10 X X
BUDD07 BI-S11-0-
10cm
BI-S11-0-10cm SBI, inner
WB
BI-S11-0-10cm SBI, inner
WB
BI-S11 2007 0 10 X X Impacted by sites and sources in Budd Inlet
BUDD07 BI-S12-0-
10cm
BI-S12-0-10cm SBI, north
of Cascade Pole
BI-S12-0-10cm SBI, north
of Cascade Pole
BI-S12 2007 0 10 X X Impacted by sites and sources in Budd Inlet
BUDD07 BI-S13-0-
10cm
BI-S13-0-10cm SBI, north
of peninsula
BI-S13-0-10cm SBI, north
of peninsula
BI-S13 2007 0 10 X
Impacted by sites and sources in Budd Inlet
BUDD07 BI-S14-0-
10cm
BI-S14-0-10cm SBI, north
of peninsula
BI-S14-0-10cm SBI, north
of peninsula
BI-S14 2007 0 10 X
Collected from low concentration area in the vicinity of
the LOTT outfall in Budd Inlet
BUDD07 BI-S15-0-
10cm
BI-S15-0-10cm SBI, near
Priest Pt Park
BI-S15-0-10cm SBI, near
Priest Pt Park
BI-S15 2007 0 10 X X Impacted by sites and sources in Budd Inlet
BUDD07 BI-S16-0-
10cm
BI-S16-0-10cm SBI, near
WB Marina
BI-S16-0-10cm SBI, near
WB Marina
BI-S16 2007 0 10 X
Impacted by sites and sources in Budd Inlet
BUDD07 BI-S17-0-
10cm
BI-S17-0-10cm SBI, near
WB Marina
BI-S17-0-10cm SBI, near
WB Marina
BI-S17 2007 0 10 X X Impacted by sites and sources in Budd Inlet
BUDD07 BI-S18-0-
10cm
BI-S18-0-10cm SBI BI-S18-0-10cm SBI BI-S18 2007 0 10 X X Impacted by sites and sources in Budd Inlet
BUDD07 BI-S19-0-
10cm
BI-S19-0-10cm SBI, near
Priest Pt Park
BI-S19-0-10cm SBI, near
Priest Pt Park
BI-S19 2007 0 10 X
Impacted by sites and sources in Budd Inlet
BUDD07 BI-S2-0-10cm BI-S2-0-10cm SBI, inner
WB
BI-S2-0-10cm SBI, inner
WB
BI-S2 2007 0 10 X
BUDD07 BI-S21-0-
10cm
BI-S21-0-10cm SBI, near
WB Marina
BI-S21-0-10cm SBI, near
WB Marina
BI-S21 2007 0 10 X X Impacted by sites and sources in Budd Inlet
BUDD07 BI-S23-0-
10cm
BI-S23-0-10cm NBI BI-S23-0-10cm NBI BI-S23 2007 0 10 X
Impacted by sites and sources in Budd Inlet
BUDD07 BI-S26-0-
10cm
BI-S26-0-10cm NBI BI-S26-0-10cm NBI BI-S26 2007 0 10 X
Impacted by sites and sources in Budd Inlet
BUDD07 BI-S28-0-
10cm
BI-S28-0-10cm NBI BI-S28-0-10cm NBI BI-S28 2007 0 10 X
BUDD07 BI-S29-0-
10cm
BI-S29-0-10cm NBI BI-S29-0-10cm NBI BI-S29 2007 0 10 X

South Puget Sound Regional Background: Data Evaluation & Summary Report
Washington State Department of Ecology 51 Publication No. 18-09-117
Table A-1 – Screening of EIM data set for cPAHs and dioxins/furans in South Puget Sound. Grey cells indicate data that were retained for the regional background data sets. Reasons for exclusion of the remaining
data are provided in Column K.
Study_ID Location_ID Study_Specific_Location
_ID
Location_Name Sample_ID Year
Collect
ed
Upp
er
Dep
th
Low
er
Dept
h
Dioxin/Fu
ran
Congener
s
cPAH
Compou
nds
Reason for Exclusion
BUDD07 BI-S3-0-10cm BI-S3-0-10cm SBI, inner
WB
BI-S3-0-10cm SBI, inner
WB
BI-S3 2007 0 10 X
BUDD07 BI-S31-0-
10cm
BI-S31-0-10cm SBI, boat
launch
BI-S31-0-10cm SBI, boat
launch
BI-S31 2007 0 10 X X Impacted by sites and sources in Budd Inlet
BUDD07 BI-S32-0-
10cm
BI-S32-0-10cm SBI,
Reliable Steel
BI-S32-0-10cm SBI,
Reliable Steel
BI-S32 2007 0 10 X X Impacted by sites and sources in Budd Inlet
BUDD07 BI-S33-0-
10cm
BI-S33-0-10cm SBI,
Reliable Steel
BI-S33-0-10cm SBI,
Reliable Steel
BI-S33 2007 0 10 X
Impacted by sites and sources in Budd Inlet
BUDD07 BI-S34 BI-S34 SBI, Park south of
PO
BI-S34 SBI, Park south of
PO
BI-S34 2007 0 10 X X Impacted by sites and sources in Budd Inlet
BUDD07 BI-S35-0-
10cm
BI-S35-0-10cm SBI,
mouth of WB
BI-S35-0-10cm SBI,
mouth of WB
BI-S35 2007 0 10 X
Impacted by sites and sources in Budd Inlet
BUDD07 BI-S36-0-
10cm
BI-S36-0-10cm SBI, PO
berth
BI-S36-0-10cm SBI, PO
berth
BI-S36 2007 0 10 X
Impacted by sites and sources in Budd Inlet
BUDD07 BI-S37-0-
10cm
BI-S37-0-10cm SBI, PO
berth
BI-S37-0-10cm SBI, PO
berth
BI-S37 2007 0 10 X
Impacted by sites and sources in Budd Inlet
BUDD07 BI-S38-0-
10cm
BI-S38-0-10cm SBI, PO BI-S38-0-10cm SBI, PO BI-S38 2007 0 10 X
Impacted by sites and sources in Budd Inlet
BUDD07 BI-S4-0-10cm BI-S4-0-10cm SBI, inner
WB
BI-S4-0-10cm SBI, inner
WB
BI-S4 2007 0 10 X X Impacted by sites and sources in Budd Inlet
BUDD07 BI-S5-0-10cm BI-S5-0-10cm SBI, near
Reliable Steel
BI-S5-0-10cm SBI, near
Reliable Steel
BI-S5 2007 0 10 X X Impacted by sites and sources in Budd Inlet
BUDD07 BI-S6-0-10cm BI-S6-0-10cm SBI, near
Hardel
BI-S6-0-10cm SBI, near
Hardel
BI-S6 2007 0 10 X
Impacted by sites and sources in Budd Inlet
BUDD07 BI-S7-0-10cm BI-S7-0-10cm SBI, near
Hardel
BI-S7-0-10cm SBI, near
Hardel
BI-S7 2007 0 10 X X Impacted by sites and sources in Budd Inlet
BUDD07 BI-S9-0-10cm BI-S9-0-10cm SBI, EB BI-S9-0-10cm SBI, EB BI-S9 2007 0 10 X X Impacted by sites and sources in Budd Inlet
BUDD07 BI-TISSUE1 BI-TISSUE1 SBI, Reliable
Steel
BI-TISSUE1 SBI, Reliable
Steel
BI-TISSUE1-
SEDIMENT
2007 0 10 X X Impacted by sites and sources in Budd Inlet
BUDD07 BI-TISSUE1B BI-TISSUE1B SBI,
Reliable Steel
BI-TISSUE1B SBI,
Reliable Steel
BI-TISSUE1B-
SEDIMENT
2007 0 10 X X Impacted by sites and sources in Budd Inlet
BUDD07 BI-TISSUE2 BI-TISSUE2 SBI, near
Priest Pt Park
BI-TISSUE2 SBI, near
Priest Pt Park
BI-TISSUE2-
SEDIMENT
2007 0 10 X X Impacted by sites and sources in Budd Inlet
BUDD07 BI-TISSUE3 BI-TISSUE3 SBI, near
Cascade Pole
BI-TISSUE3 SBI, near
Cascade Pole
BI-TISSUE3-
SEDIMENT
2007 0 10 X
Impacted by sites and sources in Budd Inlet
BUDD07 CL-S2 CL-S2 Capitol Lake CL-S2 Capitol Lake CL-S2 2007 0 10 X X Impacted by sites and sources in Budd Inlet
BUDD07 CL-S5 CL-S5 Capitol Lake CL-S5 Capitol Lake CL-S5 2007 0 10 X X Impacted by sites and sources in Budd Inlet

South Puget Sound Regional Background: Data Evaluation & Summary Report
Washington State Department of Ecology 52 Publication No. 18-09-117
Table A-1 – Screening of EIM data set for cPAHs and dioxins/furans in South Puget Sound. Grey cells indicate data that were retained for the regional background data sets. Reasons for exclusion of the remaining
data are provided in Column K.
Study_ID Location_ID Study_Specific_Location
_ID
Location_Name Sample_ID Year
Collect
ed
Upp
er
Dep
th
Low
er
Dept
h
Dioxin/Fu
ran
Congener
s
cPAH
Compou
nds
Reason for Exclusion
BuddOakDioxin
s
UWI2011-
UW40272
BI-40272 UWI2011-UW40272 1106045-16 2011 0 10 X
Impacted by sites and sources in Budd Inlet
BuddOakDioxin
s
BI-42704 BI-42704 BI-42704 1106045-25 2011 0 10 X
BuddOakDioxin
s
BI-42776 BI-42776 BI-42776 1106045-26 2011 0 10 X
Impacted by sites and sources in Budd Inlet
BuddOakDioxin
s
BI-43088 BI-43088 BI-43088 1106045-27 2011 0 10 X
BuddOakDioxin
s
BI-43216 BI-43216 BI-43216 1106045-28 2011 0 10 X
BuddOakDioxin
s
BI-S30 BI-S30 BI-S30 SBI, Moxlie Creek 1106045-29 2011 0 10 X X Impacted by sites and sources in Budd Inlet
BuddOakDioxin
s
BI-S7-0-10cm BI-S7 BI-S7-0-10cm SBI, near
Hardel
1106045-30 2011 0 10 X
Impacted by sites and sources in Budd Inlet
BuddOakDioxin
s
OAKBAY-
OB-10-SC
OB-10S OAKBAY-OB-10-SC 1106045-38 2011 0 10 X
Impacted by sites and sources in Oakland Bay
BuddOakDioxin
s
OB-12.5S OB-12.5S OB-12.5S 1106045-40 2011 0 10 X
Impacted by sites and sources in Oakland Bay
BuddOakDioxin
s
UWI2011-
PSUW012
BI-12 UWI2011-PSUW012 1106045-01 2011 0 10 X
BuddOakDioxin
s
UWI2011-
PSUW020
BI-20 UWI2011-PSUW020 1106045-02 2011 0 10 X X Impacted by sites and sources in Budd Inlet
BuddOakDioxin
s
UWI2011-
PSUW084
BI-84 UWI2011-PSUW084 1106045-03 2011 0 10 X X Impacted by sites and sources in Budd Inlet
BuddOakDioxin
s
UWI2011-
PSUW116
BI-116 UWI2011-PSUW116 1106045-04 2011 0 10 X
BuddOakDioxin
s
UWI2011-
PSUW140
BI-140 UWI2011-PSUW140 1106045-05 2011 0 10 X
BuddOakDioxin
s
UWI2011-
PSUW148
BI-148 UWI2011-PSUW148 1106045-06 2011 0 10 X
Impacted by sites and sources in Budd Inlet
BuddOakDioxin
s
UWI2011-
PSUW244
BI-244 UWI2011-PSUW244 1106045-10 2011 0 10 X
BuddOakDioxin
s
UWI2011-
PSUW268
BI-268 UWI2011-PSUW268 1106045-11 2011 0 10 X
BuddOakDioxin
s
UWI2011-
PSUW268
BI-268 UWI2011-PSUW268 -- 2011 0 2 X
Removed in favor of 0 to 10 cm interval from the same
location

South Puget Sound Regional Background: Data Evaluation & Summary Report
Washington State Department of Ecology 53 Publication No. 18-09-117
Table A-1 – Screening of EIM data set for cPAHs and dioxins/furans in South Puget Sound. Grey cells indicate data that were retained for the regional background data sets. Reasons for exclusion of the remaining
data are provided in Column K.
Study_ID Location_ID Study_Specific_Location
_ID
Location_Name Sample_ID Year
Collect
ed
Upp
er
Dep
th
Low
er
Dept
h
Dioxin/Fu
ran
Congener
s
cPAH
Compou
nds
Reason for Exclusion
BuddOakDioxin
s
UWI2011-
PSUW300
BI-300 UWI2011-PSUW300 1106045-12 2011 0 10 X
Impacted by sites and sources in Budd Inlet
BuddOakDioxin
s
UWI2011-
PSUW556
BI-556 UWI2011-PSUW556 1106046-60 2011 0 10 X
Impacted by sites and sources in Budd Inlet
BuddOakDioxin
s
UWI2011-
UW40056
BI-40056 UWI2011-UW40056 1106046-62 2011 0 10 X X Impacted by sites and sources in Budd Inlet
BuddOakDioxin
s
UWI2011-
UW40216
BI-40216 UWI2011-UW40216 1106045-15 2011 0 10 X X Impacted by sites and sources in Budd Inlet
BuddOakDioxin
s
UWI2011-
UW40272
BI-40272 UWI2011-UW40272 1106045-16 2011 0 10 X X
BuddOakDioxin
s
UWI2011-
UW40528
BI-40528 UWI2011-UW40528 1106045-17 2011 0 10 X
BuddOakDioxin
s
UWI2011-
UW40984
BI-40984 UWI2011-UW40984 1106045-18 2011 0 10 X X Impacted by sites and sources in Budd Inlet
BuddOakDioxin
s
UWI2011-
UW41040
BI-41040 UWI2011-UW41040 1106045-19 2011 0 10 X X Impacted by sites and sources in Budd Inlet
BuddOakDioxin
s
UWI2011-
UW41240
BI-41240 UWI2011-UW41240 1106045-20 2011 0 10 X X Impacted by sites and sources in Budd Inlet
BuddOakDioxin
s
UWI2011-
UW41296
BI-41296 UWI2011-UW41296 1106045-21 2011 0 10 X X Impacted by sites and sources in Budd Inlet
BuddOakDioxin
s
UWI2011-
UW41552
BI-41552 UWI2011-UW41552 1106045-22 2011 0 10 X
BuddOakDioxin
s
UWI2011-
UW41680
BI-41680 UWI2011-UW41680 1106045-23 2011 0 10 X
BuddOakDioxin
s
UWI2011-
UW41752
BI-41752 UWI2011-UW41752 1106045-24 2011 0 10 X
BuddOakDioxin
s
UWI2011-
UWNO236
BI-236 UWI2011-UWNO236 1106045-07 2011 0 10 X
BuddOakDioxin
s
UWI2011-
UWNO241
BI-241 UWI2011-UWNO241 1106045-08 2011 0 10 X
BuddOakDioxin
s
UWI2011-
UWNO242
BI-242 UWI2011-UWNO242 1106046-45 2011 0 10 X X Impacted by sites and sources in Budd Inlet
FS1385 TCPSR753-
CP-16
CP-16-M2 CP-16-M2 VO23L 2012 0 10 X X Impacted by sites and sources in Budd Inlet
FS1385 TCPSR753-
CP-17
CP-17-M2 CP-17-M2 VO23M 2012 0 10 X X Impacted by sites and sources in Budd Inlet

South Puget Sound Regional Background: Data Evaluation & Summary Report
Washington State Department of Ecology 54 Publication No. 18-09-117
Table A-1 – Screening of EIM data set for cPAHs and dioxins/furans in South Puget Sound. Grey cells indicate data that were retained for the regional background data sets. Reasons for exclusion of the remaining
data are provided in Column K.
Study_ID Location_ID Study_Specific_Location
_ID
Location_Name Sample_ID Year
Collect
ed
Upp
er
Dep
th
Low
er
Dept
h
Dioxin/Fu
ran
Congener
s
cPAH
Compou
nds
Reason for Exclusion
FS1385 TCPSR753-
CP-18
CP-18-M2 CP-18-M2 VO23P 2012 0 10 X X Impacted by sites and sources in Budd Inlet
FS1385 TCPSR753-
CP-19
CP-19-M2 CP-19-M2 VO23O 2012 0 10 X X Impacted by sites and sources in Budd Inlet
FS1385 TCPSR753-
CP-20
CP-20-M2 CP-20-M2 VO23K 2012 0 10 X
Impacted by sites and sources in Budd Inlet
FS1385 TCPSR753-
CP-21
CP-21 CP-21 VY94J 2013 0 10
X Impacted by sites and sources in Budd Inlet
FS1385 TCPSR753-
CP-22
CP-22 CP-22 VY94I 2013 0 10
X Impacted by sites and sources in Budd Inlet
FS1385 TCPSR753-
CP-23
CP-23 CP-23 VY94H 2013 0 10
X Impacted by sites and sources in Budd Inlet
FS1385 TCPSR753-
CP-24
CP-24 CP-24 VY94G 2013 0 10
X Impacted by sites and sources in Budd Inlet
FS1385 TCPSR753-
CP-25
CP-25 CP-25 VY94F 2013 0 10
X Impacted by sites and sources in Budd Inlet
FS1385 TCPSR753-
CP-26
CP-26 CP-26 VY94A 2013 0 10
X Impacted by sites and sources in Budd Inlet
FS1385 TCPSR753-
CP-27
CP-27 CP-27 VY94B 2013 0 10
X Impacted by sites and sources in Budd Inlet
FS1385 TCPSR753-
CP-28
CP-28 CP-28 VY94K 2013 0 10
X Impacted by sites and sources in Budd Inlet
FS1385 TCPSR753-
CP-29
CP-29 CP-29 VY94D 2013 0 10
X Impacted by sites and sources in Budd Inlet
FS1385 TCPSR753-
CP-30
CP-30 CP-30 VY94L 2013 0 10
X Impacted by sites and sources in Budd Inlet
FS1385 TCPSR753-
CP-31
CP-31 CP-31 VY94M 2013 0 10
X Impacted by sites and sources in Budd Inlet
FS1385 TCPSR753-
CP-32
CP-32 CP-32 VY94N 2013 0 10
X Impacted by sites and sources in Budd Inlet
FS1385 TCPSR753-
CP-33
CP-33 CP-33 VY94O 2013 0 10
X Impacted by sites and sources in Budd Inlet
FS1385 TCPSR753-
CP-34
CP-34 CP-34 VY94E 2013 0 10
X Impacted by sites and sources in Budd Inlet
FS1385 TCPSR753-
CP-35
CP-35 CP-35 VY94P 2013 0 10
X Impacted by sites and sources in Budd Inlet

South Puget Sound Regional Background: Data Evaluation & Summary Report
Washington State Department of Ecology 55 Publication No. 18-09-117
Table A-1 – Screening of EIM data set for cPAHs and dioxins/furans in South Puget Sound. Grey cells indicate data that were retained for the regional background data sets. Reasons for exclusion of the remaining
data are provided in Column K.
Study_ID Location_ID Study_Specific_Location
_ID
Location_Name Sample_ID Year
Collect
ed
Upp
er
Dep
th
Low
er
Dept
h
Dioxin/Fu
ran
Congener
s
cPAH
Compou
nds
Reason for Exclusion
FS1385 TCPSR753-
CP-36
CP-36 CP-36 VY94Q 2013 0 10
X Impacted by sites and sources in Budd Inlet
FS1385 TCPSR753-
CP-37
CP-37 CP-37 VY94R 2013 0 10
X Impacted by sites and sources in Budd Inlet
FS94656838Ph2 WB1577SD01 SD01 SD01 SD-01 2007 0 0 X
Intertidal sample collected from fill in south West Bay
FS94656838Ph2 WB1577SD02 SD02 SD02 SD-02 2007 0 0 X
Intertidal sample collected from fill in south West Bay
FS94656838Ph2 WB1577SD03 SD03 SD03 SD-03 2007 0 0 X
Intertidal sample collected from fill in south West Bay
FS94656838Ph2 WB1577SD04 SD04 SD04 SD-04 2007 0 0 X
Intertidal sample collected from fill in south West Bay
FS94656838Ph2 WB1577SD05 SD05 SD05 SD-05 2007 0 0 X
Impacted by sites and sources in Budd Inlet
FS94656838Ph2 WB1577SD06 SD06 SD06 SD-06 2007 0 0 X
Impacted by sites and sources in Budd Inlet
OAKSED08 OAKBAY-HI-
02-SS
HI-02-SS OAKBAY-HI-02-SS HI-02-SS-00 2008 0 10 X X Scoured by currents of Hammersly Inlet
OAKSED08 OAKBAY-HI-
03-SS
HI-03-SS OAKBAY-HI-03-SS HI-03-SS-00 2008 0 10 X X Scoured by currents of Hammersly Inlet
OAKSED08 OAKBAY-HI-
04-SS
HI-04-SS OAKBAY-HI-04-SS HI-04-SS-00 2008 0 10 X X Scoured by currents of Hammersly Inlet
OAKSED08 OAKBAY-HI-
05-SS
HI-05-SS OAKBAY-HI-05-SS HI-05-SS-00 2008 0 10 X X Scoured by currents of Hammersly Inlet
OAKSED08 OAKBAY-HI-
06-SS
HI-06-SS OAKBAY-HI-06-SS HI-06-SS-00 2008 0 10 X X Scoured by currents of Hammersly Inlet
OAKSED08 OAKBAY-HI-
07-SS
HI-07-SS OAKBAY-HI-07-SS HI-07-SS-00 2008 0 10 X X Scoured by currents of Hammersly Inlet
OAKSED08 OAKBAY-
OB-01-SS
OB-01-SS OAKBAY-OB-01-SS OB-01-SS-00 2008 0 10 X X Scoured by currents of Hammersly Inlet
OAKSED08 OAKBAY-
OB-02-SS
OB-02-SS OAKBAY-OB-02-SS OB-02-SS-00 2008 0 10 X X Dioxins impacted by elevated sources, cPAH below
natural background - Oakland Bay
OAKSED08 OAKBAY-
OB-03-SS
OB-03-SS OAKBAY-OB-03-SS OB-03-SS-00 2008 0 10 X X Dioxins impacted by elevated sources, cPAH below
natural background - Oakland Bay
OAKSED08 OAKBAY-
OB-04-SS
OB-04-SS OAKBAY-OB-04-SS OB-04-SS-00 2008 0 10 X X Dioxins impacted by elevated sources, cPAH below
natural background - Oakland Bay
OAKSED08 OAKBAY-
OB-05-SS
OB-05-SS OAKBAY-OB-05-SS OB-05-SS-00 2008 0 10 X X Dioxins impacted by elevated sources, cPAH below
natural background - Oakland Bay
OAKSED08 OAKBAY-
OB-06-SS
OB-06-SS OAKBAY-OB-06-SS OB-06-SS-00 2008 0 10 X X Dioxins impacted by elevated sources, cPAH below
natural background - Oakland Bay
OAKSED08 OAKBAY-
OB-07-SS
OB-07-SS OAKBAY-OB-07-SS OB-07-SS-00 2008 0 10 X X Dioxins impacted by elevated sources, cPAH below
natural background - Oakland Bay
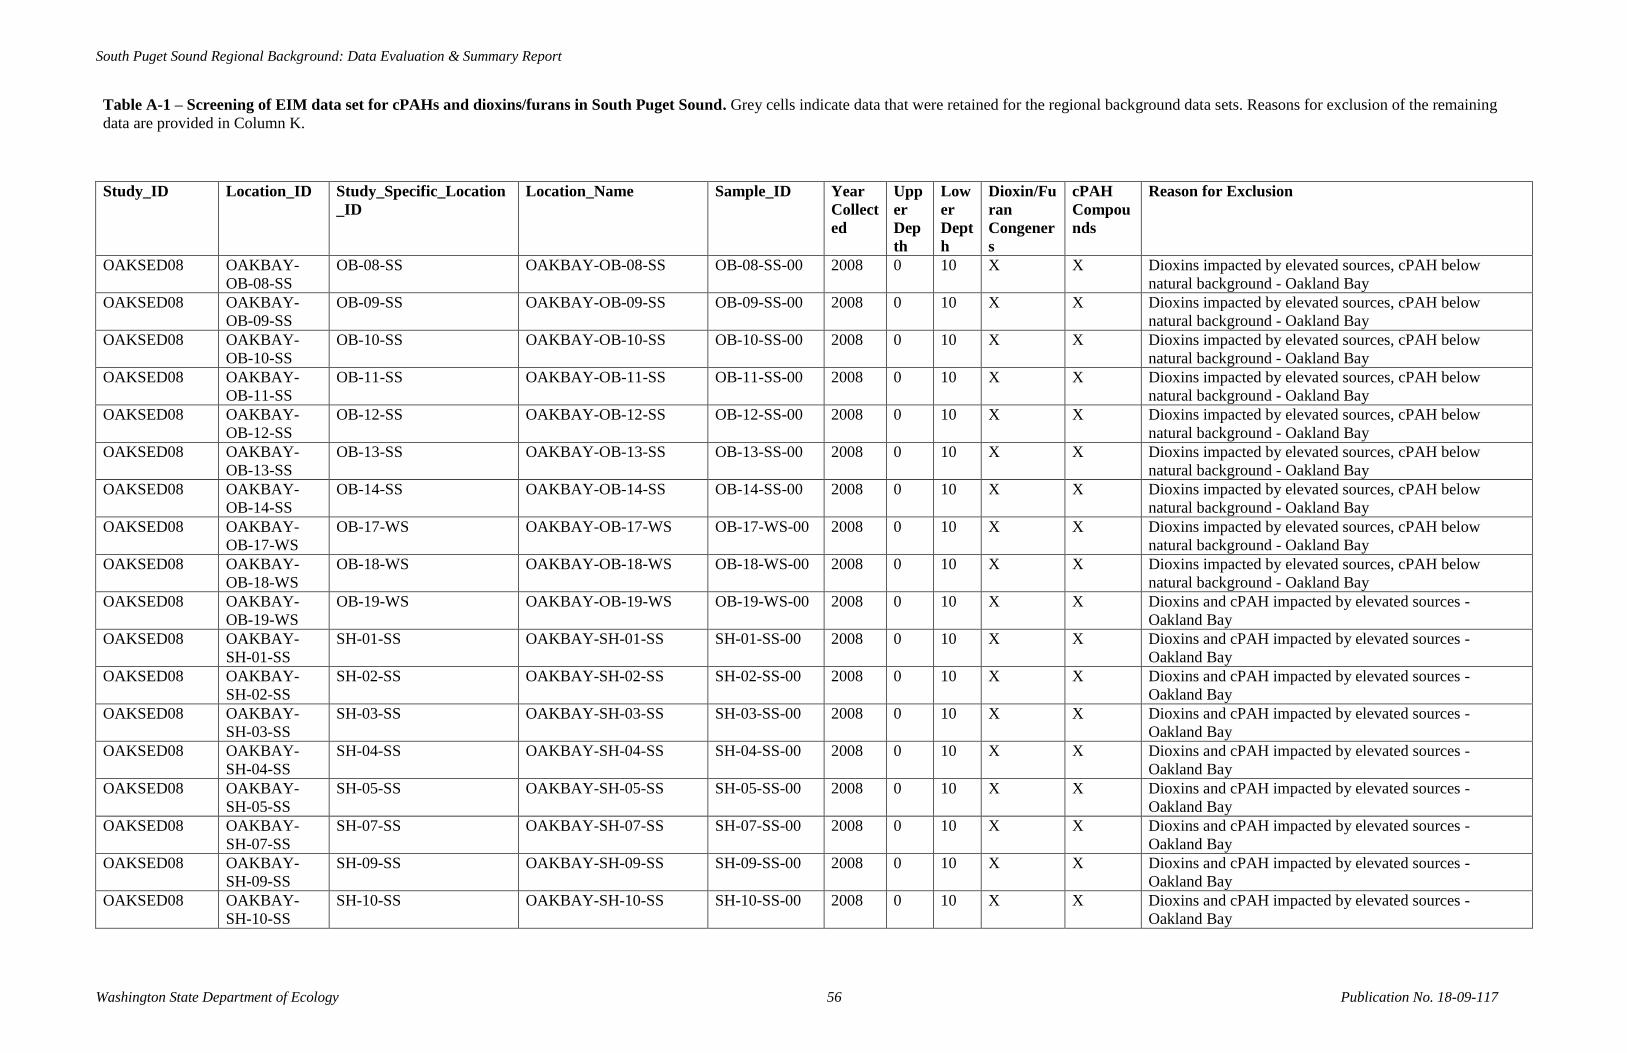
South Puget Sound Regional Background: Data Evaluation & Summary Report
Washington State Department of Ecology 56 Publication No. 18-09-117
Table A-1 – Screening of EIM data set for cPAHs and dioxins/furans in South Puget Sound. Grey cells indicate data that were retained for the regional background data sets. Reasons for exclusion of the remaining
data are provided in Column K.
Study_ID Location_ID Study_Specific_Location
_ID
Location_Name Sample_ID Year
Collect
ed
Upp
er
Dep
th
Low
er
Dept
h
Dioxin/Fu
ran
Congener
s
cPAH
Compou
nds
Reason for Exclusion
OAKSED08 OAKBAY-
OB-08-SS
OB-08-SS OAKBAY-OB-08-SS OB-08-SS-00 2008 0 10 X X Dioxins impacted by elevated sources, cPAH below
natural background - Oakland Bay
OAKSED08 OAKBAY-
OB-09-SS
OB-09-SS OAKBAY-OB-09-SS OB-09-SS-00 2008 0 10 X X Dioxins impacted by elevated sources, cPAH below
natural background - Oakland Bay
OAKSED08 OAKBAY-
OB-10-SS
OB-10-SS OAKBAY-OB-10-SS OB-10-SS-00 2008 0 10 X X Dioxins impacted by elevated sources, cPAH below
natural background - Oakland Bay
OAKSED08 OAKBAY-
OB-11-SS
OB-11-SS OAKBAY-OB-11-SS OB-11-SS-00 2008 0 10 X X Dioxins impacted by elevated sources, cPAH below
natural background - Oakland Bay
OAKSED08 OAKBAY-
OB-12-SS
OB-12-SS OAKBAY-OB-12-SS OB-12-SS-00 2008 0 10 X X Dioxins impacted by elevated sources, cPAH below
natural background - Oakland Bay
OAKSED08 OAKBAY-
OB-13-SS
OB-13-SS OAKBAY-OB-13-SS OB-13-SS-00 2008 0 10 X X Dioxins impacted by elevated sources, cPAH below
natural background - Oakland Bay
OAKSED08 OAKBAY-
OB-14-SS
OB-14-SS OAKBAY-OB-14-SS OB-14-SS-00 2008 0 10 X X Dioxins impacted by elevated sources, cPAH below
natural background - Oakland Bay
OAKSED08 OAKBAY-
OB-17-WS
OB-17-WS OAKBAY-OB-17-WS OB-17-WS-00 2008 0 10 X X Dioxins impacted by elevated sources, cPAH below
natural background - Oakland Bay
OAKSED08 OAKBAY-
OB-18-WS
OB-18-WS OAKBAY-OB-18-WS OB-18-WS-00 2008 0 10 X X Dioxins impacted by elevated sources, cPAH below
natural background - Oakland Bay
OAKSED08 OAKBAY-
OB-19-WS
OB-19-WS OAKBAY-OB-19-WS OB-19-WS-00 2008 0 10 X X Dioxins and cPAH impacted by elevated sources -
Oakland Bay
OAKSED08 OAKBAY-
SH-01-SS
SH-01-SS OAKBAY-SH-01-SS SH-01-SS-00 2008 0 10 X X Dioxins and cPAH impacted by elevated sources -
Oakland Bay
OAKSED08 OAKBAY-
SH-02-SS
SH-02-SS OAKBAY-SH-02-SS SH-02-SS-00 2008 0 10 X X Dioxins and cPAH impacted by elevated sources -
Oakland Bay
OAKSED08 OAKBAY-
SH-03-SS
SH-03-SS OAKBAY-SH-03-SS SH-03-SS-00 2008 0 10 X X Dioxins and cPAH impacted by elevated sources -
Oakland Bay
OAKSED08 OAKBAY-
SH-04-SS
SH-04-SS OAKBAY-SH-04-SS SH-04-SS-00 2008 0 10 X X Dioxins and cPAH impacted by elevated sources -
Oakland Bay
OAKSED08 OAKBAY-
SH-05-SS
SH-05-SS OAKBAY-SH-05-SS SH-05-SS-00 2008 0 10 X X Dioxins and cPAH impacted by elevated sources -
Oakland Bay
OAKSED08 OAKBAY-
SH-07-SS
SH-07-SS OAKBAY-SH-07-SS SH-07-SS-00 2008 0 10 X X Dioxins and cPAH impacted by elevated sources -
Oakland Bay
OAKSED08 OAKBAY-
SH-09-SS
SH-09-SS OAKBAY-SH-09-SS SH-09-SS-00 2008 0 10 X X Dioxins and cPAH impacted by elevated sources -
Oakland Bay
OAKSED08 OAKBAY-
SH-10-SS
SH-10-SS OAKBAY-SH-10-SS SH-10-SS-00 2008 0 10 X X Dioxins and cPAH impacted by elevated sources -
Oakland Bay

South Puget Sound Regional Background: Data Evaluation & Summary Report
Washington State Department of Ecology 57 Publication No. 18-09-117
Table A-1 – Screening of EIM data set for cPAHs and dioxins/furans in South Puget Sound. Grey cells indicate data that were retained for the regional background data sets. Reasons for exclusion of the remaining
data are provided in Column K.
Study_ID Location_ID Study_Specific_Location
_ID
Location_Name Sample_ID Year
Collect
ed
Upp
er
Dep
th
Low
er
Dept
h
Dioxin/Fu
ran
Congener
s
cPAH
Compou
nds
Reason for Exclusion
OAKSED08 OAKBAY-
SH-11-SS
SH-11-SS OAKBAY-SH-11-SS SH-11-SS-00 2008 0 10 X X Dioxins and cPAH impacted by elevated sources -
Oakland Bay
OAKSED08 OAKBAY-
SH-12-SS
SH-12-SS OAKBAY-SH-12-SS SH-12-SS-00 2008 0 10 X X Dioxins and cPAH impacted by elevated sources -
Oakland Bay
OAKSED08 OAKBAY-
SH-13-SS
SH-13-SS OAKBAY-SH-13-SS SH-13-SS-00 2008 0 10 X X Dioxins and cPAH impacted by elevated sources -
Oakland Bay
OAKSED08 OAKBAY-
SH-14-SS
SH-14-SS OAKBAY-SH-14-SS SH-14-SS-00 2008 0 10 X X Dioxins and cPAH impacted by elevated sources -
Oakland Bay
OAKSED08 OAKBAY-
SH-15-SS
SH-15-SS OAKBAY-SH-15-SS SH-15-SS-00 2008 0 10 X X Scoured by currents of Hammersly Inlet
OAKSED08 OAKBAY-
SH-16-SS
SH-16-SS OAKBAY-SH-16-SS SH-16-SS-00 2008 0 10 X X Scoured by currents of Hammersly Inlet
OAKSED08 OAKBAY-
SH-18-WS
SH-18-WS OAKBAY-SH-18-WS SH-18-WS-00 2008 0 10 X X Dioxins and cPAH impacted by elevated sources -
Oakland Bay
OAKSED08 OAKBAY-
SH-19-WS
SH-19-WS OAKBAY-SH-19-WS SH-19-WS-00 2008 0 10 X X Dioxins and cPAH impacted by elevated sources -
Oakland Bay
OAKSED08 OAKBAY-
SH-20-WS
SH-20-WS OAKBAY-SH-20-WS SH-20-WS-00 2008 0 10 X X Dioxins and cPAH impacted by elevated sources -
Oakland Bay
OAKSED08 OAKBAY-
SH-21-WS
SH-21-WS OAKBAY-SH-21-WS SH-21-WS-00 2008 0 10 X X Dioxins and cPAH impacted by elevated sources -
Oakland Bay
OAKSED08 OAKBAY-
SH-22-WS
SH-22-WS OAKBAY-SH-22-WS SH-22-WS-00 2008 0 10 X X Dioxins and cPAH impacted by elevated sources -
Oakland Bay
OAKSED08 OAKBAY-
SH-23-WS
SH-23-WS OAKBAY-SH-23-WS SH-23-WS-00 2008 0 10 X X Dioxins and cPAH impacted by elevated sources -
Oakland Bay
OAKSED08 OAKBAY-
SH-24-WS
SH-24-WS OAKBAY-SH-24-WS SH-24-WS-00 2008 0 10 X X Dioxins and cPAH impacted by elevated sources -
Oakland Bay
OAKSED08 OAKBAY-
SH-25-WS
SH-25-WS OAKBAY-SH-25-WS SH-25-WS-00 2008 0 10 X X Dioxins and cPAH impacted by elevated sources -
Oakland Bay
OAKSED08 OAKBAY-
SH-26-WS
SH-26-WS OAKBAY-SH-26-WS SH-26-WS-00 2008 0 10 X X Dioxins and cPAH impacted by elevated sources -
Oakland Bay
OAKSED08 OAKBAY-
SH-27-WS
SH-27-WS OAKBAY-SH-27-WS SH-27-WS-00 2008 0 10 X X Dioxins and cPAH impacted by elevated sources -
Oakland Bay
OAKSED08 OAKBAY-
SH-28-WS
SH-28-WS OAKBAY-SH-28-WS SH-28-WS-00 2008 0 10 X X Dioxins and cPAH impacted by elevated sources -
Oakland Bay
OAKSED08 OAKBAY-
SH-29-WS
SH-29-WS OAKBAY-SH-29-WS SH-29-WS-00 2008 0 10 X X Scoured by currents of Hammersly Inlet

South Puget Sound Regional Background: Data Evaluation & Summary Report
Washington State Department of Ecology 58 Publication No. 18-09-117
Table A-1 – Screening of EIM data set for cPAHs and dioxins/furans in South Puget Sound. Grey cells indicate data that were retained for the regional background data sets. Reasons for exclusion of the remaining
data are provided in Column K.
Study_ID Location_ID Study_Specific_Location
_ID
Location_Name Sample_ID Year
Collect
ed
Upp
er
Dep
th
Low
er
Dept
h
Dioxin/Fu
ran
Congener
s
cPAH
Compou
nds
Reason for Exclusion
OAKSED08 OAKBAY-
SH-30-WS
SH-30-WS OAKBAY-SH-30-WS SH-30-WS-00 2008 0 10 X X Dioxins and cPAH impacted by elevated sources -
Oakland Bay
OHPSD06 OHPSD0224-
S12
DMMP-OHPSD-AF-0224-
S12
DMMP-OHPSD-AF-0224-
S12
CORE 20 2006 0 10 X
Impacted by sites and sources in Budd Inlet
OHPSD06 OHPSD0224-
S13
DMMP-OHPSD-AF-0224-
S13
DMMP-OHPSD-AF-0224-
S13
CORE 21 2006 0 10 X
Impacted by sites and sources in Budd Inlet
OlyMarineTerm
inal08
AM-28-
090313
Post-Cover_PO-AM-28-
090313
Post-Cover_PO-AM-28-
090313
PO-AM-28-SS-
A-090313
2009 0 10 X
Impacted by sites and sources in Budd Inlet
OlyMarineTerm
inal08
BA-24-
090226
Post-Dredge_PO-BA-24-
090226
Post-Dredge_PO-BA-24-
090226
PO-BA-24-SS-
A-090226
2009 0 10 X
Impacted by sites and sources in Budd Inlet
OlyMarineTerm
inal08
BA-24-
090313
Post-Cover_PO-BA-24-
090313
Post-Cover_PO-BA-24-
090313
PO-BA-24-SS-
A-090313
2009 0 10 X
Impacted by sites and sources in Budd Inlet
OlyMarineTerm
inal08
BA-25-
090226
Post-Dredge_PO-BA-25-
090226
Post-Dredge_PO-BA-25-
090226
PO-BA-25-SS-
A-090226
2009 0 10 X
Impacted by sites and sources in Budd Inlet
OlyMarineTerm
inal08
BA-25-
090316
Post-Cover_PO-BA-25-
090316
Post-Cover_PO-BA-25-
090316
PO-BA-25-SS-
A-090316
2009 0 10 X
Impacted by sites and sources in Budd Inlet
OlyMarineTerm
inal08
BA-26-
090226
Post-Dredge_PO-BA-26-
090226
Post-Dredge_PO-BA-26-
090226
PO-BA-26-SS-
A-090226
2009 0 10 X
Impacted by sites and sources in Budd Inlet
OlyMarineTerm
inal08
BA-26-
090316
Post-Cover_PO-BA-26-
090316
Post-Cover_PO-BA-26-
090316
PO-BA-26-SS-
A-090316
2009 0 10 X
Impacted by sites and sources in Budd Inlet
OlyMarineTerm
inal08
BA-27B-
090226
Post-Dredge_PO-BA-27B-
090226
Post-Dredge_PO-BA-27B-
090226
PO-BA-27B-
SS-A-090226
2009 0 10 X
Impacted by sites and sources in Budd Inlet
OlyMarineTerm
inal08
BA-27B-
090313
Post-Cover_PO-BA-27B-
090313
Post-Cover_PO-BA-27B-
090313
PO-BA-27B-
SS-A-090313
2009 0 10 X
Impacted by sites and sources in Budd Inlet
OlyMarineTerm
inal08
BI-C16-
090313
Post-Cover_BI-C16-
090313
Post-Cover_BI-C16-
090313
B1-C16-SS-A-
090313
2009 0 10 X
Impacted by sites and sources in Budd Inlet
OlyMarineTerm
inal08
BI-S37-
090313
Post-Cover_BI-S37-
090313
Post-Cover_BI-S37-
090313
B1-S37-SS-A-
090313
2009 0 10 X
Impacted by sites and sources in Budd Inlet
OlyMarineTerm
inal08
UP-20-090313 Post-Cover_PO-UP-20-
090313
Post-Cover_PO-UP-20-
090313
PO-UP-20-SS-
A-090313
2009 0 10 X
Impacted by sites and sources in Budd Inlet
OlyMarineTerm
inal08
UP-21-090313 Post-Cover_PO-UP-21-
090313
Post-Cover_PO-UP-21-
090313
PO-UP-21-SS-
A-090313
2009 0 10 X
Impacted by sites and sources in Budd Inlet
OlyMarineTerm
inal08
UP-22-090313 Post-Cover_PO-UP-22-
090313
Post-Cover_PO-UP-22-
090313
PO-UP-22-SS-
A-090313
2009 0 10 X
Impacted by sites and sources in Budd Inlet
OlyMarineTerm
inal08
UP-23B-
090313
Post-Cover_PO-UP-23B-
090313
Post-Cover_PO-UP-23B-
090313
PO-UP-23B-
SS-A-090313
2009 0 10 X
Impacted by sites and sources in Budd Inlet
PriestPoint AAAA175 NA NA NA 2010 0 10 X
Result below natural background for dioxin

South Puget Sound Regional Background: Data Evaluation & Summary Report
Washington State Department of Ecology 59 Publication No. 18-09-117
Table A-1 – Screening of EIM data set for cPAHs and dioxins/furans in South Puget Sound. Grey cells indicate data that were retained for the regional background data sets. Reasons for exclusion of the remaining
data are provided in Column K.
Study_ID Location_ID Study_Specific_Location
_ID
Location_Name Sample_ID Year
Collect
ed
Upp
er
Dep
th
Low
er
Dept
h
Dioxin/Fu
ran
Congener
s
cPAH
Compou
nds
Reason for Exclusion
PriestPoint CC102 NA NA NA 2010 0 10 X
Result below natural background for dioxin
PriestPoint CCCC131 NA NA NA 2010 0 10 X
Result below natural background for dioxin
PriestPoint CCCC165 NA NA NA 2010 0 10 X
Result below natural background for dioxin
PriestPoint FF110 NA NA NA 2010 0 10 X
Result below natural background for dioxin
PriestPoint FFF209 NA NA NA 2010 0 10 X
Result below natural background for dioxin
PriestPoint II118 NA NA NA 2010 0 10 X
Result below natural background for dioxin
PriestPoint IIII142 NA NA NA 2010 0 10 X
Result below natural background for dioxin
PriestPoint KKKK159 NA NA NA 2010 0 10 X
Result below natural background for dioxin
PriestPoint LLLL121 NA NA NA 2010 0 10 X
Result below natural background for dioxin
PriestPoint N44 NA NA NA 2010 0 10 X
Result below natural background for dioxin
PriestPoint N57 NA NA NA 2010 0 10 X
Result below natural background for dioxin
PriestPoint OOO148 NA NA NA 2010 0 10 X
Result below natural background for dioxin
PriestPoint OOOO123 NA NA NA 2010 0 10 X
Result below natural background for dioxin
PriestPoint QQQQ184 NA NA NA 2010 0 10 X
Result below natural background for dioxin
PriestPoint QQQQ204 NA NA NA 2010 0 10 X
Result below natural background for dioxin
PriestPoint RRR159 NA NA NA 2010 0 10 X
Result below natural background for dioxin
PriestPoint RRR181 NA NA NA 2010 0 10 X
Result below natural background for dioxin
PriestPoint RRR181 NA NA NA 2010 0 10 X
Result below natural background for dioxin
PriestPoint RRR200 NA NA NA 2010 0 10 X
Result below natural background for dioxin
PriestPoint U73 NA NA NA 2010 0 10 X
Result below natural background for dioxin
PriestPoint U73 NA NA NA 2010 0 10 X
Result below natural background for dioxin
PriestPoint UUU169 NA NA NA 2010 0 10 X
Result below natural background for dioxin
PriestPoint V91 NA NA NA 2010 0 10 X
Result below natural background for dioxin
PriestPoint VVVV200 NA NA NA 2010 0 10 X
Result below natural background for dioxin
PriestPoint W38 NA NA NA 2010 0 10 X
Result below natural background for dioxin
PriestPoint X55 NA NA NA 2010 0 10 X
Result below natural background for dioxin
PriestPoint XX127 NA NA NA 2010 0 10 X
Result below natural background for dioxin
PriestPoint XXXX198 NA NA NA 2010 0 10 X
Result below natural background for dioxin
PriestPoint YYY190 NA NA NA 2010 0 10 X
Result below natural background for dioxin
PriestPoint ZZZ157 NA NA NA 2010 0 10 X
Result below natural background for dioxin
PriestPoint ZZZZ144 NA NA NA 2010 0 10 X
Result below natural background for dioxin
WB1577RIFS WB1577SD08 SD08 SD08 WB-S0-SD-08-
0000
2008 0 0
X Impacted by sites and sources in Budd Inlet
WB1577RIFS WB1577SD09 SD09 SD09 WB-S0-SD-09-
0000
2008 0 0
X Impacted by sites and sources in Budd Inlet
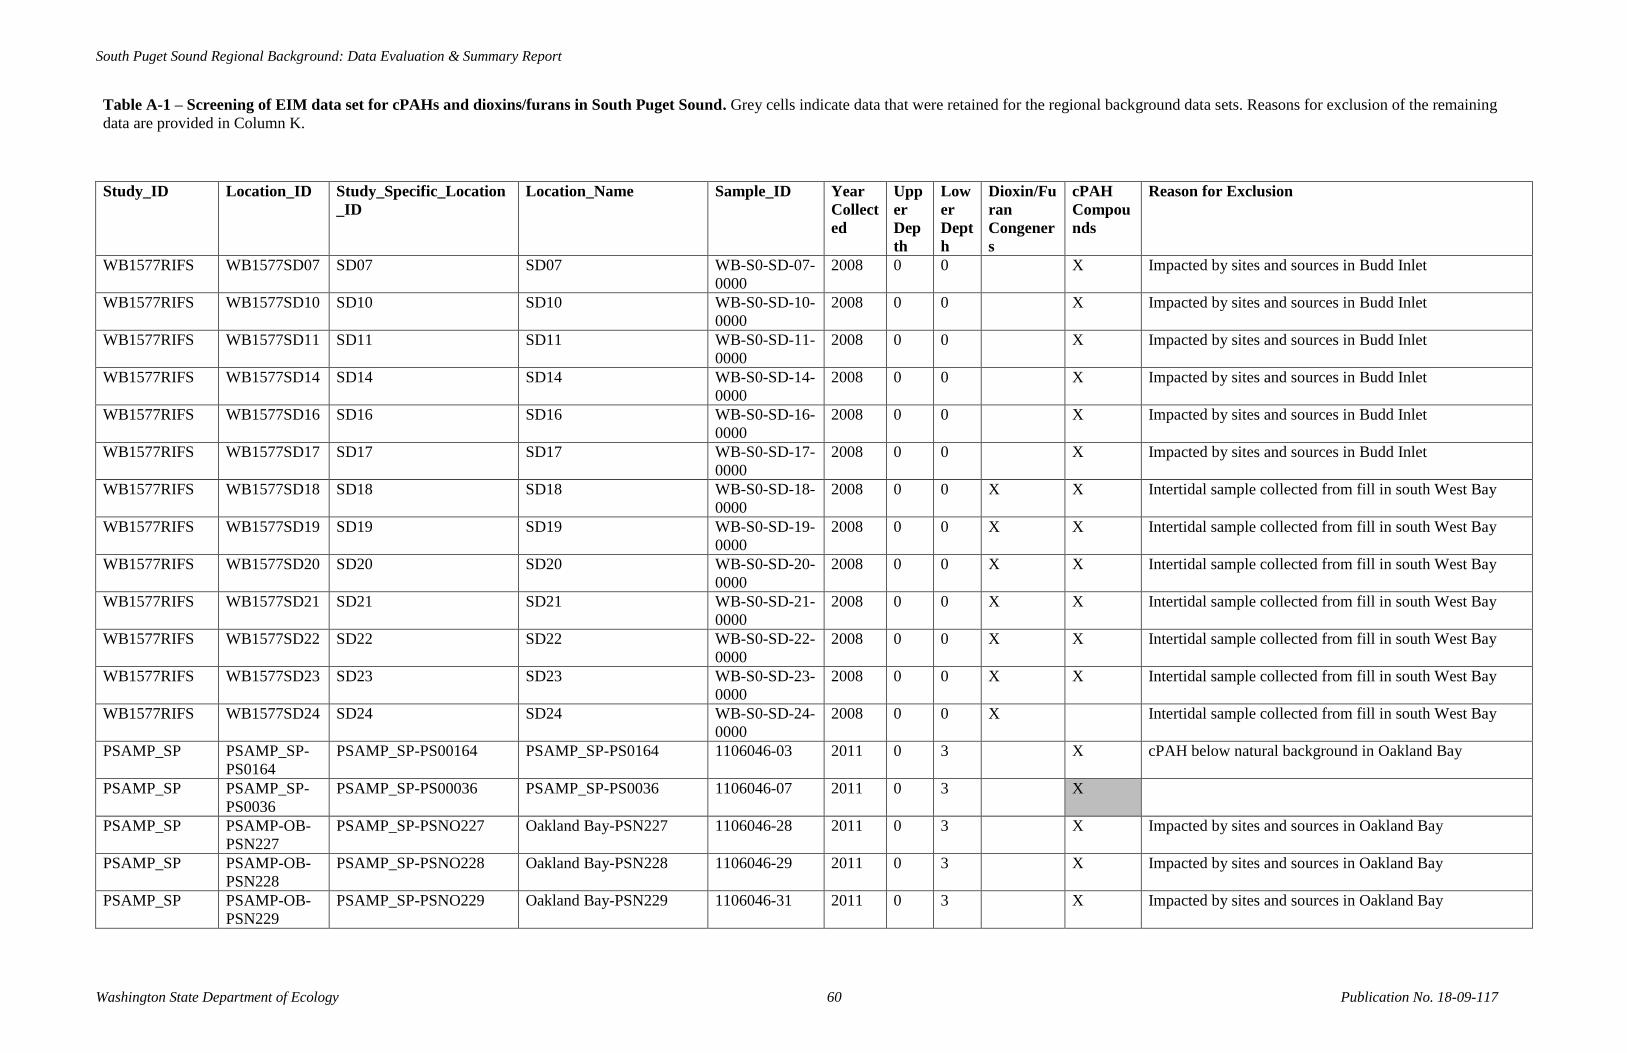
South Puget Sound Regional Background: Data Evaluation & Summary Report
Washington State Department of Ecology 60 Publication No. 18-09-117
Table A-1 – Screening of EIM data set for cPAHs and dioxins/furans in South Puget Sound. Grey cells indicate data that were retained for the regional background data sets. Reasons for exclusion of the remaining
data are provided in Column K.
Study_ID Location_ID Study_Specific_Location
_ID
Location_Name Sample_ID Year
Collect
ed
Upp
er
Dep
th
Low
er
Dept
h
Dioxin/Fu
ran
Congener
s
cPAH
Compou
nds
Reason for Exclusion
WB1577RIFS WB1577SD07 SD07 SD07 WB-S0-SD-07-
0000
2008 0 0
X Impacted by sites and sources in Budd Inlet
WB1577RIFS WB1577SD10 SD10 SD10 WB-S0-SD-10-
0000
2008 0 0
X Impacted by sites and sources in Budd Inlet
WB1577RIFS WB1577SD11 SD11 SD11 WB-S0-SD-11-
0000
2008 0 0
X Impacted by sites and sources in Budd Inlet
WB1577RIFS WB1577SD14 SD14 SD14 WB-S0-SD-14-
0000
2008 0 0
X Impacted by sites and sources in Budd Inlet
WB1577RIFS WB1577SD16 SD16 SD16 WB-S0-SD-16-
0000
2008 0 0
X Impacted by sites and sources in Budd Inlet
WB1577RIFS WB1577SD17 SD17 SD17 WB-S0-SD-17-
0000
2008 0 0
X Impacted by sites and sources in Budd Inlet
WB1577RIFS WB1577SD18 SD18 SD18 WB-S0-SD-18-
0000
2008 0 0 X X Intertidal sample collected from fill in south West Bay
WB1577RIFS WB1577SD19 SD19 SD19 WB-S0-SD-19-
0000
2008 0 0 X X Intertidal sample collected from fill in south West Bay
WB1577RIFS WB1577SD20 SD20 SD20 WB-S0-SD-20-
0000
2008 0 0 X X Intertidal sample collected from fill in south West Bay
WB1577RIFS WB1577SD21 SD21 SD21 WB-S0-SD-21-
0000
2008 0 0 X X Intertidal sample collected from fill in south West Bay
WB1577RIFS WB1577SD22 SD22 SD22 WB-S0-SD-22-
0000
2008 0 0 X X Intertidal sample collected from fill in south West Bay
WB1577RIFS WB1577SD23 SD23 SD23 WB-S0-SD-23-
0000
2008 0 0 X X Intertidal sample collected from fill in south West Bay
WB1577RIFS WB1577SD24 SD24 SD24 WB-S0-SD-24-
0000
2008 0 0 X
Intertidal sample collected from fill in south West Bay
PSAMP_SP PSAMP_SP-
PS0164
PSAMP_SP-PS00164 PSAMP_SP-PS0164 1106046-03 2011 0 3
X cPAH below natural background in Oakland Bay
PSAMP_SP PSAMP_SP-
PS0036
PSAMP_SP-PS00036 PSAMP_SP-PS0036 1106046-07 2011 0 3
X
PSAMP_SP PSAMP-OB-
PSN227
PSAMP_SP-PSNO227 Oakland Bay-PSN227 1106046-28 2011 0 3
X Impacted by sites and sources in Oakland Bay
PSAMP_SP PSAMP-OB-
PSN228
PSAMP_SP-PSNO228 Oakland Bay-PSN228 1106046-29 2011 0 3
X Impacted by sites and sources in Oakland Bay
PSAMP_SP PSAMP-OB-
PSN229
PSAMP_SP-PSNO229 Oakland Bay-PSN229 1106046-31 2011 0 3
X Impacted by sites and sources in Oakland Bay

South Puget Sound Regional Background: Data Evaluation & Summary Report
Washington State Department of Ecology 61 Publication No. 18-09-117
Table A-1 – Screening of EIM data set for cPAHs and dioxins/furans in South Puget Sound. Grey cells indicate data that were retained for the regional background data sets. Reasons for exclusion of the remaining
data are provided in Column K.
Study_ID Location_ID Study_Specific_Location
_ID
Location_Name Sample_ID Year
Collect
ed
Upp
er
Dep
th
Low
er
Dept
h
Dioxin/Fu
ran
Congener
s
cPAH
Compou
nds
Reason for Exclusion
PSAMP_SP PSAMP-OB-
PSN230
PSAMP_SP-PSNO230 Oakland Bay-PSN230 1106046-32 2011 0 3
X Impacted by sites and sources in Oakland Bay
PSAMP_SP PSAMP-OB-
PSN231
PSAMP_SP-PSNO231 Oakland Bay-PSN231 1106046-33 2011 0 3
X cPAH below natural background in Oakland Bay
PSAMP_SP PSAMP-OB-
PSN232
PSAMP_SP-PSNO232 Oakland Bay-PSN232 1106046-34 2011 0 3
X cPAH below natural background in Oakland Bay
PSAMP_SP PSAMP-TI-
PSN233
PSAMP_SP-PSNO233 Totten Inlet-PSN233 1106046-35 2011 0 3
X
PSAMP_SP PSAMP-TI-
PSN234
PSAMP_SP-PSNO234 Totten Inlet-PSN234 1106046-36 2011 0 3
X
PSAMP_SP PSAMP-TI-
PSN235
PSAMP_SP-PSNO235 Totten Inlet-PSN235 1106046-37 2011 0 3
X
PSAMP_SP PSAMP-EI-
PSN238
PSAMP_SP-PSNO238 Eld Inlet-PSN238 1106046-40 2011 0 3
X
PSAMP_SP PSAMP-EI-
PSN239
PSAMP_SP-PSNO239 Eld Inlet-PSN239 1106046-42 2011 0 3
X
PSAMP_SP PSAMP-EI-
PSN240
PSAMP_SP-PSNO240 Eld Inlet-PSN240 1106046-43 2011 0 3
X
PSAMP_SP PSAMP_SP-
PS0508
PSAMP_SP-PS00508 PSAMP_SP-PS0508 1106046-59 2011 0 3
X cPAH below natural background in Oakland Bay
PSAMP_SP PSAMP_SP-
PS0636
PSAMP_SP-PS00636 PSAMP_SP-PS0636 1106046-61 2011 0 3
X Impacted by sites and sources in Oakland Bay
UWI2011 UWI2011-
UW40272
UWI2011-UW40272 UWI2011-UW40272 1106046-64 2011 0 3
X
UWI2011 UWI2011-
PSUW012
UWI2011-PSUW012 UWI2011-PSUW012 1106046-02 2011 0 3
X cPAH TEQ identified as an outlier
UWI2011 UWI2011-
PSUW116
UWI2011-PSUW116 UWI2011-PSUW116 1106046-48 2011 0 3
X
UWI2011 UWI2011-
UW40528
UWI2011-UW40528 UWI2011-UW40528 1106046-65 2011 0 3
X
UWI2011 UWI2011-
UW41552
UWI2011-UW41552 UWI2011-UW41552 1106046-71 2011 0 3
X
UWI2011 UWI2011-
UW41680
UWI2011-UW41680 UWI2011-UW41680 1106046-72 2011 0 3
X
UWI2011 UWI2011-
UW41752
UWI2011-UW41752 UWI2011-UW41752 1106046-73 2011 0 3
X

South Puget Sound Regional Background: Data Evaluation & Summary Report
Washington State Department of Ecology 62 Publication No. 18-09-117
Table A-1 – Screening of EIM data set for cPAHs and dioxins/furans in South Puget Sound. Grey cells indicate data that were retained for the regional background data sets. Reasons for exclusion of the remaining
data are provided in Column K.
Study_ID Location_ID Study_Specific_Location
_ID
Location_Name Sample_ID Year
Collect
ed
Upp
er
Dep
th
Low
er
Dept
h
Dioxin/Fu
ran
Congener
s
cPAH
Compou
nds
Reason for Exclusion
UWI2011 UWI-BI-
UWNO236
UWI2011-UWNO236 Budd Inlet-UWNO236 1106046-38 2011 0 3
X
UWI2011 UWI-BI-
UWNO241
UWI2011-UWNO241 Budd Inlet-UWNO241 1106046-44 2011 0 3
X
UWI2011 UWI-BI-
UWNO237
UWI2011-UWNO237 Budd Inlet-UWNO237 1106046-39 2011 0 3
X
UWI2011 UWI2011-
UW40728
UWI2011-UW40728 UWI2011-UW40728 1106046-66 2011 0 3
X Impacted by sites and sources in Budd Inlet
UWI2011 UWI2011-
PSUW100
UWI2011-PSUW100 UWI2011-PSUW100 1106046-16 2011 0 3
X Impacted by sites and sources in Budd Inlet
UWI2011 UWI-WB-
UWNO244
UWI2011-UWNO244 Olympia West Bay-
UWNO244
1106046-47 2011 0 3
X Impacted by sites and sources in Budd Inlet
UWI2011 UWI-EB-
UWNO243
UWI2011-UWNO243 Olympia East Bay-
UWNO243
1106046-46 2011 0 3
X Impacted by sites and sources in Budd Inlet
WOODARD WB-03 WB-03 WB-03 WB-03-S 2008 0 10
X Possible direct influence from creosote pilings
WOODARD WB-06 WB-06 WB-06 WB-06-S 2008 0 10
X Possible direct influence from creosote pilings
WOODARD WB-09 WB-09 WB-09 WB-09-S 2008 0 10
X Possible direct influence from creosote pilings
WOODARD WB-12 WB-12 WB-12 WB-12-S 2008 0 10
X Possible direct influence from creosote pilings
WOODARD WB-16 WB-16 WB-16 WB-16-S 2008 0 10
X Possible direct influence from creosote pilings
WOODARD WB-17 WB-17 WB-17 WB-17-S 2008 0 10
X Possible direct influence from creosote pilings
WOODARD WB-21 WB-21 WB-21 WB-21-S 2008 0 10
X Possible direct influence from creosote pilings
WOODARD WB-22 WB-22 WB-22 WB-22-S 2008 0 10
X Possible direct influence from creosote pilings
WOODARD WB-26 WB-26 WB-26 WB-26-S 2008 0 10
X Possible direct influence from creosote pilings
WOODARD WB-30 WB-30 WB-30 WB-30-S 2008 0 10
X Possible direct influence from creosote pilings
WOODARD WB-35 WB-35 WB-35 WB-35-S 2008 0 10
X Possible direct influence from creosote pilings
WOODARD WB-36 WB-36 WB-36 WB-36-S 2008 0 10
X Possible direct influence from creosote pilings
WOODARD WB-37 WB-37 WB-37 WB-37-S 2008 0 10
X Possible direct influence from creosote pilings
WOODARD WB-42 WB-42 WB-42 WB-42-S 2008 0 10
X Possible direct influence from creosote pilings

South Puget Sound Regional Background: Data Evaluation & Summary Report
Washington State Department of Ecology 63 Publication No. 18-09-117
Table A-2: Summary of dioxin/furan congener and cPAH data used to calculate South Puget Sound Regional Background.
Location ID BI-C1-0-10cm BI-S1-0-10cm BI-S2-0-10cm BI-S28-0-10cm BI-S29-0-10cm BI-S3-0-10cm BI-42704 BI-43088
EIM Study ID BUDD07 BUDD07 BUDD07 BUDD07 BUDD07 BUDD07 BuddOakDioxins BuddOakDioxins
Collection Date 4/12/2007 4/11/2007 4/12/2007 4/12/2007 4/12/2007 4/12/2007 6/6/2011 6/3/2011
Depth 0 to 10 cm 0 to 10 cm 0 to 10 cm 0 to 10 cm 0 to 10 cm 0 to 10 cm 0 to 10 cm 0 to 10 cm
Percent Fines 79.1 81.7 66.8 63.9 43.8 53.9 79.2 89.1
Total Organic Carbon 3.52 4.06 3.31 2.51 2.17 2.87 2.24 2.83
cPAH TEQ (µg/kg)
Benzo(a)pyrene -- 51 -- -- -- -- -- --
Benz[a]anthracene -- 57 -- -- -- -- -- --
Total Benzofluoranthenes -- 149 -- -- -- -- -- --
Chrysene -- 100 -- -- -- -- -- --
Dibenzo(a,h)anthracene -- 7.6 T -- -- -- -- -- --
Indeno(1,2,3-cd)pyrene -- 41 -- -- -- -- -- --
cPAH TEQ (1/2 DL) -- 77 -- -- -- -- -- --
cPAH TEQ (KM) -- 77 -- -- -- -- -- --
Dioxin/Furan Congeners (ng/kg)
2,3,7,8-TCDD 0.283 T 0.456 T 0.317 T 0.464 U 0.358 T 0.326 T 0.477 J 0.224 UJ
1,2,3,7,8-PeCDD 1.44 T 2.5 T 1.48 T 2.43 T 2.03 T 1.22 T 1.9 J 0.262 UJ
1,2,3,4,7,8-HxCDD 2.44 T 4.61 T 2.64 T 3.87 T 2.85 T 2.07 T 2.85 J 0.374 UJ
1,2,3,6,7,8-HxCDD 14 26.7 14.2 17.2 T 13.6 T 9.9 12.4 J 0.941 J
1,2,3,7,8,9-HxCDD 7.27 13.7 7.42 11.1 T 8.99 T 5.24 7.71 J 0.575 J
1,2,3,4,6,7,8-HpCDD 265 619 309 287 T 222 T 179 235 J 18.1 J
OCDD 1890 5410 2420 2210 T 1690 T 1210 1820 J 140 J
2,3,7,8-TCDF 0.631 T 1.49 U 0.897 T 2.42 2.02 0.828 U 2.83 J 0.609 UJ
1,2,3,7,8-PeCDF 1.02 T 1.83 T 1.12 T 1.95 T 1.36 T 0.782 T 1.38 J 0.27 UJ
2,3,4,7,8-PeCDF 1.28 T 2.17 T 1.34 T 2.53 T 2 T 1.02 T 2.76 J 0.272 UJ
1,2,3,4,7,8-HxCDF 4.79 T 8.38 T 4.94 T 10.1 7.46 3.03 T 7.68 J 0.649 J
1,2,3,6,7,8-HxCDF 2.42 T 4.04 T 2.38 T 3.45 T 2.65 T 1.74 T 2.93 J 0.358 UJ
1,2,3,7,8,9-HxCDF 0.253 U 0.38 T 0.23 T 0.285 T 0.24 T 0.171 T 1.36 J 0.374 UJ
2,3,4,6,7,8-HxCDF 2.23 T 3.88 T 2.09 T 3.22 T 2.59 T 1.8 T 4.52 J 0.465 J
1,2,3,4,6,7,8-HpCDF 75.5 133 73.5 97.7 78.5 52.3 77 J 6.59 J
1,2,3,4,7,8,9-HpCDF 3.16 T 6.02 3.49 T 4.86 T 3.67 T 2.04 T 4.19 J 0.547 UJ
OCDF 131 258 142 242 T 198 T 80.7 163 J 13.6 J
Dioxin/Furan TEQ (1/2 DL) 9.6 19 10 13 11 7 11 0.93
Dioxin/Furan TEQ (KM) 9.6 19 10 13 11 7 11 0.93 L9

South Puget Sound Regional Background: Data Evaluation & Summary Report
Washington State Department of Ecology 64 Publication No. 18-09-117
Table A-2: Summary of dioxin/furan congener and cPAH data used to calculate South Puget Sound Regional Background (cont.).
Location ID BI-43216 UWI2011-PSUW012 UWI2011-PSUW116 UWI2011-PSUW140 UWI2011-PSUW244 UWI2011-PSUW268
EIM Study ID BuddOakDioxins BuddOakDioxinsa BuddOakDioxinsa BuddOakDioxins BuddOakDioxins BuddOakDioxins
Collection Date 6/6/2011 6/3/2011 6/21/2011 6/3/2011 6/21/2011 6/3/2011
Depth 0 to 10 cm 0 to 10 cma 0 to 10 cma 0 to 10 cm 0 to 10 cm 0 to 10 cm
Percent Fines 69.2 87.1 83.1 87 45.5 91
Total Organic Carbon 2.3 2.49 2.12 2.52 2.78 2.93
cPAH TEQ (µg/kg)
Benzo(a)pyrene -- -- 20.7 -- -- --
Benz[a]anthracene -- -- 16.9 -- -- --
Total Benzofluoranthenes -- -- 52.7 -- -- --
Chrysene -- -- 27.9 -- -- --
Dibenzo(a,h)anthracene -- -- 4.1 -- -- --
Indeno(1,2,3-cd)pyrene -- -- 28.3 -- -- --
cPAH TEQ (1/2 DL) -- -- 31 -- -- --
cPAH TEQ (KM) -- -- 31 -- -- --
Dioxin/Furan Congeners (ng/kg)
2,3,7,8-TCDD 0.0791 UJ 0.533 J 0.485 J 0.349 J 0.321 J 0.391 UJ
1,2,3,7,8-PeCDD 0.18 J 2.59 J 2.4 J 0.981 UJ 1.48 UJ 1 UJ
1,2,3,4,7,8-HxCDD 0.17 J 3.68 J 3.41 J 0.942 J 1.97 J 1.2 J
1,2,3,6,7,8-HxCDD 0.643 J 18.3 J 15.4 J 3.65 J 9.26 J 5.12 J
1,2,3,7,8,9-HxCDD 0.366 J 9.9 J 8 J 2.48 J 5.53 J 2.76 J
1,2,3,4,6,7,8-HpCDD 10 J 317 J 263 J 75.1 J 174 J 96.3 J
OCDD 78.8 J 2350 J 1940 J 559 J 1310 J 724 J
2,3,7,8-TCDF 0.441 J 3.43 J 3.12 J 1.61 J 2.07 J 1.67 J
1,2,3,7,8-PeCDF 2.47 UJ 2.22 J 2 J 2.45 UJ 2.49 UJ 0.934 UJ
2,3,4,7,8-PeCDF 0.182 UJ 4.02 J 3.25 J 1.41 J 2.27 J 1.16 UJ
1,2,3,4,7,8-HxCDF 0.406 J 10 J 7.84 J 2.71 J 5.51 J 3.25 J
1,2,3,6,7,8-HxCDF 0.164 UJ 3.75 J 2.94 J 2.45 UJ 1.92 J 2.5 UJ
1,2,3,7,8,9-HxCDF 0.224 UJ 2.17 J 1.68 J 0.636 UJ 1.25 J 0.523 UJ
2,3,4,6,7,8-HxCDF 0.239 J 6.12 J 4.8 J 1.55 UJ 3.25 J 1.85 J
1,2,3,4,6,7,8-HpCDF 3.44 J 105 J 83.9 J 23.9 J 57.2 J 30.6 J
1,2,3,4,7,8,9-HpCDF 0.241 J 5.51 J 4.59 J 2.45 UJ 3.23 J 1.58 J
OCDF 7.76 J 228 J 217 J 52.5 J 135 J 58.2 J
Dioxin/Furan TEQ (1/2 DL) 0.69 15 13 3.9 7.6 4.1
Dioxin/Furan TEQ (KM) 0.65 15 13 4.2 L 7.2 4.5 L

South Puget Sound Regional Background: Data Evaluation & Summary Report
Washington State Department of Ecology 65 Publication No. 18-09-117
Table A-2: Summary of dioxin/furan congener and cPAH data used to calculate South Puget Sound Regional Background (cont.).
Location ID UWI2011-UW40272 UWI2011-UW40528 UWI2011-UW41552 UWI2011-UW41680 UWI2011-UW41752 UWI2011-UWNO236
EIM Study ID BuddOakDioxinsa BuddOakDioxinsa BuddOakDioxinsa BuddOakDioxinsa BuddOakDioxinsa BuddOakDioxinsa
Collection Date 6/6/2011 6/1/2011 6/1/2011 6/6/2011 6/6/2011 6/1/2011
Depth 0 to 10 cma 0 to 10 cma 0 to 10 cma 0 to 10 cma 0 to 10 cma 0 to 10 cma
Percent Fines 75.6 86.5 76 14.7 49.7 81.4
Total Organic Carbon 2.05 2.34 2.69 1.12 1.62 2.95
cPAH TEQ (ug/kg)
Benzo(a)pyrene 24.3 24.6 32.6 7.03 17.5 34.3
Benz[a]anthracene 19.6 20.4 24.4 5.27 13.2 25.7
Total Benzofluoranthenes 59.8 63.4 83.4 16.3 44.9 86.7
Chrysene 32.8 32.7 39.7 8.22 22.3 40.6
Dibenzo(a,h)anthracene 4.41 4.89 6.17 1.44 3.22 6.15
Indeno(1,2,3-cd)pyrene 31 35.4 42.9 9.27 25.5 45.6
cPAH TEQ (1/2 DL) 36 37 49 10 26 51
cPAH TEQ (KM) 36 37 49 10 26 51
Dioxin/Furan Congeners (ng/kg)
2,3,7,8-TCDD 0.307 J 0.438 J 0.766 J 0.0767 UJ 0.312 J 0.661 UJ
1,2,3,7,8-PeCDD 1.45 J 1.81 J 3.89 J 0.663 J 1.34 J 1.44 UJ
1,2,3,4,7,8-HxCDD 2.09 J 3.18 J 6.7 J 0.919 J 2.18 J 2.79 J
1,2,3,6,7,8-HxCDD 9.11 J 12.6 J 29.2 J 4.42 J 10.4 J 11.3 J
1,2,3,7,8,9-HxCDD 5.88 J 7.41 J 17 J 2.77 J 5.92 J 6.08 J
1,2,3,4,6,7,8-HpCDD 194 J 246 J 562 J 84.6 J 200 J 221 J
OCDD 1410 J 1920 J 4230 J 647 J 1550 J 1710 J
2,3,7,8-TCDF 1.93 J 2.54 J 4.93 J 0.798 J 1.56 J 2.87 J
1,2,3,7,8-PeCDF 1.07 J 1.54 J 3.11 J 0.482 J 1.06 J 1.84 J
2,3,4,7,8-PeCDF 2.02 J 2.74 J 5.85 J 0.961 J 2.04 J 2.71 J
1,2,3,4,7,8-HxCDF 5.68 J 7.02 J 16 J 2.4 J 5.82 J 6.17 J
1,2,3,6,7,8-HxCDF 2.13 J 2.79 J 5.92 J 0.999 J 2.15 UJ 2.53 J
1,2,3,7,8,9-HxCDF 1.11 J 1.4 J 3.46 J 0.501 J 1.04 J 1.5 J
2,3,4,6,7,8-HxCDF 3.34 J 4.36 J 9.47 J 1.52 J 3.51 J 3.71 J
1,2,3,4,6,7,8-HpCDF 63.6 J 81.1 J 168 J 28.5 J 64.6 J 69.5 J
1,2,3,4,7,8,9-HpCDF 3.39 J 4.38 J 8.44 J 1.65 J 3.52 J 3.22 J
OCDF 120 J 175 J 320 J 68.1 J 136 J 128 J
Dioxin/Furan TEQ (1/2 DL) 8.6 11 25 3.8 8.6 9.1
Dioxin/Furan TEQ (KM) 8.6 11 25 3.8 8.6 8.8

South Puget Sound Regional Background: Data Evaluation & Summary Report
Washington State Department of Ecology 66 Publication No. 18-09-117
Table A-2: Summary of dioxin/furan congener and cPAH data used to calculate South Puget Sound Regional Background (cont.).
Location ID UWI-BI-UWNO237 UWI2011-UWNO241 G1300053-SS-01 G1300053-SS-05 G1300053-SS-07 G1300053-SS-08
EIM Study ID BuddOakDioxinsa G1300053 G1300053 G1300053 G1300053
Collection Date 6/7/2011 6/7/2011 3/12/2013 3/12/2013 3/12/2013 3/13/2013
Depth 0 to 3 cm 0 to 10 cma 0 to 10 cm 0 to 10 cm 0 to 10 cm 0 to 10 cm
Percent Fines 77.7 75.8 70.3 41.5 45.5 70.9
Total Organic Carbon 2.31 2.31 3.69 2.32 2.57 2.71
cPAH TEQ (ug/kg)
Benzo(a)pyrene 19.1 20.8 45 55 44 38
Benz[a]anthracene 16.9 17.7 39 72 35 26
Total Benzofluoranthenes 48.4 52.3 110b 120b 100b 77b
Chrysene 27 31.1 60 160 61 43
Dibenzo(a,h)anthracene 3.7 4.14 4.1 U 4.1 U 4.2 U 4.1 U
Indeno(1,2,3-cd)pyrene 25.9 28.5 30 32 29 24
cPAH TEQ (1/2 DL) 29 31 64 79 61 51
cPAH TEQ (KM) 29 31 64 79 61 52
Dioxin/Furan Congeners (ng/kg)
2,3,7,8-TCDD -- 0.547 J 0.457 U 0.335 U 0.404 U 0.547 U
1,2,3,7,8-PeCDD -- 2.46 J 2.36 J 1.69 1.8 3.93
1,2,3,4,7,8-HxCDD -- 3.91 J 3.03 1.87 2.37 3.36
1,2,3,6,7,8-HxCDD -- 14.6 J 15.5 9.35 12.6 21.9
1,2,3,7,8,9-HxCDD -- 9.94 J 7.09 4.26 5.76 10.1
1,2,3,4,6,7,8-HpCDD -- 291 J 315 188 246 305
OCDD -- 2180 J 2430 1360 1770 2160
2,3,7,8-TCDF -- 3.92 J 1.48 1.17 J 1.23 1.51
1,2,3,7,8-PeCDF -- 2.19 J 1.31 J 0.96 J 1.13 1.42
2,3,4,7,8-PeCDF -- 3.88 J 1.4 1.05 1.27 1.5
1,2,3,4,7,8-HxCDF -- 9.24 J 5.52 3.42 4.74 5.45
1,2,3,6,7,8-HxCDF -- 3.44 J 2.92 1.87 2.34 3.01
1,2,3,7,8,9-HxCDF -- 1.85 J 1.32 0.932 J 1.2 1.4 J
2,3,4,6,7,8-HxCDF -- 5.19 J 4.4 2.98 3.64 4.47
1,2,3,4,6,7,8-HpCDF -- 90.8 J 86.6 54.3 76.1 94.5
1,2,3,4,7,8,9-HpCDF -- 4.63 J 3.48 2.21 3.12 J 3.62
OCDF -- 224 J 155 87.6 129 149
Dioxin/Furan TEQ (1/2 DL) -- 14 12 7.7 9.6 15
Dioxin/Furan TEQ (KM) -- 14 12 7.6 9.6 15

South Puget Sound Regional Background: Data Evaluation & Summary Report
Washington State Department of Ecology 67 Publication No. 18-09-117
Table A-2: Summary of dioxin/furan congener and cPAH data used to calculate South Puget Sound Regional Background (cont.).
Location ID G1300053-SS-09 PSAMP_SP-PS0036 PSAMP_SP-PSN233 PSAMP_SP-PSN234 PSAMP_SP-PSN235 PSAMP_SP-PSN238
EIM Study ID G1300053 PSAMP_SP PSAMP_SP PSAMP_SP PSAMP_SP PSAMP_SP
Collection Date 3/12/2013 6/20/2011 6/20/2011 6/20/2011 6/20/2011 6/21/2011
Depth 0 to 10 cm 0 to 3 cm 0 to 3 cm 0 to 3 cm 0 to 3 cm 0 to 3 cm
Percent Fines 13.6 55.4 56 68.9 73.2 87.8
Total Organic Carbon 2.61 2.46 2.67 2.46 2.48 2.78
cPAH TEQ (ug/kg)
Benzo(a)pyrene 34 13.6 20.7 21.3 20.9 25.1
Benz[a]anthracene 24 10.4 16.9 15.8 15.5 18.1
Total Benzofluoranthenes 94b 35.4 45.5 55.6 51.3 62.2
Chrysene 52 19 26.4 25.5 29.6 29.4
Dibenzo(a,h)anthracene 13 2.47 3.87 4.28 3.97 4.78
Indeno(1,2,3-cd)pyrene 34 18.6 24.5 28.3 26.6 36.2
cPAH TEQ (1/2 DL) 51 20 30 32 31 38
cPAH TEQ (KM) 51 20 30 32 31 38
Dioxin/Furan Congeners (ng/kg)
2,3,7,8-TCDD 0.312 U -- -- -- -- --
1,2,3,7,8-PeCDD 1.41 -- -- -- -- --
1,2,3,4,7,8-HxCDD 1.53 -- -- -- -- --
1,2,3,6,7,8-HxCDD 5.41 -- -- -- -- --
1,2,3,7,8,9-HxCDD 3.12 -- -- -- -- --
1,2,3,4,6,7,8-HpCDD 94.9 -- -- -- -- --
OCDD 596 -- -- -- -- --
2,3,7,8-TCDF 0.813 J -- -- -- -- --
1,2,3,7,8-PeCDF 0.493 J -- -- -- -- --
2,3,4,7,8-PeCDF 0.567 J -- -- -- -- --
1,2,3,4,7,8-HxCDF 1.31 J -- -- -- -- --
1,2,3,6,7,8-HxCDF 0.826 J -- -- -- -- --
1,2,3,7,8,9-HxCDF 0.412 J -- -- -- -- --
2,3,4,6,7,8-HxCDF 1.22 -- -- -- -- --
1,2,3,4,6,7,8-HpCDF 20.7 -- -- -- -- --
1,2,3,4,7,8,9-HpCDF 0.776 J -- -- -- -- --
OCDF 32.5 -- -- -- -- --
Dioxin/Furan TEQ (1/2 DL) 4.6 -- -- -- -- --
Dioxin/Furan TEQ (KM) 4.5 -- -- -- -- --

South Puget Sound Regional Background: Data Evaluation & Summary Report
Washington State Department of Ecology 68 Publication No. 18-09-117
Table A-2: Summary of dioxin/furan congener and cPAH data used to calculate South Puget Sound Regional Background (cont.).
Location ID PSAMP_SP-PSN239 PSAMP_SP-PSN240
EIM Study ID PSAMP_SP PSAMP_SP
Collection Date 6/21/2011 6/21/2011
Depth 0 to 3 cm 0 to 3 cm
Percent Fines 88.1 86
Total Organic Carbon 2.56 2.97
cPAH TEQ (ug/kg)
Benzo(a)pyrene 20 18.2
Benz[a]anthracene 15.6 13
Total Benzofluoranthenes 52.8 47.5
Chrysene 29 21.3
Dibenzo(a,h)anthracene 4.54 3.92
Indeno(1,2,3-cd)pyrene 29.2 28.4
cPAH TEQ (1/2 DL) 31 28
cPAH TEQ (KM) 31 28
Dioxin/Furan Congeners (ng/kg)
2,3,7,8-TCDD -- --
1,2,3,7,8-PeCDD -- --
1,2,3,4,7,8-HxCDD -- --
1,2,3,6,7,8-HxCDD -- --
1,2,3,7,8,9-HxCDD -- --
1,2,3,4,6,7,8-HpCDD -- --
OCDD -- --
2,3,7,8-TCDF -- --
1,2,3,7,8-PeCDF -- --
2,3,4,7,8-PeCDF -- --
1,2,3,4,7,8-HxCDF -- --
1,2,3,6,7,8-HxCDF -- --
1,2,3,7,8,9-HxCDF -- --
2,3,4,6,7,8-HxCDF -- --
1,2,3,4,6,7,8-HpCDF -- --
1,2,3,4,7,8,9-HpCDF -- --
OCDF -- --
Dioxin/Furan TEQ (1/2 DL) -- --
Dioxin/Furan TEQ (KM) -- --

South Puget Sound Regional Background: Data Evaluation & Summary Report
Washington State Department of Ecology 69 Publication No. 18-09-117
Notes:
a Dioxin data were reported in EIM StudyID BuddOakDioxins with a reported depth of 0 to 10 cm, while cPAH data were reported in StudyID UWI2011 with a reported depth of 0 to 3 cm.
b Results were reported as total benzofluoranthenes (b,j,k).
-- Not analyzed.
U = Below detection limit.
L = Less than the reported value (estimated TEQ is biased high).
J/T = Depending upon the study and laboratory, a J or T qualifier represents an estimated result present above the detection limit but below the reporting limit.
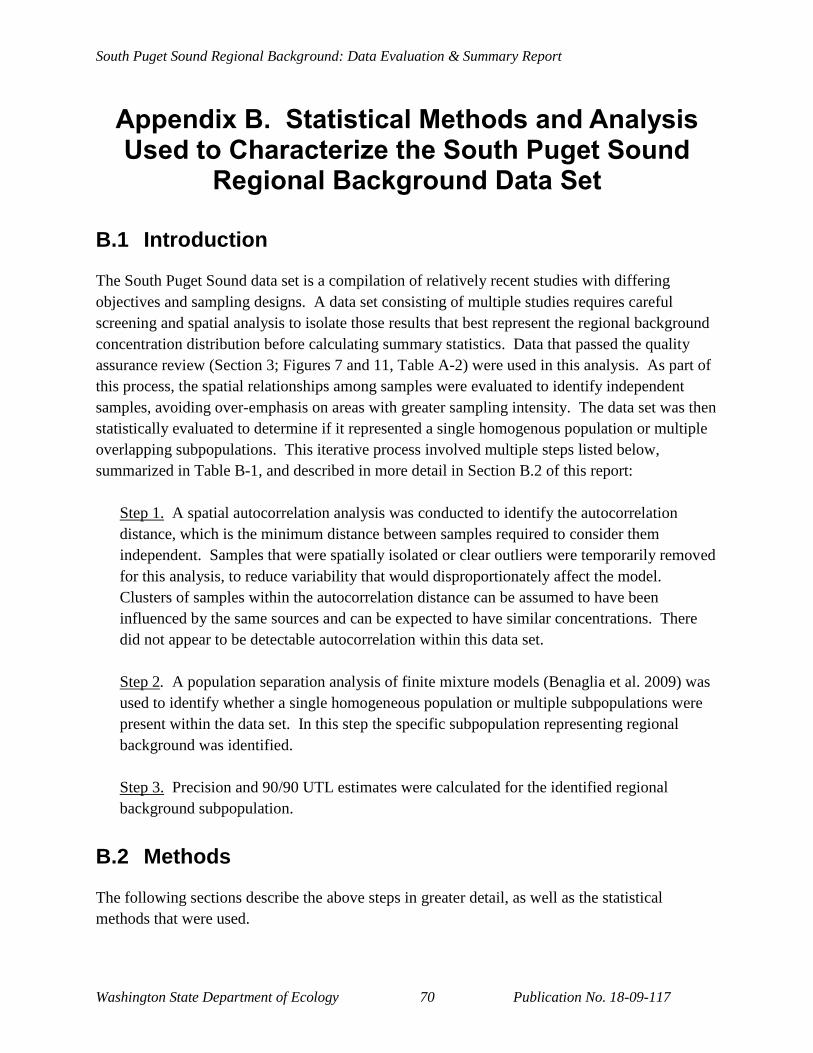
South Puget Sound Regional Background: Data Evaluation & Summary Report
Washington State Department of Ecology 70 Publication No. 18-09-117
Appendix B. Statistical Methods and Analysis Used to Characterize the South Puget Sound
Regional Background Data Set
B.1 Introduction
The South Puget Sound data set is a compilation of relatively recent studies with differing
objectives and sampling designs. A data set consisting of multiple studies requires careful
screening and spatial analysis to isolate those results that best represent the regional background
concentration distribution before calculating summary statistics. Data that passed the quality
assurance review (Section 3; Figures 7 and 11, Table A-2) were used in this analysis. As part of
this process, the spatial relationships among samples were evaluated to identify independent
samples, avoiding over-emphasis on areas with greater sampling intensity. The data set was then
statistically evaluated to determine if it represented a single homogenous population or multiple
overlapping subpopulations. This iterative process involved multiple steps listed below,
summarized in Table B-1, and described in more detail in Section B.2 of this report:
Step 1. A spatial autocorrelation analysis was conducted to identify the autocorrelation
distance, which is the minimum distance between samples required to consider them
independent. Samples that were spatially isolated or clear outliers were temporarily removed
for this analysis, to reduce variability that would disproportionately affect the model.
Clusters of samples within the autocorrelation distance can be assumed to have been
influenced by the same sources and can be expected to have similar concentrations. There
did not appear to be detectable autocorrelation within this data set.
Step 2. A population separation analysis of finite mixture models (Benaglia et al. 2009) was
used to identify whether a single homogeneous population or multiple subpopulations were
present within the data set. In this step the specific subpopulation representing regional
background was identified.
Step 3. Precision and 90/90 UTL estimates were calculated for the identified regional
background subpopulation.
B.2 Methods
The following sections describe the above steps in greater detail, as well as the statistical
methods that were used.
South Puget Sound Regional Background: Data Evaluation & Summary Report
Washington State Department of Ecology 71 Publication No. 18-09-117
B.2.1 Outlier Analysis
Prior to trend analysis and estimating the autocorrelation distance, certain samples were excluded
from the data set for each analyte. These samples were either spatially isolated and/or
chemically distinct (i.e., samples with unusual concentrations that were dissimilar to neighboring
samples). Such samples unduly influence the trend model and disrupt the pattern of the residuals
in the area.
Identification of potential concentration outliers was conducted using boxplots and/or Quantile-
Quantile (QQ) plots. These diagnostic tools generally assume independent and identically
distributed (i.i.d.) data, an assumption that was not confirmed for this data set. However, the
intent was to identify elevated values that might be indicative of an unsuspected source and
exclude data points that could bias the autocorrelation analysis due to higher or spatially isolated
values. Outliers were subsequently added back into the data set for the final population analysis,
since they may not be elevated when viewed in the context of a homogenous subpopulation.
B.2.2 Autocorrelation Analysis
The autocorrelation distance is estimated based on data that do not exhibit a trend and have a
zero mean, specifically the residuals from the best-fit model to the concentration surface. A
simplified approach to evaluating trends was used. Multiple surface trend models were used to
evaluate potential trends in concentrations, including least squares polynomial surface models of
orders 0 to 5 (i.e., from no trend up to a 5th order polynomial). The six polynomial regression
models were compared using the Aikake Information Criterion corrected for sample size (AICc,
Burnham and Anderson 2002), and patterns in the residual diagnostic plots. The model with the
lowest AICc and best fitting residuals plots was considered to be the best trend model.
Lacking a regularly spaced grid of samples, the autocorrelation boundary was estimated by
evaluating the correlation among pairs of points within various distances of each other. Pairs of
sample points were grouped into bins of similar distances. For example, using a test distance of
50 m between samples, all pairs of samples within 0 to 50 m, 50 to 100 m, 100 to 150 m, etc.
were grouped. Pearson’s linear correlation coefficient between residuals for all possible station
pairs within each distance bin provided an estimate of autocorrelation.
The distance bins considered were required to have a minimum of six pairs per bin, considered
the smallest number of pairs that can reasonably be used to test for autocorrelation (e.g., Journel
and Huijbregts 1978). When the sample size was small (n < 10), a significance test of the
autocorrelation within each distance bin was applied using α = 0.20 to limit Type II errors (i.e.,
failure to reject the null hypothesis when autocorrelation is present). This binned hypothesis
testing approach was useful given the data limitations (i.e., insufficient pairs of samples at

South Puget Sound Regional Background: Data Evaluation & Summary Report
Washington State Department of Ecology 72 Publication No. 18-09-117
sequentially increasing distances) and the objective of estimating the minimum distance between
independent samples.
B.2.3 Population Separation
A statistical likelihood method was used to select the best description of each data set, choosing
among finite mixture models of one or more normal or gamma distributions.
If the composite data sets used for this analysis included samples within natural background on
the low end and portions of elevated populations on the high end, this process would identify the
breakpoints that segregated the intermediate regional background subpopulation. These
breakpoints between subpopulations were identified using an expectation-maximization (EM)
algorithm implemented in the following functions in the mixtools package in R (Benaglia et al.
2009): normalmixEM for mixtures of k normal distributions and gammamixEM for mixtures of k
gamma distributions (k = 1, 2, or 3). The breakpoints were readily confirmed by natural breaks
or slope changes in the QQ plots. The appropriateness of a single normal or gamma distribution
was also evaluated, using the fitdistr function in the MASS package in R (Venables and Ripley,
2002).
The single and mixture model alternatives were compared using Akaike Information Criterion
with correction for small sample sizes (AICc; Burnham and Anderson 2002). The model with
the smallest AICc was preferred, and any model with an AICc within 2 units of the minimum
AICc was considered a reasonable alternative to the “best” model.
𝐴𝐼𝐶𝑐 = −2𝑙𝑛(�̂�) + 2𝑘 + 2𝑘(𝑘 + 1)/(𝑛 − 𝑘 − 1)
where:
𝑙𝑛(�̂�) = the log-Likelihood for the specified model.
k = number of parameters (2 for each gamma or normal distribution in the mixture, so a
mixture of 2 gamma distributions would have k = 4).
n = number of observations.
When more than one mixture model was considered appropriate, the models were reviewed to
determine which was most suitable to identify regional background. For example, when
comparable models differed only in how they differentiated concentrations at or below natural
background, but the upper breakpoint which differentiated regional background was unchanged,
both would be considered suitable.
Overall, the process was to:

South Puget Sound Regional Background: Data Evaluation & Summary Report
Washington State Department of Ecology 73 Publication No. 18-09-117
Evaluate the QQ plot and remove obvious outliers based on large jumps in the data
distribution. Use the EM algorithm to identify maximum likelihood breakpoints between
multiple normal or gamma subpopulations, and calculate the AICc associated with each
mixture.
The finite mixture with the lowest AICc was deemed the most appropriate description for
the data set and the subpopulations (if any) were interpreted using available information.
B.3 Results
B.3.1 Outlier Identification
Identification of outliers, or highly influential samples, was conducted prior to performing the
autocorrelation analysis. Samples that were spatially isolated or chemically distinct were
removed prior to the autocorrelation step. Only one sample was excluded from the
autocorrelation analysis for cPAHs:
One station on the northeast side of Budd Inlet (Study = UWI2011, Location ID =
PSUW012) had a cPAH TEQ value of 240 µg/kg, over three times the next highest value
in the dataset. This station was surrounded by samples with TEQ values in the range of
29 to 49 µg/kg. This sample is clearly not correlated with its neighbors, and its inclusion
in the trend surface model decreased the goodness of fit. Consequently, it was excluded
from the autocorrelation analysis.
B.3.2 Autocorrelation Distance
In this data set there were relatively few occurrences of spatially clustered samples. These
spatially clustered samples tended to be individual pairs of samples that were in close proximity
in space (though separated by years) instead of large areas that were the subject of more
intensive sampling efforts.
The residuals from the best fit model for each chemical (Table B-2) were grouped based on
distance between sampling locations. For example, if the distance interval under evaluation was
50 m, then all sample pairs within 0 to 50 m, 50 to 100 m, 100 to 150 m, etc. were grouped, and
the Pearson correlation was calculated between the values among all sample pairs within each
distance bin.
For the cPAH TEQ data, there were very few clustered samples; only 8 sample pairs were within
300 m of one another, and 14 sample pairs were within 500 m. The Pearson correlation

South Puget Sound Regional Background: Data Evaluation & Summary Report
Washington State Department of Ecology 74 Publication No. 18-09-117
coefficients within each of these closest distance bins were near zero. With no evidence for
autocorrelation within the cPAH data set, all data were treated as independent.
For the dioxin/furan TEQ data, there were more clustered samples on which to test the
autocorrelation hypothesis (13 sample pairs within 200 m of one another, 26 sample pairs within
300 m, and 38 sample pairs within 500 m). The relationship between concentrations for sample
pairs within these distance bins showed no correlation, with a single data point responsible for
the overall negative Pearson correlation coefficients. Similar to the conclusion for cPAHs, there
was no evidence for autocorrelation within the dioxin/furan data set and all data were treated as
independent.
B.3.3 Population Separation
The following describes the results of the population separation analysis for the dioxin/furan and
cPAH data sets.
B.3.3.1 cPAH TEQs
In the QQ plot for the full data set, one sample with a cPAH TEQ value of 240 µg/kg stood out
as a clear outlier (Figure B-1a). The data (excluding the single elevated value) were then
evaluated as a single population of either normal or a gamma distribution, or a mixture of two or
more normal or gamma distributions using the mixtools package in R.
In a well-mixed environment, the sediment chemistry from the regional background signal may
be expected to follow a normal distribution without excessive skewness. When the sediment
chemistry data has a skewed probability distribution, this may be an indicator of an
environmental setting that has multiple regional sources that are not well-mixed or of
overlapping distributions with the upper concentrations representing very localized contaminant
sources. A skewed distribution that is supported by a smooth QQ plot without large breaks in the
distribution of values may reasonably be modeled as a gamma distribution.
The AICc values for five different mixture models are shown in Table B-3. Among these five
competing mixture models, model selection based on the AICc showed comparable fit for a
mixture of two normal distributions and a single gamma distribution. The mixture of two normal
distributions identified a breakpoint at 65 ppb, placing the highest two values (77 and 79 ppb,
both located in the West Bay) in a different subpopulation. The West Bay stations define the
upper tail of the concentration distribution (Figure B-1b), with six values ranging from 51 to 79
ppb. However, the entire group of West Bay stations does not represent a separate and distinct
subpopulation, and they are similar to values found just north of Gull Harbor. A comparison
between the two models with the lowest AICcs (Figures B-1c and B-1d) indicates a slight
preference for the single gamma distribution based on a slightly higher correlation coefficient for

South Puget Sound Regional Background: Data Evaluation & Summary Report
Washington State Department of Ecology 75 Publication No. 18-09-117
the QQ plot, and less overall deviation from the line. Therefore, all of the data were considered
to be part of a single distribution.
B.3.3.2 Dioxin/Furan TEQs
QQ plots for the full data set for dioxin/furan TEQs are shown in Figures B-2a and b. There do
not appear to be any distinct breaks in the distribution, although there appear to be one or two
possible outliers. These data were evaluated as a single population of either a normal or gamma
distribution, or a mixture of two or more normal or gamma distributions using the mixtools
package in R.
The AICc values for five different mixture models are shown in Table B-3. Among these five
competing mixture models, model selection based on the AICc showed a slight preference for a
single normal distribution over a single gamma distribution (AICc of 165 versus 166). If a
normal distribution is assumed, however, the highest concentration at 25 ng/kg TEQ appears to
be a statistical outlier (Dixon’s Outlier test, p < .05). The normal QQ plot for the data excluding
this potential outlier (Figure B-2c) also appears to be a good fit to the data, with a correlation
coefficient for the QQ plot of 0.99.

South Puget Sound Regional Background: Data Evaluation & Summary Report
Washington State Department of Ecology 76 Publication No. 18-09-117
Table B-1: Stepwise approach to identify the regional background data set from the compiled data set.
Step Data Set Objective
1 All samples, excluding chemical/spatial
outliers. Identify autocorrelation distance.
2 Independent samples plus cluster averages
(if any), including chemical/spatial outliers. Identify regional background subpopulation.
3 Regional background subpopulation. Calculate precision and 90/90 UTL.
Table B-2: Summary of the trend surface analysis for each analyte.
Analyte
Sample
Size
Concentration Range of the Data
Used to Fit the Trend Surface
Polynomial Order of the
Best-Fit Trend Surface
cPAH TEQ 22 10 to 79 µg/kg TEQ No trend
Dioxin/furan
TEQ 26 0.65 to 25 ng/kg TEQ No trend
Table B-3: AICc values and relative likelihoods for competing mixture models1 for dioxin/furan and cPAH TEQ data sets.
Distribution of
Mixtures
AICc for
cPAH data
Difference from
Min(AICc)
AICc for
Dioxin/furan TEQ data
(final)
Difference from
Min(AICc)
1 Normal 193 3 165* 0
2 Normals 190* 0 169 4
3 Normals 194 4 173 8
1 Gamma 190* 0 166 1
2 Gammas 196 6 172 7
1 Evaluated using mixtools package in R (Benaglia et al 2009).
* Mixture model preferred by smallest AICc value.

South Puget Sound Regional Background: Data Evaluation & Summary Report
Washington State Department of Ecology 77 Publication No. 18-09-117
Figure B-1. QQ plots for the cPAH TEQ data (µg/kg, dry weight):
a) Normal QQ plot for all samples with one elevated value (circled in red).
b) Normal QQ plot for all data excluding the elevated value and showing possible breakpoint for a mixture model of two normal distributions.
c) Gamma QQ plot for all data excluding the single elevated value.
d) Normal QQ plot for all data below the breakpoint shown in panel b.
-2 -1 0 1 2
50
100
150
200
All samples for cPAH TEQ
Theoretical Quantiles
Sam
ple
Quantile
s
-2 -1 0 1 2
10
30
50
70
Excludes outlier for cPAH TEQ
Theoretical Quantiles
Sam
ple
Quantile
s
10 20 30 40 50 60 70 80
10
30
50
70
Gamma QQ Plot
Gamma Quantiles
Sam
ple
Quantile
s
Correlation = 0.98
-2 -1 0 1 2
10
20
30
40
50
60
Normal QQ plot, Values < 65
Normal Quantiles
Sam
ple
Quantile
s
Correlation = 0.97
a) b)
c) d)

South Puget Sound Regional Background: Data Evaluation & Summary Report
Washington State Department of Ecology 78 Publication No. 18-09-117
Figure B-2. QQ plots for the dioxin/furan TEQ data (ng/kg, dry weight):
a) Normal QQ plot for all samples with one elevated value.
b) Gamma QQ plot for all data.
c) Normal QQ plot for all data.
-2 -1 0 1 2
05
10
15
20
25
All samples for D/F TEQ
Normal Quantiles
Sam
ple
Quantile
s
0 5 10 15 20 25
05
10
15
20
25
Gamma QQ Plot, all values
Gamma Quantiles
Sam
ple
Quantile
s
Correlation = 0.98
-2 -1 0 1 2
05
10
15
Normal QQ plot, values < 25
Normal Quantiles
Sam
ple
Quantile
s
Correlation = 0.99
a) b)
c)
Correlation = 0.97