south padbury primary school annual report 2018
TRANSCRIPT

South Padbury Primary School Annual Report
2018 Introduction This report provides parents, the Regional Executive Director, the Assistant Regional Executive Director and other community members with information about South Padbury Primary School’s activities and performance over the past year. This report is a requirement of all Western Australian Department of Education schools and contains essential information in response to the National Reporting Requirements. To gain maximum benefit from this School Report it should be considered in conjunction with other information such as student written reports, parent/teacher interviews, newsletters and the Federal Government My Schools website information. School Vision The vision for South Padbury Primary School (SPPS) is to build a learning community where students, parents and teachers work together to develop partnerships and foster life-long learning. As a learning community we aim to develop the whole child through the provision of quality learning experiences providing the opportunity for every student to become a positive, contributing member of the community. It is our belief that it is the quality of the teaching and learning programs, relationships and learning environment that maximise student learning. We believe in collaborative teamwork and evidence based planning. The school promotes a learning environment that encourages the development of self- discipline and where all members of the school community are responsible, respectful, safe and strive for excellence. The school values and encourages the positive contribution of parents/caregivers and views parents/caregivers as partners in their child’s education and development.
Objectives
1. Establish ambitious targets and set high expectations, academic and non-academic, for our students.
2. Engage all staff in a systematic, continuous and comprehensive self-assessment process related to student achievement and school operations.
3. Deliver high quality learning and teaching programs with pedagogical practices aligned to the
Australian Curriculum’s learning, teaching and assessment principles.
4. Expand the quality of teaching through utilising expert teachers to operate collaboratively sharing their skills and understandings.
5. Maintain a learning environment that is safe, caring and inclusive.
6. Target resources, through school improvement planning, to maximise student achievement.

7. Continue to build strong internal and external relationships including positive interactions between the school and its immediate and wider community.
Our objectives are aligned to the directions set by the Plan for Public Schools 2012-2018, the objectives and key elements of the Classroom First strategy and the priorities within Focus 2018 – Directions for Schools and based on strong school leadership, whole of school consistent approaches and the effective use of data sets. School Community Partnership The school actively promotes and encourages parent participation. Parents/caregivers are actively involved in;
School Board
P&C Committee
Canteen
Safety house
Sport
Extracurricular activities
Incursions/excursions The school has also developed strong relationships with local businesses in the area including;
Jellybeans After School Care – G8 Education
Keyed Up Music
Vincent’s Martial Arts
Padbury IGA
Padbury Pharmacy
Big Point Tennis Academy
L7 Health and Fitness
Higgins Formworks The School Curriculum During the 2018 academic year we structured the school’s curriculum based on the 8 learning areas of the Western Australian Curriculum. Western Australian Curriculum
English
Mathematics
Science
Humanities and Social Science
Health and Physical Education
Technologies
The Arts
Indonesian 50% of each school day is devoted to English and Mathematics.
Opportunities for Students at SPPS
Challenge Programs
PEAC (Primary Extension and Challenge)
EYE (Early Years Extension)
In class extension programs
Rockets extension program
ICT based research projects
Junior Primary Jets Program
Nature revegetation program – Years 5 and 6
Science – sponsored by Woodside

Sporting
Interschool Athletics Carnival
Faction Athletics Carnival
Interschool Winter Sports
In Term Swimming Classes
Interschool Cross Country
Swimming Carnival
Monday, Wednesday and Friday morning boot camp
Thursday morning tennis lessons
Music & Drama
Instrumental Music Instruction
SPPS Choir
Whole school singing
Recorder ensemble
Ukulele club
School and Context During the 2018 academic year SPPS had a student enrolment of 375 students from Kindergarten to Year 6. The school motto is ‘Pursuing Knowledge and Friendship’ which extends to parents and carers and reflects our students’ positive attitudes to learning. The school has a strong and positive reputation that is evidenced by an unprecedented demand for out of boundary enrolments. Parents are highly visible in the school organising, in consultation with the administration, numerous activities for the students which enrich the learning experiences for our students. Play areas are extensive with grounds being very well maintained and all structured play equipment now being under industrial shade covers. All areas of the school are fully air-conditioned with both evaporative and split level systems throughout the school. The school is well resourced and has a fully automated resource centre. All classrooms are fitted with interactive electronic whiteboards or Pro-Wise devices. 2018 saw the undercover structure being renovated and extended to accommodate our ever growing cohort of students. Thanks to collaboration with the school’s P&C body, the school has full class sets of iPads (335 in total), storage units for these devices and every area of the school has complete Wi-Fi coverage. Our school’s ICT resources and infrastructure meet our ambition to deliver 21st Learning principles to all of our students. Our long term goal is to become a paper free work and learning environment. Communication is an area that has improved throughout the 2018 academic year. All newsletter publications are now online, we have a website that is constantly updated, and we have an app that is utilised extensively to ensure that information to all of our stakeholders is constant and current. SPPS benefits from extensive experience amongst our teaching and non-teaching staff. All teachers meet the professional requirements to teach in Western Australian schools and are registered with the Teachers’ Registration Board of Western Australia. Our staff is highly skilled and has become extremely collaborative in all areas within our Phase of Learning Teams and Duncraig Network of School’s year level groups. This has enabled the continuation of well-established programs that were designed in 2016/2017 and implemented in 2018. The academic programs developed and implemented by teachers at SPPS ensured improved academic achievements in 2018, as demonstrated by the data collected, analysed and reported on in this report. The school’s Music Program is headed by Mrs Kylie Pollard, an experienced and accomplished educator. The program boasts an enthusiastic choir, instrumental music and singing at all assemblies and major functions. The Physical Education Program is headed up by Mrs Sue Wiener and encourages healthy competition amongst factions and between neighbouring schools. 2018 saw South Padbury come 2nd in the Interschool Athletics Carnival and perform with distinction in soccer, football, netball and soft-crosse. During the year each class was responsible for organising and performing at a school assembly providing opportunities for students to speak and present to an audience thus developing confidence and self-esteem. Each assembly is followed by a morning tea allowing parents to interact informally but purposely with both the teacher and the principal, Mr David Knox. Staff support students to reach their full potential through offering a range of learning

opportunities presented in a variety of ways designed to engage each student in the learning experience at hand. As 2018 signifies the beginning on the 3 Year Business Plan 2018-2020, this document will report on our target attainments towards the Business Plan and the 1 year 2018 Operational Plans.
Enrolments
.
Kindergarten Pre-Primary Primary Total
Male 22 24 153 199
Female 23 27 132 182
Total 45 51 285 381
Data Analysis
2018 NAPLAN
Analysis and Action
Key
Below National Average Above National Average
Year 5 SPPS
Average V
National
Average
Variance Year 3 SPPS
Average V
National
Average
Variance
Reading 22% Reading 18%
Writing 07% Writing 01%
Spelling 26% Spelling 18%
Grammar &
Punctuation
18% Grammar &
Punctuation
28%
Numeracy 16% Numeracy 24%

Below State Average Above State Average
Year 5 SPPS
Average V
State
Average
Variance Year 3 SPPS
Average V
State
Average
Variance
Reading 29% Reading 29%
Writing 12% Writing 08%
Spelling 29% Spelling 25%
Grammar &
Punctuation
22% Grammar &
Punctuation
36%
Numeracy 20% Numeracy 29%
Mean Scores; Australian v Western Australian v South Padbury PS
Year 5 Australian
Mean
WA
State
Mean
School
Mean
Year 3 Australian
Mean
WA
State
Mean
School
Mean
Reading 509 502 531 Reading 434 423 452
Writing 465 460 472 Writing 407 400 408
Spelling 503 500 529 Spelling 418 411 436
Grammar &
Punctuation
504 500 522 Grammar &
Punctuation
432 424 460
Numeracy 494 490 510 Numeracy 408 403 432
Attainment of National Minimum Standard
Year 5 Attainment Year 3 Attainment
Reading 96% Reading 96%
Writing 96% Writing 96%
Spelling 100% Spelling 94%
Grammar & Punctuation 98% Grammar & Punctuation 100%
Numeracy 96% Numeracy 98%
Attainment of 2018 Operational Plan Targets
English
Year 3 Reading Achieved Variance

Maintain at 20% or above students attaining band 6 to 10 level of achievement. 12%
Maintain at 30% or above students attaining band 5 and above level of achievement. 30%
Increase to 75% students attaining band 4 and above level of achievement. 08%
Decrease to less than 10% students attaining band 2 and below level of achievement 00%
Year 3 Writing
Increase to 20% students attaining band 6 to 10 level of achievement. 07%
Increase to 60% or above students attaining band 5 and above level of achievement. 13%
Maintain at 80% or above students attaining band 4 and above level of achievement. 12%
Decrease to less than 5% students attaining band 2 and below level of achievement 05%
Year 3 Spelling
Maintain at 20% or above students attaining band 6 to 10 level of achievement. 14%
Maintain at 30% or above students attaining band 5 level of achievement. 32%
Increase to 80% students attaining band 4 and above level of achievement. 03%
Decrease to less than 10% students attaining band 2 and below level of
achievement.
00%
Year 3 Grammar and Punctuation
Maintain at 20% or above students attaining band 6 to 10 level of achievement. 22%
Maintain at 35% or above students attaining band 5 level of achievement. 20%
Increase to 80% students attaining band 4 and above level of achievement. 05%
Decrease to less than 10% students attaining band 2 and below level of
achievement.
01%
Year 3 English Operational Target Attainment Rate 75%
Year 5 Reading
Increase to 16% students attaining band 8 to 10 level of achievement. 11%
Maintain at 30% or above students attaining band 7 level of achievement. 14%
Increase to 70% students attaining band 6 and above level of achievement. 05%
Decrease to less than 12% students attaining band 4 and below level of
achievement.
06%
Year 5 Writing
Increase to 5% students attaining band 8 to 10 level of achievement. 03%
Increase to 12% students attaining band 7 level of achievement. 06%
Increase to 48% students attaining band 6 and above level of achievement. 00%

Decrease to less than 10% students attaining band 4 and below level of
achievement.
00%
Year 5 Spelling
Increase to 15% students attaining band 8 to 10 level of achievement. 04%
Increase to 30% students attaining band 7 level of achievement. 01%
Increase to 48% students attaining band 6 and above level of achievement. 31%
Maintain at less than 5% students attaining band 4 and below level of achievement. 05%
Year 5 Grammar and Punctuation
Maintain at 20% or above students attaining band 8 to 10 level of achievement. 03%
Increase to 10% students attaining band 7 level of achievement. 09%
Increase to 52% students attaining band 6 and above level of achievement. 23%
Decrease to less than 20% students attaining band 4 and below level of
achievement.
01%
Year 5 English Operational Target Attainment Rate 81%
Mathematics
Year 3 Mathematics Achieved Variance
5% of Year 3 students attain band 6 or above level of Mathematics student
achievement.
27%
32% of Year 3 students attain band 5 or above level of Mathematics student
achievement.
26%
51% of Year 3 students attain band 3 or 4 level of Mathematics student
achievement.
37%
Less than 10% of Year 3 students attain band 2 level of Mathematics student
achievement.
11%
Year 3 Mathematics Operational Target Attainment Rate 75%
Year 5 Mathematics
29 % of Year 5 students or more attain band 8 or above level of Mathematics
student achievement.
19%
14 % of Year 5 students or more attain band 7 or above level of Mathematics
student achievement.
08%
50 % of Year 5 students or more attain band 5 or 6 or above level of Mathematics
student achievement.
12%
Less than 7% of Year 5 students attain band 4 or below level of Mathematics
student achievement.
01%
Year 5 Mathematics Operational Target Attainment Rate 100%

Business Plan 2018-2020 Target Attainment
Top 20% of All Australian Schools
Year 5 Target Attainment Variance Year 3 Target Attainment Variance
Reading 20% 30% +10% Reading 20% 31% + 11%
Writing 20% 23% +03% Writing 20% 11% -09%
Spelling 20% 32% +12% Spelling 20% 33% +13%
Grammar
&
Punctuatio
n
20% 38% +18% Grammar &
Punctuation
20% 38% +18%
Numeracy 20% 34% +14% Numeracy 20% 27% +07%
NAPLAN Longitudinal Summary
2014-2018
2018 - Business Plan Target Attainment Rate 90%


Proficiency Band Attainment Levels Table 1. Year 3 Numeracy 2. Year 3 Reading 3. Year 3 Reading 4. Year 3 Spelling 5. Year 3 Grammar & Punctuation 6. Year 5 Numeracy 7. Year 5 Reading 8. Year 5 Writing 9. Year 5 Spelling 10. Year 5 Grammar & Punctuation
1. Percentage of students in each Proficiency Band
Year 3 Numeracy
Band
NAPLAN
Score Range
School
Like Schools
WA Public Schools
2016
2017
2018
2016
2017
2018
2016
2017
2018
6 to 10
478 & Above
32%
15%
32%
14%
22%
15%
15%
18%
15%
5
426 - 477
27%
28%
26%
19%
24%
31%
18%
18%
24%
4
374 - 425
22%
36%
15%
25%
31%
27%
22%
28%
27%
3
322 - 373
15%
18%
15%
26%
14%
17%
26%
19%
19%
2
270 - 321
5%
3%
9%
13%
7%
9%
14%
13%
13%
1
Up to 269
0%
0%
2%
3%
2%
1%
5%
5%
3%
2. Percentage of students in each Proficiency Band
Year 3 Reading
Band
NAPLAN
Score Range
School
Like Schools
WA Public Schools
2016
2017
2018
2016
2017
2018
2016
2017
2018
6 to 10
478 & Above
40%
25%
32%
24%
28%
28%
23%
23%
25%
5
426 - 477
33%
32%
28%
26%
26%
25%
22%
20%
23%
4
374 - 425
17%
20%
23%
19%
22%
22%
19%
23%
21%
3
322 - 373
5%
8%
8%
19%
15%
12%
19%
18%
14%
2
270 - 321
5%
10%
6%
8%
6%
8%
12%
9%
10%
1
Up to 269
0%
5%
4%
4%
3%
5%
6%
7%
7%

4. Percentage of students in each Proficiency Band
Year 3 Spelling
Band
NAPLAN
Score Range
School
Like Schools
WA Public Schools
2016
2017
2018
2016
2017
2018
2016
2017
2018
6 to 10
478 & Above
36%
22%
34%
23%
24%
21%
20%
20%
21%
5
426 - 477
36%
35%
28%
27%
26%
24%
25%
23%
23%
4
374 - 425
21%
20%
21%
25%
26%
28%
23%
23%
23%
3
322 - 373
5%
12%
8%
13%
14%
18%
14%
16%
16%
2
270 - 321
2%
5%
2%
9%
8%
6%
12%
12%
9%
1
Up to 269
0%
5%
8%
3%
2%
4%
6%
6%
8%
5. Percentage of students in each Proficiency Band
Year 3 Grammar & Punctuation
Band
NAPLAN
Score Range
School
Like Schools
WA Public Schools
2016
2017
2018
2016
2017
2018
2016
2017
2018
6 to 10
478 & Above
50%
30%
42%
32%
39%
35%
28%
29%
30%
5
426 - 477
14%
35%
13%
18%
27%
15%
17%
24%
16%
4
374 - 425
21%
10%
30%
20%
13%
22%
19%
15%
22%
3
322 - 373
7%
10%
6%
23%
10%
13%
24%
12%
14%
2
270 - 321
5%
10%
9%
4%
6%
10%
6%
10%
11%
1
Up to 269
2%
5%
0%
3%
4%
4%
6%
10%
7%
6. Percentage of students in each Proficiency Band
Year 5 Numeracy
Band
NAPLAN
Score Range
School
Like Schools
WA Public Schools
2016
2017
2018
2016
2017
2018
2016
2017
2018
8 to 10
582 & Above
7%
11%
10%
10%
12%
11%
11%
9%
9%
7
530 - 581
18%
21%
22%
15%
21%
20%
13%
16%
18%
3. Percentage of students in each Proficiency Band
Year 3 Writing
Band
NAPLAN
Score Range
School
Like Schools
WA Public Schools
2016
2017
2018
2016
2017
2018
2016
2017
2018
6 to 10
478 & Above
14%
13%
13%
13%
16%
11%
12%
11%
9%
5
426 - 477
45%
46%
34%
38%
43%
40%
34%
34%
34%
4
374 - 425
31%
26%
21%
32%
24%
23%
30%
24%
23%
3
322 - 373
10%
10%
23%
11%
13%
18%
14%
21%
20%
2
270 - 321
0%
5%
6%
3%
2%
5%
6%
6%
7%
1
Up to 269
0%
0%
4%
2%
1%
3%
3%
4%
6%

6
478 - 529
36%
29%
29%
30%
32%
27%
26%
28%
26%
5
426 - 477
27%
29%
33%
30%
22%
28%
28%
26%
29%
4
374 - 425
11%
7%
2%
12%
11%
11%
16%
15%
15%
1 to 3
Up to 373
2%
4%
4%
3%
2%
2%
7%
5%
4%
7. Percentage of students in each Proficiency Band
Year 5 Reading
Band
NAPLAN
Score Range
School
Like Schools
WA Public Schools
2016
2017
2018
2016
2017
2018
2016
2017
2018
8 to 10
582 & Above
19%
14%
27%
14%
16%
20%
12%
14%
15%
7
530 - 581
23%
34%
17%
24%
23%
19%
21%
20%
19%
6
478 - 529
28%
21%
31%
26%
27%
26%
23%
26%
24%
5
426 - 477
11%
17%
19%
21%
20%
18%
20%
18%
20%
4
374 - 425
16%
14%
2%
11%
11%
11%
14%
15%
13%
1 to 3
Up to 373
4%
0%
4%
4%
3%
5%
10%
7%
8%
8. Percentage of students in each Proficiency Band
Year 5 Writing
Band
NAPLAN
Score Range
School
Like Schools
WA Public Schools
2016
2017
2018
2016
2017
2018
2016
2017
2018
8 to 10
582 & Above
0%
0%
2%
2%
5%
3%
3%
3%
4%
7
530 - 581
16%
11%
4%
10%
13%
10%
11%
10%
9%
6
478 - 529
42%
29%
40%
35%
31%
28%
30%
28%
24%
5
426 - 477
32%
39%
43%
35%
40%
39%
35%
38%
37%
4
374 - 425
7%
21%
6%
14%
7%
12%
14%
11%
13%
1 to 3
Up to 373
4%
0%
4%
3%
4%
8%
7%
10%
13%
9. Percentage of students in each Proficiency Band
Year 5 Spelling
Band
NAPLAN
Score Range
School
Like Schools
WA Public Schools
2016
2017
2018
2016
2017
2018
2016
2017
2018
8 to 10
582 & Above
9%
15%
19%
9%
17%
11%
10%
13%
11%
7
530 - 581
19%
30%
31%
18%
22%
25%
15%
19%
20%
6
478 - 529
30%
26%
29%
33%
30%
33%
31%
30%
32%
5
426 - 477
28%
26%
10%
27%
22%
20%
25%
22%
20%
4
374 - 425
11%
4%
10%
8%
7%
8%
11%
10%
11%
1 to 3
Up to 373
4%
0%
0%
4%
3%
3%
8%
8%
6%
10. Percentage of students in each Proficiency Band
Year 5 Grammar & Punctuation

Band
NAPLAN
Score Range
School
Like Schools
WA Public Schools
2016
2017
2018
2016
2017
2018
2016
2017
2018
8 to 10
582 & Above
16%
30%
23%
16%
20%
19%
16%
17%
17%
7
530 - 581
21%
7%
19%
22%
18%
22%
18%
13%
14%
6
478 - 529
25%
15%
33%
26%
26%
28%
23%
25%
18%
5
426 - 477
28%
22%
6%
21%
15%
17%
22%
16%
17%
4
374 - 425
9%
26%
17%
12%
15%
12%
15%
19%
13%
1 to 3
Up to 373
2%
0%
2%
4%
5%
3%
7%
10%
8%
Over the past 5 years our focus at South Padbury has been on increasing our representation in the upper
proficiency bands to be either equal to or greater than our Like School counterparts.
The table 1A. demonstrates the extent of our success in this area as being 80% as compared to 20% in 2013.
It’s also important to note that where we were below our Like School counterparts in representation in the
upper proficiency bands in Year 5 Numeracy and Year 5 Writing, it was by only 01% in both instances.
Table 1.A Performance in the upper proficiency bands against Like School and WA Public Schools
Tested Learning Area Bands Like School % WA School%
1. Year 3 Numeracy 6 to 10 +17% +17%
2. Year 3 Reading 6 to 10 +04% +07%
3. Year 3 Writing 6 to 10 +02% +04%
4. Year 3 Spelling 6 to 10 +13% +13%
5. Year 3 Grammar & Punctuation 6 to 10 +07% +12%
6. Year 5 Numeracy 8 to 10 -01% +01%
7. Year 5 Reading 8 to 10 +04% +12%
8. Year 5 Writing 8 to 10 -01% -02%
9. Year 5 Spelling 8 to 10 +08% +08%
10. Year 5 Grammar & Punctuation 8 to 10 +04% +06%
Destination Schools
Duncraig SHS 24
Interstate 1
Overseas 1
Emmanuel Christian Community School 1
Perth Modern School 1
Peter Moyes Anglican Community School 1
With 82.75 % of our students moving on to Duncraig Senior High School, the strong links that we share with
the school pay short, medium and long term dividends for all of our stakeholders. Our parents know that the
transition to high school is smooth and their children are moving from one safe, secure supportive and
engaging learning environment to another.

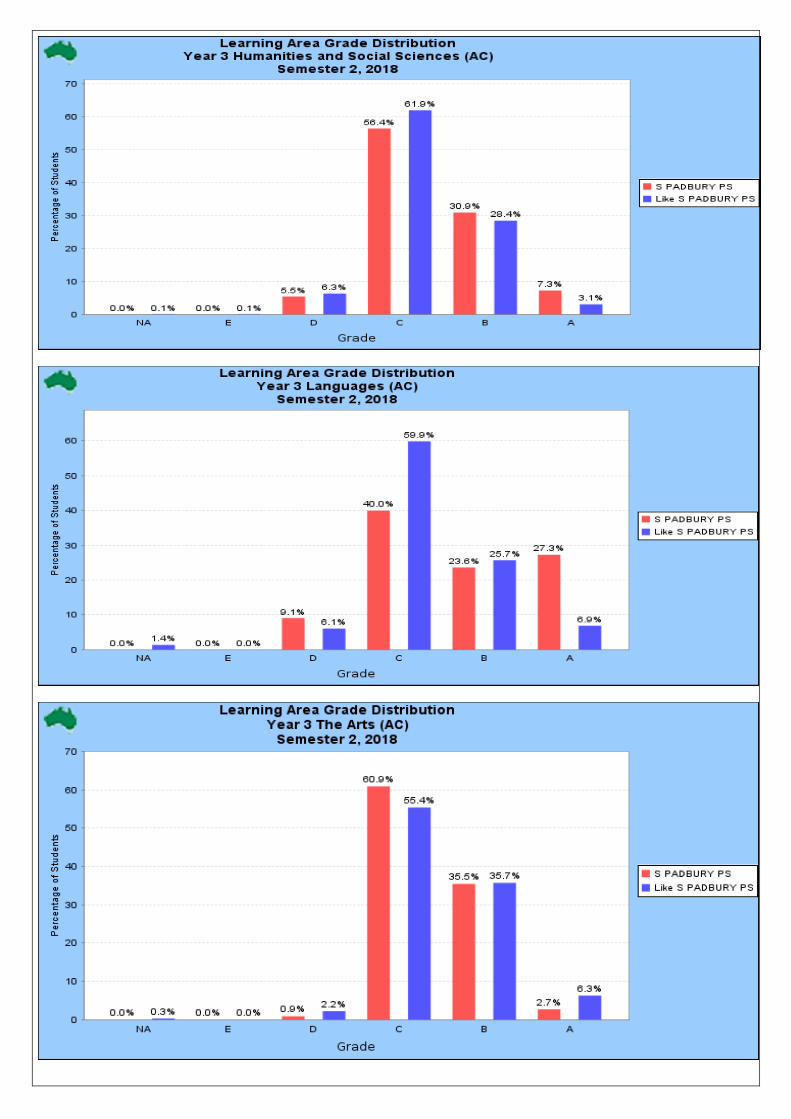
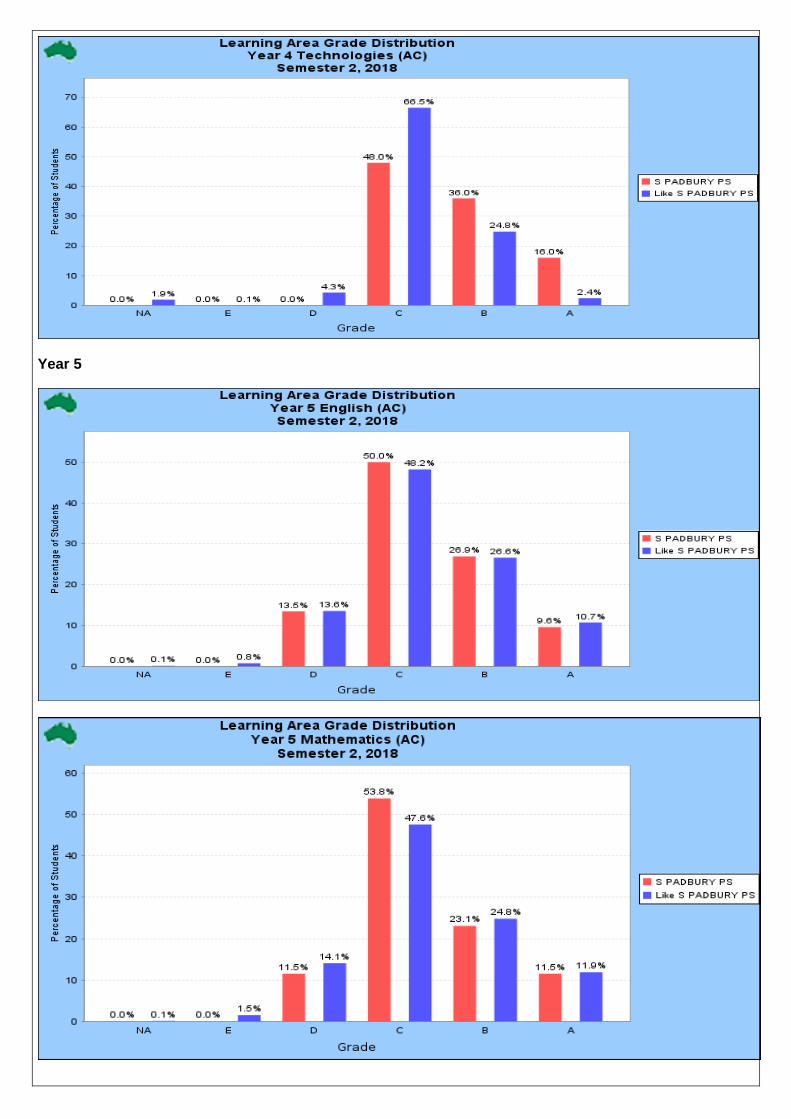
Learning Area Grade Distributions in Comparison to Like Schools
Pre - Primary


Year 1


Year 2


Year 3

Year 4


Year 5


Year 6


Analysis: There is a fairly strong correlation between SPPS grade distributions and those of our like schools.
Grade A B C D
PE More Fewer More More
PM Fewer Fewer More More
1E More More Fewer Fewer
1M More Fewer Fewer More
2E Fewer Fewer More Fewer
2M Fewer Fewer More More
3E Fewer Fewer Fewer More
3M More Fewer More More
4E Fewer More Fewer More
4M More Fewer Fewer Fewer
5E Fewer More More Fewer
5M Fewer Fewer More Fewer
6E Fewer Fewer Fewer More
6M Fewer More Fewer More
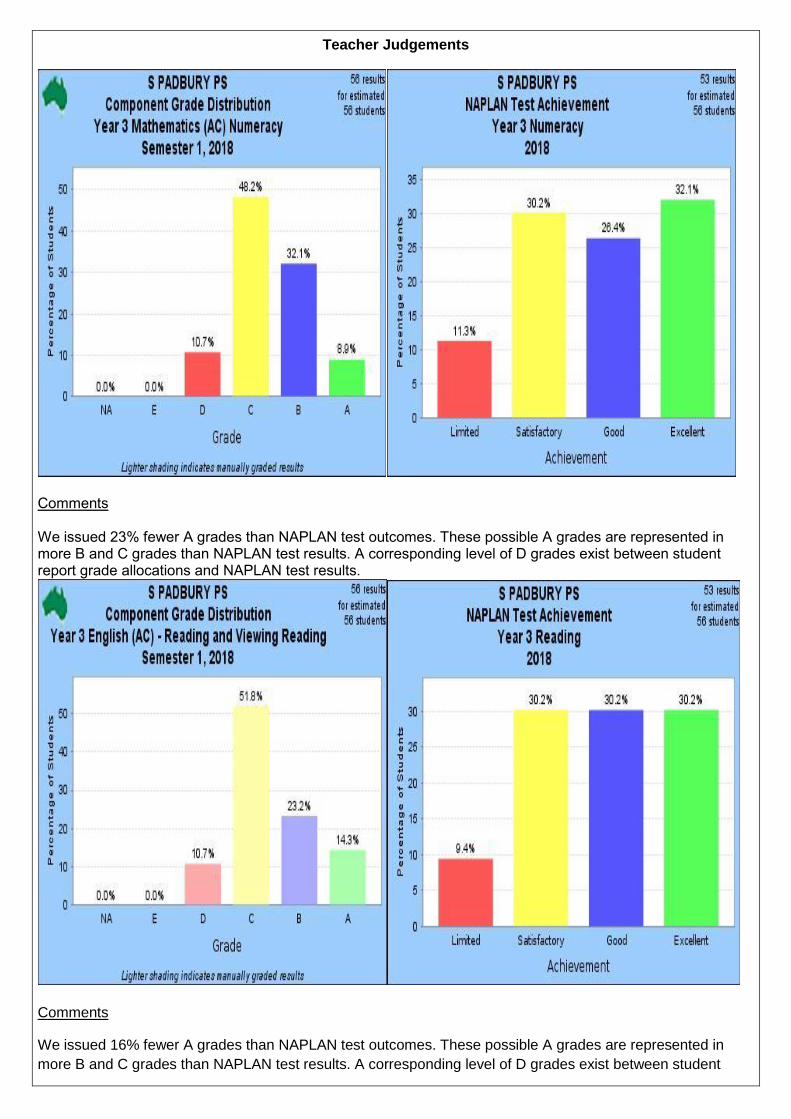
Teacher Judgements
Comments We issued 23% fewer A grades than NAPLAN test outcomes. These possible A grades are represented in more B and C grades than NAPLAN test results. A corresponding level of D grades exist between student report grade allocations and NAPLAN test results.
Comments
We issued 16% fewer A grades than NAPLAN test outcomes. These possible A grades are represented in
more B and C grades than NAPLAN test results. A corresponding level of D grades exist between student

report grade allocations and NAPLAN test results. Where we reported that 37% of our students are either A or
B grade, the system suggests that the figure is 60%.
Comments
These figures, comparing NAPLAN test result and report grade allocations are very closely correlated, except
where we allocate 7.4% more D grades than the NAPLAN test indicates.

Comments
These figues show that in our reporting, we allocated 17.5% fewer A’s, 16% more B’s, 9.6% fewer C’s and
11% more D’s than the NAPLAN results indicate.
On the whole our 2018 grade allocations understate our performance considerably in comparison to our
NAPLAN test results.
Value Adding – Stable Cohorts
PP On entry testing 2015 to Year 3 PP On entry testing 2015 to Year 3 NAPLAN 2018 – Numeracy NAPLAN 2018 - Reading
Year 3 NAPLAN 2016 to Year 5 Year 3 NAPLAN 2016 to Year 5 NAPLAN 2018 – Numeracy NAPLAN 2018 – Reading
Whole of School Case Management Plans in addressing NAPLAN band descriptors
Year 3 Mathematics
Identified cohort areas to be addressed in whole class learning experiences:
1. Identifies factors of a number and uses them to solve a problem Case Management Plan

Band Target Group
Focus Resource
6 8
Extension
Group
Compares angles within complex shapes
and identifies those that are acute
Represents numbers to three decimal
places on a number line
Selects two multiplication number
sentences to represent a combinations
problem
Interprets a side-by-side column graph to
compare categorical variables
Identifies expressions which could be used
to continue a number pattern
Estimates total cost by rounding amounts
to the nearest dollar
Represents a problem as a number
sentence involving multiplication and
addition
Uses a timetable to solve a problem
involving duration of time
Compares the area of irregular polygons
Calculates the length of an object by
subtracting decimal metric units
Uses scaled thermometers to compare
temperatures
Solves a two-step word problem involving
multiplication and division
Converts litres to millilitres to solve a
capacity problem
Interprets picture graphs where one
picture represents many data values
Applies place value knowledge to solve a
subtraction problem
Identifies possible outcome of rolling a
dice once
Solves a problem involving division
resulting in a remainder
First Steps Mathematics
Overview
First Steps Number
First Steps Measurement
First Steps Space
Prodigy
First Steps Chance and
Data
Origo Stepping Stones
5 7 Main Group Interprets a simple two-way data table First Steps Mathematics
Overview

Solves a multi-step problem involving
addition and subtraction using a number
line
Determines a missing number to make a
number sentence true
Counts the number of blocks to calculate
the volume of cubes
Calculates the change required for a
simple transaction
Identifies a quarter of a whole subdivided
into 8 parts
Identifies an event where one cannot
happen if the other happens
Identifies the faces used to make a prism
Solves a simple division problem
Selects appropriate methods for data
collection
Identifies a shape after a rotation
Makes the largest two-digit number given
three possible digits
Compares and estimates objects using
metric units of length
Continues a number pattern involving
repeated addition or multiplication
Uses the connection between addition and
subtraction to write a number sentence
First Steps Number
First Steps Measurement
First Steps Space
Prodigy
First Steps Chance and
Data
Origo Stepping Stones
2 3 Students At
Educational
Risk
Interprets a simple two-way data table
Solves a multi-step problem involving
addition and subtraction using a number
line
Determines a missing number to make a
number sentence true
Counts the number of blocks to calculate
the volume of cubes
Calculates the change required for a
simple transaction
Identifies a quarter of a whole subdivided
into 8 parts
First Steps Mathematics
Overview
First Steps Number
First Steps Measurement
First Steps Space
Prodigy
First Steps Chance and
Data
Origo Stepping Stones

Identifies an event where one cannot
happen if the other happens
Identifies the faces used to make a prism
Solves a simple division problem
Selects appropriate methods for data
collection
Identifies a shape after a rotation
Makes the largest two-digit number given
three possible digits
Compares and estimates objects using
metric units of length
Continues a number pattern involving
repeated addition or multiplication Uses
the connection between addition and
subtraction to write a number sentence.
Assessment Tools
NAPLAN data sets, SCSA resources, Stepping Stones assessment modules, On-entry assessments for PP, Like school data comparisons, First Steps Maps of Development, Literacy Net, Numeracy Net, EAL/EAD Progress Maps, Anecdotal comments, Observations, Checklists, Profiles, Portfolios, Records of test results ,Audio & visual recordings, Marking keys and Documented Plans.
Year 3 Reading
Identified cohort areas to be addressed in whole class learning experiences:
1. Links directly stated information across paragraphs in a personal letter 2. Identifies the purpose of the text layout in an advertisement.
Case Management Plan
Band Target Group
Focus Resource
6 8
Extension
Group
Interprets directly stated information
in an information text
Analyses information to make an
inference in an information text
Identifies evaluative language to
match a theme in an advertisement
Interprets directly stated information
in a persuasive discussion
Interprets vocabulary that
contributes to the tone of an
advertisement
First Steps Reading Map of
Development
First Steps Reading Resource
Book
PM Benchmarks
Reading Eggs
Reading Eggs-press

Identifies the purpose of a sub-
heading in an information text
Infers the reason for an outcome in
an information text
Interprets directly stated information
in an information text
Identifies a difference between an
information text and a persuasive
text
Interprets directly stated information
in a narrative
Identifies the purpose of the text
layout in an advertisement
5 7 Main Group Identifies how persuasion is used in
the opening paragraph of an
information text
Links information from the text to the
title of an information text
Interprets a device used to engage
readers of an advertisement
Identifies an author's assumption in
an advertisement
Identifies the author's perspective in
an advertisement
Identifies directly stated information
an advertisement
Identifies the significance of an
event in an information text
Interprets directly stated information
in an information text
Analyses information to make an
inference in an information text
Identifies evaluative language to
match a theme in an advertisement
Interprets directly stated information
in a persuasive discussion
Interprets vocabulary that
contributes to the tone of an
advertisement
First Steps Reading Map of
Development
First Steps Reading Resource
Book
PM Benchmarks
Reading Eggs
Reading Eggs-press

Identifies the purpose of a sub-
heading in an information text
Infers the reason for an outcome in
an information text
Interprets directly stated information
in an information text
Identifies a difference between an
information text and a persuasive
text
Interprets directly stated information
in a narrative
Identifies the purpose of the text
layout in an advertisement
Locates directly stated details in an
information text
Locates directly stated information in
a narrative
Evaluates a character trait from
behaviour in a narrative
Identifies contrasted information in a
persuasive discussion
Interprets the meaning of figurative
language in an information text
Identifies the purpose of a paragraph
in a narrative
Locates directly stated information in
a narrative
Identifies the main idea of a
persuasive discussion
2 5 Students At
Educational
Risk
Locates directly stated information
across paragraphs in a personal
letter
Identifies the author's intent in a
persuasive discussion
Identifies the author's perspective at
the end of a persuasive discussion
Identifies the purpose of descriptive
language in a personal letter
Interprets directly stated information
in a personal letter
First Steps Reading Map of
Development
First Steps Reading Resource
Book
PM Benchmarks
Reading Eggs
Reading Eggs-press
Identifies the setting for a narrative
Locates directly stated information in
a personal letter
Locates directly stated information in
a personal letter
Assessment Tools
NAPLAN data sets, SCSA resources , PM Benchmarks for Years 1 to 2, Probe Reading Assessment, On-entry assessments for PP, Kindergarten Phonological Awareness Assessment, Like school data comparisons, First Steps Maps of Development, Literacy Net, EAL/EAD Progress Maps, Anecdotal comments, Observations, Checklists, Profiles, Portfolios, Records of test results ,Audio & visual recordings, Marking keys and Documented Plans.
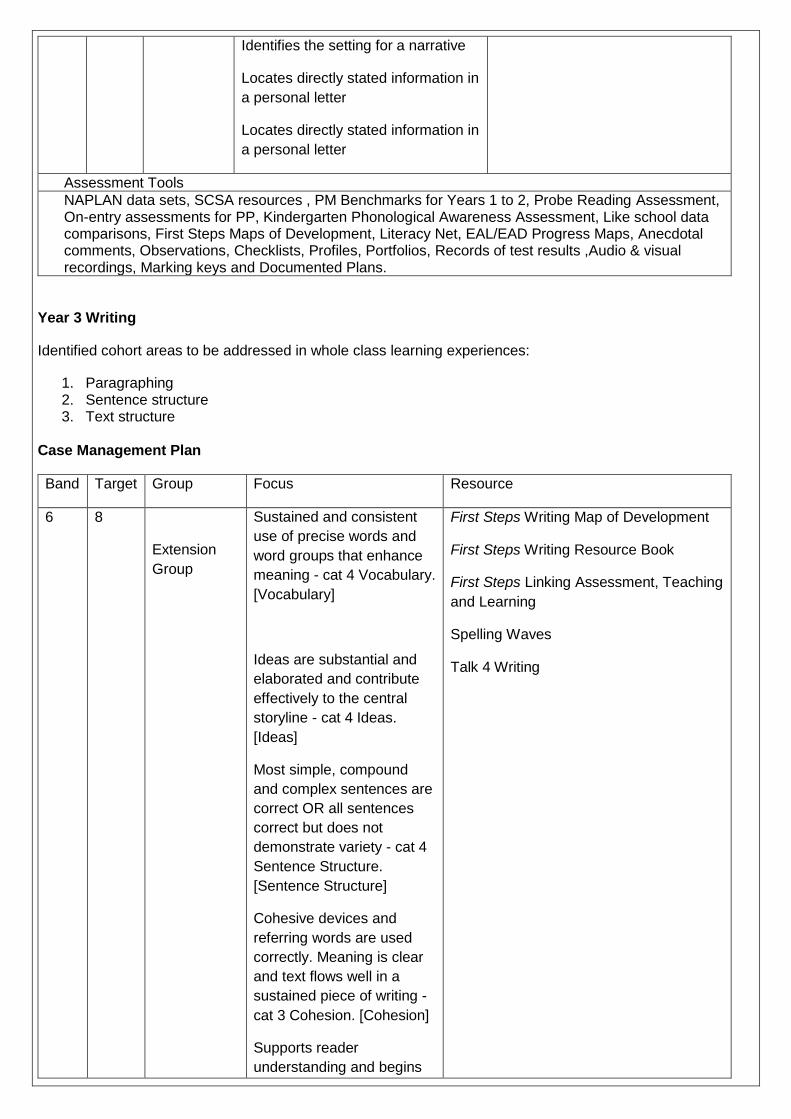
Year 3 Writing
Identified cohort areas to be addressed in whole class learning experiences:
1. Paragraphing 2. Sentence structure 3. Text structure
Case Management Plan
Band Target Group Focus Resource
6 8
Extension
Group
Sustained and consistent
use of precise words and
word groups that enhance
meaning - cat 4 Vocabulary.
[Vocabulary]
Ideas are substantial and
elaborated and contribute
effectively to the central
storyline - cat 4 Ideas.
[Ideas]
Most simple, compound
and complex sentences are
correct OR all sentences
correct but does not
demonstrate variety - cat 4
Sentence Structure.
[Sentence Structure]
Cohesive devices and
referring words are used
correctly. Meaning is clear
and text flows well in a
sustained piece of writing -
cat 3 Cohesion. [Cohesion]
Supports reader
understanding and begins
First Steps Writing Map of Development
First Steps Writing Resource Book
First Steps Linking Assessment, Teaching
and Learning
Spelling Waves
Talk 4 Writing

to engage the reader
through language choices
and narrative devices - cat
4 Audience. [Audience]
Uses some devices that
persuade but use is not
sustained - cat 3
Persuasive Devices.
[Persuasive Devices]
Text contains an
orientation, complication
and resolution - cat 3 Text
Structure. [Text Structure]
5 7 Main Group Correct spelling of most
simple words, most
common words and some
difficult words - cat 4
Spelling. [Spelling]
All paragraphs are focused
on one idea or set of like
ideas with at least one
paragraph logically
constructed - cat 2
Paragraphing.
[Paragraphing]
Four or more precise words
or word groups - cat 3
Vocabulary. [Vocabulary]
Sentence level punctuation
mostly correct and some
other punctuation used
correctly OR accurate
sentence punctuation with
no other markers - cat 3
Punctuation. [Punctuation]
Most simple and compound
sentences are correct.
Some complex sentences
are correct - cat 3 Sentence
Structure. [Sentence
Structure]
Ideas relate coherently and
show some development or
First Steps Writing Map of Development
First Steps Writing Resource Book
First Steps Linking Assessment, Teaching
and Learning
Spelling Waves

elaboration - cat 3 Ideas.
[Ideas]
Orients the reader by
writing an internally
consistent story with
sufficient information to
support the reader - cat 3
Audience. [Audience]
Uses three or more
instances of persuasive
devices that support the
writer's position - cat 2
Persuasive Devices.
[Persuasive Devices]
3 4 Students At
Educational
Risk
Writing is organised into
paragraphs that are mainly
focused on one idea or set
of like ideas - cat 1
Paragraphing.
[Paragraphing]
Some accurately
punctuated sentences
(beginning and end) OR
one correctly punctuated
sentence and some other
punctuation used correctly -
cat 2 Punctuation.
[Punctuation]
Some correct links between
sentences. Most referring
words are correct. Reader
may need to re-read to
clarify meaning - cat 2
Cohesion. [Cohesion]
Correct sentences are
mostly simple and/or
compound sentences - cat
2 Sentence Structure.
[Sentence Structure]
One idea with simple
elaboration OR few, related
but unelaborated ideas OR
many simple, related but
unelaborated ideas - cat 2
Ideas. [Ideas]
First Steps Writing Map of Development
First Steps Writing Resource Book
First Steps Linking Assessment, Teaching
and Learning
Spelling Waves

Shows basic awareness of
audience by attempting to
orient the reader by
providing some information
- cat 2 Audience.
[Audience]
Assessment Tools
NAPLAN data sets, SCSA resources , PM Benchmarks for Years 1 to 2,On-entry assessments for PP, Kindergarten Phonological Awareness Assessment, Like school data comparisons, First Steps Maps of Development, Literacy Net, EAL/EAD Progress Maps, Anecdotal comments, Observations, Checklists, Profiles, Portfolios, Records of test results ,Audio & visual recordings, Marking keys and Documented Plans.
Year 5 Mathematics
Identified cohort areas to be addressed in whole class learning experiences:
1. Identifies factors of a number and uses them to solve a problem. Case Management Plan
Band Target Group Focus Resource
8 9
Extension
Group
Calculates the cost of an item after a
percentage discount
Identifies the five-digit numbers that
satisfy a given rule
Identifies equivalent fractions used in
context
Uses a calendar to determine the day
of the week of a particular date
Identifies factors of a number and
uses them to solve a problem
Compares angles within complex
shapes and identifies those that are
acute
Represents numbers to three
decimal places on a number line
Selects two multiplication number
sentences to represent a
combinations problem
Interprets a side-by-side column
graph to compare categorical
variables
Identifies expressions which could be
used to continue a number pattern
Estimates total cost by rounding
amounts to the nearest dollar [Q30]
Origo Stepping Stones
First Steps Mathematics Overview
First Steps Number
First Steps Measurement
First Steps Space
First Steps Chance and Data
Prodigy

6 7 Main Group Represents a problem as a number
sentence involving multiplication and
addition
Uses a timetable to solve a problem
involving duration of time
Compares the area of irregular
polygons
Calculates the length of an object by
subtracting decimal metric units
Uses scaled thermometers to
compare temperatures
Solves a two-step word problem
involving multiplication and division
Converts litres to millilitres to solve a
capacity problem
Interprets picture graphs where one
picture represents many data values
Applies place value knowledge to
solve a subtraction problem
Identifies possible outcome of rolling
a dice once
Solves a problem involving division
resulting in a remainder
Origo Stepping Stones
First Steps Mathematics Overview
First Steps Number
First Steps Measurement
First Steps Space
First Steps Chance and Data
Prodigy
4 5 Students At
Educational
Risk
Identifies a quarter of a whole
subdivided into 8 parts
Identifies an event where one cannot
happen if the other happens
Identifies the faces used to make a
prism
Solves a simple division problem
Selects appropriate methods for data
collection
Identifies a shape after a rotation
Makes the largest two-digit number
given three possible digits
Compares and estimates objects
using metric units of length
Continues a number pattern involving
repeated addition or multiplication
Origo Stepping Stones
First Steps Mathematics Overview
First Steps Number
First Steps Measurement
First Steps Space
First Steps Chance and Data
Prodigy

Uses the connection between
addition and subtraction to write a
number sentence
Counts the total from a tally table
Chooses a suitable scale to describe
the data on a column graph
Uses directional language to
describe a route on a basic map
Assessment Tools
NAPLAN data sets, SCSA resources, Stepping Stones assessment modules, On-entry assessments for PP, Like school data comparisons, First Steps Maps of Development, Literacy Net, Numeracy Net, EAL/EAD Progress Maps, Anecdotal comments, Observations, Checklists, Profiles, Portfolios, Records of test results ,Audio & visual recordings, Marking keys and Documented Plans
Year 5 Reading
Identified cohort areas to be addressed in whole class learning experiences:
1. Links directly stated information across paragraphs in a personal letter 2. Identifies the purpose of the text layout in an advertisement.
Case Management Plan
Band Target Group Focus Resource
8 10
Extension
Group
Infers multiple meanings from the
title of a complex essay
Synthesises information from across
a text in a discussion transcript
Identifies a character's perspective in
a speech with internal commentary
Applies understanding of
complicated ideas from a complex
essay
Evaluate the purpose for the use of
italics in a persuasive letter
Identifies how a title reflects aspects
of a speech with internal
commentary
Identifies an example of emotive
language in an argument
Identifies the validity of key
information from across a complex
essay
Identifies the sequence of events in a
narrative
First Steps Reading Map of
Development
First Steps Reading Resource
Book
PM Benchmarks
Reading Eggs
Reading Eggs-press

Interprets a rhetorical device in a
persuasive letter
Identifies the writer’s opinion of the
subject of a complex essay
Interprets an implied meaning in a
speech with internal commentary
Interprets an allusion in the middle of
a speech with internal commentary
Identifies the effect of an intensifier in
a factual description
Interprets directly stated information
in a factual description
Extracts key information and ideas
from the middle of a complex essay
Infers a character's perspective in a
speech with internal commentary
Identifies a definition in an
information text
5 6 Main Group Identifies the purpose of a paragraph
in a narrative
Locates directly stated information in
a narrative
Identifies the main idea of a
persuasive discussion
Identifies the main purpose of a
personal letter
Interprets a pronoun reference in a
persuasive discussion
Identifies the purpose of a diagram in
an information text
Interprets a diagram in an
information text
Interprets directly stated information
in an information text
First Steps Reading Map of
Development
First Steps Reading Resource
Book
PM Benchmarks
Reading Eggs
Reading Eggs-press
3 4 Students At
Educational
Risk
Identifies how persuasion is used in
the opening paragraph of an
information text
Links information from the text to the
title of an information text
First Steps Reading Map of
Development
First Steps Reading Resource
Book
PM Benchmarks

Interprets a device used to engage
readers of an advertisement
Identifies an author's assumption in
an advertisement
Identifies the author's perspective in
an advertisement
Identifies directly stated information
an advertisement
Identifies the significance of an event
in an information text
Interprets directly stated information
in an information text
Analyses information to make an
inference in an information text
Identifies evaluative language to
match a theme in an advertisement
Interprets directly stated information
in a persuasive discussion
Interprets vocabulary that contributes
to the tone of an advertisement
Identifies the purpose of a sub-
heading in an information text
Infers the reason for an outcome in
an information text
Interprets directly stated information
in an information text
Identifies a difference between an
information text and a persuasive
text
Interprets directly stated information
in a narrative
Identifies the purpose of the text
layout in an advertisement
Locates directly stated details in an
information text
Locates directly stated information in
a narrative
Evaluates a character trait from
behaviour in a narrative
Reading Eggs
Reading Eggs-press

Identifies contrasted information in a
persuasive discussion
Interprets the meaning of figurative
language in an information text
Identifies the purpose of a paragraph
in a narrative
Locates directly stated information in
a narrative
Identifies the main idea of a
persuasive discussion
Identifies the main purpose of a
personal letter
Interprets a pronoun reference in a
persuasive discussion
Identifies the purpose of a diagram in
an information text
Interprets a diagram in an
information text
Interprets directly stated information
in an information text
Links directly stated information
across paragraphs in a personal
letter
Identifies the author's intent in a
persuasive discussion
Identifies the author's perspective at
the end of a persuasive discussion
Identifies the purpose of descriptive
language in a personal letter
Interprets directly stated information
in a personal letter
Identifies the setting for a narrative
Assessment Tools
NAPLAN data sets, SCSA resources , PM Benchmarks for Years 1 to 2, Probe Reading Assessment, On-entry assessments for PP, Kindergarten Phonological Awareness Assessment, Like school data comparisons, First Steps Maps of Development, Literacy Net, EAL/EAD Progress Maps, Anecdotal comments, Observations, Checklists, Profiles, Portfolios, Records of test results ,Audio & visual recordings, Marking keys and Documented Plans.
Year 5 Writing
Identified cohort areas to be addressed in whole class learning experiences:
1. Paragraphing
2. Sentence structure

3. Text structure.
Case Management Plan
Band Target Group Focus Resource
7 8
Extension
Group
Sustained and consistent use of
precise words and word groups
that enhance meaning - cat 4
Vocabulary. [Vocabulary]
Ideas are substantial and
elaborated and contribute
effectively to the central storyline -
cat 4 Ideas. [Ideas]
Most simple, compound and
complex sentences are correct OR
all sentences correct but does not
demonstrate variety - cat 4
Sentence Structure. [Sentence
Structure]
Cohesive devices and referring
words are used correctly. Meaning
is clear and text flows well in a
sustained piece of writing - cat 3
Cohesion. [Cohesion]
Supports reader understanding and
begins to engage the reader
through language choices and
narrative devices - cat 4 Audience.
[Audience]
Uses some devices that persuade
but use is not sustained - cat 3
Persuasive Devices. [Persuasive
Devices]
Text contains an orientation,
complication and resolution - cat 3
Text Structure. [Text Structure]
First Steps Writing Map of
Development
First Steps Writing Resource
Book
First Steps Linking Assessment,
Teaching and Learning
Spelling Waves
Talk 4 Writing
4 5 Main Group Most simple and compound
sentences are correct. Some
complex sentences are correct -
cat 3 Sentence Structure.
[Sentence Structure]
Ideas relate coherently and show
some development or elaboration -
cat 3 Ideas. [Ideas]
Orients the reader by writing an
internally consistent story with
First Steps Writing Map of
Development
First Steps Writing Resource
Book
First Steps Linking Assessment,
Teaching and Learning
Spelling Waves

sufficient information to support the
reader - cat 3 Audience. [Audience]
Uses three or more instances of
persuasive devices that support the
writer's position - cat 2 Persuasive
Devices. [Persuasive Devices]
Text contains a beginning and a
complication - cat 2 Text Structure.
[Text Structure]
Correct spelling of most simple
words and common words - cat 3
Spelling. [Spelling]
3 4 Students At
Educational
Risk
Text contains a beginning and a
complication - cat 2 Text Structure.
[Text Structure]
Correct spelling of most simple
words and common words - cat 3
Spelling. [Spelling]
Writing is organised into
paragraphs that are mainly focused
on one idea or set of like ideas -
cat 1 Paragraphing. [Paragraphing]
Some accurately punctuated
sentences (beginning and end) OR
one correctly punctuated sentence
and some other punctuation used
correctly - cat 2 Punctuation.
[Punctuation]
Some correct links between
sentences. Most referring words
are correct. Reader may need to
re-read to clarify meaning - cat 2
Cohesion. [Cohesion]
Correct sentences are mostly
simple and/or compound
sentences - cat 2 Sentence
Structure. [Sentence Structure]
One idea with simple elaboration
OR few, related but unelaborated
ideas OR many simple, related but
unelaborated ideas - cat 2 Ideas.
[Ideas]
Shows basic awareness of
audience by attempting to orient
the reader by providing some
First Steps Writing Map of
Development
First Steps Writing Resource
Book
First Steps Linking Assessment,
Teaching and Learning
Spelling Waves

information - cat 2 Audience.
[Audience]
Assessment Tools
NAPLAN data sets, SCSA resources , PM Benchmarks for Years 1 to 2,On-entry assessments for PP, Kindergarten Phonological Awareness Assessment, Like school data comparisons, First Steps Maps of Development, Literacy Net, EAL/EAD Progress Maps, Anecdotal comments, Observations, Checklists, Profiles, Portfolios, Records of test results ,Audio & visual recordings, Marking keys and Documented Plans.
Actions for Improvement Use of school-based leaders to facilitate the implementation of whole-school approaches to literacy that include: improvement targets for NAPLAN results; a focus on the teaching of essential literacy skills; and a case-management approach for students at risk of falling below national minimum standards and for students in the middle to upper proficiency bands. KP1 Focus on on-entry assessment data to guide planning. Phase of Learning Team Leaders to assist to build the capacity of the school to improve literacy through modelling, mentoring and coaching. Provide teachers with time to develop case-management plans, collaboratively plan, moderate, reflect and review. Teachers will assist colleagues by: modelling a range of effective strategies for explicit instruction of reading and writing to teachers (First Steps focus) through a structured professional learning program, assisting teachers to teach, assess and monitor reading development using the range of tools promoted by the school, through one-to-one meetings and modelling evidence-based strategies. We will continue to develop a whole school approach to learning and teaching literacy that is founded on sequences of content and instructional practices, including First Steps – Guided Reading, that are consistent within and across phases of schooling; utilise formative assessment related to diagnostic maps of progress as an integral part of the learning, teaching and assessment cycle; effectively translate assessment information into focused instruction; develop case-management plans for identified students detailing learning and teaching strategies and achievement targets; map and implement the revised Western Australian Curriculum for all learning areas. The level of fine gained analysis and follow up are clearly articulated in the school’s response to 2018 NAPLAN results as set out in our whole school, group and individual Case Management Plans (see above). Using band attainment and progression modelling for individual students we have set the following operational targets for 2019: Year 3 Reading 8% or more of students achieve in band 7 or above level of achievement. 24% or more of students achieve in band 5 or above level of achievement. 57% or more of students achieve in band 3 or above level of achievement. 12% or less of students achieve in band 1/2 level of achievement. Year 3 Writing 4% or more of students achieve in band 6 or above level of achievement. 27% or more of students achieve in band 5 or above level of achievement. 57% or more of students achieve in band 3 or above level of achievement. 12% or less of students achieve in band 1/2 level of achievement. Year 3 Mathematics 10% or more of students achieve in band 6 or above level of achievement. 14% or more of students achieve in band 5 or above level of achievement. 65% or more of students achieve in band 3 or above level of achievement. 12% or less of students achieve in band 1/2 level of achievement.

Year 5 Reading 4% or more of students achieve in band 8 or above level of achievement. 35% or more of students achieve in band 7 or above level of achievement. 44% or more of students achieve in band 5 or above level of achievement. 15% or less of students achieve in band 1/2/3/4 level of achievement. Year 5 Writing 7% or more of students achieve in band 8 or above level of achievement. 24% or more of students achieve in band 7 or above level of achievement. 49% or more of students achieve in band 5 or above level of achievement. 20% or less of students achieve in band 1/2/3/4 level of achievement. Year 5 Mathematics 4% or more of students achieve in band 8 or above level of achievement. 27% or more of students achieve in band 7 or above level of achievement. 56% or more of students achieve in band 5 or above level of achievement. 13% or less of students achieve in band 1/2/3/4 level of achievement.
Attendance

Satisfaction Rates
Parents

Students

Staff
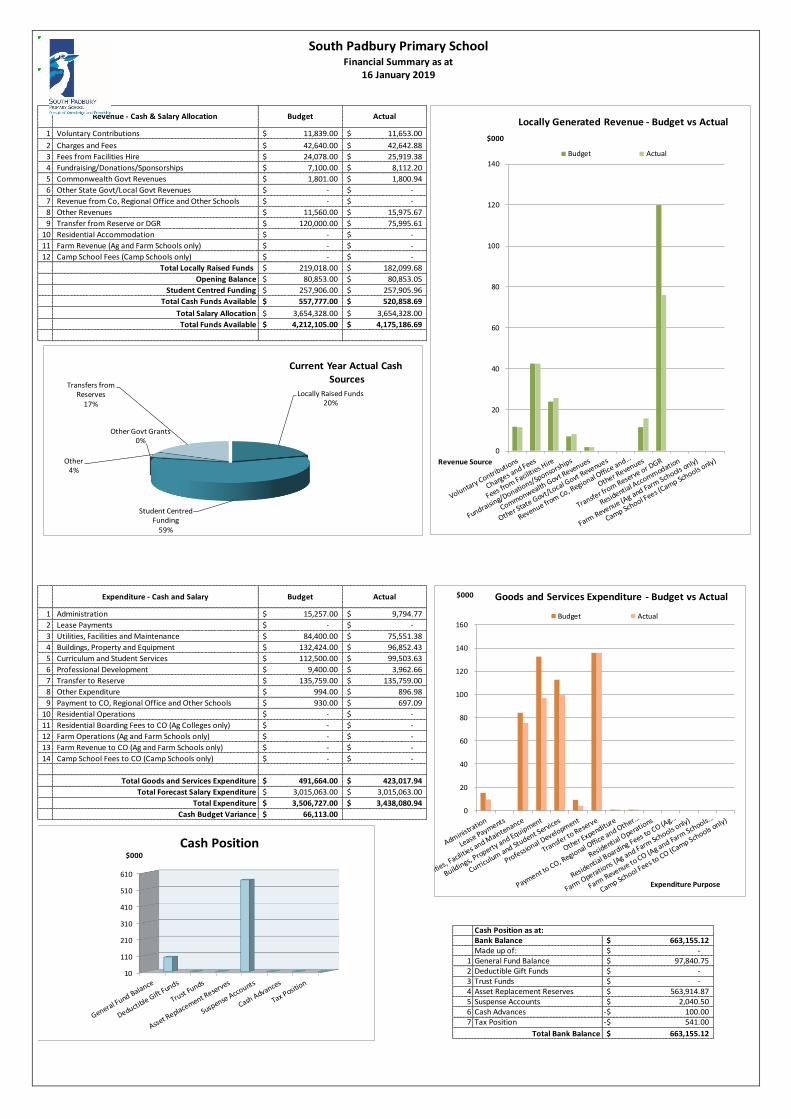
1 11,839.00$ 11,653.00$
2 42,640.00$ 42,642.88$
3 24,078.00$ 25,919.38$
4 7,100.00$ 8,112.20$
5 1,801.00$ 1,800.94$
6 -$ -$
7 -$ -$
8 11,560.00$ 15,975.67$
9 120,000.00$ 75,995.61$
10 -$ -$
11 Farm Revenue (Ag and Farm Schools only) -$ -$
12 -$ -$
219,018.00$ 182,099.68$
80,853.00$ 80,853.05$
Student Centred Funding 257,906.00$ 257,905.96$
557,777.00$ 520,858.69$
3,654,328.00$ 3,654,328.00$
4,212,105.00$ 4,175,186.69$
Locally Raised Funds88,327.46$
Student Centred Funding257,905.96$
Other Govt Grants1,800.94$
Other 15,975.67$
Transfers from Reserves75,995.61$
440,005.64$
1 15,257.00$ 9,794.77$
2 -$ -$
3 84,400.00$ 75,551.38$
4 132,424.00$ 96,852.43$
5 112,500.00$ 99,503.63$
6 9,400.00$ 3,962.66$
7 135,759.00$ 135,759.00$
8 994.00$ 896.98$
9 930.00$ 697.09$
10 -$ -$
11 -$ -$
12 Farm Operations (Ag and Farm Schools only) -$ -$
13 Farm Revenue to CO (Ag and Farm Schools only) -$ -$
14 Camp School Fees to CO (Camp Schools only) -$ -$
491,664.00$ 423,017.94$
3,015,063.00$ 3,015,063.00$
3,506,727.00$ 3,438,080.94$
66,113.00$
Bank Balance 663,155.12$ Made up of: -$
1 General Fund Balance 97,840.75$ 2 Deductible Gift Funds -$ 3 Trust Funds -$ 4 Asset Replacement Reserves 563,914.87$ 5 Suspense Accounts 2,040.50$ 6 Cash Advances 100.00-$ 7 Tax Position 541.00-$
663,155.12$ Total Bank Balance
Cash Position as at:
Residential Boarding Fees to CO (Ag Colleges only)
Cash Budget Variance
Total Forecast Salary Expenditure
Total Expenditure
Total Goods and Services Expenditure
Other Expenditure
Buildings, Property and Equipment
Curriculum and Student Services
Total Salary Allocation
Total Funds Available
ActualBudget
Residential Operations
Total Locally Raised Funds
Fundraising/Donations/Sponsorships
Opening Balance
Total Cash Funds Available
Camp School Fees (Camp Schools only)
Expenditure - Cash and Salary
Payment to CO, Regional Office and Other Schools
Administration
Lease Payments
Utilities, Facilities and Maintenance
Professional Development
Transfer to Reserve
Transfer from Reserve or DGR
Residential Accommodation
Other State Govt/Local Govt Revenues
Revenue from Co, Regional Office and Other Schools
South Padbury Primary SchoolFinancial Summary as at
Actual
16 January 2019
Other Revenues
Commonwealth Govt Revenues
BudgetRevenue - Cash & Salary Allocation
Voluntary Contributions
Charges and Fees
Fees from Facilities Hire
0
20
40
60
80
100
120
140
$000
Revenue Source
Locally Generated Revenue - Budget vs Actual
Budget Actual
Locally Raised Funds20%
Student Centred Funding
59%
Other Govt Grants0%
Other 4%
Transfers from Reserves
17%
Current Year Actual Cash
Sources
0
20
40
60
80
100
120
140
160
$000
Expenditure Purpose
Goods and Services Expenditure - Budget vs Actual
Budget Actual
10
110
210
310
410
510
610
$000
Cash Position
IPS Report
During 2018 SPPS underwent our 3-year IPS Review. The review team’s summary is;
South Padbury Primary School has a friendly and professional atmosphere. The school has very strong community support as indicated by Parents and Citizens’ Association attendance and activity and parent engagement in a wide range of formal and informal school activities. Staff and parent involvement in extracurricular programs demonstrates their commitment to the implementation of a well-rounded education. The culture of the school is characterised by positive and supportive professional relationships, a commitment to a collaborative approach to planning, evidence-based decision-making around teaching and learning, and attention to the social, emotional and academic needs of all students. The current leadership team has led an impressive school improvement agenda which has included consolidating whole-of-school approaches to literacy and numeracy, high levels of staff collaboration in planning programs, and detailed attention to student performance data to inform planning to meet the needs of every student and a differentiated curriculum. Staff commitment to whole-of-school approaches is high, contributing to improved academic performance and student behaviour. The leadership team members are active instructional leaders playing lead roles in curriculum, pedagogy and
pastoral care. Systems are now well established. Developing a more distributed leadership model in the future
would enhance the sustainability of the school improvement program.
Principal’s Report
The 2018 academic year was an extremely productive, successful and rewarding experience for the school community. In reviewing 2018 it is important to view the year within the holistic context of being the beginning of our 3 - year Business Plan 2018-2020. Embedded into the strategic plan are a series of performance indicators which include;
Test data Attendance data Resources Finances Student engagement Community engagement and Staff and Parent/carer satisfaction rates.
After the first year of the implementation of the plan, I am pleased to report to the school community that every single performance indicator has been achieved at a satisfactory level and these accomplishments have been articulated in this report. Operating within the broad parameters of a Department of Education school, we are cognisant of the fact that the educational landscape is constantly changing. Educational fads come and go, but our vision and practice is crystal clear. We focus on;
Whole of school, evidence based strategies in the teaching of Literacy and Numeracy Using valid and meaningful data to drive curriculum planning and delivery Strong school leadership with an emphasis on instructional leadership and a developed distributed
leadership model Strong and meaningful school/home/community links.
I believe that it is this level of focus that has seen the school’s extraordinary transformation over the past 5 years. Our staff are unified, committed to whole of school practices and committed to the welfare of our students. With such high calibre staff, outstanding resourcing and a committed and enthusiastic school community, we are in the position to improve even more and continue striving for excellence. I also thank and commend the exemplary financial management skills of the school’s Manager Corporate Services Mrs Elaine Hill, a supportive and proactive parental body via the School Board and P&C and a highly motivated, autonomous and skilled staff. Given the strong foundations that we’ve laid and our strong present standing, we are in an outstanding position to face and conquer the challenges that lie ahead. David Knox PRINCIPAL March 2019