south florida water management model (sfwmm, or 2x2 model
TRANSCRIPT

South Florida Water Management Model(SFWMM, or 2x2 Model):
Features and Issues
SFNRC - NPS/ENP
March 12, 2004
by
Samuel Lee, Ph.D. Hosung Ahn, Ph.D.
(Acknowledge: This presentation stuff was original prepared by Ken Tarboton, SFWMD)

Outline
Background & Key Model
Features
Application & Performance
Measures
Sensitivity/Uncertainty
Strengths, Weaknesses
Documentation

SFWMM
•Regional scale, area specific
•Finite Difference Scheme
•Distributed
•Continuous simulation
•Surface water/groundwater
•Lake Okeechobee to Florida Bay
•2x2 miles grid cells
•( > 7000 square miles)
•Time step: 1-day
•36-year simulation (1965-2000)
•Huge and extremely complicate:
(37 in-, 57 out-, 156 code files)

1980 1990 2000
1991 : NEW TOPO, LANDUSE, REVISED ET ALGORITHM, LEVEE SEEPAGE, URBAN NEEDS QUANTIFIED; CALIBRATION (83-86); VALIDATION (87-89)
1997 : SunOS TO SolarisOS; ADDITIONAL 5 YRS SIM (65-95) ; RECALIBRATION (79-95)
1994-1996 : APPLIED TO LEC REGIONAL WATER SUPPLY PLAN; UNIX SOURCE CODE CONTROL SYSTEM
1996-1998 : APPLIED TO C&SF PROJECT COMPREHENSIVE REVIEW (“RESTUDY”)
1992 - 1993 : ADDED SUPPLY-SIDE MANAGEMENT ALGORITHM & OTHER MAJOR FUNCTIONAL CHANGES
2000 : APPLIED TO SOUTHERN EVERGLADES PROJECTS (ISOP, IOP)
1993 : ADD’L YR SIM (65-90); RECALIBRATION (79-90)1985-1989 : APPLIED TO
USACE GDMs, WEST DADE WELLFIELD EVALUATION, WMA ANALYSIS
1999 --> : V3.5 Doc., APPLIED TO ECP ; POSITION ANALYSIS MODE ESTABLISHED
--> 1984 : INITIAL MODEL DEVELOPMENT
1990 : PORT FROM CYBER TO UNIX; ADDITIONAL 5 YRS SIM (65-89)
1984: FIRST DOCUMENTATIONRELEASED (TP-84-3); 14 YRS SIM (69-82)
1985 : ADDITIONAL 6 YRS SIM (65-84)
Evolution of SFWMM
2003 :
v5.0 (65-00) release
14 20 26 31 36

General Conceptual Hydrologic Processes
OVERLAND FLOW
CANAL FLOW
GROUNDWATERFLOW
INFILTRATION
PERCOLATION
RAINFALL
ET Rainfall
Evapotranspiration
Infiltration & Percolation
Canal Flow
Overland Flow
Groundwater Flow
SFWMM Features

SW-GW Interaction in SFWMM
SURFACE STORAGE(PONDING)
UNSATURATEDZONE STORAGE
SATURATED ZONESTORAGE
CANAL/LAKESTORAGE
PUMPAGE
PERC
ETP
ETU
ETS
SU
RFA
CE
SU
BS
UR
FA
CE
LE
VE
E S
EE
PA
GE
CA
NA
L L
EA
KA
NC
E
ST
RU
CT
UR
ED
ISC
HA
RG
E
ET
GWSTOCH
RF ET
GROUNDWATERFLOW
NIRRSUP
UZSTOCH
CWSTOCH
OVERLANDFLOW
RUNOFF/OVERBANK FLOW
RF
SWSTOCH
INFILT

Simulate C&SF System
$Z$Z
$Z
$Z
$Z
$Z$Z
$Z
$Z
$Z$Z$Z
$Z
$Z $Z
$Z
$Z
$Z$Z
$Z
$Z$Z$Z$Z$Z
$Z $Z$Z
$Z $Z$Z$Z
$Z$Z
$Z
$Z$Z$Z$Z
$Z$Z$Z$Z$Z
$Z$Z$Z
$Z
$Z
$Z
$Z$Z
$Z
$Z$Z
$Z$Z
$Z$Z
$Z$Z
$Z$Z$Z$Z
$Z
$Z
$Z
$Z
$Z
$Z
$Z
$Z
$Z$Z
$Z
$Z
$Z
$Z
$Z
$Z$Z
$Z$Z$Z$Z$Z$Z
$Z$Z$Z
$Z
$Z$Z$Z$Z$Z
$Z$Z$Z$Z$Z
$Z
$Z
$Z$Z$Z$Z
$Z
$Z
$Z$Z$Z
$Z
$Z
$Z$Z$Z
$Z$Z$Z$Z
$Z
$Z
$Z
$Z$Z
$Z
$Z
$Z
$Z$Z
$Z
$Z
$Z$Z$Z
$Z $Z$Z$Z$Z$Z$Z
$Z$Z$Z
$Z
$Z
$Z
$Z
$Z$Z
$Z
$Z$Z$Z$Z$Z $Z
$Z $Z
$Z
$Z
$Z $Z
$Z$Z$Z$Z$Z
$Z$Z $Z$Z
$Z$Z$Z
$Z$Z$Z
$Z
$Z$Z
$Z
$Z
$Z$Z$Z$Z $Z
$Z$Z$Z
$Z$Z
$Z$Z$Z$Z$Z$Z
$Z$Z
$Z
$Z$Z$Z
$Z$Z
$Z
$Z
$Z$Z$Z$Z$Z
$Z
$Z
$Z
$Z$Z
$Z
$Z
$Z
$Z
$Z
$Z$Z$Z$Z
$Z
$Z$Z$Z
$Z$Z$Z$Z$Z $Z$Z
$Z
$Z$Z
$Z
$Z$Z
$Z$Z
$Z$Z$Z$Z
$Z
$Z$Z$Z $Z$Z
$Z$Z
$Z $Z
$Z$Z$Z
$Z
$Z
$Z$Z
$Z$Z$Z$Z
$Z
$Z$Z$Z$Z
$Z$Z
$Z
$Z
$Z$Z
$Z$Z$Z$Z$Z Includes:
Canals, water control structures,
pump stations (232)
Reservoirs, impoundments,
stormwater treatment areas

Unique SFWMM Features
Modified Delta Storage
Trigger
Levee Seepage
Small Reservoir
ASR
EAA Rule/BMP rule
Rainfall Driven Plan
Supply-side Management
WSE

Water Supply & Environment (WSE)
New & improved Lake Okeechobee regulation schedule
Authorized in July 2000
Improves performance and better balances competing lake management objectives
Not a schedule for water supply deliveries
Still a flood release schedule

Current WSE Schedule

WSE Operational Schedule


Aquifer Storage & Recovery
333 wells - $1.6 billion
~1000 ft deep
Assume uniform recovery rate - 70%
No flow routing
Investigate only regional water budget impacts
Need a transient dansity-dependent simul.

Input Data for SFWMM
Static Data & Parameterstopography, landuse, aquifercharacteristics, location andattributes of canals, levees,structures and reservoirs
Time Dependent Datadaily rainfall, daily reference ET,well pumpages, initial/boundary flows and stages
Operations-Related Rules & Policies (logical algorithms, parameters, values)
regulation schedules, water restrictiontrigger levels, water delivery targetsand canal maintenance levels

Topography and Transmissivity

############ #
# ##
########## ## #### ###
##### ## # ############ # #################### # # #### ####### # ## ## # ####### ## ## ####
#### ## ## # ####### ### ### ## ## ########## ### ## #### #### ##### # ## # ####### ### ##### ## #### ### ###### ## ### ## ### ########## ### ### # ## ## ### #### # #### ##
###### #### ## ### ## ###
#########
######## ### ### ##### ## ### ##
# ### #
###### ### ##
# ##### #### ## ## ####### ### #
### ### ##
# ### ######## ##
######## ####
########### ######
#### ## #
##### ## # ##### ##### # #### ###
###### ########## ### ### #
## #### ##
# ###
#
##
##
A sub cell
SFWMM grid cell
TIN
Rainfall
•Approx 900 stations
•TIN-10 method

Potential Evapotranspiration
Uses Abtew 1991, simple function of solar radiation
Rs - estimated from daily Tmax, Tmin at 17 stations
TIN interpolation between stations
Average Annual
1965-2000
PET

ET Estimates by German (2000)
0
10
20
30
40
50
60
ET (in/yr)
1 2 3 4 5 6 7 8 9
Site

Land Cover
• 25 Land cover classes
From latest data• FLUCCS (1995)• LEC 2000 areal photography• Richardson et. al., 1990 for
LNWR• Richardson & Vilchek, 1994 for
WCA-2A, WCA-3B, Northern WCA-3A
• Welch et.al., 1995 for ENP & BCNP
• IFAS, 2001 for South Dade Ag areas.
Used to estimate ET, overland flow,
and water use

#Y
#Y#Y#Y#Y
#Y #Y
#Y
#Y
#Y
#Y#Y
#Y
#Y
#Y#Y
#Y#Y
#Y
#Y
#Y#Y
#Y#Y
#Y#Y
#Y#Y
#Y
Wellfield and Trigger locations
4
2
8
96
83
91
12
11
94
12
34
410
164
565
572
216
246
522
403
625
232
374
232
339
139
511 163
180
361
198
396989
171
110
666
334
833
292
109
948
865
294
333
492
529399 926
933
345
605
109
643
503
974
1016
2719
1247
2004
4615
3794
1083
2651 1233
1513
81843735
3241
1690
3698
2241
3126
8920
2600
3207
5668
7142
2045 4135
1140
2608
2197
17932772
1369
1306
5697
149745651956
5688
4777
6168
1092
6204
1164
6228
2803
2055
4110
2140
2330
6732
2378
7068
8146
1767
3267
1036
2514
1131
10541
38774
24659
15878
22417
2000B1 Annual Public Water Supply Pumpage
0 5 10 15Miles
!
Pumpage (Average
Million Gallons Per Year)
2.07 - 100.00
100.01 - 300.00
300.01 - 500.00
500.01 - 800.00
800.01 - 1500.00
1500.01 - 3000.00
3000.01 - 5000.00
5000.01 - 9000.00
9000.01 - 18000.00
> 18000.00
Lake
Okeechobee
West Palm Beach
Boca Raton
Fort Lauderdale
Miami
60
55
50
45
40
35
30
25
20
15
10
25 30 35
CREATED: 20JUN2003

Water Shortage Restrictions

SFWMM v5.0 Calibration/Verification
Calibration: 1984-19901991-1995
Verification:1981-19831996-2000

Calibration &Verification
Example

Application of SFWMM
Position analysis for hydro-structure operation
ISOP, IOP, Lakebelts simulation
Lake Okeechobee recession analysis (2000).
2000-2001 water shortage analysis.
OPERATIONAL PLANNING TOOL:
PLANNING TOOL: Lower East Coast Water Supply Plan
Restudy & CERP
Everglades Construction Project

Output
Canal Stages
Structure Discharges
flood control / water supply
urban / agricultural / environmental
Grid Cell Output
water level or stages
evapotranspiration
groundwater flow & Seepage
overland flow

Alternatives Evaluated using Performance Measures
Point
stage hydrographs, discharges, frequency distributions
Line
Overland or groundwater flow across transects, water budgets
Spatial
Maps - ponding, hydroperiods, peak stages, difference maps

Hydrologic Performance Measures
http://modeling.cerpzone.org/cerp_recover/pmviewer/pmviewer.jsp

SFWMM Sensitivity
Water levels in urban areas are most sensitive to coastal PET.
Water levels in WCAs and ENP are sensitive to wetland PET.
Water levels in ENP are also sensitive to roughness coefficient
WCA levels are also sensitive to hydraulic conductivity and levee seepage
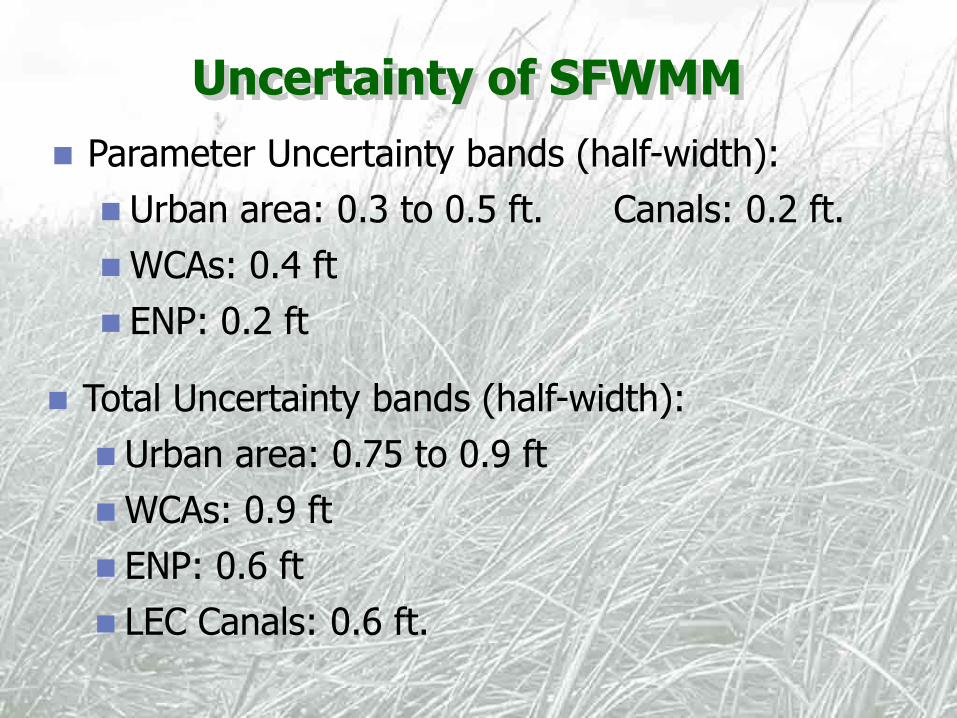
Uncertainty of SFWMM
Parameter Uncertainty bands (half-width):
Urban area: 0.3 to 0.5 ft. Canals: 0.2 ft.
WCAs: 0.4 ft
ENP: 0.2 ft
Total Uncertainty bands (half-width):
Urban area: 0.75 to 0.9 ft
WCAs: 0.9 ft
ENP: 0.6 ft
LEC Canals: 0.6 ft.

Documentation & Review
Fact Sheet. (SFWMM Input Man pages – iweb only)
2002. SFWMM Training Presentations
SFWMM Review Comments and Response to MRT
2002. SFWMM v5.0. Memos, preliminary calib/verif, source code. For review by Interagnecy Modely Refinement Team.
2001-2002. SFWMM 2000 update. Several memos.
2001. SFWMM Enhancements v3.7 to v4.4. Santee memo.
1999. Changes in Assumptions v3.5 - v3.7. Santee memo.
1999. A primer to the South Florida Water Management Model (Version 3.5). SFWMD
1998. A Review of the Documentation of the South Florida Water Management Model (SFWMM) by Loucks et al.
1997. V2.10 Draft documentation
http://www.sfwmd.gov/org/pld/hsm/models/sfwmm/index.html
Strengths
Suitable for South Florida hydrologic conditions (flat terrain, high water depth, high transmissivity)
Comprehensive tool where hydrologic impacts on agriculture-environment-urban areas can be jointly evaluated by properly post-processing model output
Can provide guidance as to where future data collection and additional modeling efforts should proceed
Can be used in evaluating long-, as well as short-term effects of management decisions

Weaknesses
Applicable to South Florida only
Scale is too coarse for studies/investigations that require finer detail
Local hydrologic response, e.g. drawdowns cannot be simulated adequately
Problems in simulating the south ENP ara due to the lack of data and inaccurate boundary conditions
Steep learning curve to run model
not enough to learn basic hydrology; have to know the management of the system, few docu.

Summary
SFWMM is the regional integrated surface
water/groundwater model for South Florida.
Model has been extensively used in:
performing short-term & long-term water
resources planning,
providing input to high resolution groundwater,
ecology, and water quality models.
“The best available tool to address regional water
management issues in South Florida.”

Questions ?
The End