south dakota office of tourism - south dakota visitor · pdf file2 survey methodology a total...
TRANSCRIPT

South Dakota Office of Tourism
2005 Intercept Study Final Report
1
TABLE OF CONTENTS Survey Methodology............................................................................................................2 Executive Summary .............................................................................................................3 Traveler Summary ...............................................................................................................4 Origin of Travelers...............................................................................................................6 Vacation Destinations ..........................................................................................................7 Traveler Connections to South Dakota ...............................................................................9 Length of Vacation ............................................................................................................10 Description of Travel Party ...............................................................................................13 Travel Plans to South Dakota ............................................................................................15 Travel Information .............................................................................................................19 Spending ............................................................................................................................24
2
SURVEY METHODOLOGY A total of 1,127 travelers completed written surveys distributed at 13 different Interstate Information Centers in South Dakota, July 10-19, 2005. The study includes 519 surveys from travelers residing within the Office of Tourism’s peak season target market area (Colorado, Illinois, Iowa, Manitoba, Minnesota, Missouri, Nebraska, North Dakota, Saskatchewan, Texas and Wisconsin). Surveys were distributed at random by the travel counselors at the Information Centers. Each participant was given a postage-paid envelope addressed to South Dakota Tourism in which to return the survey. Participants returning completed surveys by July 25, 2005, were entered into a drawing to receive a South Dakota gift package valued at $100. South Dakotans were not interviewed for this study. Interviews were conducted at:
Date Location July 10-19, 2005 Lewis and Clark Information Center near
Chamberlain New Effington Information Center Salem Information Center (East) Salem Information Center (West) Spearfish Information Center Tilford Information Center (East) Tilford Information Center (West) Valley Springs Information Center Vermillion Information Center Vivian Information Center Wasta Information Center (East) Wasta Information Center (West) Wilmot Information Center
Please note: Percentages were carried out only to one-tenth and some questions allowed multiple answers. Therefore, total percentages may not equal 100 percent. This document makes comparisons to the 2004 Intercept Study, which was conducted May 27- Aug. 3, 2004. That study was based on personal interviews with travelers at attractions and events. The interview sites included: Redlin Art Center, Watertown (May 27-39); Siouxland Renaissance Festival, Sioux Falls (June 5-6); Wild Bill Hickok Days, Deadwood (June 18-20); World’s Only Corn Palace, Mitchell (June 23-24); Mount Rushmore National Memorial (June 27-29); Lewis and Clark Information Center, near Chamberlain (July 5-6 and Aug 2-3); State Capitol, Pierre (July 16-18); and the Laura Ingalls Wilder Pageant, De Smet (July 23-24). A total of 880 travelers were interviewed for the 2004 study. Random interviews were conducted with 440 travelers from within South Dakota Tourism’s target market area (Colorado, Illinois, Iowa, Minnesota, Missouri, Nebraska, North Dakota, Texas and Wisconsin) and 440 travelers from outside the target market area. South Dakotans were not interviewed for this study.

3
EXECUTIVE SUMMARY • Origin of travelers, in-target: In 2005, Minnesota produced the greatest number of
respondents with 23 percent. Sixteen percent of the respondents were from Wisconsin, 13 percent from Iowa and 12 percent from Illinois. The biggest increases in respondents were from Missouri and Wisconsin, both showing 3 percentage points growth.
• Origin of travelers, out-of-target: California, Florida and Michigan* each produced 8
percent of the respondents. States showing the greatest gain for survey respondents included Kansas, Michigan and Washington, each with a 3 percentage point increase over 2004. Florida, Indiana and Ohio each showed gains of 1 percentage point.
*Although peak season marketing was targeted to Michigan in 2005, the state remains in the out-of-target category to provide comparisons to the 2004 intercept data.
• Vacation destination, in-target: More than half of the respondents, 53.4 percent, named South Dakota as their final vacation destination, a significant decrease from 2004 when 75 percent of the respondents named South Dakota as their destination. In 2005, Rapid City (22 percent), the Black Hills (10.9 percent) and Mount Rushmore (7 percent) were the most frequently mentioned South Dakota destinations. In 2004, the Black Hills (15.2 percent), Sioux Falls (14.5 percent) and Rapid City (13.9 percent) were the top three South Dakota destinations. The incidence of Sioux Falls ranking high as a final destination in 2004 is not surprising; the Siouxland Renaissance Festival in Sioux Falls was a data collection point.
• Vacation destination, out-of-target: About a third (31.4 percent) of this group listed South
Dakota as their final vacation destination. Similar to the in-target response, this rate was lower than that recorded by out-of-target respondents in the 2004 study when 43.6 percent said South Dakota was their final destination. Similar to the 2005 in-target response, the top three South Dakota destinations for this group were Rapid City (21.7 percent), Mount Rushmore (13.7 percent) and the Black Hills (10.6 percent). Those destinations were similar to 2004 when those respondents named Mount Rushmore (24 percent), the Black Hills (18.2 percent) and Rapid City (16.1 percent) as their top South Dakota destinations.
• Destinations other than South Dakota, in-target: West was the direction respondents who
were not staying in South Dakota were headed in 2005. Montana (12.5 percent), Yellowstone National Park (10.8 percent) and Wyoming (10.8 percent) were the most frequently mentioned destinations. In 2004, Wyoming/Yellowstone (21.8 percent) and Montana (19.1 percent) were joined by North Dakota (10.9 percent) to make the top three non-South Dakota destinations.
• Destinations other than South Dakota, out-of-target: South Dakota was a stop on a multi-
state itinerary for many out-of-target travelers. A non-specific cross country trip was listed as the top destination in both 2005 (10.1 percent) and 2004 (16.9 percent). As with the in-target respondents, Montana (8.6 percent) and Wyoming (8.1 percent) were among the top three destinations in 2005. Wyoming/Yellowstone was the second most popular destination in 2004 (16.5 percent). The influence of the Lewis and Clark Expedition commemoration was evident in 2004, when 6.9 percent named the trail as their destination. Among the in-target respondents, 2.7 percent stated they were following the Lewis and Clark Trail in 2004.

4
• Timing of travel plans: Most of the respondents, both in- and out-of-target, made their decision during the spring or summer to visit South Dakota. In 2005, 43.7 percent of the respondents named July as the month they made their decision to travel to South Dakota. In 2004, 39 percent of the respondents said they made their decision to travel to South Dakota in June. These responses indicate that a number of respondents made their decision to visit South Dakota very close to or in the same month as their travel. That is, the 2005 survey was conducted in July, the most-often named month. In 2004, more than half of the survey was conducted in June, the most-often mentioned month that year. Also, in 2004, the survey was conducted at two events held in June, which may have influenced the outcome of this question.
TRAVELER SUMMARY
Profile of In-Target Traveler, 2005 Profile of In-Target Traveler, 2004 • 3.1 people in travel party • 3.6 people in travel party • Average age of adult traveler was 53.5
years. Travelers over age 19 outnumbered child travelers by 4.1 to 1.
• Average age of adult traveler was 53 years. Travelers over age 19 outnumbered child travelers by 3.9 to 1.
• Took a 7.7-day vacation • Took a 7.1-day vacation • Spent an average of 4.2 days in South
Dakota • Spent an average of 4 days in South
Dakota • Last time here was about 5.6 years ago. • Last time here was about 5 years ago. • Spent $170.69 per day, per travel party on
South Dakota portion of vacation • Spent $170.94 per day, per travel party on
entire vacation • Destination was South Dakota (53.4%) • Destination was South Dakota (75%)

5
Profile of Out-of-Target Traveler, 2005 Profile of Out-of-Target Traveler, 2004 • 2.7 people in travel party • 3.7 people in travel party • Average age of adult traveler was 56.6
years. Travelers over age 19 outnumbered child travelers by 5.2 to 1.
• Average age of adult traveler was 58.1 years. Travelers over age 19 outnumbered child travelers by 5.6 to 1.
• Took a 10.5-vacation • Took a 12.7-day vacation • Spent an average of 4.3 days in South
Dakota • Spent an average of 4.5 days in South
Dakota • Approximately 60.5% had been to South
Dakota before. • More than half (55.5%) had been to
South Dakota before. • Last time here was about 6.8 years ago • Last time here was about 6.9 years ago • Spent $166.36 per day, per travel party
on South Dakota portion of vacation • Spent $179.01 per day, per travel party
on entire vacation • South Dakota was the final destination
for 31.4 percent of the respondents. The top non-South Dakota destinations were a cross-country trip, Montana or Wyoming.
• South Dakota was the final destination for 43.6 percent of the respondents. The top non-South Dakota destinations were Wyoming, Montana or North Dakota.

6
ORIGIN OF TRAVELERS, 2005 A Comparison of In-Target Travelers by percentage: 2005 vs. 2004
A Comparison of Out-of-Target Travelers by percentage: 2005 vs. 2004
• The out-of-target origins specified above comprise 59.9 percent of all out-of-target travelers
surveyed in 2005. Not shown on the graph are North Carolina, Oregon and Wyoming, which together made up 9.7 percent of the out-of-state target respondents for 2005. The remaining 30.4 percent included 26 states and nine foreign countries
6
13 12
23
96
85
16
8
1411
24
68
106
13
0
5
10
15
20
25
30
CO IA IL MN MO ND NE TX WI
20052004
8 8
65
87
5
76
10
7
5
2
56
54
5
0
2
4
6
8
10
12
CA FL IN KS MI OH PA WA Canada
20052004

7
• DESTINATION Vacation Destination In-Target Out-of-Target 2005
Percent 2004
Percent 2005
Percent 2004
Percent South Dakota 53.4 75 31.4 43.6 Other 46.6 25 68.6 56.4 Top destinations in South Dakota (In-Target)
2005 Percent
Top destinations in South Dakota (In-Target)
2004 Percent
Rapid City 22.0 Black Hills 15.2 Black Hills 10.9 Sioux Falls 14.5 Mount Rushmore 7.0 Rapid City 13.9 Deadwood 6.7 Mount Rushmore/Keystone 12.4 Sioux Falls 5.6 Laura Ingalls Wilder Pageant/De
Smet 10.3
SD in General 4.7 Watertown 7.0 Keystone 4.4 Deadwood 6.7 Hill City 4.1 S.D. general 4.5 Spearfish 3.5 Pierre 3.0 Custer 3.2 Custer State Park 2.7 Watertown 2.1 Badlands 2.1 Badlands 2.1 Chamberlain 1.5 Pierre 1.8 Hill City 1.5 Hot Springs 1.5 Spearfish 1.5 (multiple answers allowed)
Top destinations in South Dakota (Out-of-Target)
2005 Percent
Top destinations in South Dakota (Out-of-Target)
2004 Percent
Rapid City 21.7 Mount Rushmore 24.0 Mt. Rushmore 13.7 Black Hills 18.2 Black Hills 10.6 Rapid City 16.1 SD in general 7.1 Deadwood 15.1 Sioux Falls 7.1 Sioux Falls 4.7 Deadwood 5.8 Sturgis 4.7 Badlands 5.3 Badlands 4.2 Spearfish 4.9 Custer State Park 3.6 Custer 4.0 Laura Ingalls Wilder Pageant/De Smet 3.6 Mitchell 3.5 Mitchell 3.1 Hill City 3.1 Spearfish 2.6 Crazy Horse 2.7 (multiple answers allowed)

8
Destinations other than South Dakota (In-Target)
2005 Percent
Destinations other than South Dakota (In-Target)
2004 Percent
Montana 12.5 Wyoming/Yellowstone 21.8 Yellowstone 10.8 Montana 19.1 Wyoming 10.8 North Dakota 10.9 Minnesota 9.6 Colorado 9.1 Colorado 8.3 Cross country trip 7.3 North Dakota 7.9 Minnesota 5.5 Glacier National Park 5.8 California 4.5 Washington 4.6 Canada 3.6 Canada 4.2 Nebraska 3.6 Iowa 3.8 Idaho 2.7 Oregon 2.1 Following Lewis and Clark Trail 2.7 Texas 2.1 Glacier National Park 1.8 Nebraska 1.7 Utah 1.8 California 1.7 Washington 1.8 Tetons 1.7 Wisconsin 1.8 Utah 1.3 Western U.S. 1.8 (multiple answers allowed)
Destinations other than South Dakota (Out-of-Target)
2005 Percent
Destinations other than South Dakota (Out-of-Target)
2004 Percent
Cross country trip 10.1 Cross country trip 16.9 Montana 8.6 Wyoming/Yellowstone 16.5 Wyoming 8.1 Following Lewis and Clark Trail 6.9 Yellowstone 7.6 Montana 6.9 Washington 7.3 Canada 4.8 North Dakota 5.8 Minnesota 4.8 Colorado 5.8 Alaska 4.4 Minnesota 5.8 California 4.4 California 5.3 Wisconsin 4.0 Canada 5.3 Iowa 3.6 Oregon 2.8 Colorado 3.2 Iowa 2.8 North Dakota 2.8 Grand Canyon 2.5 Washington 2.8 Nebraska 2.3 Illinois 2.4 Michigan 2.3 Nebraska 2.4 Alaska 2.3 Ohio 1.6 (multiple answers allowed)

9
TRAVELER CONNECTIONS TO SOUTH DAKOTA
Friends and relatives living in South Dakota by percentage (In-Target):
Friends and relatives living in South Dakota by percentage (Out-of-Target)
15.422.3
84.677.7
0102030405060708090
2005 2004
YesNo
12.8 15.2
87.2 84.8
0
20
40
60
80
100
2005 2004
YesNo

10
LENGTH OF VACATION Total vacation days (In-Target)
2005 Percent
2004 Percent
Total vacation days (Out-of-Target)
2005 Percent
2004 Percent
3 days or less 15.0 26.4 3 days or less 7.7 6.4 4-7 days 38.9 39.5 4-7 days 16.8 14.5 8-11 days 23.3 16.4 8-11 days 17.8 13.9 12 or more days 22.7 17.7 12 or more days 57.7 65.2 Average vacation days: 7.7 days 7.1 days Average vacation days: 10.5 days 12.7 days Total vacation days in South Dakota (In-Target)
2005 Percent
2004 Percent
Total vacation days in South Dakota (Out-of-Target)
2005 Percent
2004 Percent
1 12.5 9.8 1 9.5 9.1 2 18.3 23.9 2 22.5 23.6 3 16.6 18.4 3 18.8 19.5 4 15.0 14.1 4 15.3 14.8 5 13.7 11.8 5 8.9 9.1 6 7.3 8.4 6 5.9 5.5 7 6.4 7.1 7 5.3 6.4 8 3.7 1.6 8 3.3 2.1 9 1.7 0.7 9 2.8 0.2 10 1.0 2.1 10 1.8 2.3 11 1.2 0.2 11 1.6 0.7 12 or more 2.7 2.1 12 or more 4.3 6.8 Average days in S.D.: 4.2 days 4 days Average days in S.D.: 4.3 days 4.5 days

11
Total vacation days (In-Target) by percentage: 2005 vs. 2004
2005 average: 7.7 days 2004 average: 7.1 days Total vacation days in South Dakota (In-Target) by percentage: 2005 vs. 2004
2005 average: 4.2 days
2004 average: 4 days
15
38.9
23.3 22.726.4
39.5
16.4 17.7
05
1015202530354045
<3 Days 4-7 days 8-11 Days >12 Days
20052004
47.442.4
7.52.7
52.1
41.4
4.5 2.10
10
20
30
40
50
60
<3 Days 4-7 Days 8-11 Days >12 Days
20052004

12
Total vacation days (Out-of-Target) by percentage: 2005 vs. 2004
2005 Average: 10.5 days 2004 Average: 12.7 days
Total vacation days in South Dakota (Out-of-Target) by percentage: 2004 vs. 2003
2005 Average: 4.3 days 2004 Average: 4.5 days
7.716.8 17.8
57.7
6.414.5 13.9
65.2
010203040506070
<3 Days 4-7 Days 8-11 Days >12 Days
20052004
50.8
35.4
9.54.3
52.3
35.8
5.2 6.8
0
10
20
30
40
50
60
<3 Days 4-7 Days 8-11 Days >12 Days
20052004

13
DESCRIPTION OF TRAVEL PARTY Size of travel party (In-Target)
2005 Percent
Size of travel party (In-Target)
2004 Percent
1 6.2 1 3.6 2 46.8 2 42.0 3 12.9 3 13.9 4 17.3 4 19.8 5 8.3 5 9.5 6 3.9 6 3.6 7 0.8 7 2.0 8 or more* 3.9 8 1.6 9 0.2 10 0.9 11 or more 2.7 Average #/party: 3.1 people Average #/party: 3.6 people Size of travel party (Out-of-Target)
2005 Percent
Size of travel party (Out-of-Target)
2004 Percent
1 7.6 1 3.4 2 56.4 2 52.0 3 12.0 3 11.8 4 15.0 4 17.3 5 5.1 5 5.9 6 2.1 6 3.9 7 1.2 7 1.6 8 or more* 0.7 8 0.7 9 0.7 10 0.0 11 or more 2.7 Average #/party: 2.7 people Average #/party: 3.7 people * In 2005 8 or more people was the highest allowed answer.
14
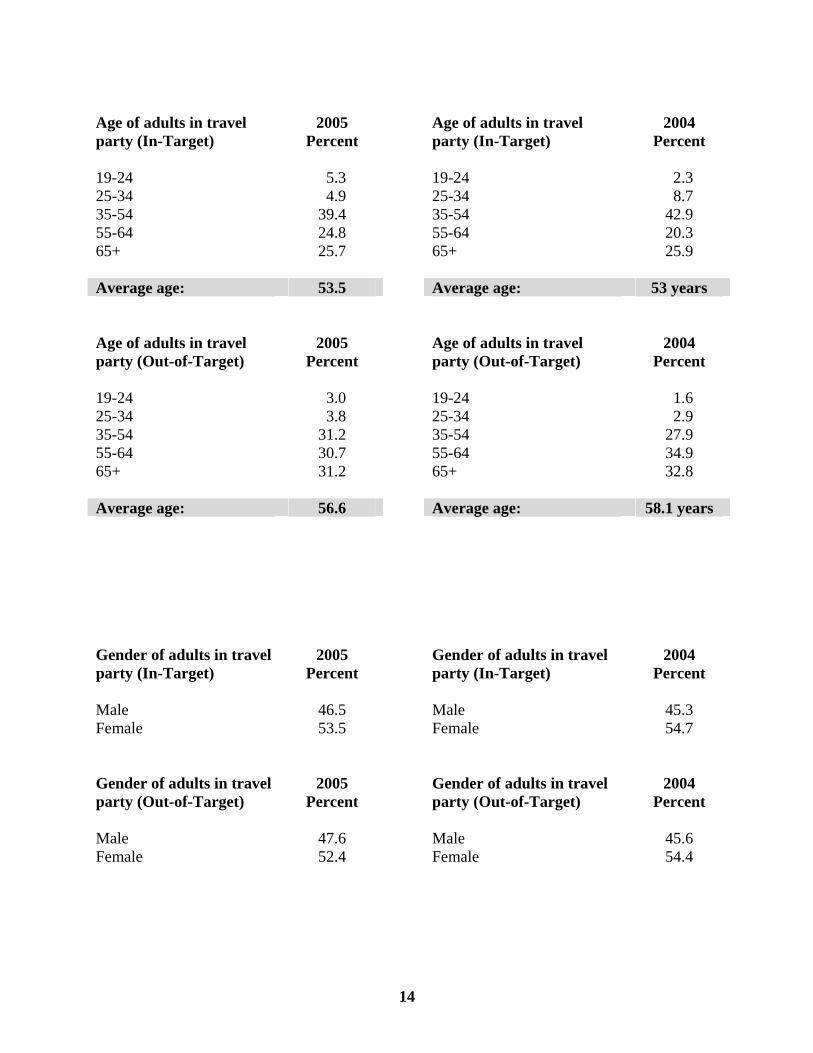
Age of adults in travel party (In-Target)
2005 Percent
Age of adults in travel party (In-Target)
2004 Percent
19-24 5.3 19-24 2.3 25-34 4.9 25-34 8.7 35-54 39.4 35-54 42.9 55-64 24.8 55-64 20.3 65+ 25.7 65+ 25.9 Average age: 53.5 Average age: 53 years Age of adults in travel party (Out-of-Target)
2005 Percent
Age of adults in travel party (Out-of-Target)
2004 Percent
19-24 3.0 19-24 1.6 25-34 3.8 25-34 2.9 35-54 31.2 35-54 27.9 55-64 30.7 55-64 34.9 65+ 31.2 65+ 32.8 Average age: 56.6 Average age: 58.1 years Gender of adults in travel party (In-Target)
2005 Percent
Gender of adults in travel party (In-Target)
2004 Percent
Male 46.5 Male 45.3 Female 53.5 Female 54.7 Gender of adults in travel party (Out-of-Target)
2005 Percent
Gender of adults in travel party (Out-of-Target)
2004 Percent
Male 47.6 Male 45.6 Female 52.4 Female 54.4

15
TRAVEL PLANS TO SOUTH DAKOTA When did you make the decision to come to/ through South Dakota? (In-Target)
2005 Percent
When did you make the decision to come to/ through South Dakota? (In-Target)
2004 Percent
January 11.9 January 9.5 February 11.2 February 9.8 March 8.3 March 12.5 April 9.2 April 13.2 May 14.3 May 18.2 June 15.8 June 17.0 July 23.1 July 10.9 August 0.6 August 2.3 September 1.2 September 0.2 October 1.2 October 0.7 November 1.9 November 1.4 December 1.3 December 4.3
When did you make the decision to come to/ through South Dakota? (Out-of-Target)
2005 Percent
When did you make the decision to come to/ through South Dakota? (Out-of-Target)
2004 Percent
January 18.9 January 12.3 February 7.7 February 8.4 March 11.2 March 7.5 April 11.8 April 13.6 May 11.0 May 15.9 June 11.2 June 22.0 July 20.6 July 10.2 August 2.0 August 2.3 September 0.8 September 0.4 October 1.8 October 1.1 November 1.3 November 2.0 December 1.6 December 4.1

16
Have you been to South Dakota before? (In-Target) by percentage:
Have you been to South Dakota before? (Out-of-Target) by percentage:
82.7 79.8
17.3 20.2
0
20
40
60
80
100
2005 2004
YesNo
60.555.5
39.544.5
010203040506070
2005 2004
YesNo

17
How many years ago were you in South Dakota? (In-Target)
2005 Percent
2004 Percent
Earlier this year 15.0 22.2 1 year ago 20.6 25.4 2 years ago 6.4 9.1 3 years ago 4.0 6.8 4 years ago 3.7 3.7 5 years ago 6.0 3.7 6 years ago 0.8 0.6 7 years ago 1.0 1.1 8 years ago 1.2 1.4 9 years ago 1.2 0.6 10+ years ago 22.9 25.4 Average: 5.6 years ago 5 years ago How many years ago were you in South Dakota? (Out-of-Target)
2005 Percent
2004 Percent
Earlier this year 5.6 13.5 1 year ago 11.2 14.8 2 years ago 5.8 11.5 3 years ago 3.9 6.1 4 years ago 4.6 6.6 5 years ago 2.6 4.1 6 years ago 1.2 2.9 7 years ago 1.6 1.6 8 years ago 2.0 1.2 9 years ago 0.7 0.8 10+ years ago 21.4 36.9 Average: 6.8 years ago 6.9 years ago

18
What in particular prompted you to consider South Dakota? (In-Target)
2005 Percent
What in particular prompted you to consider South Dakota? (In-Target)
2004 Percent
Specific attraction 38.3 Specific attraction 31.6 Family/friends 21.0 Patriotic sites 23.6 Other 24.7* Family/friends 20.2 Specific event 8.7 Specific event 16.6 Close to home 3.1 Passing through 10.5 Advertisement Newspaper 1.7 Other 4.5** Advertisement TV 0.8 Close to home 4.3 Advertisement Travel/Outdoor Show
0.8 Never been to S.D. before 2.5
Advertisement Internet/E-mail 0.6 Lewis and Clark Trail 2.3 Advertisement Magazine 0.4 Advertisement seen/heard 1.1 Business 1.1 Fishing 1.1 Just to visit 1.1 Internet/Web 0.2 (multiple answers allowed)
* Examples of “other” reasons in 2005 included: passing through, the scenery, various conventions, corvette rally, camping, “Deadwood” the series, honeymoon, shopping, charity work, used to live here, and Lewis and Clark Trail. ** Examples of “other” reasons in 2004 included: historical sites, group tour, wanted to come back, birthday/anniversary, convenient location, and researching family history What in particular prompted you to consider South Dakota? (Out-of-Target)
2005 Percent
What in particular prompted you to consider South Dakota? (Out-of-Target)
2004 Percent
Specific attraction 46.2 Specific attraction 32.7 Family/Friends 20.9 Patriotic sites 26.1 Other* 22.5 Passing through 20.0 Specific Event 6.6 Family/friends 14.5 Close to home 1.0 Specific event 7.7 Advertisement Travel/Outdoor Show
0.8 Other 5.9**
Advertisement Magazine 0.7 Lewis and Clark Trail 4.8 Advertisement Internet/E-mail 0.5 Never been to S.D. before 4.1 Advertisement TV 0.3 Business 2.7 Close to home 2.0 Just to visit 1.4 Advertisement seen/heard 0.5 (multiple answers allowed) *See above 2005 other category for examples. ** Examples of “other” reasons in 2004 included: scenery, group tour, wanted to come back, missionary trip, gambling, and wanted to see America.

19
TRAVEL INFORMATION While on your vacation, are you using a South Dakota Vacation Guide? (In-Target)*
2005 Percent
2004 Percent
Yes 61.1 26.4 No 38.9 73.6 If yes, when did you receive the vacation guide? (In -Target)
2005 Percent
2004 Percent
Before coming to South Dakota 39.1 N/A** After Arriving to South Dakota 60.9 N/A** While on your vacation, are you using a South Dakota Vacation Guide? (Out-of-Target)
2005 Percent
2004 Percent
Yes 60.7 18.9 No 39.3 81.1
If yes, when did you receive the vacation guide? (Out-of-Target)
2005 Percent
2004 Percent
Before coming to South Dakota 40.8 N/A** After Arriving to South Dakota 59.2 N/A** * The question was worded differently in 2005. ** The question of “when did you receive the vacation guide” was not asked in 2004.

20
While on your vacation, are you using a South Dakota Vacation Guide? (In-Target)
While on your vacation, are you using a South Dakota Vacation Guide? (Out-of-Target)
61.1
26.4
38.9
73.6
01020304050607080
2005 2004
YesNo
60.7
18.9
39.3
81.1
0
20
40
60
80
100
2005 2004
YesNo

21
When did you receive the vacation guide? (In -Target)
When did you receive the vacation guide? (Out-of-Target)
39.1
60.9
010203040506070
2005 2004
Before coming to SDAfter arriving to SD
40.8
59.2
010203040506070
2005 2004
Before coming to SDAfter arriving to SD
22
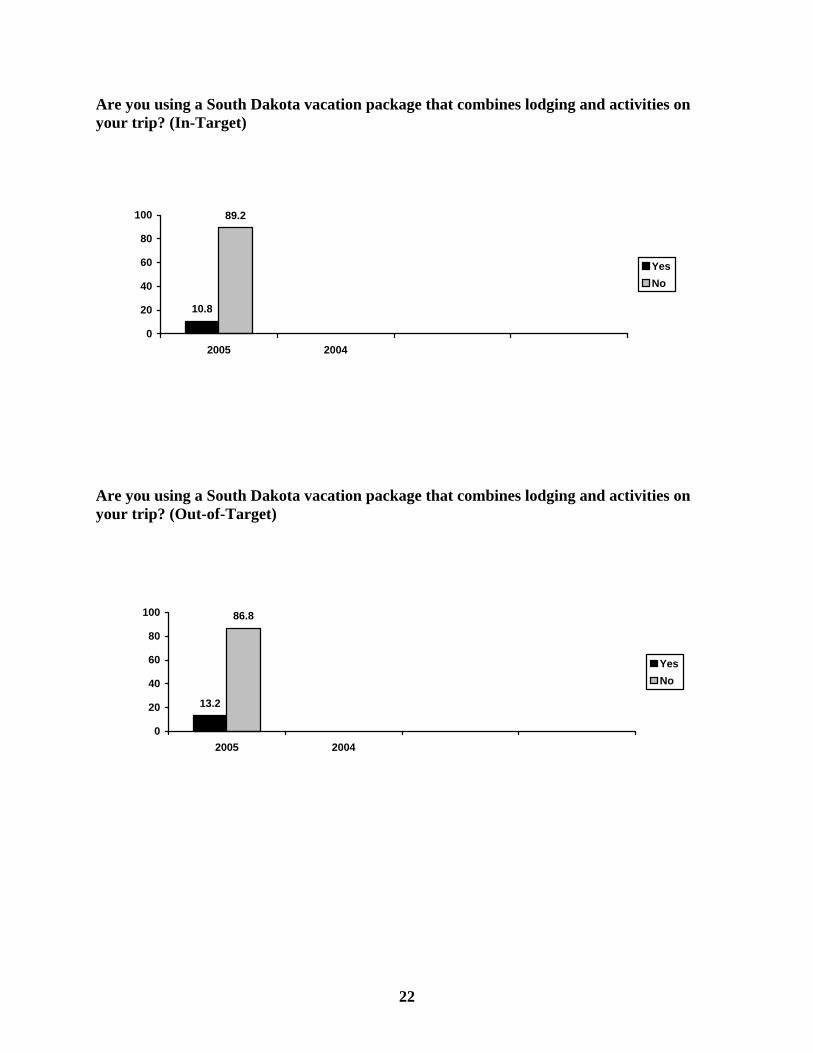
Are you using a South Dakota vacation package that combines lodging and activities on your trip? (In-Target)
Are you using a South Dakota vacation package that combines lodging and activities on your trip? (Out-of-Target)
10.8
89.2
0
20
40
60
80
100
2005 2004
YesNo
13.2
86.8
0
20
40
60
80
100
2005 2004
YesNo

23
Where did you find out about the package? (In-Target)
Where did you find out about the package? (Out-of-Target)
48.2
1.810.7
39.3
0
10
20
30
40
50
60
2005 2004
MagazineTVNewspaperInternet/E-mail
43.8
5.0 1.3
50.0
0
10
20
30
40
50
60
2005 2004
MagzineTVNewspaperInternet/E-mail

24
SPENDING Total spending per day for entire travel party (In-Target)
2005 Percent
2004 Percent
Less than $100 37.4 24.8 $100-199 35.4 50.7 $200-299 16.2 17.7 $300-399 6.8 3.9 $400-499 2.5 1.1 $500-599 1.2 0.5 $600-699 0.4 0.0 Over $700 0.0 1.4 Average spending: $170.69 per day $170.94 per day Total spending per day for entire travel party (Out-of-Target)
2005 Percent
2004 Percent
Less than $100 34.7 25.0 $100-199 38.5 50.9 $200-299 19.4 14.3 $300-399 4.5 5.7 $400-499 1.7 0.2 $500-599 1.0 1.1 $600-699 0.2 0.7 Over $700 0.0 2.0 Average spending: $166.36 per day $179.01 per day Average spending of all respondents, 2005: $168.53 per day Average spending of all respondents, 2004: $174.97 per day