south asia disaster management report 2011
TRANSCRIPT


Published by the SAARC Disastger Management Centre,
New Delhi
Any part of this publication may be cited, copied, translated
in other languages or adpted to meet local needs with prior
permission from SAARC Disaster Management Centre, New
Delhi
@ SDMC 2013
This report has been authored by the professionals of SAA-
RC Disaster Management Centre with assistance and sup-
port of staffs under the overall guidance of Director, SDMC.
Editorial Team
O. P. Mishra, M. Ghatak
Assistance : N. M. Akram , Ranjan Kumar
Data Compliation : Hari Dass Sharma, Mahesh Kumar,
Yashika Sharma
ISBN : 13:978-81-907841-3-9
Designed & Printed by
CELLULOID
Patparganj Industrial Area, Delhi
+91-11- 22487531, 9811297670
email: [email protected]

Contents
Preface (V)
Chapter 1 : Introduction 1
PART - I: HYDRO-METEOROLOGICAL DISASTERS
Chapter 2 : Cyclone 9
Chapter 3 : Flood 20
Chapter 4 : Drought 37
Chapter 5 : Avalanche 54
Chapter 6 : Heat and Cold Wave 58
Chapter 7 : Forest Fire 63
PART - II: GEOLOGICAL DISASTERS
Chapter 8 : Earthquake 68
Chapter 9 : Landslide 94
PART - III: MANMADE DISASTERS
Chapter 10 : Epidemics 99
Chapter 11 : Man-Made Disasters 111
Chapter 12 : Conclusion 133
DISASTER DATA - SOUTH ASIA 2011
Appendix I-A: South Asia Disaster Profile 2011 136
Appendix I-B: South Asia Disaster Events 2011 139
Appendix II : Storms in South Asia 2011 142
Appendix III : Flood in South Asia2011 143
Appendix IV : Cold and Heat waves in South Asia2011 144
Appendix V-A : Earthquake events in South Asia 2011 145
Appendix V-B : Earthquake Data of South Asia-2011 148
Appendix V-C: Earthquake data of South Asia-2011 152
Appendix V-D : Earthquake in South Asia 2001-2011 154
Appendix VI-A : Landslide Events in South Asia2011 157
Appendix VI-B : Avalanche Events in South Asia2011 160
Appendix VII-A: Epidemics in South Asia2011 161
Appendix VII-B: Epidemics in South Asia-2011 as compiled by Pro MED 162
Appendix VIII : Man-made Disasters in South Asia 2011 181


Despite its negative consequences, disaster's also offer good opportunities to formulate forward
looking policies pertaining to social development, economic growth, environmental quality and jus-
tice, in addition to essential value that contribute to sustainability. For effective disaster Management
it is utmost significance re-evaluate what is working in the sector of disaster management, what can
be improved and what tomorrow might bring.
Keeping this view SAARC Disaster Management Centre has initiated on the process of compilation
of South Asia Disaster Report. Like the previous four issues of the report, SADR 2011 is largely based
on the data published by the Emergency Disaster Database (EM-DAT) maintained by the Centre for
Research on the Epidemiology of Disaster (CRED) Leuven, Belgium, which is acknowledged as the most
authentic global data base of disaster. However, this has been supplemented by information available
from other reliable government, inter-government and non-government sources. Further SDMC has
been collecting disaster related information from its daily scanning of the major newspapers pub-
lished in South Asia, based on which a weekly Disaster Update is being published.
The report has been structured largely on the pattern of previous four reports. In total 13 chapters
of the report have been distributed in three parts. Part I deals with hydro-meteorological disasters,
e.g. cyclone, flood, drought, glacial lake outburst, avalanche, heat and cold wave and forest fire; Part II
covers the geological disasters of earthquake and landslide; while Part III discusses the man-made and
biological disasters. The introductory chapter critically analyzes overall disasters in numbers as well
as damages to life and property. The concluding chapter summarizes the main findings of the report
based on critical analysis. Most of the chapters have separate appendices on disaster statistics from
various sources.
The report is the collective efforts of the professionals of the SDMC, who had to work hand with-
out adequate support of reliable data. We realize that there is future scope for improvement in data
presentation and interpretation. SDMC welcomes constructive comments and criticisms from the
readers which would be useful for drafting the disaster report for the year 2012. We are determined to
make SADR as the most important and basic reference material on disaster in South Asia.
New Delhi
March, 2013 (SATENDRA)
Director,
SAARC Disaster Management Centre.
Preface


South Asia DisasterReport 2011
| 1 |
Introduction
Chapter 1
The year 2011 witnessed a slight decrease in
the occurrence of natural disasters globally. As
against 373 natural disaster events (country
level disasters) in the year 2010, 302 natural di-
saster events were recorded in the year 20111.
As against a total of 207 million people af-
fected due to natural disasters in the year 2010,
around 206 million people were affected due
to natural disasters during the year 2011. As
against 296,800 casualties during the year 2010,
only around 29,782 people were killed dur-
ing 2011(Table 1.1a). The economic damage to
property and infrastructure due to natural disas-
ters during the year 2011 is estimated at around
366 billion US$ as against 109 billion during the
year 2010.
Table 1.1(a): Comparative Global Natural Disasters (2008- 2011) at a glance (Source: CRED 2011)2
Indicator 2001-2010 Yearly average
2008 2009 2010 2011
Number of country –level Disasters
384 354 335 373 302
Number of People killed 106,887 235816 10418 296800 29,782
Number of affected 232 million 214.3 million 119.52 million 207 million 206 million
Economic Damages(US$) 108 billion 190.30 billion 41.28 billion 109 billion 366 billion
A critical analysis of Figure 1.1(a) shows that a
total of 302 natural disasters of various kinds were
reported for the year 2011 in the world, while the
average number of occurrence of natural disas-
ter during preceding ten years (2000 – 2010) was
found to be 384. The number of natural disasters
occurred in the world during the year 2011 con-
stituted only 78.64% of those of average natural
disasters that occurred during the preceding de-
cade (2000 – 2010). Analyses, however, showed
that the year 2011 had similar pattern of disas-
ter than that of the preceding decade. Flood was
found to be a severe natural disaster in terms of
frequency followed by storm, earthquake, and ex-
treme temperatures in terms of their occurrences.
Figure 1.1(a): Comparative of global average of natural disasters (2000-2010) and global occurrence of natural disasters during 2011(Source:
Annual Disaster Statistical Review, 2011: The Numbers and Trends, CRED, 2011)2

| 2 |
Introduction
Figure 1.1 (b): Temporal distribution of Natural Disaster (1900-2011). ( source: www.emdat.be)
Trend of DisastersThe Fig.1.1(b) show that the global trend of
disasters in the year 2011 was found to be con-
sistently increasing in number of hydro-mete-
orological disasters in the world. Incidents of
geological disasters like earthquakes, landslides
and volcanic activity have remained more or
less constant, even though the impact of these
disasters in terms of loss and injuries of life and
damages of buildings and infrastructures have
worsened, probably due to rapid growth of un-
planned settlements and unsafe building practic-
es. The hydro meteorological disasters like flood,
drought, windstorms, cyclones, tornadoes and
other extreme climatic events, on the other hand
have been continuously on the rise as would be
evident from the above figure 1.1(b). This trend of
distribution of natural disasters gets enhanced in
the time frame during 1980 – 2010, while in the
year 2011 the temporal distribution of natural
disasters gets declined (Fig. 1.1b), which is very
much corroborative with Table 1.1(a).
A rigorous compilation and analyses of di-
saster data during the year 2011 demonstrated
that the South Asia had experienced climate
change induced hydro-meteorological and
geophysical natural disasters (Flood, coastal
floods, mass movement and Earthquake). The
pattern of distribution was similar to that of
global natural disaster events. However, a total of
173 hydro-meteorological disasters were found
to have decreased from 195 events in compari-
son to the preceding decade (2001-2011). The
EMDAT data base show that the average number
of victim (139.77 million) reported during (2001
– 2010) was decreased to 108.70 Million in the
year 2011, while the economic loss (70.72U$) due
to hydrological disasters increased significantly
compared to the preceding decade (2001-2010)
[Table-1.1(b)]. The overall economic loss due to
various types of disasters during the year 2011
was found to be due to earthquake disaster (US$
230.30), which more in comparison to the pre-
ceding decade (2001 – 2010), which was about
62.90 % of the total economic loss (366.12 during
the year 2011
The analyses of global disaster data showed
that the mortality of people during various types
South Asia DisasterReport 2011
| 3 |
Disaster Number Disaster Victims in millions Economics loss
2001-2010 Average
2011 occurrence
2001-2010 Average (Million)
Victim2011(million)
2001-2010 Average
(US$) (Billion)
Damage2011 (US$) (Billion)
Flood, Landslide (Hydrological)
195 173 139.77 108.70 21.09 70.72
Cyclone, Storms (Meterological)
105 84 38.52 39.10 54.77 50.87
Drought, Heat-Cold (Climatological)
50 39 77.23 64.60 9.10 14.23
Earthquke (Geo-Physical,Volcano)
35 36 8.92 1.76 24.08 230.30
Total 385 332 264.44 214.16 109.04 366.12
Table1.1(b): A brief on global Natural disasters in 2011 [Source: www.emdat.be]
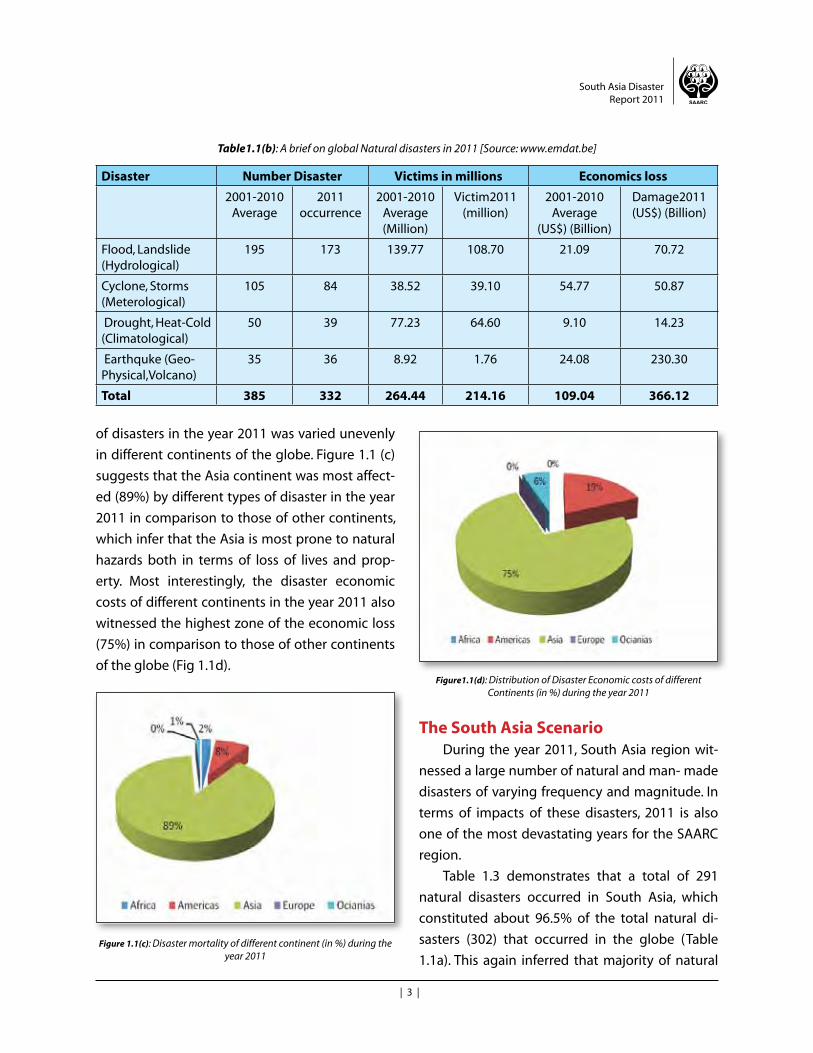
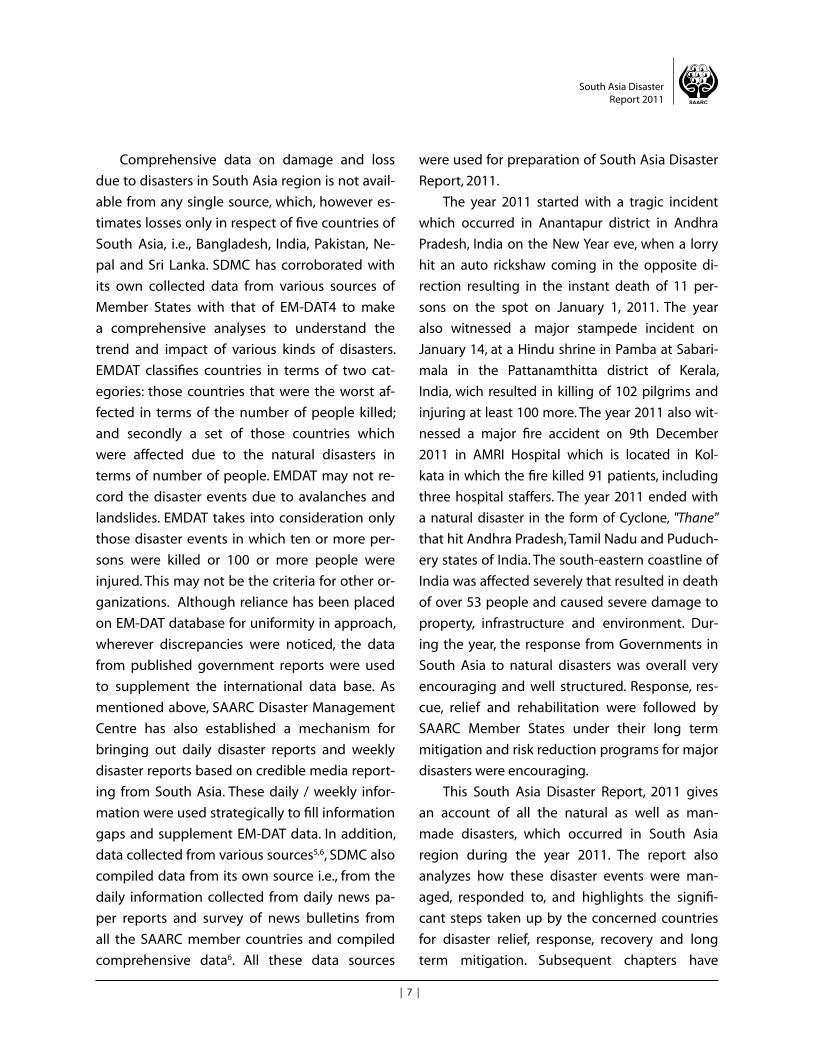
of disasters in the year 2011 was varied unevenly
in different continents of the globe. Figure 1.1 (c)
suggests that the Asia continent was most affect-
ed (89%) by different types of disaster in the year
2011 in comparison to those of other continents,
which infer that the Asia is most prone to natural
hazards both in terms of loss of lives and prop-
erty. Most interestingly, the disaster economic
costs of different continents in the year 2011 also
witnessed the highest zone of the economic loss
(75%) in comparison to those of other continents
of the globe (Fig 1.1d).
Figure 1.1(c): Disaster mortality of different continent (in %) during the year 2011
Figure1.1(d): Distribution of Disaster Economic costs of different Continents (in %) during the year 2011
The South Asia ScenarioDuring the year 2011, South Asia region wit-
nessed a large number of natural and man- made
disasters of varying frequency and magnitude. In
terms of impacts of these disasters, 2011 is also
one of the most devastating years for the SAARC
region.
Table 1.3 demonstrates that a total of 291
natural disasters occurred in South Asia, which
constituted about 96.5% of the total natural di-
sasters (302) that occurred in the globe (Table
1.1a). This again inferred that majority of natural

| 4 |
Introduction
disasters were concentrated in South Asia. The
compilation of Disaster events by SDMC team
from various sources, including SDMC and EM-
DAT showed that number of landslide occurred
in South Asia was the highest (131), followed by
earthquake events (121), and flood (16).
Figure 1.2(a) shows that the percentage dis-
tribution of natural events in Nepal (39.55%) and
India (24.39%) was higher than the other Member
States of SAARC during the year 2011. The per-
centage distribution of events in other SAARC
Member States showed non-uniform distribution
of natural events, such as Afghanistan (14.77%);
Afghanistan Bangladesh Bhutan India Maldives Nepal Pakistan Sri Lanka
Total
Drought 1 0 0 0 0 0 0 0 1
Earthquake 34 0 1 27 1 45 13 0 121
Epidemic 0 0 0 0 1 0 0 1 2
Extreme temperature
0 2 0 2 0 2 0 0 6
Flood 2 1 0 7 0 2 1 3 16
Avalanche 2 0 0 0 0 3 3 0 8
Landslide 3 25 1 32 0 63 7 0 131
Storm 1 1 0 3 0 0 0 1 6
Total 43 29 2 71 2 115 24 5 291
Table1.3: Number of Natural Disaster Events in South Asia
Source-EM- DAT and data compiled by SDMC from various media source
Bangladesh (9.96%); Bhutan(0.68%); Maldives
(0.68%); Pakistan ( 8.25%); and Sri Lanka(1.72%).
Fig1.2(a): Distribution of disaster Events country wise in South Asia 2011
Cyclone Earth-quake
Drought Avalanche Flood H&C waves
Land slides Epidemic Total
Afghanistan 21 - - 24 62 - 3 - 110
Bangladesh 13 - - - 10 62 25 - 110
Bhutan - 1 - - - - 1 - 2
India 106 112 - - 608 212 32 - 1070
Maldives - - - - - 4 4
Nepal - 7 - 6 104 42 63 - 222
Pakistan - 2 - 3 509 7 - 521
Sri Lanka 22 - - - 65 24 167 278
Total 162 122 - 33 1358 316 155 171 2317
Table1.4: Pattern of Disaster Death in South Asia2011
Source:EM- DAT and data compiled by SDMC from various media sources

South Asia DisasterReport 2011
| 5 |
Table 1.4 shows that a total of 2317 people
were killed in various disasters related events in
the SAARC region in the year 2011. The maximum
number of people killed in India (1070) followed
by Pakistan (521), Sri Lanka (278) and Nepal (222).
The percentage distribution of people killed dur-
ing the year 2011 demonstrated different intensi-
ty of disaster events that killed people differently
as shown in Figure 1.2(b). In the Year 2011, South
Asia witnessed maximum number of causali-
ties that occurred due hydro-meteorological and
geological / geophysical disaster events (Fig. 1.2c).
However, the total number of deaths in the
region during 2011 due to natural disasters is
lesser (2317) than the total number of deaths
occurred (3863) in the preceding year 20103. The
devastations caused by cyclonic storms in the
SAARC region during the year 2011was also found
to be lesser (162) in comparison to the preced-
ing year 2010 (299)3. The number of deaths due
to avalanches in the region was also significantly
lesser than the previous year. The distribution
of landslideds also shows that there is a declin-
ing trend which can be attributed to a reflection
of intensified landslide mitigation measures and
community awareness in the region. Deaths due
to earthquakes, it was found that a total of 122
people were killed in the SAARC region during
the year 2011, among which 112 were from In-
dia, seven from Nepal, two from Pakistan, and one
from Bhutan. The loss of lives in South Asia due to
earthquake in the year 2011was mainly due to the
18th September 2011 Sikkim – Nepal earthquake
(Mw 6.9) that rocked the border area of Nepal
and the Sikkim province of India. However, the
South Asia region, during the year 2011 witnessed
much higher casualties on account of man- made
disasters (i.e., Industrial, chemical, fire accidents,
road, rail, boat accidents, bomb blasts, stampedes,
epidemics etc) compared to the year 2010. The re-
gion during the year 2011 also witnessed a num-
ber of forest fires in Afghanistan, Bangladesh, Bhu-
tan, India, Nepal and Sri Lanka.
The analyses of Figure 1.2 (c) showed that
more than 58% of people died in natural disasters
in year 2011, which was mainly attributed to the
Flood in which about 46% casulities accounted for
India. People killed due to extreme temperature in
South Asia was estimated 11.63% while casualities
caused by earthquke and landslide were estimat-
ed as 6.68% and 5.26% respectevily. In comprision
to 2010, the occurrences of hydrometeorological
disasters during 2011 in the South Asia may be
due to climate change and global warming . The
climate change influnced the statistices of rain-
falls in this region causing urban flooding in most
part of India , Sri Lanka and Pakistan .
Fig1.2(b): A disgram showing country wise Percentage of death by Natural Disaster in year 2011
Fig1.2(c):Showing the death percentage by different natural calamities in Year 2011

| 6 |
Introduction
Cyclone Earth-quake
Drought Avalanche Flood H&C waves
Land slides
Epi-demic
Total
Afghanistan 5 - 1750000 - 12810 - - - 1762815
Bangladesh 121 - - - 1570559 102000 - - 1672680
Bhutan - 20016 - - - - - - 20016
India 250050 575200 - - 12004069 - - - 12829319
Maldives - - - - - - - 1289 1289
Nepal - 167949 - - 1858 25000 - - 194807
Pakistan - 1000 - - 5400755 - - - 5401755
Sri Lanka 35041 - - - 1293924 - - 26343 1355308
Total 285217 764165 1750000 - 20283975 127000 - 27632 23237989
Table1.5: Number of people affected by Natural Disasters in South Asia 2011
Source-EM- DAT and data compiled by SDMC from various media source
The information collected from the national
news bulletins of the SAARC members coun-
tries as well as global data source indicated
that about 23,23,7,989 people were affected due
to natural events especially by flood, drought,
cyclone, earthquake , extreme temperature , ava-
lanche and landslide in SAARC member coun-
tries during the year 2011(Table 1.5). People
affected due to natural disasters in region
(Table 1.5) shows that most affected people be-
longed to Pakistan, Bangladesh and India in
which majority of them were affected by flood. In
Afghanistan severe drought had huge impact
on natural resource causing poverty and water
scarcity. About 1750000 people were affected by
drought in various provinces of Afghanistan in
the year 2011. Another natural disaster, like Cy-
clone “Thane” hit some parts of India. Sri Lanka
experienced damage in year 2011. According to
database of EMDAT, about 285217 people affect-
ed by Cyclone in SAARC region during this year
(Table 1.5). The economic damages estimated
due to natural disasters in the year 2011 in South
Asia was found to be in a tune of US$ 4796 Mil-
lion as detailed deistribution of economic dam-
age are shown in Table 1.6.
Cyclone Earth-quake
Drought Avalanche Flood H&C waves
Land slides
Epidemic Total
Afghanistan - 142000 - 1654000 - - - 1796000
Bangladesh - - - - - - - - -
Bhutan - - - - - - - - -
India 375625 - - - - - - - 375625
Maldives - - - - - - - - -
Nepal - - - - - - - - -
Pakistan - - - - 2500000 - - - 2500000
Sri Lanka - - - - 500000 - - - 500000
Total 375625 - 142000 - 4654000 - - - 5171625
Table1.6: Economic damage (US$000) due in Disasters in South Asia2011
Source:EM- DAT and data compiled by SDMC from various media source
South Asia DisasterReport 2011
| 7 |
Comprehensive data on damage and loss
due to disasters in South Asia region is not avail-
able from any single source, which, however es-
timates losses only in respect of five countries of
South Asia, i.e., Bangladesh, India, Pakistan, Ne-
pal and Sri Lanka. SDMC has corroborated with
its own collected data from various sources of
Member States with that of EM-DAT4 to make
a comprehensive analyses to understand the
trend and impact of various kinds of disasters.
EMDAT classifies countries in terms of two cat-
egories: those countries that were the worst af-
fected in terms of the number of people killed;
and secondly a set of those countries which
were affected due to the natural disasters in
terms of number of people. EMDAT may not re-
cord the disaster events due to avalanches and
landslides. EMDAT takes into consideration only
those disaster events in which ten or more per-
sons were killed or 100 or more people were
injured. This may not be the criteria for other or-
ganizations. Although reliance has been placed
on EM-DAT database for uniformity in approach,
wherever discrepancies were noticed, the data
from published government reports were used
to supplement the international data base. As
mentioned above, SAARC Disaster Management
Centre has also established a mechanism for
bringing out daily disaster reports and weekly
disaster reports based on credible media report-
ing from South Asia. These daily / weekly infor-
mation were used strategically to fill information
gaps and supplement EM-DAT data. In addition,
data collected from various sources5,6, SDMC also
compiled data from its own source i.e., from the
daily information collected from daily news pa-
per reports and survey of news bulletins from
all the SAARC member countries and compiled
comprehensive data6. All these data sources
were used for preparation of South Asia Disaster
Report, 2011.
The year 2011 started with a tragic incident
which occurred in Anantapur district in Andhra
Pradesh, India on the New Year eve, when a lorry
hit an auto rickshaw coming in the opposite di-
rection resulting in the instant death of 11 per-
sons on the spot on January 1, 2011. The year
also witnessed a major stampede incident on
January 14, at a Hindu shrine in Pamba at Sabari-
mala in the Pattanamthitta district of Kerala,
India, wich resulted in killing of 102 pilgrims and
injuring at least 100 more. The year 2011 also wit-
nessed a major fire accident on 9th December
2011 in AMRI Hospital which is located in Kol-
kata in which the fire killed 91 patients, including
three hospital staffers. The year 2011 ended with
a natural disaster in the form of Cyclone, "Thane"
that hit Andhra Pradesh, Tamil Nadu and Puduch-
ery states of India. The south-eastern coastline of
India was affected severely that resulted in death
of over 53 people and caused severe damage to
property, infrastructure and environment. Dur-
ing the year, the response from Governments in
South Asia to natural disasters was overall very
encouraging and well structured. Response, res-
cue, relief and rehabilitation were followed by
SAARC Member States under their long term
mitigation and risk reduction programs for major
disasters were encouraging.
This South Asia Disaster Report, 2011 gives
an account of all the natural as well as man-
made disasters, which occurred in South Asia
region during the year 2011. The report also
analyzes how these disaster events were man-
aged, responded to, and highlights the signifi-
cant steps taken up by the concerned countries
for disaster relief, response, recovery and long
term mitigation. Subsequent chapters have

| 8 |
Introduction
captured the incidence of major natural and
man - made disasters in all the SAARC member
countries, and dealt at length how these disas-
ters were responded and also brought into fo-
cus the achievements and shortcomings in pre-
paredness, response, relief, rehabilitation and
recovery and also the lessons learnt from these
disaster events of 2011. Since it is not possible
to provide detailed accounts of all the disasters
that occurred due to time and space limitations,
an attempt is made in the present South Asia
Disaster Report, 2011 to cover all the major and
important disaster events that occurred in the
SAARC region during the year 2011.
References1. Annual Disaster Statistical Review, 2011: The Num-
bers and Trends. Centre for Research on the Epide-
miology of Disasters (CRED), Leuven, Belgium.
2. http://cred.be/sites/default/files/Press_Release_
UNISDR-2011_03.pdf.
3. South Asia Disaster Reports 2008, 2009 & 2010.
Published by the SAARC Disaster Management
Centre.
4. EM-DAT: www.emdat.be.
5. SAARC Member Country Reports, Newspapers
and other sources
6. Weekly Disaster Updates, SAARC Disaster Man-
agement Centre, New Delhi

South Asia DisasterReport 2011
| 9 |
An OverviewMany of the South Asian countries, especially
those bound by coastline have been perennially
vulnerable to the threat of cyclones arising in
the North Indian Ocean and Arabian Sea. How-
ever, in 2011, the devastations caused by storms
and cyclones in the SAARC countries were much
less than the preceding year. As per the Em-dat
sources (Appendix II, Table 2.1., Fig. 2.1), there
were six disturbances in the year 2011 and the
number of people killed was also appreciably
less, 162 as compared to 265 people killed in
the year 2010 in South Asia1. In 2010, there were
two Severe Cyclonic Storms (SCS), Laila and Jal
and one Very Severe Cyclonic Storm (VSCS) Phet
Chapter 2
Cyclone
whereas, in the year 2011 there was only one
VSCS, "Thane" that hit the south-eastern coast of
India and parts of Sri Lanka. The frequency dis-
tribution of cyclonic disturbances for the period
1997-2011 shows a current receding trend in
the frequency of occurrence in the region (fig-
ure 2.1) in an overall waxing and waning trend.
It shows a decreasing trend from 1998 to 2000
after which the frequency of cyclones in the re-
gion reached a plateau continuing up to 2003
only to spiral up into an increasing trend ending
in 2007. The frequency has followed a decreas-
ing trend since then although; the region has
been a sufferer to some major cyclones in this
later phase too.
Start End Country Location(s) Disaster type
Disaster sub type
Name Killed Total affected
10/02/2011 14/02/2011 Afghanistan Daykundi Storm Local Storm
21 5
04/04/2011 04/04/2011 Bangladesh Sherpur, Mymensingh,
Rang
Storm Local Storm
1'3 121
15/04/2011 15/04/2011 India Karnataka State
Storm Local Storm
17
29/12/2011 30/12/2011 India Cuddalore, Puducherry
Storm Tropical Cyclone
Cyclone Thane
47 250000
20/05/2011 20/05/2011 India Uttar Pradesh
Storm Local Storm
42 50
24/11/2011 27/11/2011 Sri Lanka South Storm Local Storm
22 35041
Table 2.1. Storms in the South Asian region in 2011 (Source: www.emdat.be).

| 10 |
IntroductionCyclone
Figure 2.1:Number of cyclonic disturbances in South Asian region (Data Source: Indian Meteorological Department (IMD) and www.emdat.be).
Figure 2.2:Percentage of storm events in South Asia between 2000 and 2011 (Data source: www.emdat.be).
An analysis of the number of storm events in
the region for the period 2000-2011 shows (Fig.
2.2) that Bangladesh, with its exposed coastline,
had the major share of the storms in the region
followed closely by India. Among the other coun-
tries, Sri Lanka though shows lesser number of
storm events as compared to Afghanistan and
Pakistan, it has bore the brunt of some of the ma-
jor cyclones arising in the North Indian Ocean.
Figure 2.3: Number of people killed in South Asia due to storms in the year 2011 (Data source: www.emdat.be).
Figure 2.4:Percentage of people killed in South Asia due to storms in 2011 (Data source: www.emdat.be).
The year 2011 witnessed lesser number of
deaths in the region due to storm events, India
recording the maximum among them (106, 65%,
Fig. 2.3 and Fig.2.4. Table 2.1). One of the remark-
able features of the storm incidents in 2011 was
that Bangladesh, one of the high cyclone risk
countries and bearer of the scars of many past
cyclones, recorded lesser number of fatalities as
compared to Afghanistan and Sri Lanka (Fig. 2.3
and Fig. 2.4).
Incidence of Storms and Cyclones in the South Asian Countries in 2011
Storm (April 4, 2011)
At the onset of the summer season in the
month of April, a storm lashed across parts of
Bangladesh. Seven districts namely, Jamalpur,
Sherpur, Mymensinh, Gaibandha, Joupurhat and
Bogra were affected taking a toll of 13 lives and
nearly 121 people affecting. It caused a large
scale uprooting of trees and electric poles; bat-
tering and destruction of thatched houses to
various degrees; damage to crops and infra-
structure (Fig. 2.5. 2.6). Gaibandha was severely
affected, nearly 45 people were injured and over
800 houses were damaged in the storm while in
Sherpur nearly 300 houses were damaged2, 3.

South Asia DisasterReport 2011
| 11 |
Figure 2.5:Damage caused by storm in parts of Bangladesh (Source: The Daily Star).
Figure 2.6:Thatched houses affected by the storm in Bangladesh (Source: http://www.worldvision.com).
Storm (April 15, 2011)
Many parts of India experienced strong
winds associated with lightning and thunder-
storms before the onset of summer. The sudden
downpour and the lashing rains disrupted life
and in some cases, claimed some lives. In such
incidents, 17 people lost their lives in different
parts of Karnataka, out of which 14 lost their lives
in lightning and other three died due to houses
collapse. House collapses killed two persons in
Ramanagara and one in Udupi. In Yembhatahalli
in Bijapur district, about 35 houses were dam-
aged in the heavy rains, but no casualties were
reported4.
Storm (May 20, 2011)
During a spell of rising heat in the begin-
ning of summer, many parts of India experienced
local storm. In one such event in May, 42 people
perished and 50 were injured in the storm when
torrential rains and thunderstorms lashed Uttar
Pradesh in northern part of India.
The affected districts were Ghaziabad, Shah-
jahanpur, Budaun, Meerut, Bulandshahr, Lakh-
impur-Kheri and Lucknow where strong winds
lashed early in the morning. The storm uproot-
ed electricity poles and trees (Fig. 2.7), snapped
communication links, knocked down hoardings
and also crushed mud-thatched houses. Shahja-
hanpur was the worst hit, with 16 people killed in
the storm while in Budaun that lashed in the wee
hours of the morning5.
Figure 2.7:Uprooting of trees due to storm in Uttar Pradesh, India (Source: www. ibnlive.in.com)
Storm (November 24-27, 2011)
Heavy rains accompanied by gusty winds
lashed the southern coastal areas of Sri Lanka
in November killing 22 people and rendered
many fishermen homeless. The southern district
of Matara was very badly hit where 8980 peo-
ple were affected, 282 houses were fully dam-
aged while another 1783 houses were partially
damaged. Other affected districts were Badulla,
Monaragala, Anuradhapura and Batticaloa. The af-

| 12 |
Introduction
fected areas witnessed widespread uprooting of
trees and electricity transmission towers; damages
to houses, roads, and bridges and disrupted the
common life for a prolonged period. Fallen trees
disrupted communication and due to damages
to the electricity transmission lines vast areas of
the districts experienced outage. The heavy rains
that accompanied the gale winds added further
misery to the affected (Fig. 2.8. 2.9). Rivers and
streams swelled and the major reservoirs in many
cases overflowed, as a result two people lost their
lives while crossing overflowing streams6,7,8,9.
Cyclone
Figure 2.8:Emergency rescue team carrying an affected woman to safety during the Sri Lanka storm (Source: http://thewatchers.adorraeli.com)
Figure 2.9:Lives of common people affected in the storm in Sri Lanka. (Source: http://indiatvnews.com).
to consolidate over a weak low level circulation
centre, which was being fed by enhanced west-
erly flow associated with the precursor system to
another Tropical Cyclone Benilde. Under the influ-
ence of this, the disturbance developed further
while moving towards northwest. The Joint Ty-
phoon Warning Centre (JTWC) then issued a tropi-
cal cyclone formation alert on the system during
December 25 before designating as Tropical Cy-
clone. Based on one minute wind speed near the
centre of the disturbance, that had reached 65
km/h (40 mph), 3TWC upgraded the status of the
alert to Tropical Storm. On the same day Indian
Meteorological Department (IMD) also reported
that the disturbance had organised sufficiently to
be termed a Depression located nearly 1,000 km
(620 mi) to the southeast of Chennai. On Decem-
ber 26, IMD had reported that the depression had
intensified into a Deep Depression and later in the
day, on the basis of advanced stage of intensifica-
tion of the system upgraded its status to Cyclonic
Storm and termed it "Thane". Subsequent to that,
"Thane" got oriented towards west under the influ-
ence of a subtropical ridge of high pressure. The
cyclonic storm further intensified on December 28
and developed 1-minute wind speed of 120 km/h
(75m/h) and later in the day it was termed Very Se-
vere Cyclonic Storm (Fig. 2.10). On the same day,
upon further intensification, Thane developed a
small pinhole eye of nearly 20 km (10 mi) radius
and the wind speed increased considerably (150
km/h or 90 m/h) (Fig. 2.11, 2.12). The VSCS Thane
continued moving further westwards and on De-
cember 30 made landfall between Cuddalore
and Puducherry in the north Tamilnadu coast. Af-
ter interacting with the land the frictional forces
weakened it into a Depression. IMD continued to
monitor Thane till it turned into a well marked low
pressure area on December 3110, 11, 12, 13.
Very Severe Cyclonic Storm, Thane
(December 30, 2011)
It developed initially as a tropical disturbance
within a monsoon trough in the east of Indonesia.
Convection surrounding the system had started
Cyclone

South Asia DisasterReport 2011
| 13 |
Figure 2.10. Track of Thane (Source: http://www.imd.gov.in/section/nhac/dynamic/THANE.pdf).
Date Time (UTC)
Centre lat./long.
C.I. No.
Estimated central pressure (hPa)
Estimated maximum sus-tained surface wind (Kt)
Estimated pressure drop at centre (hPa)
Grade
25.12.20111200 8.5/88.5 1.5 1000 25 3 D
1800 9.0/88.0 1.5 1000 25 3 D
26.12.2011
0000 9.5/87.5 2.0 998 30 4 DD
0600 10.0/87.5 2.0 998 30 4 DD
1200 10.5/87.5 2.0 998 30 5 DD
1800 11.0/87.5 2.5 996 35 7 CS
27.12.2011
0000 11.5/87.5 2.5 994 40 8 CS
0600 12.0/87.0 2.5 994 40 8 CS
1200 12.5/86.5 2.5 992 40 10 CS
1800 12.5/86.0 3.0 990 45 12 CS
28.12.2011
0000 12.5/85.5 3.0 990 45 12 CS
0600 12.5/85.0 3.0 988 45 14 CS
0900 12.5/58.0 3.5 986 55 16 SCS
1200 12.5/84.5 4.0 982 65 20 VSCS
1500 12.5/84.0 4.0 980 65 22 VSCS
1800 12.5/84.0 4.0 978 65 24 VSCS
2100 12.5/83.5 4.0 976 65 26 VSCS
29.12.2011
0000 12.3/83.0 4.0 974 70 28 VSCS
0600 12.0/82.0 4.5 972 75 30 VSCS
0900 12.0/81.7 4.5 972 75 30 VSCS
1200 12.0/81.3 4.5 972 75 30 VSCS
1800 12.0/80.6 4.5 972 75 30 VSCS
30.12.2011
0000 11.8/79.9 4.5 972 75 30 VSCS
0300 11.8/79.5 - 986 55 16 SCS
0600 11.8/79.0 - 998 30 5 DD
1200 11.8/78.2 - 1000 25 3 D
31.12.2011 0000 The system weakened into a well marked low pressure area over north Kerala and neighbourhood.
Table 2.2: Chronology of development of VSCS Thane (Source: http://www.imd.gov.in/section/nhac/dynamic/THANE.pdf).

| 14 |
Introduction
Figure 2.11. Satellite image of Thane cyclone with a well developed eye (Source: http://www.imd.gov.in/section/nhac/dynamic/THANE.pdf).
Cyclone
Figure 2.12: Enlarged view of the eye of VSCS Thane (Source: http://www.nasa.gov/mission_pages/hurricanes/archives/2011/h2011_Thane.html )

South Asia DisasterReport 2011
| 15 |
Figure 2.13:3-D images of VSCS Thane (Source: http://www.nasa.gov/mission_pages/hurricanes/archives/2011/h2011_Thane.html)
Figure 2.14: Three days of rainfall rates for VSCS Thane (Source: http://www.nasa.gov/mission_pages/hurricanes/archives/2011/h2011_Thane.html

| 16 |
Introduction
The 3-D time series image of the Thane cy-
clone shows the heights of associated thunder-
storms and rates of rainfall. On December 27,
when it was at the stage of Cyclonic Storm, the
system developed convective thunderstorm
towers of nearly 16 km height while on Decem-
ber 29, before making landfall and developing
into VSCS the height of the thunderstorm tow-
ers deceased13 (Fig. 2.13). Conversely, the rainfall
on 27th was 0.78 to 1.57 inches (20-40 mm) which
peaked to 2 inches (50 mm) before Thane made
landfall (Fig. 2.14). The intensification of rainfall
subsided once Thane made landfall and moved
inland in a weakened state13.
The build up and ultimate landfall of the
VSCS Thane induced widespread and intense
rainfall in the coastal parts of India in North In-
Figure 2.15 :Cyclone-affected areas of Tamil Nadu (Source: Punithavati et al, 2012).
dian Ocean. The following table 2.3 lists the
amount of rainfall received in the affected areas
by December 31 during the cyclone14.
Cyclone

South Asia DisasterReport 2011
| 17 |
STATE: KERALA
NAME OF PLACE RAINFALL (mm)
Haripad (Alapuzha dt) 22
Thiruvananthapuram 18
Nedumangad (Tiruvana-thapuram dt)
16
Kayamkulam (Alapuzha dt) 15
Thiruvalla (Pattanamthitta dt) 14
Chengannur (Alapuzha dt) 12
Neyyatinkara (Tiruvanan-thapuram dt)
11
Mavelikara (Alapuzha dt) 10
Konni (Pattanamthitta dt) 9
Kanjirapally (Kottayam dt) 9
Kottayam, Alapuzha 9
Varkala (Thiruvananthapuram dt) 7
Kozha (Kottayam dt) 7
STATE: TAMIL NADU
NAME OF PLACE RAINFALL (mm)
Kallakurichi (Villupuram dt) 18
Gingee (Villupuram dt) 16
Sankarapuram (Villupuram dt) 14
Mylaudy and Nagerkoil (both Kanyakumari dt)
14
Uthiramerur (Kanchipuram dt) 13
Kuzhithurai (Kanyakumari dt) 13
Virudhachalam (Cuddalore dt) 12
Cheyyar (Tiruvannamalai dt) 12
Mancompu (Alapuzha dt) 11
Tozhudur (Cuddalore dt) 11
Tirukoilur (Villupuram dt) 11
Polur 11
Vanthavasi 11
Sathanur Dam (all Tiruvannama-lai dt)
11
Kanchipuram 10
Maduranthagam (Kanchipuram dt)
10
Arani (Tiruvannamalai dt) 10
Chengalpattu (Kanchipuram dt) 9
Chembarambakkam (Tiruvallur dt)
9
Ulundurpet (Villupuram dt) 9
Tiruvannamalai 9
Punalur 8
Tiruvallur 8
Boothapandy (Kanyakumari dt) 8
Kanyakumari 8
Chengam (Tiruvannamalai dt) 8
Sholingur (Vellore dt) 8
Chennai airport 7
Cheyyur, Kelambakkam 7
Sriperumpudhur 7
Poonamalli 7
Ramakrishnarajupet 7
Tiruvalangadu 7
Tiruttani 7
Sethiyathope (Cuddalore dt) 7
Tindivanam (Villupuram dt) 7
Kumbakonam (Thanjavur dt) 7
Arakonamand Kaveripakkam 7
Vellore 7
Attur (Salem dt) 7
Coonoor 7
Jayamkondam (Ariyalur dt) 7
Padallur (Perambalur dt) 7
Table 2.3:Amont of rainfall received in the affected parts of India due to VSCS Thane (Source Punithavati et al. 2012).
Tamil Nadu experienced maximum damage
due to VSCS Thane. It affected the districts of Cud-
dalore, Villipuram, Kanjipuram, Thiruvallur, Chen-
nai, Nagapattinam, Thanjavur and the Puducherry
state. The entire eastern coastal belt of Tamil Nadu
was hit, the accentuation being more in the north-
ern half. Huts, houses with tiled and asbestos roofs
and concrete houses, were damaged either fully or

| 18 |
Introduction
partially15. In Puducherry and Cuddalore the most
damaged structures were the huts with thatched
roofs and wooden frames. Large scale uprooting
of trees and inundated roads caused hindrance to
relief and rescue operations. The cyclone affected
the power production by Neyvelli Lignite Corpo-
ration as the mines were submerged. However, in
view of advance warnings, the state and district
authorities especially in the coastal parts were in a
state of preparedness. Nearly 6000 people living in
low lying areas of Kanchipuram, Cuddalore, Thiru-
vallur, Nagapattinam, Villupuram and Chennai
were evacuated to safer places. The details of dam-
ages in Tamil Nadu are in the following table 2.4.
Cyclone
S. No.
Types of damages Units
1.Agriculture damagesi) Horticulture crops
80,609 hec 28,090 hec
2.Settlement damagesi) Thatched houses damagesii) Tiled house damages
2,67,92581,292
3. Roadways damages 1458 kms
4.
Biological damages i) Human beingii) Goat, Cow, Ox & Buffalo iii) Chickens iv) Duckv) Dove and Kadai variety
46 persons519 Nos
52,938 Nos285 Nos
6200 Nos
5.Boat damagesi) Fisher net damages
4600 Nos1,94,949 Nos
6.
Electrical goods damagesi) Electrical postii) Transformsiii) High level towersiv) Electric line or wires
45,460 Nos4500 Nos
27 Nos12,100 kms
Table 2.4:Damages in Affected parts of India due to VSCS Thane (Source: Punithavati et al, 2012).
The cyclone caused extensive devastation in
the affected parts of the southern coast of India.
The gale pushed a cargo ship aground off Chen-
nai and also damaged 70 fishing boats16. Crops
in the affected areas also suffered heavy damage.
Nearly 1, 00,000 acres of cultivated crop, mainly
standing paddy crops were damaged in the foul
weather and associated torrential rain. Though
the early warnings and alerts issued by the au-
thorities were helpful in helping some fishermen
shifting their boats to safer locations, many other
fishermen suffered huge losses. Due to the foul
weather and poor visibility conditions in the cy-
clone, 40 Indian fishermen had drifted away and
were later rescued by Sri Lankan authorities17.
The fury of the cyclone left behind a trail of
destruction (Fig. 2.16- 2.19). Trees were uprooted,
traffic signals were ripped off their bases and
advertisement boards mounted on frames were
torn apart and tossed about in the cyclone rav-
aged areas. Broken glass from street lights, shards
from window panes and other debris remained
suspended on inundated roads. Mobile servic-
es experienced outage and could be restored
Figure 2.16:Damage caused to property in Cuddalorects. (Source: http://www.thehindubusinessline.com)
Figure 2.17:Damages due to gusty winds in the wake of Thane in Puducherry 2011. (Source: http://www.spxdaily.com/images-lg/
cyclone-thane-india-jan-2012-afp-lg.jpg)

South Asia DisasterReport 2011
| 19 |
Figure 2.18: Mangled electricity transmission towers in Puducherry (www. archivenews.blogspot.com)
Figure 2.19:Thane cyclone disrupting electricity services in Puduchhery (www. archivenews.blogspot.com)
later5. The national and state authorities came
forward to the relief and rehabilitation of the af-
fected people. Tamil Nadu announced a recov-
ery package of Rs 700 crore to provide immedi-
ate succour to Cyclone Thane ravaged areas. The
amount was in addition to Rs 150 crore released
earlier for immediate relief work, including resto-
ration work of badly damaged infrastructure in
the coastal district of Cuddalore, most devastat-
ed by the cyclone, which claimed 47 lives in the
state and neighboring Puducherry. Authorities
stepped up relief work and efforts to restore nor-
malcy5.
References:1. South Asia Disaster report 2010. SAARC Disaster
Management Centre.
2. http://www.thebangladeshtoday.com/archive/
April%2011/5-4-2011.htm.
3. http://www.thedailystar.net/newDesign/latest_
news.php?nid=29210.
4. http://news.oneindia.in.
5. www.ibnlive.in.com.
6. http://www.asiantribune.com/news.
7. http://www.sott.net.
8. http://reliefweb.int.
9. http://thewatchers.adorraeli.com.
10. http://en.wikipedia.org/wiki/Cyclone_Thane.
11. http://www.webcitation.org/64KoCl7UT.
12. http://www.imd.gov.in/section/nhac/dynamic/
THANE.pdf.
13. http://www.nasa.gov/mission_pages/hurricanes/
archives/2011/h2011_Thane.html.
14. Punithavati J, Tamilenthi S and Baskaran R (2012)
A study of Thane cyclone and its impacts in Tamil
Nadu, India using Geographic Information System:
archives of Applies Scientific Research 4(1): 685-695.
15. http://bedroc.in/sites/default/files/IAG_TN_meet-
ing_minutes_5_Jan12-Cyclone_Thane.pdf.
16. www.ptinews.com.
17. http://www.indianexpress.com.

| 20 |
Introduction
Chapter 3
The South Asia region is one of the most flood
prone regions in the world. SAARC member
countries like Bangladesh, India, Sri Lanka and
Pakistan face floods on an annul basis. In these
countries, floods are a recurrent phenomenon,
and cause huge loss of lives and damage to liveli-
hood systems, property, infrastructure and public
utilities, thereby adversely affecting the econo-
mies of these countries. Floods in the SAARC
region claim thousands of lives in addition to
leaving millions homeless. It is a cause for con-
cern that the flood related damages are show-
ing an increasing trend in the region. Floods also
cause severe damages to bridges, buildings, road
network, distributory canals etc., in addition to
disrupting transportation and communication
systems and causing damages to crops and veg-
etation. Floods also cause the outbreak of epi-
Flood
demics and waterborne diseases in these coun-
tries. The frequency of major and catastrophic
floods in most parts of the South Asia region is
more than once in five years. In the SAARC re-
gion, floods have also occurred in areas, which
were earlier not considered to be flood prone.
This phenomena can be attributed to many rea-
sons including global warming, rapid increase in
population and urbanisation coupled with grow-
ing developmental and economic activities in
the flood plains of the region.
The Figure below shows the number of people
affected and killed due to floods in the SAARC
member countries during the year 2011(Fig:3.1).
The details of important flood events occurred
during the year 2011 in the SAARC member
countries are given below and the details of indi-
vidual events are tabulated in Appendix-III
Figure 3.1:Total number of people affected & killed due to Floods in SAARC Member Countries

South Asia DisasterReport 2011
| 21 |
Afghanistan During the year 2011, floodwaves started
much earlier in Afghanistan. Most parts of the
country witnessed heavy rains during February,
2011, which have led to much devastation, some-
thing which is unusual during this time of the
year. During the first half of February, 2011, flash
floods and heavy snowfall killed 25 people and
damaged up to 3,000 houses in different parts
of Afghanistan. Shindand district in the western
province of Herat was among the worst affected
areas where, in addition to four deaths over a
dozen people were injured and almost 2,600 fam-
ilies were affected. On 5th February, 2011, heavy
rains and flash floods in Parwan, Herat, Wardak
and Daykundi provinces in Afghanistan killed 25
people and caused damage to more than 3000
houses. Flash floods in Ghoryan and Injil districts
of western Herat province killed 3 people and
destroyed more than 360 houses. As many as
262 houses were devastated in Injil district alone.
Afghanistan National Disaster Management Au-
thority (ANDMA) provided each affected family
with 50 Kg of wheat, 25 kg of rice, 10 kg of ghee
and beans, one tent, a plastic rug and two blan-
kets. The flood also completely damaged the
Herat- Islam Qala road. On 6th February, 2011,
flash floods demolished 160 houses (95 houses
in Khah-i-Sufaid district and 65 in Pusht-i-Koh dis-
trict ) in the Farah province of Afghanistan. These
flash floods also demolished several other build-
ings and structures of the Farah province alone
and also killed several animals, besides causing
damage to large circle of agricultural land. On 8
February, 2011, floods in western Herat province
killed 6 people and caused huge damages to
hundreds of houses and thousands of hectares
of agricultural lands besides causing damage to
roads buildings and other infrastructure.
Tens of residential houses were destroyed
in rains and heavy floods in Ashmakash and
Chal districts of Takhar province on 12 April,
2011. Hundreds of acres of agricultural lands
were destroyed and many cattle also perished
in the event. These flash floods claimed doz-
ens of lives and washed many houses in the
southern Kandahar province also. Floods in
eastern Ghazni province destroyed a bridge
and blocked the Kabul-Kandahar highway
apart from washing away around 3,000 houses.
On 5 May, 2011, five members of a family were
among 7 people killed and 27 others injured as
a result of rain-induced floods, which washed
away huge tracts of arable land in western Af-
ghanistan. In central Parwan and Panjsher prov-
inces, floods closed roads and washed away
hundreds of acres of land.
Fig.3.2 : A helicopter with security personnel assisting rescue operations during Flash floods that killed 12 people on 9May,2011 in northern
Afghanistan (Source: Press TV)
Many houses were damaged in the Fan-
duqsan valley of Siah Gird district of Parwan
due to these floods. On 9 May, 2011, at least
12 people were killed due to flash floods un-
leashed by heavy rains in northern Afghani-
stan. Helicopters were pressed into service
for undertaking relief and rescue operations
(Fig 3.2)

| 22 |
IntroductionFlood
Flash floods caused by torrential rains killed
4 people and caused huge damage and losses
of property in different areas of eastern Kunar
province on 05 August, 2011. The floodwaters
also destroyed a bridge connecting the provin-
cial capital to several districts. The bridge con-
necting Nuristan province to Kunar was also de-
stroyed by the flood. Again on 29th August, 2011,
floods occurred again due to heavy rainfall in Na-
zyan district of eastern Nagarhar Province. All the
flood-affected families were provided with food
and other relief items. In addition to food items,
kitchenware, water pots, blankets and tarpaulins
were also distributed to the victims. The Rural
Rehabilitation & Development Department was
involved in supplying these relief items to the af-
fected families. The Afghan Red Crescent Society
and the World Food Program also provided the
affected families with relief supply assistance.
Reconstruction of all the buildings, retraining
walls and water channels that were destroyed
by these flash floods were taken up by the Gov-
ernment of Afghanistan in the areas hit by these
flood disasters.
On 28 August, 2011, a minor was killed and
dozens of houses were flattened and large areas
of cultivable land was washed away and dozens
of cattle were killed when flash floods caused by
heavy downpour hit several districts of Nangar-
har province4. The flash floods triggered by heavy
rains killed 3 people and swept away thousands
of acres of agricultural land in central Logar prov-
ince also. Districts including Mohammad Agha,
Baraki Barak and Charkh were the most affected
areas, where more than 10,000 acres of agricul-
tural land was destroyed. Most of the flood af-
fected land was cultivated with bean, potato, on-
ion and maize crops.
On 30 August 2011, floods in the eastern
province of Nangarhar also killed three people
and damaged eighty acres of agricultural land5.
The rainwater destroyed several bridges and
roads in the high way. Due to these floods Tork-
ham-Jalalabad highway was also damaged, seri-
ously disrupting the road transportation (Fig: 3.3).
Fig: 3.3 :A photo showing road transportation on Torkham-Jalalabad highway affected by Floods Source: PAN (GHAZNI CITY)
The heavy rains during 28-30 August,
2011 had also damaged many acres of
grape farms in southern Ghazni province
capital,Ghazni city6.The area has hundreds of
grape farms and local residents are depen-
dent upon grape farming. Rains and floods
destroyed all these grape farms last year also.
During these floods also, all farms of grapes in
the Andar district were completely damaged by
the heavy downpour. 10 houses and 90 acres of
land were also destroyed in Haiderkhel, Alikhel
and Qarakhel villages, where several domestic
animals were also killed. On 14 September, 2011,
heavy rains and floods caused severe losses
to residents of Paktika and Khost provinces. 4
houses were completely destroyed and 175
acres of cropped land was washed away in the
Guli Qala village, while tens of houses and 90
acres of land were also destroyed in Haiderkhel,
Alikhel and Qarakhel villages. Elsewhere in Khost

South Asia DisasterReport 2011
| 23 |
province, 36 people were killed, 53 others seri-
ously injured, 781 houses and 2,750 acres of land
were destroyed by these floods in different areas
of the province. In the eastern province of Nan-
garhar itself, nearly 641 houses were destroyed
and more than 900 acres of cropped land was
washed away by these floods. The floods also
killed many livestock besides damaging dozens
of reconstruction projects in Hesarak, Khogyani
& Chaparhar districts. More than 435 houses, 750
acres of land, 35 kilometres of water channels
and 20 water heads were also destroyed and 200
animals killed in Sarando, Nawar and Lagigar vil-
lages of Hesarak. These floods caused closure of
Kabul-Sorbe highway to the passengers. The pas-
sengers who were stranded in the highway faced
severe inconvenience including lack of food and
drinking water.
(Fig: 3.4 Floods kill two children, injured ten in CharikarSource: Bakhtar News Agency)
Two children lost their lives and 10 others
including 8 women were severely wounded in a
heavy flood that occurred due to heavy rainfall in
the vicinities of Charikar city (Fig.3.4) on 5th Oc-
tober7. In addition to human losses, hundreds of
residential houses and agricultural lands were
destroyed and a large number of cattle were also
perished due to these floods in the province. A
number of people whose houses were damaged
due to these floods were forced to shift to the
safer areas.
Bangladesh On 20 February, 2011, the dyke of Kachu-
patra Canal on the border of Kalapara upazila
of Patuakhali district and Amtali upazila of Bar-
guna district collapsed due to a high tide. Saline
water flooded at least 30 villages of these two
upazilas, causing severe damage to property and
crops. The affected villages include Karaibaria,
Kachupatra, Badurgachha, Sarik khali, Balaibunia,
Chaulapara, Hetalbaria, Angaria, North Jharakhali,
South Jharakhali, Behala and Alir Bandar. Water
Development Board (WDB) of the Government
of Bangladesh took up a project with Tk 3.41
crore to build dykes to save the agricultural lands
of these two upazilas from saline water of the
Bay.
On March 20, 2011, a powerful tidal surge
hit Sukhchar union embankment. The tidal
waters marooned at least 300 families at
three villages of Sukhchar union under Hati-
ya upazila. The surge also damaged crops
on about 700 acres of land at Nall Chira, Kela
Danga and Sukhchar upazilas. These tidal wa-
ters also flooded Galachipa, Baufal and Dash-
mina upazilas, damaging crops on hundreds
of acres. The embankment collapsed giving
way to tidal water which submerged all the
three villages. At least 300 landless people
were marooned while peanut, pulse, water
melon, cucumber, pumpkin and other crops
and vegetables went under saline water. In
Patuakhali also low-lying areas of three upazi-
las went under saline water due to tidal surge
causing severe damage to agriculture prop-
erty.

| 24 |
IntroductionFlood
Watermelon in about 500 acres of land was
damaged fully in Patuakhali district alone as tidal
surges under the influence of new moon entered
farmlands (Fig: 3.5). Even after receding of water
from some areas, watermelon continued rotting
due to the effect of salinity. According to the De-
partment of Agriculture Extension (DAE), Govern-
ment of Bangladesh, the watermelon was culti-
vated during this season on 2,800 acres of land in
Patuakhali district alone i.e., 1,000 acres in Gala-
chipa upazila, 450 acres in Kalapara, 550 acres in
Baufal, 600 acres in Dashmina, 100 acres in Sadar
upazila, 60 acres in Mirzaganj and 40 acres in
Dumki.
Tidal surges under the influence of full moon
also hit Paikgacha, Dumuria, Koira upazilas of
Khulna and Mongla upazila of Bagerhat on 20
March, 2011, inundating main roads (Fig: 3.6). Tid-
al water marooned over one lakh people while
the surge damaged several embankments, dwell-
ing houses, hundreds of shrimp enclosures and
crops on vast lands. The embankment at Boalia
under Paikgachha upazila collapsed due to pres-
sure of tidal water from Kobadak River inundat-
ing the entire fishermen's colonies at Hitampur
village and rendering over 200 families homeless.
The surges washed away over 300 shrimp enclo-
sures as water level of the river rised above the
danger mark. Paikgachha bazaar was also in-
undated completely. In Dumuria upazila, over
10,000 people were marooned as strong tidal
surges hit four villages of Shovna union. The riv-
er embankment constructed last year collapsed
due to pressure of water from the Ghengrial
River.The tidal surges also washed away over 200
shrimp enclosures in four affected villages. The
marooned people have taken shelter at differ-
ent neighbouring safe villages and on highlands.
Shikaribari embankment under Koira upazila also
collapsed, inundating six villages of Maheshwari-
pur union and rendering over 400 landless fami-
lies homeless. The surges washed away at least
200 shrimp enclosures and damaged crops in
about 500 acres of land.
(Fig: 3.5 A farmer gives a bleak look at his saline water affected watermelon field at Dakkhin Boalia village in Galachipa upazila of
Patuakhali district. Source: The Daily Star
Fig:3.6: A main road in Mongla town goes under water as tidal surge from the Bay overflows the adjacent Passur River.( Photo: STAR)
In Derai upazila, about 5000 acres of land in
Udgal haor went under water due to breaches
developed on the sluice gate at Ghilakutia. In the
neighbouring Dharmapasha upazila 2,000 acres
of cropland went under water after breaches
developed in Katakhali embankment on Chan-
drasonarthal haor. Locals joined work to repair
the breaches of the embankment with bamboos
and sand bags (Fig: 3.7). Most of the crop fields

South Asia DisasterReport 2011
| 25 |
in the haors of Sunamganj district were under
water during the period from March 25 to April
20, causing damage to boro crops worth more
than Tk 1127 crore on 193,000 hectares of land.
The Water Development Board (WDB) had given
Tk 20.1 crore for reconstruction and repair of
the 221 km length of embankments in Sunam-
ganj district . The work to protect boro croplands
inside 37 haors in the district began through
258 Project Implementation Committees (PIC)
formed with the locals.
Around 35,000 families, marooned in Bhola
during tidal surge due to depression in the Bay,
havd passed their days amid food and shelter
crisis. Tidal surges caused extensive damages to
the embankment having a paved road at Kak-
para in Pekua upazila under Cox's Bazar district
(Fig 3.8). Several thousand houses in Tulatoli,
Majher Char of Bhola Sadar, Syedpur of Daulat-
khan upazila, Char Nasrin of Tojmuddin uapzila,
Kolatolir Char, Char Nizam of Monpura upazila,
Char Kukri-Mukri, Dhalchar, Char Patila and Sik-
derer Char of Charfassion upazila went under 3
to 4 feet water. Many of the victims passed days
under the open sky as their houses were totally
damaged or washed away. Diarrhea and other
Fig: 3.7: Locals desperately try to repair the breached portion of the embankment at Katakhali on Thal haor (water body) in Chandrasona
under Dharmapasha upazila in Sunamganj district to save from flooding. Photo: STAR
water-borne diseases broke out in water-logged
areas due to lack of pure drinking water and
sanitation facilities. Around 5000 people were
affected with water-borne diseases. Temporary
medical teams were sent to the affected areas
and health officials of upazilas concerned formed
medical teams. According to the district relief of-
fice sources, the extent of loss caused by the de-
pression induced tidal surge was estimated at
Tk 50 crore in seven uapzilas of the district. Fifty
four kilometres of embankment of the Meghna
River was affected while 665 km kutcha road
and 27 km pucca road was damaged. Around
11,000 houses were damaged while 19,000 acres
of cropland went under water. Besides, 250 edu-
cational and religious institutions were affected
and fishes worth about 1 crore Tk washed away.
On 02 July, 2011, several thousand people
of the Netrakona district were marooned and
4000 dwelling houses were damaged due to
flash floods triggered by incessant rains. Low-
lying areas of the district went under water and
the flashflood washed away shrimp enclosures
and fish of various ponds. Standing Aush and
Aman crops were completely damaged due to
stagnant water on the cropland for a long time.
Fig 3.8:Tidal surge causing extensive damage to the embankment having a paved road at Kakpara in Pekua upazila under Cox's Bazar
district. Photo: STAR

| 26 |
IntroductionFlood
Erosion took a serious turn along the western
bank of hill river Someshwary in Dakumara vil-
lage of Durgapur upazila in Netrakona district
(Fig:3.9). Sudden swelling of the river following
heavy rains prompted the erosion. All the flood
affected people were shifted to safer places. The
badly affected areas were Dakumara, Khamarkh-
ali, Shibganj and Birishiri. Local people dumped
sand, bamboo and timber to protect their areas
but the strong currents of the river foiled all their
bids. Khamarkhali bazaar was once a big village
market . But the river had devoured two-thirds of
it. Over 500 families used to live at village Shib-
ganj before the event. But the river engulfed
800 acres of land leaving more than 350 families
homeless during the period. Loading and un-
loading of goods at Mongla port was severely
hampered. Low-lying areas of Sharankhola, Ram-
pal, Mongla, Kachua, Morelganj upazilas and the
district town were flooded. Due to rise of water
levels, erosion by Panguchi, Balleswar, Bhola and
Madhumati rivers took serious turns. Accord-
ing to the Department of Agricultural Extension
sources, standing crops on 1040 hectares, vege-
tables on 500 hectares and 5 hectares banana or-
chards were damaged due to rain-induced flash
floods.
Fig: 3.9: Erosion by Someshwary River, which took a serious turn and devours homesteads and croplands in Dakumara village of Netrakona
district. (Photo: STAR)
On 21 July, 2011, erosion by Jamuna in Ja-
malpur and Teesta in Rangpur rendered hun-
dreds of families homeless. Several hundred
families of Belgachha, Chinaduli and Noarpara
unions in Islampur upazila of Jamalpur have
shifted their houses due to severe erosion by Ja-
muna. During the period, people of Dakkhin Gila-
bari of Belgachha union of Islampur upazila bore
the brunt as erosion took a severe turn in the
area (Fig:3.10). At least 5,000 families of Dakkhin
Gilabari, Shaha Para of Belgachha union, Kadam-
toli Bazar of Chinaduli union and Ulia Bazar of
Noarpara union became victims to the Jamuna
erosion. Erosion by Padma and Dhaleswari rivers
also took a serious turn along 25 villages of eight
unions in Harirampur, Daulatpur, Shivalaya and
Ghior upazilas, rendering more than 700 families
homeless. Shelters built under the government
Ashrayan Project in Ghior Sadar lost more than
40 of its 80 structures into the river Dhaleswari
while the rest were endangered.
Erosion by Teesta River Erosion by the river Teesta took a serious turn
at Dhamur point, devouring around 300 feet of
Gangachhara embankment (Fig:3.11). Part of
the embankment went into the river during last
Fig: 3.10: Swelling Jamuna River eroding homesteads and farmlands at Dakkhin Gilabari in Belgachha union of Islampur upazila under
Jamalpur district.( Photo: STAR)

South Asia DisasterReport 2011
| 27 |
year's flood also, but locals saved it from further
collapse by putting sand bags in the breached
portion. According to the Water Development
Board (WDB), the sudden rise in water level in
the Teesta river this year caused heavy damage
to the embankment. Heavy flooding in south-
eastern Bangladesh forced more than 20,000
people out from their homes in Cox’s Bazar and
Teknaf districts as their homes were completely
destroyed by the floodwaters. Rice and shrimp
farmers were badly affected by the flooding, with
damage to the latter sector alone estimated at
over US$3 million.
On 30th July, 2011, heavy rains and on-rush
of water from hills across the border triggered
flash floods. Several thousand people at Teesta
and Dharla river basins and low- lying villages
went under water. The flood affected areas were
Dakkhin Goddimari, Char Dowani, Char Sindurna,
Char Dawabari, Paruliya under Hatibandha upazi-
la, Char Votmari, Char Kakina, Rudreshewar and
Jamirbari villages of Kaliganj upazila, Kadomtola,
Balapara, Char Gobordhan villages of Aditmari
upazila, Char Kurul, Mogholhat, Char Kulaghat,
Char Bowalmari, Rajpur, Char Kalmati, Khuniya
Gachh, Char Gokunda, Char Milon Bazaar villages
of Sadar upazila.
Fig: 3.11: With rise in water level in the Teesta River, around 300 feet stretch of Gangachhara embankment at Dhamur point in Rangpur
was eroded. (Photo: STAR)
Flash floods hit more than 50,000 people in
five upazilas of the Lalmonirhat district follow-
ing three consecutive days of heavy rain and
overflowing of two rivers, during 5 to 8 August,
2011 (Fig:3.12). The low-lying areas by the Teesta
and Dharla rivers bore the brunt. The most af-
fected areas were Angorpota and Dahagram of
Patgram upazila, Saniyazan, Goddimari, Sindurna
and Dawabari of Haitbandha upazila, Votmari
and Kakina of Kaliganj upazila, Mohishkhocha
and Durgapur of Aditmari upazila and Kulaghat,
Khuniyagachh, Rajpur, Mogholhat of Lalmonirhat
Sadar. Many roads went under water and a large
number of families lost their homes after water
in the Matamuhuri and Sangu Rivers rose signifi-
cantly above the danger level.
Parts of the capital city of Dhaka remained
flooded as the city struggled to cope with the af-
termath.West Nandipara area in the city of Dhaka
was worst affected(Fig:3.13). Due to the continu-
ous rains, viral fevers were spread and influenza
took a serious turn, affecting mostly the children.
At least 1.5 lakh people were affected due to flash
floods in Bandarban due to incessant rains and
water rushing down from hills. A vast area of all
the six unions--Aziznagar, Lama, Gazalia, Rupship-
ara, Fasiakhali, Sarai--in Lama upazila submerged.
Fig: 3.12: A villager at Durgapur of Aditmari upazila in Lalmonirhat shifting domestic animals to a safer place during Floods ( Photo: STAR)
| 28 |
IntroductionFlood
These sudden floods affected at least 4,000 fami-
lies in the upazila, and many people were report-
edly injured in the rush of flood waters. A num-
ber of government offices including Lama upazila
office, police station, agriculture office and food
stores went under waist-deep water.
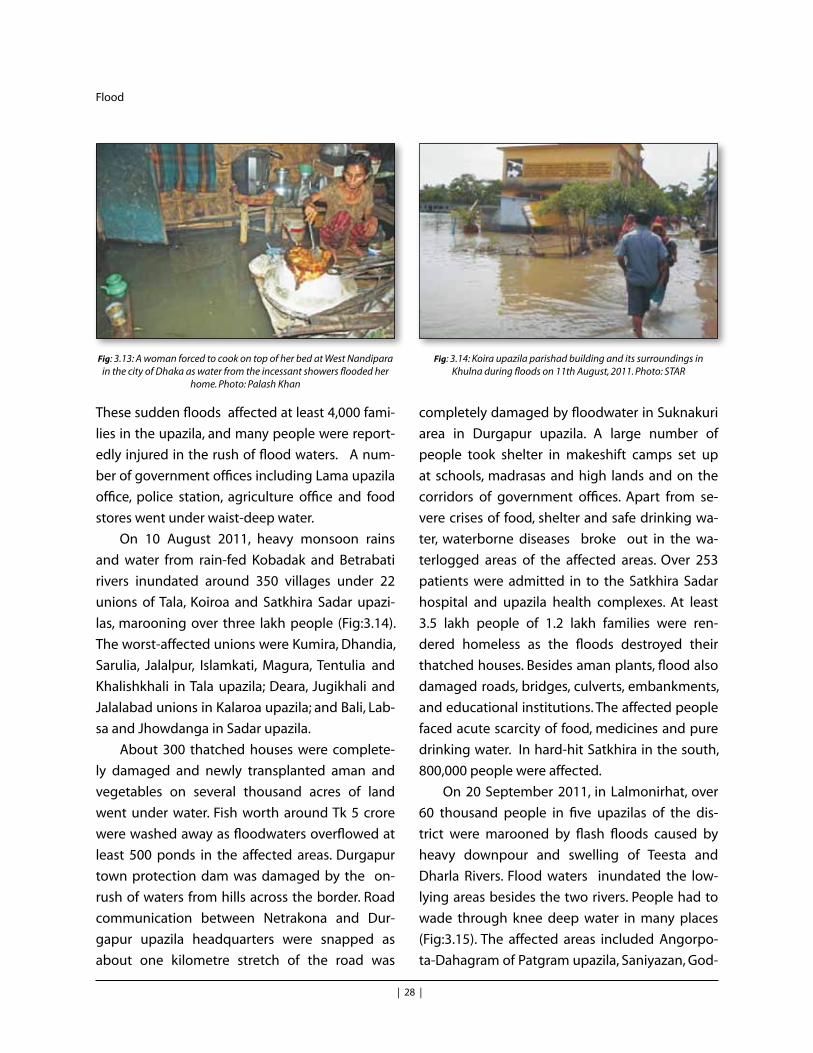
On 10 August 2011, heavy monsoon rains
and water from rain-fed Kobadak and Betrabati
rivers inundated around 350 villages under 22
unions of Tala, Koiroa and Satkhira Sadar upazi-
las, marooning over three lakh people (Fig:3.14).
The worst-affected unions were Kumira, Dhandia,
Sarulia, Jalalpur, Islamkati, Magura, Tentulia and
Khalishkhali in Tala upazila; Deara, Jugikhali and
Jalalabad unions in Kalaroa upazila; and Bali, Lab-
sa and Jhowdanga in Sadar upazila.
About 300 thatched houses were complete-
ly damaged and newly transplanted aman and
vegetables on several thousand acres of land
went under water. Fish worth around Tk 5 crore
were washed away as floodwaters overflowed at
least 500 ponds in the affected areas. Durgapur
town protection dam was damaged by the on-
rush of waters from hills across the border. Road
communication between Netrakona and Dur-
gapur upazila headquarters were snapped as
about one kilometre stretch of the road was
Fig: 3.13: A woman forced to cook on top of her bed at West Nandipara in the city of Dhaka as water from the incessant showers flooded her
home. Photo: Palash Khan
completely damaged by floodwater in Suknakuri
area in Durgapur upazila. A large number of
people took shelter in makeshift camps set up
at schools, madrasas and high lands and on the
corridors of government offices. Apart from se-
vere crises of food, shelter and safe drinking wa-
ter, waterborne diseases broke out in the wa-
terlogged areas of the affected areas. Over 253
patients were admitted in to the Satkhira Sadar
hospital and upazila health complexes. At least
3.5 lakh people of 1.2 lakh families were ren-
dered homeless as the floods destroyed their
thatched houses. Besides aman plants, flood also
damaged roads, bridges, culverts, embankments,
and educational institutions. The affected people
faced acute scarcity of food, medicines and pure
drinking water. In hard-hit Satkhira in the south,
800,000 people were affected.
On 20 September 2011, in Lalmonirhat, over
60 thousand people in five upazilas of the dis-
trict were marooned by flash floods caused by
heavy downpour and swelling of Teesta and
Dharla Rivers. Flood waters inundated the low-
lying areas besides the two rivers. People had to
wade through knee deep water in many places
(Fig:3.15). The affected areas included Angorpo-
ta-Dahagram of Patgram upazila, Saniyazan, God-
Fig: 3.14: Koira upazila parishad building and its surroundings in Khulna during floods on 11th August, 2011. Photo: STAR

South Asia DisasterReport 2011
| 29 |
dimari, Sindurna and Dawabari of Hatibandha
upazila, Votmari and Kakina of Kaliganj upazila,
Mohishkhocha and Durgapur of Aditmari upazila
and Kulaghat, Khuniyagachh, Rajpur, Mogholhat
unions in Lalmonirhat Sadar upazila.
On 21 September 2011, a Teesta river em-
bankment in Gannarpar area under Gangachara
upazila of Rangpur district collapsed, flooding
several villages and aman paddy fields (Fig:3.16).
The embankment collapsed due to heavy pres-
sure of water as the Teesta river swelled. Accord-
ing to the sources in the Water Development
Board (WDB), the water level in the Teesta marked
a sudden rise on 21 September, 2011. Erosion by
the river took a serious turn while floodwaters
Fig: 3.15: Women wade through knee-deep water at Etapota village in Mogholhat union under Lalmonirhat Sadar upazila as overflowing Teesta
and Dharla Rivers worsened flood situation in the district. Photo: STAR
Fig: 3.16: The embankment at Gannarpar in Gangachara upazila of Rangpur collapsed due to heavy pressure of swelling Teesta river water on
21 September 2011, flooding several villages of the upazila. Photo: STAR
washed away at least 200 thatched houses at dif-
ferent villages of the Gangachara upazila of Rang-
pur district. Floodwater also damaged vegetable
crops on several hundred hectares and most
aman seed-beds in the affected areas. At least 30
more dwelling houses and 200 hectares of culti-
vable land at Keshobpur and Igrampur villages
were devourd by the Ubdakhali River.
75% of Bangladesh is less than 10 metres
above sea level and 80% is flood plain, which
makes Bangladesh a nation very much at flood
risk and experiencing wide spread flood damag-
es. Every year, about 26,000 sq.km (around 18%)
of the country is flooded, killing over 5,000 peo-
ple and destroying more than 7 million homes.
To date, the floods took a debilitating toll on mil-
lions of people in Bangladesh. Agricultural fields
remained covered with standing water, which
has destroyed crops, seed stocks, livelihoods,
and employment opportunities. Fish, the main
source of protein, became scarce and expensive,
and food prices in general have increased 10 to
15 percent. Faced with food shortages, fami-
lies have drastically reduced the number and
quality of daily meals. Due to floods, countless
houses were damaged or destroyed, forcing the
displaced persons into makeshift shelters (e.g.,
schools, colleges, government buildings etc.) or
in impromptu camps along roadsides. Drinking
water was contaminated by standing flood wa-
ters, latrines were totally destroyed, sanitation
was totally affected, resulting in the out break of
waterborne diseases.
INDIA India is one of the most Flood affected countries
in the world, after Bangladesh. In India, out of the
total geographical area of 329 mha, more than 40
mha is flood prone. Floods are a recurrent phe-

| 30 |
IntroductionFlood
nomenon in most parts of India, which cause huge
loss of lives and damage to economy, livelihood
system, property, infrastructure and public utilities
in the Country. On an average every year, around
75 lakh hectares of land is affected, 1600 lives
are lost and the damage caused to crops, houses
and public utilities is around INR1805 crores due
to floods. Over a period of time, the flood related
damages are showing an increasing trend in India.
The annual precipitation over India (includ-
ing snowfall) is estimated at 4,00,000 crore cubic
meters (4,000 Billion Cubic Meters [BCM]) with
the seasonal rainfall in the monsoons being of
the order of 3,00,000 crore cubic meters (3,000
BCM). The country receives maximum rainfall
during the south-west (SW) monsoon for a pe-
riod of about 80 to 100 days, starting from the
first week of June to the end of September. Nor-
mal area-weighed rainfall over the Indian land
mass is 89 cms during this period. Around 80 per
cent of the annual total rainfall over India occurs
in the SW monsoon season. The balance (20 per
cent) rainfall is mainly due to convective activi-
ties in the pre-monsoon period (March-June) in
the form of local storms/thunderstorms, cyclones
and post-monsoon cyclones (October-mid De-
cember).Winter rains/snowfall over the northern
part of India caused by western disturbances and
the northeast (NE) monsoon in the state of Tamil
Nadu and adjoining region also contribute to the
remaining total rainfall. The normal annual rain-
fall varies from less than 600 mms in the north-
western part to over 2,500 mms in the north-
eastern part. It varies from about 1,200 mms in
the north to 2,900 mms in the south.
Causes of Floods in India
Inadequate capacity of the rivers to contain
within their banks and the high flows brought
down from the upper catchment areas following
heavy rainfall, leads to flooding. The tendency to
occupy the flood plains has been a serious con-
cern over the years. Because of the varying rain-
fall distribution, many a time, areas which are not
traditionally prone to floods are also experienc-
ing severe inundations. Areas with poor drainage
facilities get flooded by accumulation of water
from heavy rainfall. Excess irrigation water ap-
plied to command areas and increase in ground
water levels due to seepage from canals and ir-
rigated fields also are factors that accentuate
the problem of water-logging and Flooding. The
problem is exacerbated by factors such as silting
of the riverbeds, reduction in the carrying capac-
ity of river channels, erosion of beds and banks
leading to changes in river courses, obstructions
to flow due to landslides, synchronisation of
floods in the main and tributary rivers and retar-
dation due to tidal effects etc.
The year 2011 experienced severe Floods in
the states of Assam, West Bengal, Kerala, Karna-
taka, Bihar, Uttar Pradesh and Odisha.
Assam
In Assam, floods affected around 30 thousand
people and submerged vast tracts of agricultural
land in Lakhimpur, Sonitpur, Jorhat and Morigaon
districts. Incessant rains in Assam and neighbour-
ing Arunachal Pradesh resulted in flooding of
the dozens of villages in Assam. The overall flood
situation in Dhemaji and Lakhimpur districts in
Assam, became grim following the rains during
July, 2011 . A few areas of Sonitpur district were
also badly affected. Incessant rains in the affected
districts and the catchments of the neighbour-
ing areas flooded new areas and disrupted roads.
Brahmaputra and its tributaries, Jia Bharali and
Suwansiri flowed above the Danger level at vari-

South Asia DisasterReport 2011
| 31 |
ous places. The surface communicatios at a num-
ber of places in Dhemaji and Lakhimpur districts
were also disrupted. The breaches of embank-
ment at Na-river in Dhemaji resulted in flooding
of new areas. The Baaghinijaan river washed away
a part of National Highway at Padumani in Lakh-
impur district. Low lying areas of the Kaziranga
National Park and Pobitara Park in Morigaon dis-
trict reeled under the impact of floods. A total of
2,11,410 people in 197 villages were severely af-
fected by floods in the Subansiri, Drupang, Ranga-
nadi rivers and other tributaries of the Brahmapu-
tra river following heavy downpour in the hills of
neighbouring Arunachal Pradesh. Assam govern-
ment alerted all its departments and agencies
in time. Relief materials, medical and NDRF teams
rushed to all the affected districts. Over 1.5 lakh
people took shelter in various relief camps organ-
ised by the government. The Chief Minister of As-
sam, Mr. Tarun Gogoi made an aerial inspection
of the flood-hit areas of Lakhimpur, Dhemaji and
Jorhat districts and the Kaziranga National Park
(Fig:3.17). The state Health department took spe-
cial care to prevent the spread water borne and
water related diseases and Japanese Encephali-
ties in all the affected areas .
Fig: 3.17: Flood Havoc in Assam: Chief Minister Shree Tarun Gogoi making an aerial survey of flood-hit Lakhimpur district.(Source: The Hindu)
West Bengal
Incessant rains during the 3rd week of June, 2011
led to a flood-like situation in many parts of West
Bengal. Parts of Bankura, Paschim Medinipur and
Hooghly districts and the Sunderbans were affect-
ed as they experienced heavy rainfall. More than
500 villages in North and South 24 Parganas dis-
tricts were affected with breaches occurring in the
embankments of several rivers. Seventeen persons
lost their lives and around nine lakh people were
affected due to these floods . However, the situa-
tion was monitored effectively by the government
of West Bengal and the concerned district admin-
istrations took timely and appropriate measures.
Kerala
Heavy rains lashed many parts of Kerala and
claimed 23 lives during the onset of south-west
monsoon on 27th May, 2011, besides causing
large-scale loss to agriculture crops and prop-
erty. Most casualties, which were mainly due
to drowning in swelling rivers and flash floods,
were reported from Alappuzha and Kottayam
districts of the state. Due to the heavy rain fall
in Kuttanad, the state's rice bowl in Alappuzha
district in central Kerala, many low laying plac-
es were inundated and water has entered in to
the houses in low lying areas. Vehicular traffic
in Alappuzha and Changanassery road was dis-

| 32 |
IntroductionFlood
rupted as water blocked and stagnated in many
places. 155 houses were damaged in rain relat-
ed incidents in Kottayam district . In Alappuzha
district, about 450 houses were submerged in
a bund breach in the Kombankuzhi paddy pol-
der near the Tirumala ward. Crop loss was esti-
mated to be INR.5.53 crore. To help the affected
people, district authorities opened 13 and 16
relief camps in Alappuzha and Kottayam dis-
tricts respectively. More than 4600 people from
434 families were accommodated in these relief
camps.
Karnataka
In Karnataka, rain fury in the State on 12th May,
2011claimed 54 lives besides leaving a trail of
destruction on standing crops on 4,594 hectares
of land and damaging 1,192 houses. As many as
332 cattle had also died. The crop losses included
agricultural crops on 4,331 hectares and horticul-
tural crops on 263 hectares.
Bihar
The flood situation on 1st October, 2011 cre-
ated havoc in Bihar , with the death toll rising
to 98. Of the 98 deaths, 14 were from Bhagalpur,
12 from Bhojpur, 10 from Samastipur, nine from
Saharsa, 11 from Begusarai and eight each from
West Champaran and Lakhisarai districts. Six
persons died each in Khagaria and Madhubani
districts, four in Vaishali, three in Madhepura,
two each in Darbhanga and Muzaffarpur dis-
tricts, one each in Patna, Purnea and Supaul. The
situation worsened in Madhubani, Sitamarhi
and Darbhanga districts following rains in the
catchment areas of the Adhwara group of rivers
in Bihar and Nepal. More than 150 villages were
affected in Kamtaul, Gaurabauram, Jale, Baha-
durpur, Hanuman Nagar, Keoti, Darbhanga Sadar
and Singhwara of Darbhanga district. The Bihar
State Disaster Management Department has
made elaborate arrangements for rescue and re-
lief operations.
Odisha
Nearly 30 lakh people in 19 of Odisha's 30
districts were badly affected during the 2011
floods. The coastal districts of Cuttack, Ken-
drapara and Jagatsinghpur were inundated
by floods on 11th September, 2011, because
a huge volume with 14.05 lakh cusecs of
floodwater flowed through the Mahanadi at
Baramul, less than 100 km from Cuttack (Fig:
3.18). Many low lying areas in northern parts
of the state were also marooned due to flood
waters. Moreover a low pressure area was
formed over North West Bay of Bengal and ad-
joining coastal areas of West Bengal and north
Odisha. More than 50,000 people in 25 villages
in Remuna and sadar blocks of Balasore dis-
trict were surrounded by floodwaters of Bud-
habalanga and its tributary Sono. According to
the State government sources, 2,550 villages
and 13 towns were affected by the floods. At
least 8 persons have lost their lives. Besides,
3 persons were swept away in Nayagarh dis-
trict. The floods damaged 10,565 houses in
Bargarh, Boudh, Deogarh, Jajpur, Nuapada
and Sambalpur districts. About 60,000 people
were evacuated from low-lying areas to safer
places and provided with food, shelter, medi-
cines, water supply and sanitation. More than
one lakh people were evacuated from low ly-
ing areas to safe places and given food as 186
relief camps/free kitchens were opened in ma-
rooned villages. The State government took
assistance from the Navy to carry out rescue
operations.

South Asia DisasterReport 2011
| 33 |
Fig: 3.18: A photo depicting a man treading through the flood waters at Kendrapara during September, 2011 floods in Odisha
(Source: The Hindu)
Odisha government air-dropped food pack-
ets in the flood affected areas. The Odisha Chief
Minister Naveen Patnaik along with the state
Revenue and Disaster Management minister S N
Patro made an aerial survey of flood hit areas and
reviewed the relief arrangements made by the
administration.The Chief Minister directed the
collectors of the flood-hit districts to start resto-
ration and reconstruction work immediately. He
also asked the Collectors to start labour-intensive
works in the flood affected villages under the
Centrally sponsored Mahatma Gandhi National
Rural Employment Guarantee Scheme . The state
government also issued directions to the dis-
trict collectors to close schools in their respective
areas in view of the flood situation. About 500
weak points were identified on river banks and
embankments which were prone to breaches. At
least 16 persons, five from Jajpur district, three
each from Kendrapara and Mayurbhanj districts,
two each from Dhenkanal and Sambalpur district
and one person in Bhadrak district, died in the
floods. The flood affected districts are shown in
the map (Fig:3.19):
Nepal During the year 2011, Nepal witnessed inces-
sant rains, which caused floods and landslides.
The Government of Nepal, during the year estab-
lished a National Emergency Operation Center
(NEOC) with financial assistance from the Austra-
lian government and technical assistance from
the UNDP. The NEOC collects, processes and dis-
seminates information related to all types of di-
sasters in the country. It was also entrusted with
the responsibility to coordinate with national
and international organizations to carry out
works related to disaster risk reduction and relief
operations in the event of natural calamities. Ac-
cording to data compiled by NEOC, at least 56
people were killed, 17 went missing and 80 oth-
ers injured and a total of 3700 households were
affected following landslides, floods and thun-
derbolts triggered by incessant rainfall in the
month of June, 2011. 26 persons died after being
struck by thunderbolts. 121 houses were com-
pletely destroyed due to landslides and floods
between June 1 and July 6. The NEOC, based on
the reports from the concerned district adminis-
tration offices across the country, has estimated
loss of properties worth Rs 24.6 million.
In another incident, at least 10 persons died
and one went missing in rain related incidents
in various parts of the country on 20 July, 2011. Fig: 3.19: A Map showing the districts which are affected by Flood of
2011.(Source: Govt. of Odisha)

| 34 |
IntroductionFlood
Four members of a family died when a landslide
triggered by incessant rain swept away a house
at Narjamandap VDC-5 in Nuwakot district on
20 July, 2011. A rescue team of the Nepal Army
extricated the victims’ bodies. The landslide had
left 24 houses in the settlement at high risk. Fol-
lowing continuous rainfall during August 12 to
16, the swollen Mahakali river had swept away
over a dozen houses and flooded various areas
in VDCs in Kanchanpur and Dadeldhura districts
(Fig:3.20). Many settlements in Bhimdatta mu-
Fig: 3.20: Mahakali river flooded various areas in Kanchanpur and Dadeldhura districts in Nepal (Source: - Kantipur News, Kanchanpur)
nicipalities in Kanchanpur district were evacu-
ated to safer areas as the Mahakali river flooded
the areas. Several settlements in Kailali, Kan-
chanpur and Dadeldhura districts were inundat-
ed. Swollen rivers burst banks and entered the
settlements, displacing dozens of households. In
Kanchanpur, floods in the Mahakali, Doda and
Banhara rivers breached the embankments and
entered settlements near the banks. Dozens of
families were displaced. Major highways in the
region were blocked by landslides in several
places. The Bhimdutta highway, KI Singh highway,
Mahakali highway and Jayaprithvi highway were
also blocked, leaving hundreds of passengers
stranded.
Pakistan Pakistan witnessed severe floods during this
year also, leaving some 200,000 people homeless
and triggering another international aid effort.
Though the scale of the disaster was less than
that of the last year, the misery for those effected
continued. Pakistan called on the world to speed
up relief efforts after torrential rains exacerbat-
ed major floods, killing 270 people and making
another 200,000 homeless in the south of the
country.
Three persons, including two women, were
killed and dozens of others were injured in rain
related incidents in different parts of Balochistan
on 10 July, 2011. Rains disrupted the power sup-
ply and communication links in several districts
of the province. According to the government
sources, several districts of Balochistan, includ-
ing Zhob, Barkhan, Loralai, Musakhel and others
received heavy monsoon showers. In Barkhan,
streams swelled due to heavy rainfall, swept
away a number of vehicles. Floodwaters also
washed away a road connecting Zhob to Mu-
sakhel, leaving hundreds of commuters strand-
ed. Heavy rains also adversely affected services
provided by mobile companies while landline
phones were also rendered out of order, adding
to the miseries of people who were deprived of
the facility to contact their friends and relations.
Eight people, including a woman and four
children, died in Rawalpindi and Islamabad af-
ter heavy rains lashed the twin cities on 25 July,
2011, as water rose to dangerous level in Leh Nul-
lah inundating low-lying localities. In Rawalpindi,
three persons, including a policeman trying to
save a young man from drowning in Leh Nullah,
were swept away. In Islamabad’s suburb, roof of a
mud house collapsed, killing five wedding guests,
including four children. Many low-lying locali-
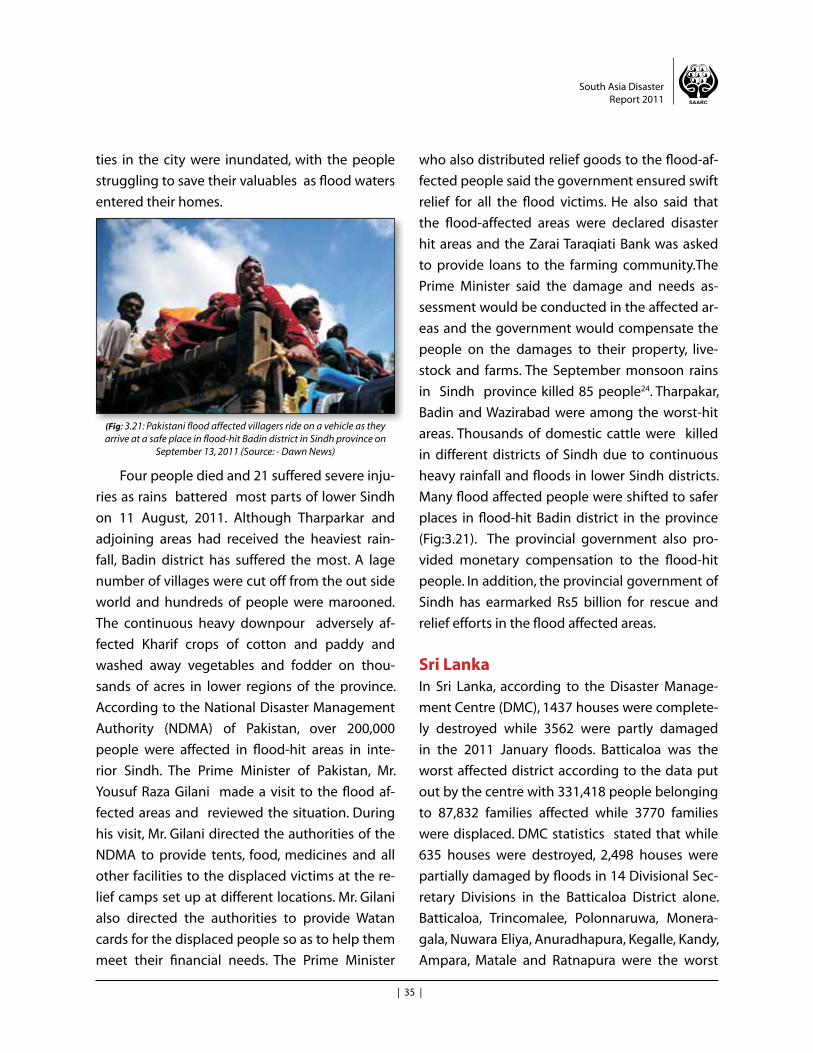
South Asia DisasterReport 2011
| 35 |
ties in the city were inundated, with the people
struggling to save their valuables as flood waters
entered their homes.
(Fig: 3.21: Pakistani flood affected villagers ride on a vehicle as they arrive at a safe place in flood-hit Badin district in Sindh province on
September 13, 2011 (Source: - Dawn News)
Four people died and 21 suffered severe inju-
ries as rains battered most parts of lower Sindh
on 11 August, 2011. Although Tharparkar and
adjoining areas had received the heaviest rain-
fall, Badin district has suffered the most. A lage
number of villages were cut off from the out side
world and hundreds of people were marooned.
The continuous heavy downpour adversely af-
fected Kharif crops of cotton and paddy and
washed away vegetables and fodder on thou-
sands of acres in lower regions of the province.
According to the National Disaster Management
Authority (NDMA) of Pakistan, over 200,000
people were affected in flood-hit areas in inte-
rior Sindh. The Prime Minister of Pakistan, Mr.
Yousuf Raza Gilani made a visit to the flood af-
fected areas and reviewed the situation. During
his visit, Mr. Gilani directed the authorities of the
NDMA to provide tents, food, medicines and all
other facilities to the displaced victims at the re-
lief camps set up at different locations. Mr. Gilani
also directed the authorities to provide Watan
cards for the displaced people so as to help them
meet their financial needs. The Prime Minister
who also distributed relief goods to the flood-af-
fected people said the government ensured swift
relief for all the flood victims. He also said that
the flood-affected areas were declared disaster
hit areas and the Zarai Taraqiati Bank was asked
to provide loans to the farming community.The
Prime Minister said the damage and needs as-
sessment would be conducted in the affected ar-
eas and the government would compensate the
people on the damages to their property, live-
stock and farms. The September monsoon rains
in Sindh province killed 85 people24. Tharpakar,
Badin and Wazirabad were among the worst-hit
areas. Thousands of domestic cattle were killed
in different districts of Sindh due to continuous
heavy rainfall and floods in lower Sindh districts.
Many flood affected people were shifted to safer
places in flood-hit Badin district in the province
(Fig:3.21). The provincial government also pro-
vided monetary compensation to the flood-hit
people. In addition, the provincial government of
Sindh has earmarked Rs5 billion for rescue and
relief efforts in the flood affected areas.
Sri LankaIn Sri Lanka, according to the Disaster Manage-
ment Centre (DMC), 1437 houses were complete-
ly destroyed while 3562 were partly damaged
in the 2011 January floods. Batticaloa was the
worst affected district according to the data put
out by the centre with 331,418 people belonging
to 87,832 families affected while 3770 families
were displaced. DMC statistics stated that while
635 houses were destroyed, 2,498 houses were
partially damaged by floods in 14 Divisional Sec-
retary Divisions in the Batticaloa District alone.
Batticaloa, Trincomalee, Polonnaruwa, Monera-
gala, Nuwara Eliya, Anuradhapura, Kegalle, Kandy,
Ampara, Matale and Ratnapura were the worst

| 36 |
IntroductionFlood
affected. The number of people displaced owing
to torrential rains and the attendant disasters in
the Eastern and North Central Provinces and sev-
eral other districts has risen to 900,000 persons25.
In all, 13 districts were affected by torrential rains.
These rains claimed 13 lives and 44 received se-
vere injuries. Kandy, Matale, Nuwara Eliya, Badul-
la, Ampara, Batticaloa and Trincomalee Districts
were the most affected. All the displaced persons
were accommodated at 350 government-run
welfare centres. The government allocated Rs. 7.1
million for the provision of relief to the affected
persons. The majority of the displaced families
were residents of the Batticaloa District. All the
major reservoirs were brimful and their sluice
gates were open.The Army was deployed to pre-
vent the breach of the tank bund of ‘Eruwewa’
in the Anuradhapura District. Swift intervention
by the Army helped to prevent the breach and
averted a major disaster.
References:1. EMDAT www.emdat.be
2. http://en.wikipedia.org/wiki/Flood#Principal_
types_and_causes.
3. New Age.
4. The Daily Star.
5. The Frontier Post, Jalalabad (AIP)
6. PAN (GHAZNI CITY))
7. Bakhtar News Agency (Charikar)
8. The Independent.
9. Kuensel Newspaper.
10. http://www.nidm.gov.in/Chap6.htm.
11. Memorandum: Floods 2011 Relief Commissioner,
Revenue and Disaster Management Department,
Govt. of Odisha, 2011
12. Additional Memorandum: Floods 2011 Relief
Commissioner, Revenue and Disaster Manage-
ment Department, Govt. of Odisha, 2011.
13. Hydro geological Atlas of Orissa, Central Ground
Water Board, Ministry of Water Resources, South-
Eastern Region, Government of India, 1985 .
14. The Times of India.
15. NDTV News.
16. DD News.
17. The Tribune.
18. The Hindu.
19. The Hindustan Times.
20. www.myrepublica.com.
21. The Himalayan Times.
22. Kantipur Times.
23. The Frontier Post.
24. Dawn News
25. Daily News.

South Asia DisasterReport 2011
| 37 |
An OverviewDrought is a natural, recurring climatic feature
which stems from lack of rainfall over an extend-
ed period of time (i.e. a season or several years
resulting in severe shortage of water resources). It
occurs almost in all climatic regions of the world.
Drought is a normal phenomenon in arid zone
areas, a common phenomenon in semi-arid zone
areas and a rare to very rare phenomenon in dry
humid and humid areas. It is a natural disaster,
which can be anticipated and also expected on
the basis of rainfall patterns, temperature etc.
Drought connotes a situation of water short-
age for human, cattle and agriculture consump-
tion resulting in economic losses, primarily in
agriculture sector. Drought is classified as Meteo-
rological, Hydrological, Agricultural and Environ-
mental drought. Unlike the Hydrological and Ag-
ricultural droughts, the Meteorological Drought,
which connotes specific rainfall reduction below
19% of normal rainfall, may not necessarily have
any serious impact if the departure from nor-
mal is not significant and the rainfall is sufficient
enough to sustain soil moisture. The mechanism
for anticipating and managing droughts nec-
essarily differs from similar arrangements con-
cerning other natural disasters (like cyclones,
earthquakes, floods, cloudbursts, tsunami etc) or
man-made disasters, for the following reasons:
• Slow onset and prolonged course of
droughts as against the other disasters, which
have rapid onset, and a limited duration;
• Early warning indicators in case of droughts
are necessarily ambiguous because they may
or may not culminate in a full blown drought
Drought
disaster;
• Duration may range from months to years and
the core area or epicentre changes over time,
reinforcing the need for continuous monitor-
ing of climate and water supply indicators;
• No single indicator or index can identify pre-
cisely the onset and severity of the event and
its potential impacts; multiple indicators are
more effective and
• Spatial extent is usually much greater than
that for other natural hazards, making assess-
ment and response actions difficult, since
impacts are spread over larger geographical
areas Unlike other natural disasters the onset
of drought is slow and many times is not vis-
ible but it has a very serious impact on the
economy due to its intensity and longer du-
ration over a period of time.
Drought in the South Asia RegionDrought affects more people than any other
disaster in the South Asia region. South Asia
comprises some of the major drought affect-
ed regions of the world. Approximately 40% of
the world’s poor live in the South Asia and the
drought disasters are of recurring type in this re-
gion. Approximately 23% of the world’s popula-
tion live in the SAARC region, comprising of the
countries i.e., Afghanistan, Bangladesh, Bhutan,
India, Maldives, Nepal, Pakistan, and Sri Lanka .
SAARC region also sustains world’s poorest peo-
ple since it contributes less than 1.5% of world’s
GDP. Majority of the SAARC Region is prone to
periodical and continuous droughts. A severe
drought will exacerbate existing problems of
Chapter 4

| 38 |
IntroductionDrought
poverty, and have a devastating effect on the
lives of the most vulnerable people in the re-
gion. Hence, there is an acute need of long term
assessment of the drought prone areas in these
countries for formulation and implementation
of drought mitigation programmes. One of the
most effective ways of tackling the problems
of drought in the SAARC region is to ensure ad-
equate water for agriculture sector through vari-
ous water harvesting and conservation meth-
ods and techniques. The water resources of any
country are fixed. The demands for fresh water
resources in the region are increasing. Since we
cannot increase the availability of water resourc-
es in any region, the only option is to conserve
the available water and use it effectively and effi-
ciently through an efficient water supply, storage
and distribution mechanisms and reducing loss-
es by following various conservation techniques.
Agriculture is the main source of livelihood
in the SAARC region and it sustains vast major-
ity of population by providing direct and indirect
employment. Majority of areas in the SAARC re-
gion are under rain fed agriculture which contin-
ues to face more challenges in terms of droughts.
Failed monsoon or deficient rain cycles often
lead to drought in the SAARC region, as a result
of which, droughts are perennial and more fre-
quent in the SAARC region. In the recent years
Afghanistan faced continuous drought during
1997-2002 and 2007-08 which reduced agricul-
tural production by about thirty percent in that
country. India faced severe droughts in 2002 and
2009, during which the Agriculture sector in the
country was badly affected. Pakistan encountered
severe droughts during 1998-2001 in the entire
provinces of Sindh and Baluchistan. Similarly Ban-
gladesh also faced drought during 1994-95 and
2009, Nepal in 2006 and 2009 and Sri Lanka on
2001 and 2004. Maldives also faced hydrological
droughts during dry seasons in recent times. Cli-
mate projections indicate increased frequency of
severe droughts in the near future in the SAARC
region. According to the IPCC, severe heat waves
are expected to increase everywhere, as a result of
which, South Asian countries, especially the coun-
tries like Afghanistan, India, Pakistan and Sri Lanka
are going to be worst affected by drought, wheth-
er due to natural climate variability or climate
change. The impact of drought on these countries
is more than any other natural disasters both in
terms of area affected, number of people affected,
development suffered and loss to the economy.
Recurrent droughts in the region are severely
affecting the economies of the SAARC member
countries. Large parts of southern Afghanistan,
the province of Baluchistan in the remote south-
western region of Pakistan and several states of
India experienced drought, caused by poor rain-
fall. The lack of sufficient rains means that local
water sources dry up and there is very little veg-
etation for grazing. This leads to substantial loss
of livestock and distress selling of livestock by
the poor farmers in these regions. This adds to
the existing problem of poverty in these areas
and causes considerable strain on the natural
resources. Because of successive droughts, the
general health of the population in the affected
areas has also declined, with rising levels of mal-
nutrition due to the poor diet on which many
people are subsisting. The scenario of drought
during the year 2011 in each of the SAARC mem-
ber countries is briefly described below:
Afghanistan Afghanistan is a land locked and mountainous
country. The presence of mountains causes lot
of variations in terms of climate and rain fall and

South Asia DisasterReport 2011
| 39 |
snow fall in Afghanistan. Over 80% of the an-
nual precipitation falls as snow in the mountain
ranges of central Afghanistan. The variation of
rainfall is both temporal and spatial. Afghanistan
is not having good water storage, distribution
mechanisms and lacking irrigation facilities.
In Afghanistan , out of 65 million ha. of area,
total agricultural land is 40 million ha. Arable
land is 7.9 million ha and the cultivation land is
estimated at 3.5 million ha only. Irrigated land
is 1.8 million ha, total arable land rain fed is 1.7
million ha and the range lands is approximately
30 million ha.
Water shortage and its after effects pose
a threat of severe food crisis and migration in
Afghanistan. Afghanistan frequently experiences
moderate drought conditions. Though the im-
pact of drought felt in all sectors in natural, social,
economic and political components, the effect of
drought on agricultural production and food secu-
rity in Afghanistan is very high. The extreme pov-
erty and underdevelopment in Afghanistan makes
the population more susceptible during droughts.
During the last decade, the country faced
acute food shortages induced by drought in sev-
eral parts of the country. Crop production was
decimated and agricultural livelihoods came to a
standstill and these cascaded a chain of adverse
events like acute food grain supply, mass migra-
tion, conflict among the people and draining
of the economy that was already crippled. The
hardest drought hit provinces in Afghanistan
were Nangarhar, Takhar and Laghman provinces.
During the year 2011, though Afghanistan was
not affected by severe drought, the food security
in the country became stressed1. Rainfed zones
of central highlands (Day Kundi, Bamyan, and
Ghor), northeast (Badakhshan), and western Af-
ghanistan (Hirat) were also affected by poor rain-
fed wheat harvest during the year 2011. The food
security conditions in Afghanistan are shown in
the figure below, which indicates that the impact
of drought on household food security is limited
as the primary source of food is from the market
rather than food harvest from the drought affect-
ed areas (Fig:4.1).
Fig 4.1: Afghanistan Food Security Map (Source: FEWS-Net)

| 40 |
Introduction
The Government of Afghanistan has pre-
pared a comprehensive strategy and policy to
face drought and desertification in the country.
The following are some of the short term and
long term initiatives taken by the Government of
Afghanistan to mitigate drought in Afghanistan:
Short Term Initiatives• Technology to promote drip & sprinkler irri-
gation systems.
• Implementation of reforestation program
across relevant areas.
• Multiplication of drought tolerant cereals va-
rieties specially wheat & maize.
• Implementation of national grain reserve
strategies.
• Improvement of watershed management
systems.
Long Term Initiatives:• Integration of macro & micro dam programs
• Sustainable rangeland grazing / systems
• Water management system to broad acreage
• Cultivation of fodder and foliage crops
Further, the following actions are also being implemented:
• Promotion of CBNRM for soil, vegetation &
water management.
• Protection of water sources & strategic man-
agement of water supply systems.
• Harvesting of rain & water formed from snow
melt to improve the situation.
• Promoting varieties of crops that are resis-
tant to water shortage.
• Encourage double/triple cropping in irrigat-
ed areas, in particular.
• Release of winter facultative wheat varieties.
• Establish and manage a strategic grain re-
serve.
• Ensure additional supplies of fodder and
feed.
Drought
BangladeshBangladesh is one of the most disaster-prone
countries in the world. Every year, the country ex-
periences disasters of one kind or another, such
as tropical cyclones, storm surges, floods, torna-
does and droughts, causing heavy loss of lives
and properties. Though Bangladesh is a water
rich country, drought also occurs in many parts
in the country. An estimated 2.7 million hect-
ares is severely drought prone in Bangladesh.
Normally, Bangladesh experiences a dry period
for seven months in a year (i.e., from November
to May), when rainfall is normally low. In Bangla-
desh, westernmost and easternmost parts are
prone to drought while the menace is less mani-
fested in the central part of the country. Drought
affects 30% of the area and 10% of the national
food production. Despite recurrent and devas-
tating droughts in Bangladesh, it has attracted
less attention than floods and cyclones, to which
Bangladesh is more prone. Nevertheless, drought
is also a serious problem in Bangladesh and the
Government and scientific community in Ban-
gladesh are paying due attention to drought
management. To combat the drought, it is essen-
tial for Bangladesh to utilize its water resources
(both surface and ground water resources) ef-
fectively. However, Bangladesh has increasingly
used her ground water resources to such an ex-
tent that the depletion of ground water resourc-
es as well as arsenic contamination is occurring
at an alarming rate. Under these circumstances,
there is no alternate but to use surface water to
meet the water deficit created by drought. Dur-
ing the year 2011, the water shortage led to
stream flow reduction and depletion of ground
water and evaporation exceeded normal levels
and these drought conditions resulted in crops
damage.
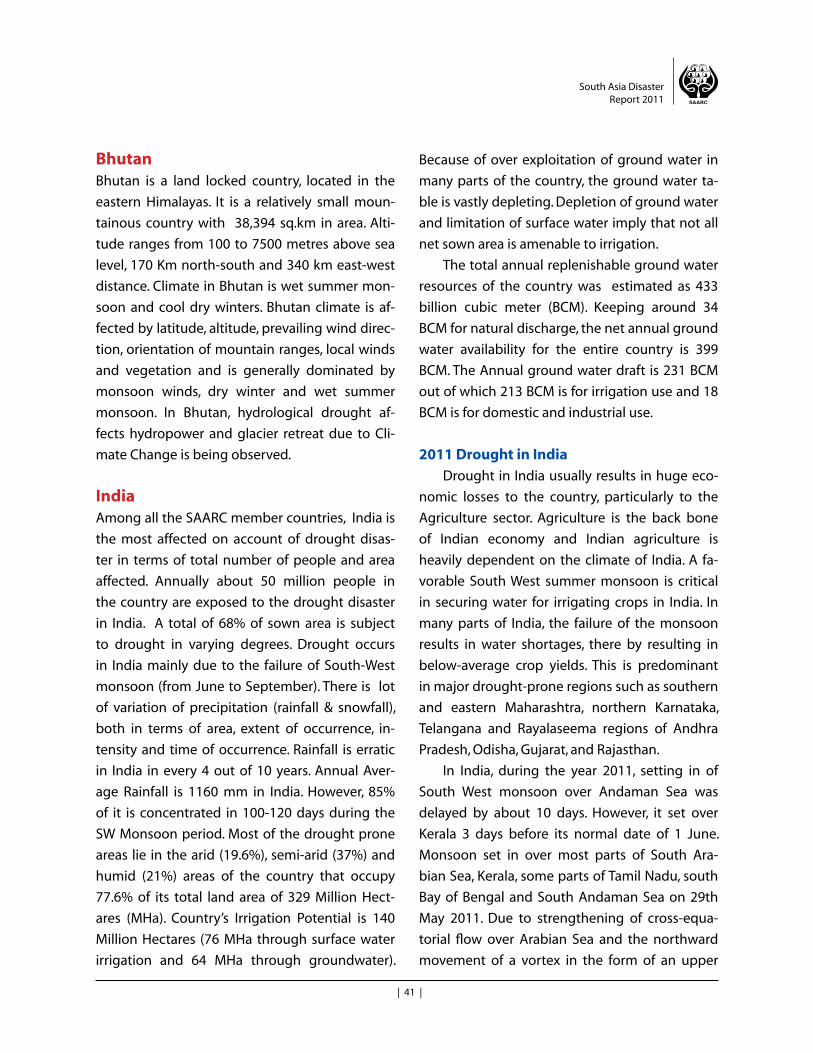
South Asia DisasterReport 2011
| 41 |
BhutanBhutan is a land locked country, located in the
eastern Himalayas. It is a relatively small moun-
tainous country with 38,394 sq.km in area. Alti-
tude ranges from 100 to 7500 metres above sea
level, 170 Km north-south and 340 km east-west
distance. Climate in Bhutan is wet summer mon-
soon and cool dry winters. Bhutan climate is af-
fected by latitude, altitude, prevailing wind direc-
tion, orientation of mountain ranges, local winds
and vegetation and is generally dominated by
monsoon winds, dry winter and wet summer
monsoon. In Bhutan, hydrological drought af-
fects hydropower and glacier retreat due to Cli-
mate Change is being observed.
IndiaAmong all the SAARC member countries, India is
the most affected on account of drought disas-
ter in terms of total number of people and area
affected. Annually about 50 million people in
the country are exposed to the drought disaster
in India. A total of 68% of sown area is subject
to drought in varying degrees. Drought occurs
in India mainly due to the failure of South-West
monsoon (from June to September). There is lot
of variation of precipitation (rainfall & snowfall),
both in terms of area, extent of occurrence, in-
tensity and time of occurrence. Rainfall is erratic
in India in every 4 out of 10 years. Annual Aver-
age Rainfall is 1160 mm in India. However, 85%
of it is concentrated in 100-120 days during the
SW Monsoon period. Most of the drought prone
areas lie in the arid (19.6%), semi-arid (37%) and
humid (21%) areas of the country that occupy
77.6% of its total land area of 329 Million Hect-
ares (MHa). Country’s Irrigation Potential is 140
Million Hectares (76 MHa through surface water
irrigation and 64 MHa through groundwater).
Because of over exploitation of ground water in
many parts of the country, the ground water ta-
ble is vastly depleting. Depletion of ground water
and limitation of surface water imply that not all
net sown area is amenable to irrigation.
The total annual replenishable ground water
resources of the country was estimated as 433
billion cubic meter (BCM). Keeping around 34
BCM for natural discharge, the net annual ground
water availability for the entire country is 399
BCM. The Annual ground water draft is 231 BCM
out of which 213 BCM is for irrigation use and 18
BCM is for domestic and industrial use.
2011 Drought in India
Drought in India usually results in huge eco-
nomic losses to the country, particularly to the
Agriculture sector. Agriculture is the back bone
of Indian economy and Indian agriculture is
heavily dependent on the climate of India. A fa-
vorable South West summer monsoon is critical
in securing water for irrigating crops in India. In
many parts of India, the failure of the monsoon
results in water shortages, there by resulting in
below-average crop yields. This is predominant
in major drought-prone regions such as southern
and eastern Maharashtra, northern Karnataka,
Telangana and Rayalaseema regions of Andhra
Pradesh, Odisha, Gujarat, and Rajasthan.
In India, during the year 2011, setting in of
South West monsoon over Andaman Sea was
delayed by about 10 days. However, it set over
Kerala 3 days before its normal date of 1 June.
Monsoon set in over most parts of South Ara-
bian Sea, Kerala, some parts of Tamil Nadu, south
Bay of Bengal and South Andaman Sea on 29th
May 2011. Due to strengthening of cross-equa-
torial flow over Arabian Sea and the northward
movement of a vortex in the form of an upper

| 42 |
Introduction
air cyclonic circulation along the trough off the
west coast, monsoon further advanced rapidly
and covered entire Kerala, Tamil Nadu and Goa,
most parts of Karnataka and some parts of south
Andhra Pradesh by 5th June, 2011. However,
during 6 to 10 June, there was a short hiatus in
the further advance of monsoon along the west
coast. On the other hand, the eastern branch of
monsoon advanced over some more parts of Bay
of Bengal and north eastern states, with a delay
of nearly 5 days. Associated with the formation
of a depression over north Bay of Bengal on 13
June, 2011, the monsoon advanced into some
more parts of Arabian Sea, parts of Saurashtra
and most parts of the Bay of Bengal and parts
of coastal Andhra Pradesh and coastal Odisha.
Subsequently, there had been a rather steady ad-
vance during 15 – 26 June in association with the
formation of a Deep Depression (16 – 22 June)
over the North West Bay of Bengal and its grad-
ual West-North Westward movement. This synop-
tic situation caused the monsoon to cover most
parts of the country outside western parts of Ra-
jasthan and north Gujarat state. With the forma-
tion of a low pressure area over south Chhattis-
garh and adjoining Telangana and the off shore
trough extending from south Gujarat coast to
Kerala coast during 4-8 July, 2011, the trough at
mean sea level shifted southwards and became
more pronounced and made favourable condi-
tions for further advance of monsoon. Thus, the
southwest monsoon covered the entire country
on 9 July, 2011, 6 days earlier than its normal date
of 15 July. The map below shows the periodicity
of occurrence of severe Drought in various parts
of India (Fig: 4.2)
Fig. 4.2 : A map showing the periodicity of occurrence of severe Drought in various parts of India.(Source: India Meteorological Department, Government of India)
Drought

South Asia DisasterReport 2011
| 43 |
2011 Rainfall Distribution in India
For the country as a whole, the rainfall for
the season (June-September, 2011) was 101%
of its long period average (LPA) and 107% of its
LPA over Northwest India, 110% of its LPA over
Central India, 100% of its LPA over south Penin-
sula and 86% of its LPA over Northeast India. In
the country, as a whole, out of 603 meteorologi-
cal districts for which data is available, 453 dis-
tricts (76%) received excess/normal rainfall and
the remaining 150 districts (24%) received defi-
cient/scanty rainfall during the season. Monthly
rainfall over the country as a whole was 112%
of LPA in June, 85% of LPA in July, 110% of LPA in
August and 106% of LPA in September. Advance
of Southwest monsoon over the Andaman Sea
was delayed by about 10 days. The monsoon set
in over Kerala on 29 May, 2011, three days before
its normal date of 1 June and covered the entire
country by 9 July, 6 days earlier than its normal
date of 15th July. The withdrawal of monsoon
from west Rajasthan was delayed and it com-
menced only on 23rd September, 2011. Season
rainfall over NE India was below its LPA by 14%.
Season rainfall over south Peninsula was normal.
However, the season rainfall over Central India
and NW India were 10% and 7% above their LPA
values respectively. The cumulative season rain-
fall from 1st June to 30th September 2011 was
excess in 7 meteorological subdivisions (21% of
the total area of the country), normal in 26 me-
teorological subdivisions (71% of the total area
of the country) and deficient in 3 meteorologi-
cal sub divisions i.e., Arunachal Pradesh, Assam &
Meghalaya, and Nagaland, Manipur, Mizoram and
Tripura (8% the total area of the country). The
sub-divisional cumulative season rainfall distri-
bution is shown in the table below (Table 4.1):
Region Actual Rainfall in 2011(mm)
Long Period Average (LPA)
(mm)
Actual for the year 2011 (% of LPA)
Coefficient of Variation (CV)
(% of LPA)
ALL-INDIA 899.9 887.5 101 10.7
NORTHWEST(NW) INDIA
654.8 615.0 107 18.9
CENTRAL INDIA 1073.6 975.5 110 15.0
SOUTH PENINSULA 715.2 715.5 100 15.3
NORTHEAST (NE) INDIA 1233.6 1438.3 86 12.6
Table 4.1 : The cumulative season rainfall distribution in different regions in India during 2011(Source: India Meteorological Department, Government of India (Web site: www.imd.gov.in)
The details of South West Monsoon Rain-
fall during June to September, 2011 in India
are shown in the map below (Fig. 4.3) where
as the details of Sub-Division wise Monthly
Rainfall Distribution over India during SW
Monsoon Season in 2011 are shown in Fig.
4.4 (a) to (d). The map showing the Drought
prone districts in India is shown in Fig. 4.5. Fig.
4.6 shows a map indicating the districts and
their ground water levels in India during the
year 2011 and Fig. 4.7 shows a map of River
Basins in India.
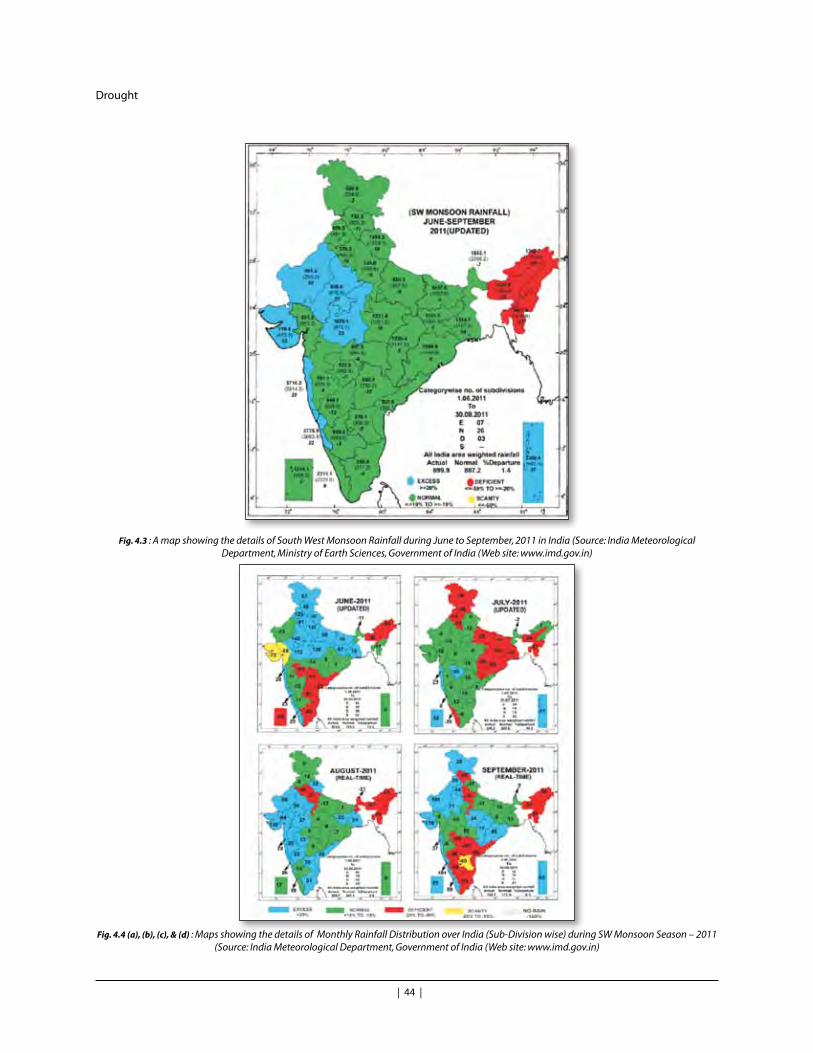
| 44 |
Introduction
Fig. 4.3 : A map showing the details of South West Monsoon Rainfall during June to September, 2011 in India (Source: India Meteorological Department, Ministry of Earth Sciences, Government of India (Web site: www.imd.gov.in)
Drought
Fig. 4.4 (a), (b), (c), & (d) : Maps showing the details of Monthly Rainfall Distribution over India (Sub-Division wise) during SW Monsoon Season – 2011 (Source: India Meteorological Department, Government of India (Web site: www.imd.gov.in)

South Asia DisasterReport 2011
| 45 |
Fig. 4.5: A map showing the Drought prone Districts in India . Source: Ministry of Water Resources, Government of India (Web site : http://wrmin.nic.in)
Fig. 4.6: A map indicating the districts and their ground water levels in Indiaduring 2011. Source: Ministry of Water Resources, Government of India (Web site : http://wrmin.nic.in)

| 46 |
IntroductionDrought
Fig. 4.7: A map of River Basins in India. Source: Ministry of Water Resources, Government of India (Web site : http://wrmin.nic.in)
The drought situation in some of the most
drought affected states in India is described
below:
Karnataka
During the year 2011, though the monsoon
started in time, the state of Karnataka except
Karavali and Malnad Regions experienced mod-
erate rains. During May-2011, the state as a whole
recorded only 71.7 mm rainfall as against its
normal rainfall of 87.2 mm with departure from
normal being (-) 15.5%. Out of 176 taluks in the
state 79 taluks recorded deficit / scanty rainfall.
The onset of monsoon over the southern part of
state was on 2 June and was on time. The prog-
ress of the monsoon trend was normal and cov-
ered most parts of the state by 10 June, 2011
except parts of Bidar, Gulbarga, Yadgir and Rai-
chur districts. Monsoon covered the entire state
by 15 June 2011. During June-2011 the state as
a whole received actual rainfall of 200 mm as
against its normal rainfall of 183 mm with (+) 10
% departure from normal. The interior parts of
Karnataka received below normal rainfall. Dur-
ing June 2011 rainfall was deficit in 58 taluks.
During July 2011, the state as a whole recorded
234 mm rainfall as against its normal rainfall of
266 mm with departure from normal being (-)
12 %. The districts of Chitradurga, Davanagere,
Chamarajanagara, Mysore, Belgaum, Haveri,
Dharwad, Hassan and Chikmangalur recorded
deficit rainfall. 72 taluks recorded deficit /scanty
rainfall during the month. The Coastal, Malnad
and South interior Karnataka regions recorded
below normal rainfall. During August 2011, the
state received 230 mm rain as against normal
rainfall of 196 mm with departure from normal
of 17%. The rainfall was deficit during the month

South Asia DisasterReport 2011
| 47 |
in the districts of Chitradurga and Bellary. Dur-
ing September 2011, the state witnessed scanty
rainfall in 17 districts of interior Karnataka with
departure from normal up to (-) 81%. The Coastal
and Malnad region received excess rainfall dur-
ing the month. South interior Karnataka recorded
only 44 mm rain during the month as against the
normal rainfall of 134 mm. The North interior Kar-
nataka region received 57 mm rainfall as against
normal rainfall of 152 mm. September 2011 rain-
fall was the second worst event in South Interior
Karnataka since 1971, and in North Interior Kar-
nataka, third worst event since 1971. As on the
end of September 2011, 27% of the geographi-
cal area in the state was under moderate/ se-
vere moisture stress covering interior regions of
the state. Failure of Monsoon during September
2011 caused late season drought of rare severity.
The dry spell in interior Karnataka during Sep-
tember 2011 continued in to October 2011 in
many districts. Though the cumulative rainfall de-
parture from normal for the State as a whole dur-
ing 1st June 2011 to 14th was (-) 4% from normal,
failure of monsoon during September and Octo-
ber 2011 resulted in late season drought. Fig. 4.8
indicates a map showing the drought affected
taluks in Karnataka during 2011. The percent-
age departure of cumulative rainfall in Karna-
taka from 1971 to 2011 is indicated in the chart
below (Fig. 4.9). Fig. 4.10 shows a map indicating
average cumulative rainfall patterns and Fig. 4.11
shows a map showing Agricultural drought as-
sessment in different drought prone districts of
Karnataka.
Fig. 4.8: A map showing the drought affected taluks in Karnataka during 2011. Source: Relief Department, Government of Karnataka

| 48 |
Introduction
Fig. 4.9: A chart showing the % departure of cumulative rainfall (from 1971 to 2011) Source: Relief Department, Government of Karnataka
Drought
Fig. 4.10: A map indicating average cumulative rainfall patterns in Karnataka. Source: Relief Department, Government of Karnataka

South Asia DisasterReport 2011
| 49 |
Fig. 4.11:A map showing Agricultural drought assessment in different drought prone districts of Karnataka. Source: Relief Department, Government of Karnataka
South West Monsoon drives the Kharif agri-
cultural activities in the state of Karnataka. Gen-
erally 30 September is the normal withdrawal
of South West Monsoon in the state. Taking into
consideration of the drought indicators, deficit
rain, dry spell/moisture stress prevailed in 70 ta-
luks of the state and were declared as drought
affected on 4 October 2011. 14 taluks were de-
clared as drought affected on 7th October 2011.
The situation was reviewed on 15 October 2011
and 6 more taluks were declared as drought af-
fected. With no respite in the situation, 9 more
taluks were declared as drought affected on 8th
November 2011 In all 99 taluks were declared
as drought affected. The summary of loss due
to Drought during 2011, as per the government
of Karnataka is presented in the table below
(Table: 4.2):

| 50 |
Introduction
Sl. No.
ItemEstimated loss (Rs in
crores)Relief claimed as per CRF Norms
(Rs in crores)
1 Agriculture Crop loss 4245.84 202.54
2 Horticulture Crop loss 299.00 13.94
3 Animal Husbandry
a) Opening of Goshalas 23.92
b) Purchase of Fodder mini kits 4.20
c) Purchase of Fodder Banks 7.60
d) Nutrient supply and Vety care 4.20
Total of Sl No 3 39.92
4 RDPR Dept
a) Revival of PWS 24.42
b) Revival of MWS 24.52
c) Retrieval / Hydro fracturing of bore-wells 18.23
d) Drilling of New bore-wells 18.24
e) Transportation of water 36.63
Total of Sl. No. 4 122.04
5 Additional funds under MGNREGS 4.80
6 Additional funds under Health Sector 10.00
7 Additional funds under Power Sector 330.00
Grand Total of Sl. No. 1 to 6 4544.84 723.24
Table 4.2: Summary of Losses due to Drought in Karnataka during 2011 Source: Relief Department, Government of Karnataka
Drought
Andhra Pradesh
Andhra Pradesh is the largest producer of
rice in India for which it is called the ‘rice bowl
of India’. It has an area of 2,75,069 sq km with a
population of 84,665,533. The basins of Goda-
vari, Krishna and Pennar and their tributaries
serve as a constant source of irrigation for the
state. Agriculture is the mainstay of economy in
the State and also provides direct and indirect
employment for more than 68% of the popu-
lation in the state. The Agriculture sector has
been growing at a rate of 3.5 % per annum since
1995-96. The state grows a whole range of food
crops, cashcrops and fruits- rice, wheat tobacco,
groundnut, bananas and mangoes.
During the South West Monson Period
(from June to September, 2011), the State had
received an average rainfall of rainfall of 532.7
mm as against the normal of 624.1 mm, with a
deviation of (-) 15%. Several mandals spread
over 20 districts had received deficit rainfall
of above (-) 20%. This deficit rainfall resulted
in damage to standing rains fed crops due to
moisture stress in more than 16 lakh hectares
as reported by the Department of Agricul-
ture. Based on the District Collectors report of
scanty/ deficit rainfall with dry-spells resulting
in reduction of sown area and moisture stress
to the crops sown and proposals to declare as
drought affected mandals, Government after
careful examination declared 456 mandals in 15
districts Namely, Anantapur (63), Nalgonda(52),
Karimnagar (50), Medak (43), Mahabubnagar
(41), Prakasam (38), Khammam (31), Kurnool

South Asia DisasterReport 2011
| 51 |
(29), YSR Kadapa (28), Rangareddy (26), Chittor
(13), Krishna (13), Guntur (11), Srikakulam(10),
and Visakhapatnam (08) as drought affected
mandals in view of deficient rainfall in 2011. Lat-
er, another 93 mandals in four districts (i.e., 36
mandals in Chittoor, 34 in Warangal, 18 in Adila-
bad and 5 in Karimnagar) were also identified as
drought-affected. The number of affected man-
dals in each districts are shown in the Table be-
low (Table 4.3):
Name of State/No of Districts District & Date of Declaration of Drought*
Andhra Pradesh(456 mandals in 15 districts)
30.10.2011 Anantapur (63), Nalgonda (52), Medak (43), Mahbubnagar (41), Prakasam (38), Khammam (31), Kurnool (29), Rangareddy (26), YSR Kadapa (26), Chittoor (13), Guntur (11), Karimnagar (50), Krishna (13), Srikakulam (10) and Visakhapatnam (8) districts.
93 mandals in 4 districts 18.11.2011Chittoor (36), in Warangal (34), Adilabad (18) and Karimnagar (5)
Table4.3:- Details of districts declared Drought affected in Andhra Pradesh, during 2011 Source: Revenue (Relief) Department, Government of Andhra Pradesh
Odisha
A severe drought struck over many parts
of Odisha due to inadequate rainfall. During
the year 2011, most of the districts in the State
had received half the normal rainfall. Accord-
ing to Odisha Government revenue depart-
ment sources, Nuapada district in western
Orissa has received 56 per cent rainfall while
Boudh and Malkangiri recorded 63 and 61 per
cent,respectively, since the onset of the mon-
soon in the second week of June. The situation
in Angul, Bargarh, Bolangir, Kalahandi, Deogarh,
Koraput, Jharsuguda and Sonepur was even
worse. The cumulative rainfall recorded in the
state during June 1 to July 29 stood at 407.4
mm, 23.8% short of the anticipated normal
rainfall of 534.5 mm. Insufficient rainfall had
affected agricultural activities in 17 of the
state’s 30 districts. Many farmers had to aban-
don transplanted fields as paddy saplings
wilted due to lack of rainfall. Balangir, Bargarh,
Boudh, Deogarh, Nuapada and Malkangiri dis-
tricts have experienced 40% less than normal
rainfall.
Maldives
The climate in Maldives is warm round the
year with little variation in temperatures. The
two distinct seasons in Maldives are dry season
(North East monsoon) and wet season (South-
West monsoon). Maldives consists of a group
of around 1200 islands in the Indian Ocean, out
of which around 200 islands in the southwest
of India and south-southwest of Sri Lanka are
inhabited. The average elevation of these islands
is only 1.2 m above MSL. The average size of
these islands are 40-60 hectors, the largest being
500 hectors. Since Maldives is not an agricultural
country, delay in onset of monsoon need not be
considered as drought. But when the duration of
North East monsoon (dry season) exceeds a cer-
tain limit, many islands may fall shortage of fresh
water for drinking and other domestic purposes
since ground water in these islands is not suit-
able for drinking and domestic usage.
Nepal Nepal is a land locked country, exposed to vari-
ous types of natural and man- made disasters.

| 52 |
Introduction
Though a vast network of rivers in Nepal create
good ground water conditions, drought con-
ditions also prevail in Nepal. Uneven, low and
irregular rainfall is the main factor for occur-
rence of droughts in Nepal. The western part of
Nepal, mid and far western terai is more vulner-
able to droughts. The entire mountainous region
is generally dry. Out of the 75 districts of Nepal,
approximately 40 districts are food deficient as
a result of drought, the most affected summer
crops being maize (in the hills) and rice (in the
Terai). Lack of irrigation facilities in the country
makes the problem more serious. Nepal is also
facing problems due to high poverty, low literacy
rate, poor public awareness, difficult and unde-
veloped physical infrastructure, policy support at
the top level, lack of cooperation and coordina-
tion among various government agencies, slow
decision making process etc, coupled with lack
of modern technology, early warning systems.
Now, the Government of Nepal is giving due im-
portance to drought risk management and has
undertaken agriculture and irrigation develop-
ment plans and programmes and ensure food
security.
PakistanDrought frequently occurs in Pakistan. The Pun-
jab Province, North-West Frontier Province and
Sindh have experienced some of the worst
droughts. According to the Economic Survey
of Pakistan, the drought was one of the most
significant factors responsible for the less than
anticipated growth performance. The most se-
vere drought at the national scale occurred dur-
ing 1999-2000, prolonging up to 2002 in many
areas of the country, as a result of which, the
agriculture growth suffered a major setback and
also causing acute shortage of food, fodder and
water. In Pakistan, migration of population due
to drought is regular phenomena. In Pakistan,
though massive canal network was available, the
effect of droughts has not been controlled. Dur-
ing the current decade, droughts have occurred
in the Thar Desert of Sindh Arid Zone. Massive
migratory trends have been witnessed continu-
ously from severe drought affected areas to irri-
gated and urban areas. In places like Tharparkar
where the economy is largely dependent on live-
stock, the impact of drought was very harsh. The
pastures had dried up and fodder availability was
restricted, in some extreme cases non-existent.
Many of the livestock population had to subsist
on toxic bushes which had made them vulner-
able to diseases like pest des petites, enterotox-
aemia, diarrhea and blood diarrhea.
Sri Lanka Sri Lanka is a water rich country with an annual
rainfall of around 1860 mm. But Sri Lanka also
experiences several drought situations periodi-
cally. The main causes for droughts in Sri Lanka
are failure of monsoon rains, less than aver-
age annual rainfall, high temperature, humid-
ity, and evaporations etc. Data on occurrence
of droughts in Sri Lanka during the last three
decades reveals that some parts of the country
have experienced drought regularly.
Almost all parts of Sri Lanka have experi-
enced drought in the last thirty years. An average
of 11,000 hectares of paddy land gets destroyed
every year due to unavailability of water in suffi-
cient quantities. A vast extent of other crops get
affected by drought every year, resulting in huge
economic losses.
References:1. http://www.fews.net/docs/Publications/Afghani-
Drought

South Asia DisasterReport 2011
| 53 |
stan_OL_2012_02.pdf
2. http://saarc-sdmc.nic.in/drought.asp.
3. http://en.wikipedia.org/wiki/Drought.
4. http://www.pecad.fas.usda.gov/highlights/2011/
mideast_cenasia_drought/
5. http://www.google.com/hostednews/afp/article/
ALeqM5iOEan4bw7oW-K_NxwhICGVsrJ_og
6. The Financial Express
7. http://ocha.unog.ch/OPS/Reports/daily/CAPProj-
ectSheet_880_2010630.pdf.
8. Drought Situations over India Persented by (
Jagvir Singh, G.R. Iyengar, T.N.Jha, B.P. Yadav
and V.K.Jain(Ministry of Earth Sciences Na-
tional Centre for Medium Range Weather
Forecasting(NCMRWF) www.ncmrwf.gov.in.
9. Crisis Management Plan - Drought (National), De-
partment of Agriculture and Cooperation, Minis-
try of Agriculture, GOI.
10. http://nrega.nic.in/DroughtStratDraft.pdf.
11. G.O Ms No 22 & 23, dated 02.11.2011 & 05.11.2011
respectively, Government of Andhra Pradesh, Rev-
enue Department, Drought Declaration.
12. Memorandum Submitted to Governments of In-
dia seeking Central Assistance for Drought Relief
measures in Karnataka State, Government of Kar-
nataka, November, 2011.
13. Revised Memorandum Submitted to Govern-
ments of India seeking Central Assistance for
Drought Relief measures in Karnataka State, Gov-
ernment of Karnataka, November, 2011.
14. http://wrmin.nic.in/index2.

| 54 |
Introduction
An OverviewAvalanches, rapid downslope movement of snow
mixed with air and water is a common menace
in the parts of the SAARC region situated in the
higher altitudes in the Himalayan-Hindukush
ranges. The countries vulnerable from this disas-
ter are Afghanistan, Bhutan, India, Nepal and Paki-
stan. The geo-morphological and hydro-meteo-
rological conditions prevalent in these countries
present ideal set-up for avalanches. Being located
in the youngest fold mountain belt where slope
conditions are steep and in many cases unstable,
heavy snowfall followed by even a slight rise in
Chapter 5
Avalanche
temperature can trigger an avalanche. The casual-
ties of the avalanches usually occur at the base of
the higher altitude reaches in the mountain rang-
es where human settlements are present.
As per the EMDAT data, Asia experienced the
major share of avalanches in the year 2011. The
Asian region had 13 avalanche events that ac-
counted for 248 lives. Contrary to this the Ameri-
cas though witnessed 4 events and 63 deaths,
the number of affected people was much higher
than in Asia; a total of 4325 people were affect-
ed in the Americas whereas in Asia 2901 people
were affected (Table 5.1, Figures 5.1 and 5.2).
Continent No. of Events Killed Total Affected
Americas 4 63 4325
Asia 13 248 2901
Europe 1 3 1
Table 5.1:Global avalanche events in the year 2011 (Source: EMDAT accessed on May 21, 2011).
Figure 5.1.:Number of avalanche events in the globein the year 2011.Figure 5.2:Number of global fatalities due to avalanches in the year 2011.

South Asia DisasterReport 2011
| 55 |
Country No of events Number of fatalities
Afghanistan 2 24
Nepal 3 6
Pakistan 3 3
Total 8 33
The data for the year 2011 shows that among
the SAARC countries Afghanistan, Nepal and Paki-
stan experienced avalanche events. Among these,
Afghanistan had the maximum number of fatali-
ties though the number of events in Afghanistan
was lesser in number as compared to Nepal and
Pakistan (Table 5.2, Figures 5.3 and 5.4).
Figure 5.3:Number of avalanche events and fatalities in SAARC countries in 2011.
A comparative study of distribution of
avalanches in the SAARC countries for the
period 2007-2011 shows that the number
Table 5.2:Number of avalanche events in South Asia (Source: Data compiled by SDMC from media reports).
of deaths due to avalanches in the region
was significantly less than the previous year
(Figure 5.5).
Figure 5.4:Percentage of fatalities in SAARC countries in 2011. Figure 5.5.:Comparison of number of people of died due to avalanches in SARC countries during 2007-2011.

| 56 |
Introduction
Afghanistan
One person was killed and two were injured
when an avalanche struck Sheekay district of
Badakhshan province on February 8. In anoth-
er incident, avalanches in Daikundee province
killed at least 23 and wounded another five on
February 17 and closed the roads between dis-
tricts and the center of the province. The inci-
dent occurred as a result of heavy snow fall in
Sang Takhat district and some other areas of that
province. Seven residential houses were also de-
stroyed due to avalanches and snows. The au-
thorities came forward with relief and rescue and
approached the charity institutions and govern-
mental organisations for taking necessary steps
in this regard2 (figures 5.6 and 5.7).
Nepal
An avalanche ensued by hours-long snowstorms,
killed a man and his baby girl in Langtang, a re-
mote village in Rasuwa district, on March 24
night.
The avalanche also displaced over 15 fam-
ilies as their houses were damaged. The trage-
dy occurred in Mundu and Sindum villages of
Langtang inside the Langtang National Park.
As the avalanche and snowstorm completely
damaged VSAT-telephones, the CDO office in
Dhunche, the district headquarters of Rasuwa,
learnt about the incident next day. Though
the damaged telephone network could be
restored, it took some tome for the electricity
lines to be restored3.
In another incident in the first week of
June, two persons including a Japanese na-
tional died after they got buried under snow
during a trek in the Langtang region. The
Japanese tourist and his guide got buried un-
der the snow as they were returning towards
Helambu via Gonjala Pass after climbing the
Nayagang (5800m) peak4. On November 11,
two Korean nationals were buried in the ava-
lanche while returning from Mt. Lhotse. The
rescue was delayed due to the bad weather
condition5.
Pakistan
On February 14, heavy rains and avalanches
killed three people and wounded seven others
in Khyber Pakhtunkhwa province of Pakistan. The
avalanche was triggered by torrential rains and a
rapidly advancing avalanche hit a hamlet in Kun
Kandia valley, killing a man and a girl while sev-
en others suffered injuries. As a consequence of
this the Karakorum highway got blocked at sev-
eral places and power supply to hilly areas of the
Figure 5.6: People being evacuated from avalanche hit areas (Source: Bakhtar News Agency).
Figure 5.7: Relief and rescue operations in avalanche affected areas (Source: Bakhtar News Agency).
Avalanche

South Asia DisasterReport 2011
| 57 |
province was disrupted. Continuous downpour
and snowfall also affected life in Abbottabad. The
road between Abbottabad and Murree via Galyat
had to be closed for traffic. Snow and landslides
also blocked several link roads in Galyat6.
In another incident that took place in the
month of July, several hundreds of goats were
buried alive when a mountainous mound fell
upon them in Ghundi Husankhel area of fron-
tier region Lakki. According to reports, goats’
herds were grazing in the mountainous area
when suddenly a mound slipped and fell
upon them. Such mass scale death of goats
as a result of mound fall had inflicted great fi-
nancial loss on poor tribesmen7.
References1. Daily Outlook
2. Bakhtar News Agency
3. Republica News
4. Nepal News
5. Kantipur News
6. Dawn News
7. The Frontier Post

| 58 |
Introduction
Chapter 6
An OverviewThe year 2011, was recorded as the 11 warm-
est year since record keeping started in the
year 1880. The annual global land and ocean
surface temperatures for this year was 0.51°C
(0.92°F) above the 20 century average of 13.9°C
(57.0°F). Comparatively speaking however,
2011 was less warm than 2010 and 2005 which
were the warmest recorded years in the globe.
Separately, the 2011 global average land sur-
Heat and Cold Wave
face temperature was 0.8°C (1.49°F) above the
20 century average of 8.5°C (47.3°F) and ranked
as the eighth warmest on record. The 2011
global average ocean temperature was 0.40°C
(0.72°F) above the 20 century average of 16.1°C
(60.9°F) and ranked as the 11 warmest on re-
cord1. The annual global temperature anomaly
map for the year 2011(Fig 6.1) shows a cluster-
ing of high temperature anomalies over parts
of India.
Figure 6.1:Global temperature anomaly for the period January to December 2011 (Source: http://www.ncdc.noaa.gov/sotc/global/2011/13).
Cold Wave
Many parts of South Asia experienced severe
cold wave conditions in the beginning of 2011.
Many people died and thousands were affected
(Appendix IV).
Bangladesh
The beginning of 2011 brought in severe cold
wave conditions in Bangladesh. About 50 peo-
ple died and nearly one lakh were affected in
the cold wave conditions that prevailed over

South Asia DisasterReport 2011
| 59 |
the country in the beginning of the year (Ap-
pendix IV). Starting from the beginning of Janu-
ary the country witnessed unprecedented win-
ter. Though the average winter temperature for
the country in January, the coldest month, is
10°C, the mercury dipped by 2-5° in many parts
of the country. In many parts of the country the
temperature went down upto 4.5°C, the lowest
in last 45 years according to Bangladesh Meteo-
rological Department sources2. Increase in wind
speed of the upper jet stream was cited as a
reason for the intense cold wave3.
The affected districts were Panchagar, Th-
agurgaon, Dinajpur, Rangpur, Lalmonirhat, kuri-
gram, Gaibandha, Nilphamari, Bogra, Sirajganj,
Pabna, Naogaon, Natore, Rajshahi and Chapain-
awabganj2. Thick fog blanketed the affected ar-
eas during night and morning hours. River and
road communication were severely disrupted.
Flights, train services and river transport were
heavily disrupted due to low visibility conditions.
Many water vessels got stranded and could not
operate, making river transport, one of the ma-
jor modes of transport in the country highly dis-
turbed3. Many people were stranded as the ferry
services were disrupted.
Figure 6.2: Mothers with babies in their laps waiting in the corridor of Nilphamari Sadar Hospital
(Source: The Daily Star).
Cold related diseases increased and the
hospitals in the affected districts struggled to
accommodate the flow of patients (Fig. 6.2).
Children were the worst among the sufferers be-
cause of their vulnerability and absence of spe-
cialised children’s wards in the hospitals3, 4.
Figure6.3:A homeless boy shivers in the bone-chilling cold (Source: The Daily Star).
The cold wave conditions returned in the lat-
er part of the year in December when many suf-
fered and several died. The dead included many
children. Lives of the poor and street dwellers be-
came miserable4 (Fig 6.3).
India
Many parts of India experienced severe cold
wave conditions in 2011. According to EM-Dat
sources (Appendix IV), 80 people died in the
month of January due to cold wave conditions.
The affected states were Uttar Pradesh, Delhi,
Punjab, Haryana, Jammu & Kashmir, Madhya
Pradesh, Jharkhand, Odisha and Bihar. Severe
cold wave / cold wave conditions prevailed
over most of the northern and central parts of
the country on most of the days during the first
three weeks of January. These conditions also
prevailed over the peninsular parts of the coun-
try during the second and third week of January.

| 60 |
Introduction
Minimum temperatures were below normal by
over 5°C on many days over central and penin-
sular parts of the country. However, during Feb-
ruary, these conditions prevailed only at isolated
places on some occasions over parts of peninsula
and eastern parts of the country.
Figure 6.4: Mean seasonal temperature anomalies in °C (Source: Climate Diagnostics Bulletin of India, Winter Season January-February 2011, National Climate Centre).
Heat and Cold Wave
Figure 6.4 shows the mean seasonal maximum
and minimum temperatures in India. Minimum
temperatures were below normal over many
parts of the country except parts of northern/
northwestern and northeastern region and parts
of extreme south peninsula. Over north penin-
sula and adjoining central and eastern parts of
the country, minimum temperatures were be-
low 0 normal by 1 to 2°C. Over parts of Jammu &
Kashmir, west and east Rajasthan, Saurashtra and
Kutch, these were above normal by about 1°C5.
The New Year in India brought cold spells
that swept over many parts of the country
throwing life out of gear and causing miseries to
the affected areas. In the first week of January it-
self, the maximum and minimum temperatures
in many parts dipped alarming below normal.
Some of the recorded temperatures in India in
the first week of January are given in table 6.1.
The severity of cold weather affected the
Location Temperature
Delhi 4.3°C, 3 °below normal
Qazigund (Jammu & Kashmir)
9.8 °C
Keylong (Lahaul & Spiti) 15°C
Narnaul (Haryana) 0.5°C
Karnal 2°C
Hissar 2.5°C
Ludhiana 5.7°C
Ambala 3.2°C
Mount Abu -3°C
Ranchi 4.2°C
Kandhamal (Odisha) -1.5°C
Gaya 2.5°C
Agra 0.6°C, 6° below normal
Table 6.1:Low temperature in parts of India during January 2011 (Source: www.newsonair.nic.in, www.thehindu.com,
www.ddnews.gov.in).
states in many ways. In Srinagar the famous
Dal Lake had frozen which had an impact on
the business of boat and shilkara operators for

South Asia DisasterReport 2011
| 61 |
quite some period (Fig. 6.5 and 6.6). In Himachal
Pradesh, the Surajtal and Chandratal lakes and a
70 kilometer stretch of Chandrabhaga River were
completely frozen.
The piercing chilly weather in the country
accompanied with dense fog enveloping many
parts during morning and night disrupted life.
Schools in many states were closed. Air, rail and
road traffic were hampered. Flights were delayed
leading to miseries of the passengers. Rail traffic
was also delayed as the trains were operated at
lower speeds to avoid accidents. Road accidents
in the night and morning hours increased due to
low visibility conditions. Poor people living in the
streets had a miserable time. Many lost their lives
or suffered (Fig. 6.7-6.8). Cold related diseases
increased. However, in many states the govern-
ments released funds to provide shelter, food,
clothes, blankets and medical facilities to the
poor and destitute6, 7, 8.
Figure 6.5:Kashmiri vegetable seller collects vegetables from the snow cover field near the Dal Lake in Srinagar
(Source: www. newshopper.sulekha.com).
Figure 6.6: A Kashmiri woman rows her traditional boat on the frozen waters of the Dal Lake in Srinagar
(Source: www. newshopper.sulekha.com).
Figure 6.7:A calf joins people sitting near a bonfire to keep warm in Allahabad, India
(Source: www. newshopper.sulekha.com)
Figure 6.8: Homeless people warm themselves near burning coal on a cold morning in Jammu
(Source: www. newshopper.sulekha.com).

| 62 |
Introduction
Heat Wave
Several parts of India reeled under severe heat
wave conditions in the months preceding mon-
soon. Many parts of northern India, peninsular In-
dia and some coastal parts bore the brunt.
The northern states of India: Delhi, Uttar
Pradesh, Rajasthan, Punjab, Haryana saw steep
rise in daytime temperatures that affected peo-
ple’s lives. The temperatures recorded in some of
the major cities of northern India in the middle
of May were: Delhi (44.1°C, + 5°C), Jhansi (46°C),
Allahabad (42°C), Kanpur (42.3°C), Hissar (45.2°C),
Amritsar (44.8°C, +5°C), Ludhiana (43.4°C), Patiala
(43°C), Karnal (42°C), Chandigarh (40.9°C), Churu
(48.6°C, +8°C), Sriganganagar (46.9°C), Bikaner
(45.7°C), Kota (44.7°C), Jaisalmer (44.3°C) and Pi-
lani (44.1°C)9 .
The coastal states of Odisha and Andhra
Heat and Cold Wave
Pradesh also sizzled under severe heat wave con-
ditions. In Odisha the western and interior parts
showed very high temperatures while tempera-
ture in the coastal parts was variable.
References:1. http://www.ncdc.noaa.gov/sotc/global/2011/13
2. http://reliefweb.int/sites/reliefweb.int/files/resour
ces/5359066B6095F92285257849005E9955-Full_
Report.pdf
3. The Independent
4. The Daily Star
5. Climate Diagnostics Bulletin of India, Winter Sea-
son January-February 2011, National Climate Cen-
tre
6. www.newsonair.nic.in
7. www.thehindu.com
8. www.ddnews.gov.in
9. www.ibnlive.in.com

South Asia DisasterReport 2011
| 63 |
Chapter 7
An OverviewThe South Asian countries have a history of de-
struction of precious forest cover due to for-
est fire. In most of the cases the forest fires are
initiated by human negligence. The incidents
predominantly occur in dry winter or summer
months when the trees retain less moisture. In
2011 there were reports of forest fire from Af-
ghanistan, Bangladesh, Bhutan, India, Nepal and
Sri Lanka.
Afghanistan
A huge forest fire broke out in the city of
Laskargah in the southern Hemland province
Forest Fire
of Afghanistan in March (Fig. 7.1). The fire raged
for several hours and nearly half of the 129
hectare forest was gutted. This old forest area
was a source of greenery and pleasant weather
during the summer months in the region. The
local people joined hands with the firefighters
in controlling the fire. However, it took long to
control the forest fire due to lack of adequate
fire extinguishing equipment. There were no
casualties in the fire. The Governor’s office pro-
posed construction of roads, retaining walls and
procurement of necessary fire fighting equip-
ments to prevent future fires in the forests in
the area1,2.
Figure 7.1: Fire raging in Lashkargah (www. pajhwok.com). Figure 7.2:Smoke billowing out of forest fire in Sundarbans in Bangladesh (Source: http://dev.bdnews24.com).
Bangladesh
A forest fire was reported from the Nagli camp in
Chandpali range of east Sundarbans in Bangla-
desh in March (Fig. 7.2). The fire spread sporadical-
ly at ground level across several acres of the for-
est. The local people came forward to join hands
with the firemen and forest department officials
in controlling the fire by cutting the line of fire3, 4.
In another incident in Rauzan, Chittagong
several thousands of rubber trees spread over

| 64 |
Introduction
79 acres of plantation were burnt to ashes in
March. The loss incurred in the fire was estimat-
ed at several crores of Taka. It took enormous
effort of the officials to control the fire as ini-
tially they were unable to reach the peak of the
hills. The incident was ascribed to the act of a
group of miscreants who earlier cut down sev-
eral rubber trees and then set fire to the forest4.
Bhutan
Among the South Asian countries Bhutan has
maximum forest cover and every year the coun-
try witnesses forest fire incidents mostly in the
dry winter months. The year 2011 was no excep-
tion to this trend.
In the last week of January a forest fire in
Thimphu destroyed about 250 acres of for-
est and some properties. It was spotted by
some people at the Wangchu Bank and be-
fore it could be brought under control, the fire
reached the nearby shops and houses (Fig. 7.3).
Large quantity of timber and other merchan-
dise were destroyed5.
In the last days of the month of February,
three separate fire incidents spread over three
days destroyed nearly 2000 acres of forest land
in Bhutan. In the first incident in Ngatsang ge-
wog a forest fire destroyed more than 650 acres
of forest land on February 23. Another fire start-
ed in Lingmethang the next day and destroyed
more than 1000 acres of trees while the last fire,
which started next day, destroyed about 400
acres of forest land. Acres of lemon grass land
and saplings were destroyed in the fire. The for-
est officials were aided by the local people in
firefighting but the steep terrain impeded the
progress of fire control measures5.
On March 15, more than 200 acres of
chirpine forest was destroyed in a fire that
started in Mongar in the morning. Forest of-
ficial along with 30 volunteers worked tire-
lessly to control the fire. Though the fire could
be prevented from spreading to the adjacent
highway, the steepness of the terrain, strong
wind and the thick undergrowth of lemon grass
hampered the progress of work. The fire was
suspected to have been started by some cow
herders5.
In a similar incident, a fire possibly started
by burning of debries by villagers raged in the
Pam village of Trashigang 25 acres of forest
land on April 6 (Fig. 7.4) .
Figure 7.3: Forest fire near Thimphu that destroyed 250 acres of forest land (Source: Kuensel).
Figure 7.4: Fire raging on the slopes of Trashigang (Source: Kuensel).
Forest Fire

South Asia DisasterReport 2011
| 65 |
India
A major fire broke out atop Ramadevara and Be-
lagumba hills located in the Devarayanadurga
forests near Tumkur in the southern Indian state
of Karnataka on 18 January. According to the vil-
lagers in Belagumba, the entire hill measuring
around 1,000 acres was engulfed in fire, destroy-
ing varieties of plants and animal species. Ac-
cording to the officials, the place where the fire
broke out was a government land which was
being used for the purpose of cow grazing (Go-
mala). A group of 20 fire fighters were pressed
into service to extinguish the fire. It was sus-
pected that the fire had claimed the lives of wild
boars, leopards, monkeys, rabbits, and different
types of birds with their eggs and nests and also
destroyed various types of valuable medicinal
plants6.
A wildfire destroyed 10 hectares of grass-
lands in Koottakal and Choriyanthandu areas
of the Idukki Wildlife Sanctuary in January (Fig.
7.5). The fire was brought under control by the
joint efforts of forest officials, activists of the Eco-
Development Committee (EDC) and a fire and
Rescue team from Cheruthoni. According to of-
ficial estimates, four hectares at Koottakal and
six hectares at Choriyanthandu were destroyed
by the fire. A senior official of the Forest Depart-
ment said it was likely that the fires were created
by anti-social elements. The authorities called
for the support and participation of the general
public to prevent such incidents in future6.
Another instance of wildfire was reported
from Kerala that destroyed more than 100 hect-
ares of grass land on the Chembra peak, home to
unique flora and fauna, in the Kottappadi section
of the Meppadi range of forests under the South
Wayanad Forest Division. Forest Department of-
ficials, activists of the EDC and villagers put in
considerable effort to bring the fire under con-
trol. The wild fire was first reported by some tour-
ists who were near a forest watch tower on the
premises of the Chembra peak estate and in no
time the fire spread swiftly to the adjacent forest,
fed by the winds. Many areas on the mountain
were inaccessible but the foresters' team could
bring the fire under control. As a precaution-
ary measure, trekking to the Chembra peak was
banned for a few days6.
The hill range housing Sri Varahalakshmi
Nrusimhaswamy temple in Visakhapatnam in
Andhra Pradesh was on fire at several places on
March 6 with valuable forest cover getting de-
stroyed (Fig. 7.6). According to the locals, this
has become a common feature during this time
of the year with unscrupulous elements deliber-
ately burning the forest cover to convert it into
charcoal for commercial sale illegally. Fire began
on the hill slope adjacent to Annadanam Build-
ing behind the temple premises in the morning
when some people lit a heap of garbage alleg-
edly dumped by the hotel and lodge owners
despite several warnings from the Simhachalam
Devasthanam. By evening fire spread to several
places like Madhavadhara, near Thatichetlapalem
and Seethammadhara and in the darkness the
rings of fire were visible from many parts in the
Visakhapatnam city.
In another incident, the forests in the Ti-
rumala hill ranges in Andhra Pradesh erupted
in fire on March 9. Described as ‘creeping fire' in
the parlance of forestry, the surface fire is said to
have damaged by and large shrub jungles and
trees here and there without however damaging
their roots. Many ‘low order creatures' like snakes,
mongoose, scorpions perished in the forest fire.
Six acres of banana plantation including 50
teak trees, worth Rs.14 lakh were destroyed in
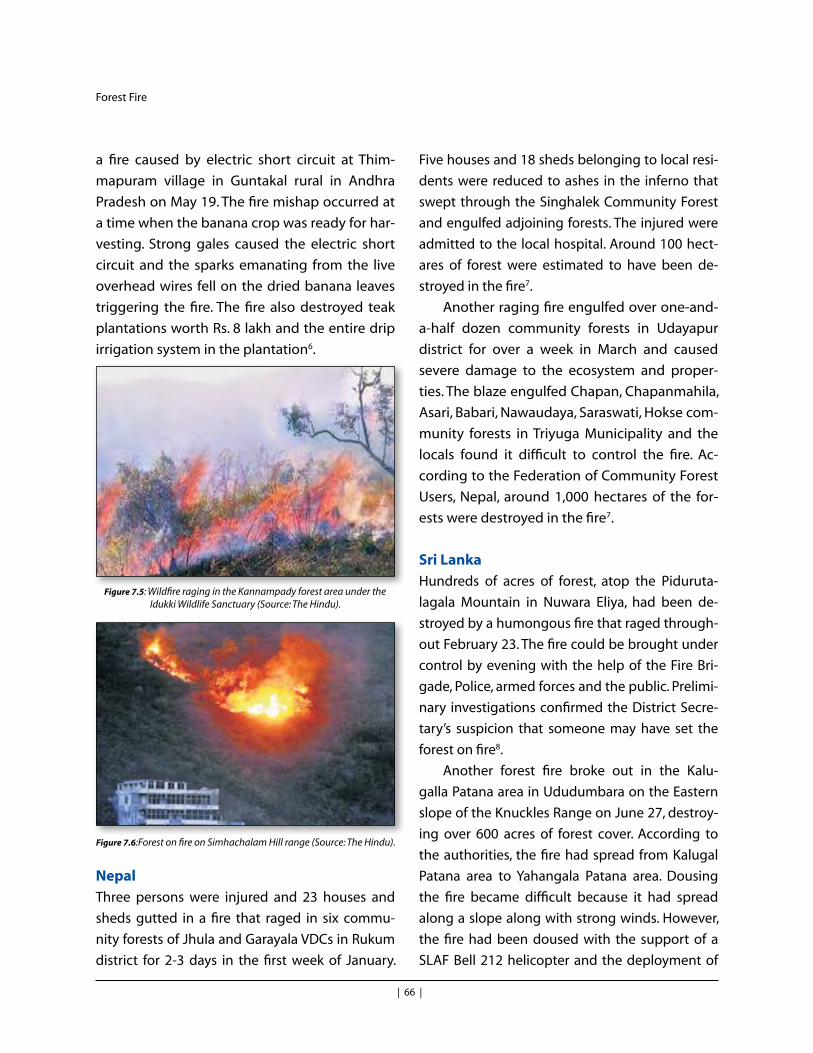
| 66 |
Introduction
a fire caused by electric short circuit at Thim-
mapuram village in Guntakal rural in Andhra
Pradesh on May 19. The fire mishap occurred at
a time when the banana crop was ready for har-
vesting. Strong gales caused the electric short
circuit and the sparks emanating from the live
overhead wires fell on the dried banana leaves
triggering the fire. The fire also destroyed teak
plantations worth Rs. 8 lakh and the entire drip
irrigation system in the plantation6.
Forest Fire
Figure 7.5: Wildfire raging in the Kannampady forest area under the Idukki Wildlife Sanctuary (Source: The Hindu).
Figure 7.6:Forest on fire on Simhachalam Hill range (Source: The Hindu).
Nepal
Three persons were injured and 23 houses and
sheds gutted in a fire that raged in six commu-
nity forests of Jhula and Garayala VDCs in Rukum
district for 2-3 days in the first week of January.
Five houses and 18 sheds belonging to local resi-
dents were reduced to ashes in the inferno that
swept through the Singhalek Community Forest
and engulfed adjoining forests. The injured were
admitted to the local hospital. Around 100 hect-
ares of forest were estimated to have been de-
stroyed in the fire7.
Another raging fire engulfed over one-and-
a-half dozen community forests in Udayapur
district for over a week in March and caused
severe damage to the ecosystem and proper-
ties. The blaze engulfed Chapan, Chapanmahila,
Asari, Babari, Nawaudaya, Saraswati, Hokse com-
munity forests in Triyuga Municipality and the
locals found it difficult to control the fire. Ac-
cording to the Federation of Community Forest
Users, Nepal, around 1,000 hectares of the for-
ests were destroyed in the fire7.
Sri Lanka
Hundreds of acres of forest, atop the Piduruta-
lagala Mountain in Nuwara Eliya, had been de-
stroyed by a humongous fire that raged through-
out February 23. The fire could be brought under
control by evening with the help of the Fire Bri-
gade, Police, armed forces and the public. Prelimi-
nary investigations confirmed the District Secre-
tary’s suspicion that someone may have set the
forest on fire8.
Another forest fire broke out in the Kalu-
galla Patana area in Ududumbara on the Eastern
slope of the Knuckles Range on June 27, destroy-
ing over 600 acres of forest cover. According to
the authorities, the fire had spread from Kalugal
Patana area to Yahangala Patana area. Dousing
the fire became difficult because it had spread
along a slope along with strong winds. However,
the fire had been doused with the support of a
SLAF Bell 212 helicopter and the deployment of

South Asia DisasterReport 2011
| 67 |
over 50 Sri Lanka Army personnel. The Knuckles
Range witnessed another fire on July 31, when a
sudden fire erupted and destroyed about 30 to
40 acres of a pinus forest land. It became difficult
to douse the fire as it had spread fast, aided by
the prevailing dry weather in the region.
On June 28, about 30 acres of forest land in
Digampathana in Sigiriya were completely de-
stroyed by fire that ravaged the area and de-
stroyed more than 500 valuable plants. The For-
est Conservation Department said the fire had
spread rapidly because of the dry weather con-
ditions prevailing in the area and the difficulty in
accessing the area devastated by fire contributed
to the delay in extinguishing it. The fire was final-
ly doused by forest officers who were assisted by
the Dambulla Urban Council fire Brigade, the Si-
giriya police and local villagers9.
On August 4, a large area of the Hingurugoda
Forest Reserve in Meegahakiula was destroyed
by fire. In about 12 hours the fire spread over an
area of more than 20 acres. A turpentine planta-
tion was the worst affected. The Hingurugoda
Forest Reserve that falls under the administration
of Forest Conservation Department is primar-
ily a reforestation project, but many other trees
including teak, satin wood, lihiniya, ketakela and
rare species of plants are found within the re-
serve. An official of the Forest Conservation De-
partment was of the opinion that poachers had
set fire to the forest to track down wild animals9.
In another incident, over 300 acres of forest
cover was destroyed by fire which erupted in
Keerthi Bandarapura in Walapane on August 11.
Earlier, attempts by the Walapane police to extin-
guish the fire with the assistance of the residents
in the area proved abortive and the assistance of
the SLAF had been sought and the fire could be
controlled later8.
On September 3, an area extending up to
10 acres in the Imaduwa State Timber Reserve
in Laggala was completely destroyed due to a
wildfire that could be controlled after a long op-
eration. The forest officers were assisted by the
Laggala police, Laggala forest office and the vil-
lagers of the area. Large amount of timber was
destroyed in the fire. Difficulty in accessing the
origin of the fire contributed to the delay in ex-
tinguishing it9.
References:1. www. pajhwok.com
2. http://english.ruvr.ru
3. http://dev.bdnews24.com
4. The Independent
5. Kuensel
6. The Hindu
7. Kantipur News
8. The Island
9. Daily Mirror

| 68 |
Introduction
Chapter 8
An overviewThe year 2011 witnessed significant and dev-
astating earthquakes of varying strengths
in several parts of the globe, which caused
huge losses of both property and persons.
The frequency of earthquake events surged
globally in comparison to last year 2010
Earthquake
as reported by SADR (2010)1 of SAARC Di-
saster Management Centre (SDMC). About
eighteen earthquake events with magni-
tude greater than 7.0 occurred in all over
the world (Table 8.1), which was found to be
more devastating in terms of death toll and
destruction (Table 8.1).
Year/Month/Day Longitude Depth(km) Magnitude Region
2011 /01 /01 -63.136 577 7.0 Santiago del Estero, Argentina
2011/ 01 /02 -73.326 24 7.2 Araucania, Chile
2011 /01 /13 168.471 9 7.0 Loyalty Islands
2011 /01 /18 63.951 68 7.2 Southwestern Pakistan
2011 /03 /09 142.842 32 7.3 Near East Coast of Honshu, Japan
2011 /03 / 11 142.373 29 9.0 Near East Coast of Honshu, Japan
2011 /03 / 11 141.111 43 7.9 Near East Coast of Honshu, Japan
2011/ 03 /11 144.590 19 7.7 Near East Coast of Honshu, Japan
2011/ 04/ 07 141.573 42 7.1 Near East Coast of Honshu, Japan
2011/ 06 / 24 -171.837 52 7.2 Fox Islands, Aleutian Islands
2011/ 07 /06 -176.413 68 7.6 Kermadec Islands region
2011/ 07 /10 143.264 23 7.0 Off the East Coast of Honshu, Japan
2011 /08 /20 168.098 32 7.2 Vanuatu
2011/ 08 /20 168.222 28 7.1 Vanuatu
2011/ 08/ 24 -74.506 145 7.0 Northern Peru
2011/ 09 /03 169.748 171 7.0 Vanuatu
2011/ 09 /15 -179.270 593 7.3 Fiji region
Table 8.1 : Global Earthquakes Magnitude (> 7.0) and Greater in 2011 (Source: USGS2)
Most devastating tsunamigenic earthquake
(Mw 9.0) rocked near the east coast of Honshu,
Japan on March 11, 2011 in which about 20,000
people were killed. This great tsunamigenic
earthquake of Japan created a wide-scale panic
among the people of coastal countries of Pacific
and Indian Ocean, including the coastal countries
of SAARC regional Countries (Bangladesh, India,
Maldives, Pakistan, and Sri Lanka).
Analyses of the global earthquake data re-
lated to its frequency and the trend of different
strengths (M > 6.0) suggests that trend assumed

South Asia DisasterReport 2011
| 69 |
a positive slope since 2009 (160) to 2011(204) as
shown in Figure 8.1, while analyses of global di-
saster scenario in comparison to previous years
2009-2010, the total number of people killed
during these years showed erratic variation. The
maximum death toll was reported in the previ-
ous year 2010 (3, 20, 129), while the year 2011
reported a total death toll of only 21, 401 people
due to earthquake (Figures 8.2 – 8.3) in spite of
the number of moderate to strong earthquakes
occurred in the year 2010 was lesser (174) than
that of the year 2011 (204). It is worth to men-
tion that death toll in the year 2010 was a dras-
tically very high because of the great 2010 Haiti
killer earthquake (Mw 7.6) and the 2010 Qinghai
earthquake in which a total of 2,22,570 and 2,968
people were reported dead, respectively. The Figure 8.1: Graph showing number of earthquakes of different
magnitudes occurred during last four years.
Date UTC Region Magnitude Number Killed *
2011/ 01/ 18 Southwestern Pakistan 7.2 3
2011/ 02 /04 Myanmar-India border region 6.2 1
2011/ 02 /21 South Island of New Zealand 6.1 181
2011/ 03/ 10 Myanmar-China border region 5.5 25
2011/ 03 /11 Near East Coast of Honshu, Japan 9.0 20,352
2011/ 03 /24 Myanmar 6.9 74
2011 /04 /07 Near East Coast of Honshu, Japan 7.1 3
2011 /04 /11 Eastern Honshu, Japan 6.6 7
2011/ 05/ 11 Spain 5.1 10
2011 /07 /19 Kyrgyzstan 6.1 14
2011 /09/ 05 Northern Sumatra, Indonesia 6.7 10
2011 /09 /18 Sikkim, India 6.9 108
2011/ 09 /19 Guatemala 5.6 1
2011 /10 /23 Eastern Turkey 7.1 601
2011 /10 /28 Near the coast of central Peru 6.9 1
2011 /11 /09 Eastern turkey 5.6 8
2011 /12 /11 Guerrero, Mexico 6.5 2
Total 21,401
year 2011 though witnessed the 2011 great tsu-
namigenic Japan earthquake (Mw 9.0), but death
toll was restricted to about 20,352, which was
much lesser than that of previous year as report-
ed by SADR (2010)1 (Table 8.2).
Table 8.2: Loss of lives during damaging earthquakes that occurred in the year 2011
* Includes "missing and presumed dead"; (Accessed on 6-01-2012) (Source: USGS)

| 70 |
Introduction Earthquake
South Asian Seismicity in 2011
A majority of south Asian countries is very
much prone to high seismic potential because
of intricate seismotectonic settings and complex
geology of the region. A total of five countries
(Afghanistan, Bhutan, India, Nepal, and Pakistan)
of SAARC Member States are located in the vicin-
ity of the Himalaya, which is seismically very ac-
tive. Other three countries (Bangladesh, Maldives
and Sri Lanka) are associated with coastal hazards
and having history of experiencing earthquake
shaking from the nearby seismogenic zones
of neighbouring countries. The occurrences of
earthquakes were found to take place differently
in different periods. In comparison to the years
of 2007 – 2010, the year 2011 recorded relatively
lesser earthquakes (4.0 < M < 9.1) in the South
Asian country (Figure 8.3a, Table 8.3a, Appendi-
ces VA - VC). Earthquakes reported by different
agencies for South Asian earthquakes are shown
in the enclosed appendices that reflect uneven
distribution of earthquakes of different strengths
in the region. Most of earthquakes recorded dur-
ing the year 2011 were not damaging except the
September 18, 2011 Sikkim – Nepal Border earth-
quake, while majority of earthquakes even of mi-
Figure 8.3a: Graph showing global estimated death toll due to earthquakes during 2007 - 2011
cro to moderate earthquakes generated enough
public panic in the region.
2007 2008 2009 2010 2011
Afghanistan 1 5 10 29 34
Bangladesh 0 0 1 5 0
Bhutan 1 4 3 1 1
India & Adjacent region
77 82 56 70 27
Maldives 0 0 0 0 1
Nepal 23 24 18 19 45
Pakistan 25 7 5 17 13
Sri Lanka 0 0 1 0 1
Total 127 122 94 141 122
Table 8.3a: Significant earthquakes of South Asia Region 2011
Figure 8.3b: Graph showing distribution of earthquakes for last 5-years for South Asia
(Source: EMDAT, GDAC, IMD, PMD, NSC, SDMC)
Earthquakes were reported by several agen-
cies other than EMDAT3, and GDAC4 (Appendix
VA), such as India Meteorological Department
(IMD) (Appendix VB), and National Seismological
Centre of Nepal (NSC) (Appendix VC), different
sources showed seismic propensity for the year
2011 of Bangladesh, Bhutan, Maldives Islands
and Sri Lanka is comparatively much lesser than
those of other SAARC Member countries (Table

South Asia DisasterReport 2011
| 71 |
8.3a), while other SAARC countries located in
the vicinity of Himalayan region, except Bhu-
tan showed appreciable number of earthquake
events. Maximum number of moderate earth-
quakes occurred in Nepal (45), followed by Af-
ghanistan (34), India and its border region (27),
and Pakistan (13).
Earthquake Damage Scenario of 2011
The overall damage pattern in terms of peo-
ple killed and people affected due to different
earthquakes are shown in Figures 8.3 (b & c) that
clearly depict that India is worst sufferer followed
by Nepal, and Bhutan. This scenario of dam-
age is mainly contributed to the September 18,
2011 Sikkim – Nepal trans-boundary earthquake,
which killed people in the border region of India,
Nepal and Bhutan, though its epicenter was lo-
cated in the northern part of Sikkim, India.
Country Killed % no of Killed
Tot. Affected
% of Number affected
Bhutan 1 0.82% 20016 2.8
India 112 91.80% 575200 80.62
Nepal 7 5.74% 117213 16.44
Pakistan 2 1.64% 1000 0.14
Total 122 100 713429 100
Table 8. 3b: A table showing percentage distribution of damage pattern
A total of 122 people were reported to have
been killed in SAARC region during the year
2011, among which 112 were from India, seven
from Nepal, two from Pakistan, and one from
Bhutan (Table 8.3b). But the statistical distribu-
tion of the people affected during 2011 due
to earthquakes are found much more in Bhu-
tan than that of Pakistan, while India showed
maximum affect followed by Nepal. This observa-
tion is corroborated with the size and number of
stronger earthquakes that rocked different SAA-
RC countries.
(Source: EMDAT3)
Figure 8. 3c: Distribution of people killed during earthquakes in SAARC Member States
Figure 8.3d: Distribution of people affected during earthquakes in SAARC Member States
Significant Earthquakes of South Asian Region in 2011
Afghanistan
Afghanistan has proven track record of exhibit-
ing high seismic propensity because of its com-
plicated seismotectonic settings associated with
several sets of seismogenic faults and linea-

| 72 |
Introduction
ments, making the region seismically vulnerable
and hazardous as evident from the Seismic Haz-
ard Map of Afghanistan as shown in Figure 8.4a
Distribution of historical seismicity (1990 - 2011)
recorded till the year 2011 (Figure 8.4b) is found
to be very much corroborative with the seis-
mic hazard map of Afghanistan. Afghanistan
was associated with some of following percep-
tible earthquakes that generated sufficient panic
among its people.
Earthquake
Figure 8. 4a: Map showing seismic hazard map of Afghanistan
Hindu Kush Earthquakes
An earthquake of magnitude 5.6 rocked the
Hindu Kush region on March 21, 2011 at 0949
GMT2. The depth of the earthquake was 184.60
km and its impact was strongly felt in north-
east of Afghanistan at 36.5631 degrees north
latitude and 70.9438 degrees east longitude.
There were no reports of damage of structures
without any causality in the region9.
North Afghanistan Earthquake
On May 14, 2011, an earthquake of magnitude 5.9
struck in remote region of north Afghanistan. The
epicenter was located at about 140 km (86 miles)
from Khorugh in Tajikistan and 236 km (146 miles)
from Mingora in Pakistan, with a depth of 207 km
(128 miles) 2. There were no reports of casualties
or damage9. The remote region of north province
of Afghanistan was also jolted due to this moder-
ate earthquake as shown in Figure 8. 5a.
Figure 8.4b: Distribution of historical seismicity since 1990 till 2011. Blue dots denote deeper earthquakes, while green, yellow, and brown
dots denote shallower earthquakes.
Figure 8.5a: Snap showing the remote region of North Afghanistan jolted in Earthquake (M5.9)
(Source: Press TV)
Northern Provinces Earthquake
The Hindu-Kush region of Northern Province of
Afghanistan jolted with the earthquake mag-
nitude 5.2 on August 18, 2011.The earthquake
occurred around 4.22 a.m. local time and the
epicenter distance of earthquake was found to
be over 200 km around the Hindu-Kush region
located at the depth of 55 km. There were no

South Asia DisasterReport 2011
| 73 |
causalities reported in this earthquake. Especial-
ly this region is highly prone to frequent earth-
quake 10 (Figure 8.5b).
Figure 8.5b: Snap showing the affect of the Earthquake (Mw 5.2) on structure around the Hindu Kush
[Source: PAN (Kabul)]
Hindu Kush Region Earthquake
On August 26, 2011, an earthquake (Mw 5.4)
struck Hindu Kush region of Afghanistan and its
record exhibited severe shaking in most parts
of areas adjacent to the Hindu Kush (Figure 8.6).
The tremor took place at depth (199.10 km) at
20.32 hrs local time in the northern part of Af-
ghanistan. The epicenter was found at 36.4463
degrees north latitude and 70.6950 degrees east
longitude2.
Figure 8.6: Snap showing the record of August 26, 2011 earthquake (Mw 5.4) in Hindu Kush region
Hindu Kush Region Earthquake
Other events of earthquake in highly seismic
Hindu-Kush region had jolted on April 19, 2011.
The intensity of tremor was determined at 42
km from the capital city, Kabul. People became
very panickys though aftershocks were of micro
tremors, while some of those were perceptible.
But relatively shallower depth (38 km) of events
might have caused an appreciable shaking in the
region. There were no report of causalities and
damage. This earthquake was important in sense
that it hit the Hindu Kush region having trans-
boundary impact (Figure 8.7).
Figure 8.7: Map showing the intensity of the earthquake of October 18, 2011 Hindu-Kush Earthquake Magnitude (M4.3)
(Source: USGS)
Bangladesh
Bangladesh is by and large seismically less ac-
tive than that of its other neighbouring coun-
tries of South Asia located in the vicinity of the
seismically active Himalayan zone. A systematic
study on earthquake in Dhaka city jointly con-
ducted by Lamont-Doherty Earth Observatory,
Columbia University, USA and the Department
of Geology, Dhaka University in 2004 demon-

| 74 |
Introduction
strated that the western part of the capital from
Mirpur-Kalyanpur to Pagla along the Buriganga
River and the eastern part from Uttar Khan-Bad-
da to Demra along the Balu River fall in the high
risk zone. Bangladesh continued to get shaking
from perceptible earthquakes that occurred dur-
ing the year 2011 in the border areas with India
and Myanmar. Severe shakings due to the Sep-
tember 18, 2011 Sikkim mainshock and its after-
shocks were felt by Bangladesh, which generated
a large-scale panic as a warning for its unplanned
city because of the poor structures and fragility
of the built structures or buildings. Despite the
great epicenter distance of the Dhaka city from
Sikkim mainshock, the degree of earthquake
shaking was very much appreciable and per-
ceptible to residents of the city12. In addition to
a series of tremors resulted from the September
18, 2011, Bangladesh also felt about 10 tremors
of different strengths from the surrounding seis-
mogenic regions of Bangladesh during February
2011 – September 2011.
An earthquake measuring 6.4 on the Rich-
ter scale had struck the country at 7: 47 hrs local
time on February 4, 2011 .The epicenter of earth-
quake was located at Myanmar-India border at
the distance of about 402 km east-northeast of
Dhaka. The hypocenter was 70 km deep because
of which the tremor had much lesser shaking.
There were no report of causalities and dam-
age12. Another earthquake occurred on Febru-
ary 12, 2011 felt in several parts of the countries,
the tremor that had measured 4.3 on the Richter
scale began at 4:25 p.m. and lasted about 15 sec-
onds. The epicenter was 96 km south-east of the
capital somewhere near the Comilla-Tripura bor-
der. It was also felt in the Sylhet region including
Habibganj, Moulvibazar and Sunamganj. No ca-
sualty or loss of property was reported. On Feb-
ruary 24, 2011, another shaking was experienced
at 11.36 BST (local time near Bangladesh-India
border region), measuring 4.3 on Richter scale.
The distance of the epicenter was 106 km east-
southeast of Bangladesh. There were no report of
any casualty in the earthquake; however it gener-
ated fear among the people of Bangladesh, resid-
ing near the border area.
On June 3, 2011, a tremor measuring 4.9 on
the Richter scale was felt at 6:53 BST. The epicen-
ter of the quake was 488 km off from the capital
near Nepal-Sikkim (India) border region. There
were no reports of casualties or damage in the
earthquake12. On June 9, 2011, a light tremor of
4.5 magnitude jolted several parts of the coun-
try around 1:34 BST. The epicenter of the earth-
quake was in Rajbari-Faridpur border region at
108 km west from the capital12. On June 21, 2011,
a tremor measuring 4 on the Richter scale had
struck in the capital and other part of the coun-
trie at 10:50 BST. Its epicenter was 64 km of the
capital somewhere near Comilla-Chandpur bor-
der region. There were no reports of damages or
casualties12. On June 24, 2011, mild earthquake
measuring 4.5 on the Richter scale had jolted
the several parts of the country at 6:39 BST. The
epicenter of the earthquake was in Tripura of
India and 133 km east of Dhaka11, 12. On July 10,
2011, a tremor measuring 4.8 on the Richter
scale had struck in several parts of the country
at 6:40 BST. There was no report of any casualty
or damage12. An earthquake again jolted in capi-
tal and its adjoining areas on July 22, 2011.The
tremor had measured M 4.1 on the Richter scale
and the epicenter of earthquake was found to
have located in the north-east of Bangladesh12.
People felt more panic with simultaneous earth-
quake event within this month which had stuck
in different areas of Rajshahi and Rangpur di-
Earthquake

South Asia DisasterReport 2011
| 75 |
visions at 11.50 BST on July 28, 2011. An earth-
quake of magnitude 4.1 on Richter scale and
epicenter at found Naogaon region occurred in
Bangladesh12. All these smaller tremors felt in
Bangladesh during the year 2011 had sufficient-
ly generated fear among people of the country
due to frequent shakings, even if there were no
reports of damages of property and causalities
in Bangladesh.
Impact of Sikkim Earthquake in Bangladesh
On September 18, 2011 the Sikkim earth-
quake (Mw 6.9) occurred in the northern part of
the Sikkim about 495 km away from the north-
west of Dhaka city at about 20 km depth (Figure
8.8a). It was the strongest tremor to have hit the
region in the last six decades. The tremor had dam-
aged a number of buildings and structures in parts
of the country. People received a sudden evening
shock and started to run out of their buildings and
generated inconsolable panic across the capital
city of Dhaka, Bangladesh (Figure 8.8b). There were
no report of causalities and much damage except
few buildings showed cracks in some of structures.
The panic-stricken people rushed out into the
street from house.
Bhutan
Owing to complex geotectonic settings of
Bhutan, besides its location in the courtyard of the
mighty Himalayan zone, the country has become
one of the seismically most prone countries of the
world. The year 2011 was found to be seismically a
quiet year in sense of generation of the damaging
earthquake within its own territory. However, a pow-
erful tremor rocked western Bhutan on September
18, 2011 due to the Sikkim earthquake (Mw 6.9)2
in the vicinity of Bhutan (Figure 8.8a). During the
strong shaking in Bhutan a Partial collapse of the
communication system was observed (Figure 8.8b).
Figure 8.8b: Evening shock: People run out of their buildings and gather on the streets as a 6.8 magnitude earthquake sends a wave of panic
across the capital and elsewhere in the country (Source: The Daily Star, BSS, Dhaka
The quake’s epicentre was located at a dis-
tance of 64 km from Gangtok, Sikkim, India, the
tremors of which were also appreciably felt in
Thimphu. Cracks to buildings were reported in
some parts of the country. In Thimphu, the re-
ferral hospital’s emergency ward received three
trauma cases, and two cases of disjointed shoul-
ders of people who had fallen during the tremor.
The three women who were traumatised were
all students of the Institute of Language and Cul-
ture Studies in Semtokha. The hostel filled with
screams, as things started to fall and make all
kinds of noises, and within seconds it was a cha-
os as everyone started to flee the hostel. There
was a report of earthquake chaos in hospitals of
Figure 8.8a: Map showing epicenter location of the September 18 Sikkim earthquake (Mw 6.9)

| 76 |
Introduction
Thimphu that noticed patients scrambled to get
out of hospital, along with their drips and carry-
ing their glucose bottles. Patients were scream-
ing and struggling to run and found that they
were limping and holding on to each other with
glucose bottles in their hands as reported by the
nurse on duty said. The hospital building in Thim-
phu suffered several cracks and damages. Several
bottles of medicines were reported wasted due
to fall of glass bottles from the shelves in several
hospitals.
In Paro, the Ta dzong suffered structural
damage (Figure 8.8b), while some buildings in
Phuentsholing town have also cracked from
the tremor. A massive landslide was reported in
Phuentsholing that buried a car, which was on
its way to the hospital. The driver managed to es-
cape. In Dagana, the quake had damaged Phun-
sum community primary school in Lajab gewog.
About nine houses in three gewogs of Samtse
Earthquake
Figure 8.9b: Snap showing partial damage of the a Paro - Ta Dzong wall during the September 18, 2011 Sikkim earthquake
(Mw 6.9) (Source:Kuensel Newspaper
were reported damaged by the quake. Power
cuts were also reported throughout the country.
Except for landline and Tashi Cell network, cel-
lular services remained broken and jammed for
hours. Thimphu Dzong has sustained some cracks
in the Utse and one of the four corner towers. Oc-
cupants were shifted out to safer parts. The Sik-
kim mainshock that hit Bhutan was just 90 km
away from the epicentre and its tremors were felt
strongly up to160 km from epicentre. Paro and
Haa, experienced more damage quoted by the
government official of Bhutan. A detailed study
on damage pattern due to the Sikkim earthquake
(Mw 6.9) in Bhutan was found to have affected
about 3,757 structures in 18 districts of Bhutan14.
990 structures damaged in Chukha.
Such scenario reflects the public panic in
Bhutan due to the September 18, 2011 Sikkim –
Nepal earthquake (Mw 6.9) even by trans-bound-
ary earthquake. Failure of connectivity in such a
disastrous moment in itself is a grave disaster as
quoted by the disaster officials of the Royal gov-
ernment of Bhutan13. The Prime Minister, Jigmi
Y Thinley requested the people of Bhutan to re-
main calm and alert.
India
During the year 2011, about 27 weak to strong
magnitude earthquakes, including a strong mag-
nitude Sikkim earthquake occurred in India. Only
Sikkim earthquake was found to be disastrous
earthquake that caused sufficient losses of both
property and person in India, Nepal and sur-
rounding region of Bhutan. Some of the widely
felt Indian and its border regional earthquakes
are discussed below:
Delhi EarthquakeAn earthquake (Mw 7.4) rocked south-west-

South Asia DisasterReport 2011
| 77 |
ern Pakistan and its shaking was so severe that
people of north-western part of India, including
the national capital, New Delhi also felt the trem-
or (Figure 8.10). The India Meteorological Depart-
ment had recorded the epicentre of the earth-
quake in south-western Pakistan that falls in the
desert area bordering Iran and Afghanistan. The
quake was located at 28.9 degrees north on the
latitude and 64 degrees east on the longitude
but according to US Geological Service report,
the epicentre of the earthquake was located 45
km from Dalbandin in Southwest Pakistan2. It
was reported that the focal depth of the earth-
quake was 84 km. There was no immediate re-
port of any loss of life or property14, 15.
Figure 8.10: An earthquake of 7.4 magnitudes had struck south-western Pakistan felt in New Delhi (Source: USGS2; IMD)
properties in earthquke10. A tremor, measuring
3.1 on the Richter scale, jolted Sangli district of
Maharashtra on February 2, 2011 at 6:20 hours
local time. The epicenter was located about
14 km away from Sangli in Waranawati area,
no damage or casualty was reported in
earthquake 18, 19, 20. Shaking due to an earthquake
(M 6.4) was felt in different parts of the north-
east and West Bengal provinces of India on Feb-
ruary 4, 2011. The Epicentre of the earthquake
was located at Indo-Myanmar border in Manipur.
It was about 30 km below the earth surface and
was strongly felt in Assam5. The tremor was also
felt in Meghalaya, Manipur and parts of Mizoram,
West Bengal and Nagaland. There were no report
of causality and damage19, 20. The Chamoli and Ru-
draprayag districts of Uttarakhand of India were
shaken by a low-intensity earthquake (M 3.3) on
February 14, 201119,20,21, and it rekindled the worst
memory of the 1999 Chamoli earthquake (M 6.3)
that caused a severe loss to both property and
person in the area. An earthquake (M 5.8) had
struck in Kashmir valley on March 21, 2011. The
epicentre was located in the Hindu Kush Moun-
tain range in Afghanistan19,20,21, which is the site of
intense seismicity that have affect in the adjoining
regions of Afghanistan, Pakistan and India. This
earthquake created panic among the people of
Kashmir and its surrounding region of J & K, India.
The national capital region of India felt shaking
due to earthquake (M 5.7) on April 5, 2011. Tremor
was felt in New Delhi and adjoining Noida, Ghazi-
abad and Gurgaon. The epicenter was located in
the Indo-Nepal border region. No report of any
damage was received from the area20. April 25,
2011, witnessed an earthquake (M 5.0) in the Jam-
mu-Kashmir of India of which the epicentre was
located in Pakistan (Figure 8.11a). The earthquake
was of mild intensity with coordinates measur-
Micro to Moderate Tremors in IndiaSeveral micro to moderate earthquake trem-
ors were felt in India during the year 2011. A 3.2
magnitude earthquake hit the Haryana-Uttar
Pradesh border at 8.37 a.m. on January 26, 2011.
There was no report available to suggest any
casualty or damage18 due to this micro-tremor.
An earthquake of magnitude 2.3 occurred in
Bhachau on January 30, 2011 at 4.54 a.m., which
was located about 22 km away from Gandhi
Nagar. There were no reports of loss of life and

| 78 |
Introduction
ing 36.230N and 72.170E. There were no report of
damage and loss of life 14, 19, 20.
Earthquake
Figure 8.11a: An earthquake measuring 5.0 on the Richter scale occurred in Jammu and Kashmir on April 25, 2011.
Figure 8.11b: Snap showing panic-stricken people out of their homes because of the Sonepat earthquake (M 4.2)
The Kashmir valley was rocked again by low
magnitude earthquake (M 4.4) on May 30, 2011.
The epicentre was also located in Pakistan with
coordinates of 32.070N of latitude and 70.110E
of longitude. There was no report of any damage
due to the quake15. Punjab–Haryana earthquake
(M 4.6) on June 20, 2011 had generated signifi-
cant amount of tremor that was felt in different
parts of Panjab, Haryana and Chandigarh. The
epicentre was located in Uttarakhand near the
Chamoli region. There were no report of any loss
of life and property18, 19; moreover, it generated
severe panic among the people of these Indian
provinces.
It was reported that a quake of medium in-
tensity jolted Delhi and its adjoining satellite
towns on September 8, 201116 at about 11:28
IST that pulled panic-stricken people out of their
homes as shown in Figure 8.11b.
The tremor was reported to have occurred,
measuring 4.2 on Richter Scale with Haryana's
Sonepat as epicentre, were felt across Delhi and
its adjoining satellite towns of Ghaziabad and
Noida in Uttar Pradesh and Gurgaon in Haryana.
The tremors were felt for less than ten seconds.
There were no reports of any casualty. A report
from Chandigarh said that tremors were felt
in Panipat, Faridabad, Gurgaon among others
towns of Haryana. An earthquake (M 4.8) rocked
Bhuj and surrounding areas of the Kutch district
on the September 12, 2012 and it had generated
severe panic among residents in the radius of 50
km of the region.
The detailed of the September 18, 2011 Sik-
kim earthquake (Mw 6.9) is described in a sepa-
rate section because of its wide-scale damaging
report from India, Bhutan and Nepal.
Sikkim EarthquakeAs mentioned above, the occurrence of Sep-
tember 18, 2011 Sikkim–Nepal earthquake (Mw
6.9) reflects that it is one of the best examples of
trans-boundary earthquake that affected almost
all border regions of Himalaya, which includes,
India, Nepal, Bhutan and a part of Bangladesh.
The event, which comes under the category of
"moderate earthquake” was strongly felt in Sik-
kim, Assam, Meghalaya, northern parts of West
Bengal, Bihar, parts of other eastern and northern
regions of India. As mentioned above, it was also
well felt in Bangladesh. The jolt was severe in the
Sikkim State of India (Figure 8.12).

South Asia DisasterReport 2011
| 79 |
The epicenter was located in a seismically
known and active belt called, Alpine-Himalayan
seismic belt. The earthquake rocked at 12:40:48
UTC and recorded by several seismological agen-
cies in the world (USGS) 2 and India Meteorologi-
cal Department (IMD)5. The quake was also re-
corded by all the seismological observatories of
Geological Survey of India21. The earthquake is a
shallow focus (depth 19.7 km; USGS) of magni-
tude 6.9 Mw (USGS) having its epicenter near the
India-Nepal border (latitude : 27.73°N ; longitude:
88.08°E) and situated 68 km north-west of Gang-
tok, Sikkim, India (Figure 8.13a). To locate the Sik-
kim earthquake, precisely for better estimates,
seismological parameters were a great challenge
for seismological agencies because of fewer
numbers of seismological observatories ascribed
to different organisations of India and abroad.
The preliminary hypo-central parameters of this
earthquake estimated by the Seismic Monitor-
ing Network of India Meteorological Department
(IMD) are given in Table 8.4.
It was important because correct estimates
of seismological parameters could provide con-
spicuous information on strength of shaking due
to earthquake. This endeavor also shed light on
nature and extent of damage pattern in the epi-
centre area. Estimates of these parameters made
by regional and global agencies were corroborat-
ed with local and national agencies to ascertain
the authenticity of the estimates.
Figure 8.12: Snap showing the extent of earthquake shaking felt at different locations
Figure 8.13a: A map showing epicenter of September 18 Sikkim–Nepal earthquake (Mw 6.9)
Magnitude 6.9
Date-Time Sunday, September 18, 2011 at 06:10:48 PM at epicenter (Local Time)
Location 27.723°N, 88.064°E
Depth 19.7 km (12.2 miles)
Region Sikkim, India
Distances 68 Km (42 Miles) NW of Gangtok, Sikkim, India 119 Km (73 Miles) NNW of Shiliguri, West Bengal, India272 Km (169 Miles) E of Kathmandu, Nepal572 Km (355 Miles) N of Kolkata (Cal-cutta), West Bengal, India
Table 8. 4: Detail of Sikkim earthquake of September 18, 2011 (Source: USGS2, IMD)
Table 8.5: Earthquake Location Parameters by GSI 21
The recorded seismograms by three (Ad-
ampool, Agartala and Nagpur) seismic observa-
tories of Geological Survey of India (GSI) 21 had

| 80 |
Introduction Earthquake
conspicuously provided preliminary estimate
of the earthquake location parameters (lati-
tude, longitude, depth and origin time) by geo-
physicists / seismologists of Geo-seismology
Division, Geological Survey of India. The three
station method was used to get the observed
travel time between the recorded station and the
earthquake, while a robust 1-D velocity model of
Mishra et al. (2010)22 was considered to estimate
the theoretical travel time estimate and requi-
site parameters of the 2011 Sikkim earthquake
as shown in Table 8.5. Earthquake parameters es-
timated by GSI (Table 8.5) was found to be very
much closer to the estimates made by USGS and
IMD (Table 8.4). The magnitude of the mainshock
is found to be 6.9 ML and the focal depth is 18.2
km. The latitude and longitude of the epicentre
of the mainshock are found to be 27.7770 N and
88.0380 E respectively.
Seismotectonic Scenario of the Sikkim-Nepal Earthquake Source Zone
The Sikkim and adjoining region is known
to be the part of the seismically active region of
the 'Alpine-Himalayan global seismic belt', where
four great earthquakes (M ≥8.0) occurred in the
region. The September 18 Sikkim earthquake
occurred near the boundary between the India
and Eurasia plates, in the mountainous region of
northeast India near the Nepal border. The colli-
sion with the Eurasian Plate along the boundary
between India and Nepal formed the orogenic
belt that created the Tibetan Plateau and the Hi-
malaya Mountains, as sediment bunched up like
earth before a plow. The Indian Plate is currently
moving northeast at 5 cm/yr (≈ 2 in/yr), while the
Eurasian Plate is moving north at only 2 cm/yr (≈
0.8 in/yr). This is causing the Eurasian Plate to de-
form and the India Plate to compress at a rate of
4 mm/yr (≈ 0.15 in/yr). In the Eastern Himalayan
Region, the Indian plate converges into Tibetan
plate at a rate of approximately 50 mm / yr. Initial
analysis suggests the earthquake was complex,
likely a result of two events occurring close to-
gether in time at depths of approximately 20 km
beneath the earth’s surface. At the latitude of the
September 18 earthquake, the India plate con-
verges with Eurasia at a rate of approximately 46
mm/yr towards the north-northeast. The broad
convergence between these two plates has re-
sulted in the uplift of the Himalayas, the world’s
tallest mountain range. The preliminary focal
mechanism of the earthquake suggests strike
slip faulting, and thus an intraplate source within
the upper Eurasian plate or the underlying India
plate, rather than occurring on the thrust inter-
face plate boundary between the two.
The occurrence of earthquakes in the region
is broadly associated with the tectonic activity
along well known faults in the Himalayas, namely,
Main Boundary Thrust (MBT), Main Central Thrust
(MCT). Other prominent geological / tectonic fea-
tures in and around Sikkim include: Tista linea-
ment, Kunchenjunga lineament, Purnea-Everest
lineament, Arun lineament and Dhubri fault in
the southeast. According to scientific Experts, the
entire area of Sikkim lies in Zone IV. The seismic
Zone IV is broadly associated with seismic inten-
sity VIII on the Modified Mercalli Intensity (MMI)
scale.
Date Time (UTC)
Lat (deg. N)
Long (deg. E)
Mag-nitude
18/09/2011 13:11:59 27.6°N 88.5°E 5.0
18/09/2011 13:54:17 27.5°N 88.4°E 4.5
18/09/2011 21:51:52 27.6°N 88.4°E 4.2
22/09/2011 16:44:43 27.6°N 88.4°E 3.9
Table 8.6: Significant aftershocks and their magnitudes recorded in September 2011

South Asia DisasterReport 2011
| 81 |
The magnitude and frequency of aftershocks
has shown decreasing trend of aftershocks with
the lapse of time as shown in Table 8.6.
This region experienced relatively moder-
ate seismicity in the past, with 18 earthquakes
of M 5 or greater over the past 35 years within
100 km of the epicenter of the September 18
event. The largest of these was a M 6.1 earth-
quake in November of 1980, 75 km to the
south-east. Seismological research revealed
that the Sikkim–Darjeeling Himalayan region
has not experienced large earthquakes for
more than 200 years, although the Indian plate
has been subducting (going underneath) un-
der the Eurasian plate at about 2 to 5 cm per
year, accumulating slip potential of about 4 m.
Seismologists have demarcated a gap zone
for earthquakes where no great earthquake
so far occurred despite being prone to a great
earthquake of magnitude 8 (Mishra, 2011)23.
The occurrence of the September 18, 2011 Sik-
kim earthquake (Mw 6.9) created severe panic
among the residents of north-east and north
India. It was reported that more than 100 peo-
ple were died so far due to this earthquake. The
major tectonic features traversing the Sikkim-
Himalaya are the well defined Main Bound-
ary Thrust (MBT) and circular overturned Main
Central Thrust (MCT) to the north. The Sikkim-
Himalaya lying between Nepal and Bhutan Hi-
malaya falls in the eastern sector of the Hima-
layan arc. The Sikkim region is surrounded by
several damaging earthquakes of the past al-
though it has not experienced so far an earth-
quake of magnitude 8. The region has only
experienced moderate seismicity in the past.
The most significant earthquake that occurred
in its neighbourhood is the 1934 Bihar-Nepal
earthquake of magnitude 8.4 to the west that
caused intensity VIII damaging Sikkim-Himala-
ya, the 1897 Shillong earthquake of magnitude
8.7 to the southeast and 1950 Assam earth-
quake of magnitude 8.7 to the east of Sikkim.
Geological Survey of India has already an-
ticipated that Sikkim Himalayan region is vul-
nerable to future strong to great earthquakes
as it is due for the same for years. That was why
Geo-Seismology Division, CGD, GSI (CHQ) had
conducted extensive seismological monitor-
ing of entire Sikkim – Darjeeling Himalaya by
installing sophisticated Seismographs in a well
defined network in the region since the year
2007 to generate dynamic snapshots of the
Sikkim – Darjeeling Himalayan region22. The re-
sults envisaged the vulnerability of the region
to earthquakes in the culminated zone where
MCT got buckled and assumed omega shaped
structure, indicating that the zone is more vul-
nerable to earthquakes of different strengths.
It is spectacular to note that the 18th Septem-
ber 2011 Sikkim earthquake (ML 6.9) occurred
near the intersection of the Kanchanjunga and
Tista Lineaments, which clearly falls in the zone
which was earlier demarcated zone of seismicity
by GSI team.
Damage Scenario of the Sikkim Earthquake The seismic hazard in Sikkim region is con-
centrated due to the presence of sedimentary
rocks and loose soil in the region. It is reported
that the present earthquake of magnitude 6.9
is the biggest earthquake in Sikkim so far. The
earthquake tremors associated with heavy
rainfall caused rock fall/landslides in parts of
Sikkim. Roads also reportedly cracked in sev-
eral places and people ran out on the streets
in fear. There were a lot damages to buildings,
property and floras reported from Sikkim (Fig-

| 82 |
Introduction
ures 8.14a & b). The affected area was blocked
due to landslides and water logging. Schools
and hospitals were reported to have been
damaged significantly during strong shaking
in Sikkim. Table 8.6 describes the loss of lives,
damage of property and casualties in India
and its border regions of Nepal and Bhutan.
The damage statistics for different parts of Sik-
kim and its adjoining areas are shown in Table
8.7. The shaking was so serious that it was ap-
preciably felt by most parts of north India
(Figure 8 .13b). Figure 8.13b: Snap showing spread of earthquake shaking in different
parts of India
S.N. Affected countries
Deaths Injured Cases
Population Displaced
Population Affected
Health Facilities
Schools Homes
1. India 112 > 300 30 285 17,679
2. Nepal 6 159 7,000 12,000 64 498 10,677
3. Bhutan 15 4 36 20 Full 324 Partial
Total 133
Table 8.6: Casualties and damages due to Sikkim–Nepal Earthquake
Source- WHO, National Emergency Operations Centre (NEOC)
Earthquake
S. No. District No. of houses damaged No. of schools damaged No. of hospitals damaged
1 North 6000 NR 07 FD
2 South 820 21 -FD NR
3 East 6000 - FD 9000 – PD 201 - FD 23 FD
4 West 1679 –FD 64- FD NR
TOTAL 14499 - FD 9000 – PD 286 - FD 30-FD
Table 8.7: Showing causalities and damages in India on updated 9/11/2011

South Asia DisasterReport 2011
| 83 |
Source:WHO, http://earthquake-report.com/2011/09/18/very-strong-earthquake-in-sikkim-india/
Figure 8.14a: Snaps showing damage scenario of September 18, 2011 earthquake (M 6.9)
Figure 8.14b: Snaps showing damage scenario of the earthquake (M 6.9)
Nepal
Nepal is seismically very active because of it in-
tricate seismotectonic settings located in the
main segment of the Himalayan range. Active
seismotectonic setting of Nepal is supported
by a series of occurrences of micro to moderate
earthquakes in Nepal and its vicinity. In 2011, a
total perceptible earthquakes recorded by dif-
ferent seismological agencies was 45, which was
about 2.5 times more than those recorded in the
preceding year 2010 (Table 8.3a, Figure 8.3b).
Among those recorded earthquakes during 2011,
the most disastrous earthquake recorded in Ne-
pal was the September 18, 2011 Sikkim–Nepal
earthquake (M 6.9), whose epicentre was located
in the northern Sikkim.

| 84 |
Introduction
The earthquake affected 15 eastern districts
of Nepal, as well as the capital of Kathmandu in
the Central Region. The affected districts included
15 districts in the eastern region, three districts in
the Kathmandu valley and the remainder in cen-
tral and western Nepal (Figure 8.15). The tremor
was felt across 26 districts of Nepal. It was report-
ed that over 4000 families were displaced from
the border areas of Nepal. About 3917 houses/
buildings were completely destroyed and 5966
partially damaged. About 130 schools were com-
pletely destroyed, while 550 were partially dam-
aged. Similarly, 26 health facilities had completely
destroyed and 38 partially damaged. It was also
reported that about 63 Government buildings
Earthquake
such as VDC offices, community buildings, elec-
tricity stations reported to be destroyed with a
further 204 buildings partially damaged. In 13 dis-
tricts of Nepal, schools are reported to be either
completely destroyed or partially damaged.
Other micro to moderate earthquakes of
Nepal occurred during the year 2011 were not
so powerful (Appendix VC) to bring the damage
to property and person in the region because
of their lesser strengths originated from the
deeper layers. The frequent shaking in Nepal due
to moderate earthquakes however generated
enough panic among people of the area to sense
fear for anticipated bigger earthquakes in the re-
gion after the perceptible shaking.
Figure 8.15: Map showing earthquake affected districts of Nepal during September 18, 2011 Sikkim–Nepal earthquake (M 6.9)
Pakistan
Pakistan is located in the vicinity of highly seis-
mically active zones of the world, such as the
Himalayan and its adjoining regions associ-
ated with the several sets of active seismogenic
faults, like the Chaman-Heart seismic belt; Indo-
Kohistan seismic belt; Hindu Kush – Pamir seis-
mic knot; and the border area with Iran having
a series of hidden and exposed seismogenic
faults in the region. The past damaging earth-
quakes ; such as the 1930 Quetta earthquake
and the 2005 Muzzafrabad earthquake brought
catastrophic damages to both property an lives
in Pakistan. The year 2011 is found to be rela-
tively calm and seismically less damaging for
Pakistan during which a total of 13 moderate

South Asia DisasterReport 2011
| 85 |
to strong earthquakes reported to have rocked
the country with two people killed in Pakistan
(Table 8.3a & b).
Micro to Strong Earthquakes of PakistanThe Hindu-Kush region experienced an earth-
quake measuring 4.8 Richter scale on January 1,
2011 at 11.23 a.m.16 that generated a several panic
among residents of Pakistan. An earthquake mea-
suring 5.1 on the Richter scale struck the north-
western parts of Khyber Pakhtunkhwa on the
January 2, 2011 with its epicentre located in the
Hindu Kush, a border area with Afghanistan. The
tremor was very much appreciable and it was also
felt in Peshawar area of Pakistan. There were no
reports of damages, and loss of property17. The
Pakistan - Afghanistan border experienced an
earthquake of magnitude 4.7 on the Richter scale
on January 7, 2011 with its epicentre located at
30 km east of Khuzdar in Balochistan province16,
which brought residents out of their houses be-
cause of severe panic due to shaking in the area.
Pakistan Earthquake A devastating earthquake (M 7.2) was re-
ported that rocked Pakistan on January 18, 2011.
The earthquake parameters are described in the
Table 8.8 and Figure 8.17.
Magnitude 7.2
Date-Time
• Tuesday, January 18, 2011 at 20:23:23 UTC
• Wednesday, January 19, 2011 at 01:23:23 AM at epicenter
• Time of Earthquake in other Time Zones
Location 28.732°N, 63.928°E
Depth 68 km (42.3 miles) set by location programme
Region South-western Pakistan
Distances
50 km (30 miles) WSW of Dalbandin, Pakistan
260 km (160 miles) W of Kalat, Pakistan
310 km (190 miles) ESE of Zahedan, Iran
1035 km (640 miles) WSW of Islamabad, Pakistan
Table 8.8: Earthquake parameters of January 18, 2011 Pakistan earthquake (M 7.2)
Its epicentre was in a remote area located
about 320 km (200 miles) south-west of the
Baluchistan capital Quetta, near the Afghan bor-
der. Two woman patients were reported died
from heart attacks and 200 mud houses were
damaged in Balochistan. In Dalbandin, several
people were injured when the roofs of their
houses collapsed (Figure 8.18). The shaking of
the earthquake was very strong and was felt in
different parts of Pakistan, Afghanistan and India,
including some parts of the middle-east coun-
tries of the world. Tremors were also felt as far
away as Dubai and New Delhi. Local TV of Paki-
stan reported that the quake was felt through-
out Punjab, Sindh, and Balochistan provinces in
Pakistan, as well as in parts of Iran and India 25, 26.
Many people in the country's largest city, Kara-
chi, rushed out into the streets in panic after the
quake. Most of the mud-wall houses were dam-
aged in and on the outskirts of Dalbandin town.

| 86 |
Introduction Earthquake
Figure 8.17: Maps showing earthquake locations and intensity map of January 18, 2011 Pakistan earthquake (M 7.2).
Villages of Killi Qasim Khan, Killi Khuda Bakhsh,
Killi Baz Mohammad, Killi Daudabad, Chater and
Yakmach were affected. A number of govern-
ment offices were also damaged. Many people
did not want to return to their damaged homes
because of fears of aftershocks. Some houses in
Kalat and Surab were also damaged. As men-
tioned above people of Quetta, Pakistan were
aware of the devastation caused by the 1935
earthquake in the area hence they spent the en-
tire night outside their homes in freezing minus-
seven degree cold25.
This major earthquake occurred as a re-
sult of normal faulting within the lithosphere
of the subducted Arabian plate. The present-
day tectonic environment of Pakistan is de-
termined by the motions of the Arabian and
Indian plates north-northeast with respect to
the Eurasian plate at velocities of 40 mm/y at
the longitude of this earthquake. Arabian-plate
lithosphere is subducted beneath the Eur-
asia plate at the Makran coast of Pakistan and
Iran, and becomes progressively deeper to the
north. The subducted Arabian plate is known
Figure 8.18: Snaps showing damage scenario of Dalbandin due to Pakistan earthquake (M 7.2).

South Asia DisasterReport 2011
| 87 |
to be seismically active to depths of about
160 km. The frequency of moderate and large
earthquakes within the subducted Arabian
plate is not high compared with the frequency
of such events in some other subducted plates
worldwide, but several earthquakes have oc-
curred within this slab in the region of this
event over the past 30 years, including a mag-
nitude 6.7 shock two hundred kilometers to
the south-west in 1983.
Relief and Response operation by South Asian Governments during 2011 Earthquakes
It is a proven fact that earthquake is most
uncertain natural calamity that can strike any-
where at any point of time that may cause un-
expected damage to property, person, flora
and faunas in the region as witnessed dur-
ing the damaging September 18, 2011 Sik-
kim–Nepal earthquake (M 6.9). As mentioned
above that the September 18, 2011 earthquake
was a trans-boundary earthquake, which af-
fected India, Bhutan, and Nepal due to strong
shaking, besides spread of severe panic
among the people of Bangladesh, residing in
the border areas of NE India. The January 18,
2011 Pakistan earthquake (M 7.2) was found
to be panic-stricken one in several parts of
Pakistan, Afghanistan, India and Iran that caused
considerable damage to buildings and struc-
tures due to appreciable shaking. Governments
of the affected countries of South Asia (India,
Bhutan, Nepal and Pakistan) took prompt and
comprehensive measures to deal with earth-
quake disasters by deploying their rescue mis-
sions and disaster response forces to normalise
the situation through proper arrangements of
relief, reconstruction, rehabilitation measures
during and after earthquakes that rocked affect-
ed areas.
The Government of India’s response was
very fast and comprehensive. According to the
report available from the Ministry of Home Af-
fairs, massive relief and rescue operations were
carried out in the quake-affected areas of Sik-
kim, Bihar and West Bengal. It was reported that
about 5,000 army personnel, 700 ITBP person-
nel helped in relief and rescue operations. More
than 3,000 people had been rescued by armed
forces from quake-ravaged areas of Sikkim. Sev-
enteen helicopters had been also deployed by
India Air Force (IAF) with rescue teams and relief
supplies to affected areas immediately. The ar-
rangement for airdropping of food packets was
being carried out by the management of the
State Govt. of West Bengal. The central govern-
ment of India also deployed rescue team for all
four districts of Sikkim to assess damage, medi-
cal aid, supply of drinking water and essential
commodities. The Government of India sanc-
tioned an ex-gratia of Rs. two lakh each from
the Prime Minister’s National Relief Fund to each
deceased person and Rs. one lakh each to those
seriously injured in the earthquake. During res-
cue operation five teams of NDRF had been de-
ployed for search and rescue operations at Ship-
gyar, Biha and Bringbang Ramam, Lingzya and
Dzongu villages in Mangan. About 10 teams of
NDRF consisting of 419 personnel along with
necessary search and rescue equipment were
deployed very first day in Sikkim. Teams sta-
tioned at Lachung and Chungthang area of Sik-
kim were involved in carrying out rescue and
relief operations besides repairing of damaged
roads and bridges in the affected areas of West
Bengal, Bihar and Sikkim states of India as shown
in Figure 8.19a & b and Figure 8.20a & b. A medi-
cal team comprising 19 doctors (surgeon – four,

| 88 |
Introduction Earthquake
orthopedician – six, anaesthesian – five, neuro-
surgeon – two, and medicine – two) deployed
by the Ministry of Health, continued to provide
medical help. About 85 relief camps were set up
by the provincial government of Sikkim, besides
the army and ITBP (Pegong) camps, which had
provided shelter to 2700 and 550 affected peo-
ple. Five psycho-social care experts from NIM-
HANS were also deployed in Sikkim by the Min-
istry of Health, Government of India.
Figure 8.19: (a) Snap showing the role of the army personnel in repairing the network cables at the border of Sikkim and West Bengal on Monday; and (b) Snap showing the role of ITBP officials in supervising the damaged roads due to high intensive tremor in North Sikkim on Monday.
a b
Figure 8.20: (a) Snap showing rescue operation by National Disaster Response Force (NDRF) of India; and (b) Snap showing rescue operation by NDRF involving local community during the Sikkim earthquake (M 6.9).
a b
The Indo-Tibetian Border Police (ITBP) had pre-
pared disaster management stores, comprising tents
and blankets, for immediate airlifting to quake-hit
Sikkim. The support materials which were used for
the victims were lifted from an airbase in New Del-
hi and were sent to the regional response centre in
Gangtok, which had been created in the aftermath
of the devastating quake. Over 800 ITBP person-
nel were undertaking relief and rescue operations
in the aftermath of the earthquake. In Sikkim, the
Border Roads Organisation succeeded in reopen-
ing the road leading to the most sought after tour-
ists spots of Chhangu and Nathula in East district
of Sikkim.

South Asia DisasterReport 2011
| 89 |
The worst affected provincial states of India
during September 18, 2011 earthquake were Sik-
kim, West Bengal and Bihar. Affected areas of pro-
vincial (Sikkim, West Bengal and Bihar) territory of
India worked in close coordination for effective
rescue, relief and restoration operation after the
earthquake and these states also coordinated with
the Government of India in implementing their
own rescue and restoration plans for quick recov-
ery of the affected areas due to the earthquake. In
order to express solidarity with Sikkim, the victim
state, other provincial states of India generously
supported in terms of materials and money28 to
hasten its rescue – relief and restoration operation.
Prime Minister of India had given a financial assis-
tance of Rs. 1000 crore for the earthquake affected
people in Sikkim28. As mentioned above, Border
Road Orgainisations helped in strengthening the
basic infrastructure of the State did not take any
support from external or international agencies
during its rescue, relief, and restoration operation.
In West Bengal state of India, death toll
in the quake related incidents had gone up to 12.
Relief and restoration works were on in worst hit
Kurseong, Kalimpong sub-division in Darjeeling
hill and other parts of north Bengal. The provincial
government of West Bengal reviewed the situa-
tion at a high level meeting in the tremor ravaged
Kurseong. The West Bengal Government had sent
dry food packets and relief materials to the ma-
rooned people of the state. The state government
had taken all possible steps to rescue stranded
tourists in Sikkim. The West Bengal government
had announced two lakh rupees compensation to
the next of kin of the dead and 50,000 rupees to
the injured in quake related incidents.
In Bihar, the death toll in the quake related
incident was reported to about 20. Districts of
Bihar where people succumbed to their injuries
were Darbhanga, Madhubani, Samastipur, Begu-
sarai, Araria and Sitamarhi. Maximum numbers
of six casualties were reported from Darbhanga
district of the state. Relief and rescue operations
were in full swing in earthquake affected areas
of Bihar state of India. The Government of Bihar
reviewed the situation with officials of Disas-
ter Management Department and instructed
the district authorities to provide all possible
help to the victims. The state government an-
nounced an ex gratia payment of Rs. one lakh
fifty thousand to the kin of those killed in the
earthquake. According to a State Disaster De-
partment, 10 injured persons were admitted to
local hospitals. AIR Patna correspondent report-
ed that most of the people died in stampede
and house collapse that followed the tremors.
Several bodies were recovered from the debris
of collapsed houses as shown in Figure 8.21.
Figure 8: 21a &b: Snaps showing collapsed houses during Sikkim-Nepal earthquake
a b
| 90 |
Introduction Earthquake
Nepal Government showed very quick re-
sponse during earthquake relief operation in its
affected areas. Ministry of Home Affairs, Govern-
ment of Nepal took all plausible measures to deal
with earthquake disasters in the border areas
with India29. It deployed a trained battalion of its
Military Response force during the earthquake.
The Central Natural Disaster Relief Committee
(CNDRC) took immediate measure to identify
the needs of shelter and food for the displaced.
It provided kitchen utensils and tarpaulins and
free medical services to the all injured people.
The government of Nepal provided NPR 100,000
to families of the deceased, while NPR 5,000 was
provided to displaced families whose house was
destroyed by the district teams during the as-
sessments for immediate relief, besides addition-
al support from the Central government of Nepal
of NPR 20,000 per family depending on their situ-
ation. A total cash support of NPR 25,000 to fami-
lies was given by the Nepal Government whose
house had been destroyed, while NPR 125,000
was given to the family whose family member
died. Estimated losses and damages were re-
ported, as of September 26, as NPR 74,997,930
(US$ 999,972). The Government of Nepal had
taken initiative for better coordination between
government and international organisations pro-
viding immediate response to displaced people.
National Emergency Operation Centre (NEOC)
was involved in collecting information from the
respective DDRCs (mainly from security forces
and other local agencies) and then DDRCs coor-
dinated with all affected VDCs (police posts, llaka
offices and others) to obtain detailed informa-
tion. Such coordination with other government
departments helped the government in prepar-
ing a feasible recovery programme for displaced
people. The Government led District Disaster
Relief Committees to facilitate the response ef-
forts at the district level. Several clusters such as
education, health, nutrition and protection held
cluster meetings at the national level during the
earthquake chaos. DDRC coordination meetings
were organised in the affected districts to ensure
an effective relief operation at the district level
and stakeholders meetings and media briefings
are being held regularly by MoHA. Government
of Nepal involved international agencies in post
disaster loss assessment work during rescue, re-
lief and restoration operation due to the Sikkim–
Nepal earthquake.
In Nepal, International organisations, like
UNICEF, Save the Children, Plan Nepal, LWF, UMN
and Department of Education and UNFCO Bi-
ratnagar had been engaged in the assessment
work in different districts. In support of the Gov-
ernment's relief efforts, partners including UN
agencies, NGOs and Red Cross Movement con-
ducted assessments from their bases in Birat-
nagar in the eastern region, and inter-cluster
coordination meetings were organized by the
humanitarian community both at the national
and regional levels. Internatonal Fedration of
Redcross had delivered immediate assistance
to some 5,000 beneficiaries with Disaster Relief
Emergency Fund (DREF) and it supplied relief in-
cluding 1,000 pieces of blankets, 400 extendable
tents and 200 arctic tents in affected areas. It was
also reported that IFRC coordinated with partner
agency and government on relief operation due
to access to the affected areas. In response to the
quake, ADRA also helped families rebuild their
lives through participating in the construction of
earthquake-resistant shelters, and supplying ur-
gently needed hygiene kits30.
Pakistan Government organised an emer-
gency meeting with the chairman of the Nation-

South Asia DisasterReport 2011
| 91 |
al Disaster Management Authority of Pakistan
in Islamabad soon after the earthquake (M 7.2)
rocked its Balochistan province on January 18,
2011. Necessary instruction was given to arrange
relief goods for affected areas of Balochistan
to meet any emergency arisen due to January
18 Pakistan earthquake (M 7.2). NDMA took im-
mediate step to arrange necessary relief goods,
including food, tents, medicines and blankets
that rushed to affected areas through two C-130
aircraft of PAF. The Pakistan Air Force and Army
were on high alert and two air missions were
involved in assessment of needs in quake-hit ar-
eas. In addition, Bell and MI-17 helicopters of the
Pakistan Army and a Cessna aircraft were kept in
Quetta with three medical teams to be deployed
on short notice. The provincial government of
Balochistan directed its Provincial Disaster Man-
agement Authority to immediately dispatch re-
lief goods for the affected people in Dalbandin,
where all deputy commissioners of Balochistan
were involved in conducting a survey to assess
losses caused by the quake. Government of Paki-
stan did not seek any sort of external assistance
during relief operation in Balochistan.
Earthquake Predictability and Initiatives of SAARC Disaster Management Centre
The year 2011 was the year of earthquake di-
saster that caused huge losses of lives and prop-
erty on March 11, 2011 Tohoku, Japan earthquake
(Mw 9.0) and on September 18, 2011 Sikkim–Nepal
earthquake (Mw 6.9). People suffered a lot and fell
into great traumas due to irreparable losses due to
earthquakes. Victims of earthquakes questioned to
earthquake experts why the earthquake was not
predictable, when it would become predictable
so that earthquake hazards can be mitigated to
the greater extent by adopting plausible measures
to minimise earthquake risks. It is a proven fact
that the prediction of earthquake is not possible
with the present state of knowledge of Science
and technology because of complex processes in-
volved in earthquake genesis. Scientific commu-
nity of the world has been involved in earthquake
precursory studies since years using multi-disci-
plinary science to understand how earthquake
generates and what cause the earthquake at vary-
ing depths of different strengths. According to
earth scientist of Ministry of State for Earth Scienc-
es, a better warning mechanism for earthquakes is
in process of development in India. Prof. (Dr.) Harsh
Gupta, a globally renowned Earth Scientist and
Seismologist, presently Member, National Disaster
Management Authority (NDMA), India, addressed
news media of South Asia and he informed about
unique procedure of earthquake precursory study
that may lead to development of earthquake
warning system in future for the region28. The pro-
cedure is based on extensive study of crustal struc-
ture through several sets of drilled boreholes up
to a depth of about 8 km each in the quake-prone
Koyna region of Maharashtra, India to understand
the changes that occur underground when an
earthquake strikes. The Government of India had
already signed a Memorandum of Understanding
with the International Continental Drilling Pro-
gramme in this regard. The entire project expected
to cost about Rs. 300-400 crore. It has been report-
ed that the initiative launched by the government
would provide the scientists an opportunity to
study the earthquakes more closely in real-time28.
SAARC Disaster Management Centre (SDMC)
is one of the regional Centres of South Asia As-
sociation for Regional Cooperation (SAARC) that
deals with disaster management of all kinds of
natural disasters by providing extensive policy and
planning advise to the respective government of

| 92 |
Introduction
SAARC Member States through organising various
activities, such as capacity building programmes,
documentations, workshops, seminars, expert
group meetings, dissemination of disaster related
information and best practices among member
States since its inception.
On approval of Governing Board of SAARC
Disaster Management Centre, SDMC organised a
a successful comprehensive SAARC training pro-
gramme on “Earthquake Risk Mitigation” in col-
laboration with Indian Institute of Technology,
Roorkee, India during June 6-17, 2011 at Roorkee.
Figure 8.22: Photograph showing group of trainees during June 2011.
Earthquake
The principal purpose is to pertain a spe-
cialised technical training among the profes-
sionals of SAARC Member States so that the
trained personnel can be trainers of trainees.
There are extensive programmes for adoption
of earthquake resistant structures and build-
ings for minimising earthquake hazards. SDMC
had organised an Expert Group Meeting on
Seismic Hazards among SAARC Member States
so that proper methodology can be adopted
for earthquake hazard mapping of the earth-
quake-prone areas of SAARC States. Recently,
SDMC had successfully developed a template
on Safety of schools and hospitals by apply-
ing rapid visual assessment of structural and
non-structural measures techniques of Prof. A.
S. Arya, which has now been extended to the
safety of schools and hospitals in multi-disaster
conditions31.
Reference:1. SADR 2010
2. USGS
3. EMDAT
4. GDAC
5. IMD
6. PMD
7. NSC

South Asia DisasterReport 2011
| 93 |
8. SDMC
9. PAN (Kabul)
10. Press TV
11. Xinhua
12. The Daily Star, BSS, Dhaka
13. Kuensel Newspaper
14. Daily Times, Lahore
15. The Frontier Post, Karachi
16. DD News
17. Hindustan Times
18. The Hindu
19. The Times of India
20. Zee News
21. GSI (Geological Survey of India)
22. Mishra O.P., G.K. Chakrabortty, O.P. Singh, D.C.
Ghosh, K. K. Mukherjee, and P.C. Das, 2010, Seis-
mogenesis in Sikkim – Darjeeling Himalaya and
its crustal heterogeneities: Future Vulnerability,
GSI Report 50p.
23. Mishra O.P., 2011. Interview NDTV on September
18, 2011.
24. WHO, Natural Emergency Operation Centre
(NEOC)
25. Dawn News
26. The Daily Star
27. Ministry of Home Affairs, Government of India
28. Newsonair
29. Ministry of Home Affairs, Government of Nepal
30. Adventist Development and Relief Agency Inter-
national (ADRA)
31. Template on Rapid visual assessment of School
and Hospitals developed by SDMC

| 94 |
Introduction
Chapter 9
An Overview
Landslide is a common disaster in many of
the South Asian countries. In many parts of the
SAARC member countries the lithology is steeply
dipping which become more unstable with the
influence of heavy precipitation, human inter-
ventions and various other factors. The data
for the year 2011 shows that Bangladesh had ex-
perienced one of the 10 major global landslide
incidents (Table 9.1).
Landslide
Country Date Number of persons
killed
Number of
persons affected
Korea Rep 26/07/2011 59 2000
Colombia 4/11/2011 40 175
Indonesia 30/11/2011 34 -
Philippines 22/04/2011 24 574
China P Rep 9/5/2011 22 -
Indonesia 6/5/2011 19 4
China P Rep 5/7/2011 18 2
Bangladesh 4/7/2011 17 17
Malaysia 21/05/2011 16 6
Guatemala 20/09/2011 16 -
Table 9.1: Top 10 landslide fatalities and affected in 2011
Source: EMDAT accessed on May 14, 2012
The year-wise distribution of landslideds in
South Asia for the period between 2007-2011
shows that there has been a declining trend (Fig-
ure 9.1). This may be a reflection of intensified
landslide mitigation measures and community
awareness in the region.
Figure 9.1: Distribution of landslides in SAARC region for the period 2007-2011 (Source-EMDAT & Media Report accessed on July 10, 2012).
Countries Number of people killed
Afghanistan 3
Bangladesh 25
Bhutan 1
India 32
Nepal 63
Pakistan 7
Sri Lanka 24
Total 155
Table 9.2: Number of fatalities in South Asia (Source: Data compiled by SDMC from media reports).
Figure 9.2: Percentage distribution of landslides in the SAARC region during the year 2011
(Source: Datacompiled by SDMC from media reports).

South Asia DisasterReport 2011
| 95 |
The distribution of landslides in the SAARC
region for the year 2011 shows that Nepal experi-
enced the maximum number of events followed
by India, Bangladesh, Sri Lanka, Pakistan, Afghani-
stan and Bhutan (Table 9.2 and Figure 9.2)
Afghanistan
In an incident on February 20, three people were
killed when a landslide struck Taghab Best village
in the northwestern province of Badghis. The fa-
talities were a result of shooting rock that fell on
the roof of the three ill-fated people including a
woman and a child. Some of the villagers had an-
ticipated an impending landslide and could es-
cape to safer locations1. Two people were injured
in the incident.
In another incident more than 100 houses
were damaged in a landslide in northern Balkh
province on April 6, with residents fleeing homes
in panic2.
Bangladesh
On March 29, two day labourers were killed and
five others were injured when a huge block of
soil fell over them in village Dairgaon under Ga-
fargaon upazila of Mymensingh3.
A protection wall constructed to prevent
landslides failed in the Batali Hill area in Chit-
tagong district and killed 17 people. According
to an investigating committee formed after the
fatal landslide, a huge quantity of earth piled to
support the outer face of the two-layer wall was
found removed, which might have contributed
to the collapse. The protection wall was 360 me-
ter long and nearly 60 meter long portion of the
wall had collapsed and caused the incident3.
On August 9, a portion of a hill collapsed on a
house amid heavy downpour in Ramjadi in Ban-
darban. The incident took toll of a mother and an
infant who were present in the house at the time
of the landslide. The landslide blocked the road
for some time, halting traffic movement between
Bandarban sadar and Roangchhari3. On August
14, a landslide struck in the early morning hours
in the Pahartali in Chittagong division, killing
two people. Big chunks of earth fell on a six room
shanty located at the base of Tanki pahar or Balur
pahar burying the sleeping people (Figure 9.3).
The incident may have been triggered by under-
cutting of the base of the already critical slope of
the hill3.
Figure 9.3:Location of the landslide at Pahartali at Chittagong and the members of the grieving family
(Source :Daily Star/ Anurup Kanti Das).
Figure 9.4:Location of the landslide at Gomchu, Khaling (Source: Kuensel)
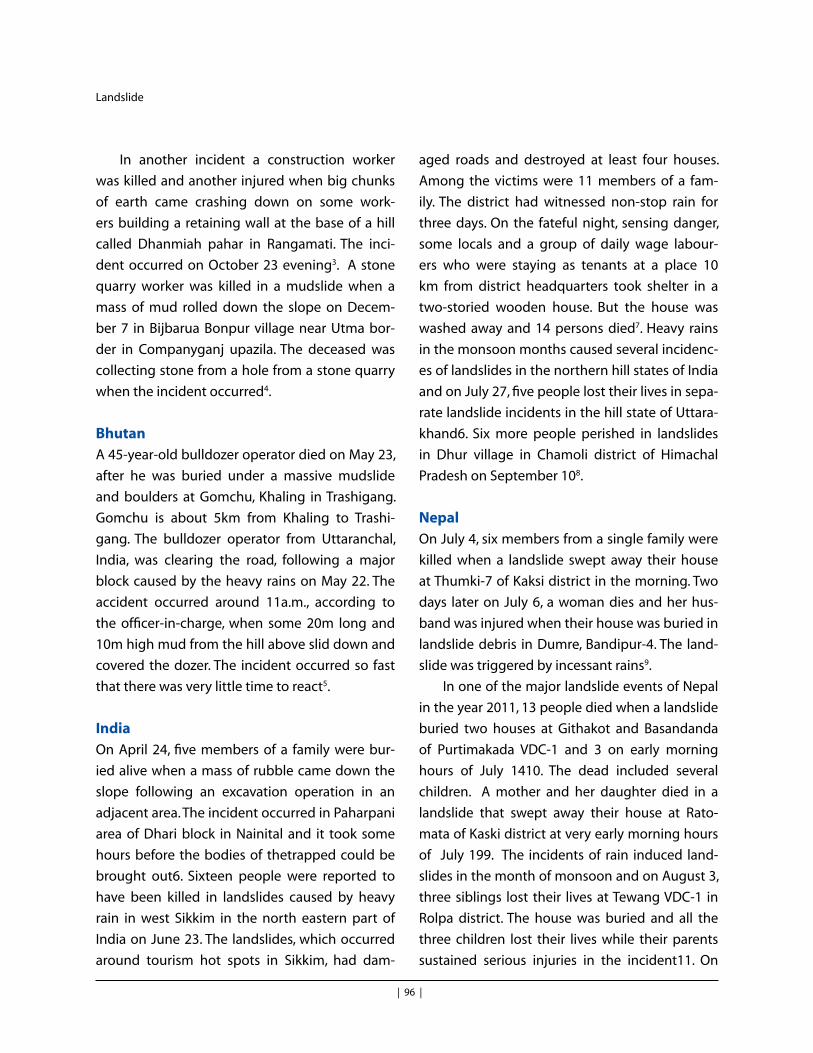
| 96 |
Introduction
In another incident a construction worker
was killed and another injured when big chunks
of earth came crashing down on some work-
ers building a retaining wall at the base of a hill
called Dhanmiah pahar in Rangamati. The inci-
dent occurred on October 23 evening3. A stone
quarry worker was killed in a mudslide when a
mass of mud rolled down the slope on Decem-
ber 7 in Bijbarua Bonpur village near Utma bor-
der in Companyganj upazila. The deceased was
collecting stone from a hole from a stone quarry
when the incident occurred4.
Bhutan
A 45-year-old bulldozer operator died on May 23,
after he was buried under a massive mudslide
and boulders at Gomchu, Khaling in Trashigang.
Gomchu is about 5km from Khaling to Trashi-
gang. The bulldozer operator from Uttaranchal,
India, was clearing the road, following a major
block caused by the heavy rains on May 22. The
accident occurred around 11a.m., according to
the officer-in-charge, when some 20m long and
10m high mud from the hill above slid down and
covered the dozer. The incident occurred so fast
that there was very little time to react5.
India
On April 24, five members of a family were bur-
ied alive when a mass of rubble came down the
slope following an excavation operation in an
adjacent area. The incident occurred in Paharpani
area of Dhari block in Nainital and it took some
hours before the bodies of thetrapped could be
brought out6. Sixteen people were reported to
have been killed in landslides caused by heavy
rain in west Sikkim in the north eastern part of
India on June 23. The landslides, which occurred
around tourism hot spots in Sikkim, had dam-
aged roads and destroyed at least four houses.
Among the victims were 11 members of a fam-
ily. The district had witnessed non-stop rain for
three days. On the fateful night, sensing danger,
some locals and a group of daily wage labour-
ers who were staying as tenants at a place 10
km from district headquarters took shelter in a
two-storied wooden house. But the house was
washed away and 14 persons died7. Heavy rains
in the monsoon months caused several incidenc-
es of landslides in the northern hill states of India
and on July 27, five people lost their lives in sepa-
rate landslide incidents in the hill state of Uttara-
khand6. Six more people perished in landslides
in Dhur village in Chamoli district of Himachal
Pradesh on September 108.
Nepal
On July 4, six members from a single family were
killed when a landslide swept away their house
at Thumki-7 of Kaksi district in the morning. Two
days later on July 6, a woman dies and her hus-
band was injured when their house was buried in
landslide debris in Dumre, Bandipur-4. The land-
slide was triggered by incessant rains9.
In one of the major landslide events of Nepal
in the year 2011, 13 people died when a landslide
buried two houses at Githakot and Basandanda
of Purtimakada VDC-1 and 3 on early morning
hours of July 1410. The dead included several
children. A mother and her daughter died in a
landslide that swept away their house at Rato-
mata of Kaski district at very early morning hours
of July 199. The incidents of rain induced land-
slides in the month of monsoon and on August 3,
three siblings lost their lives at Tewang VDC-1 in
Rolpa district. The house was buried and all the
three children lost their lives while their parents
sustained serious injuries in the incident11. On
Landslide
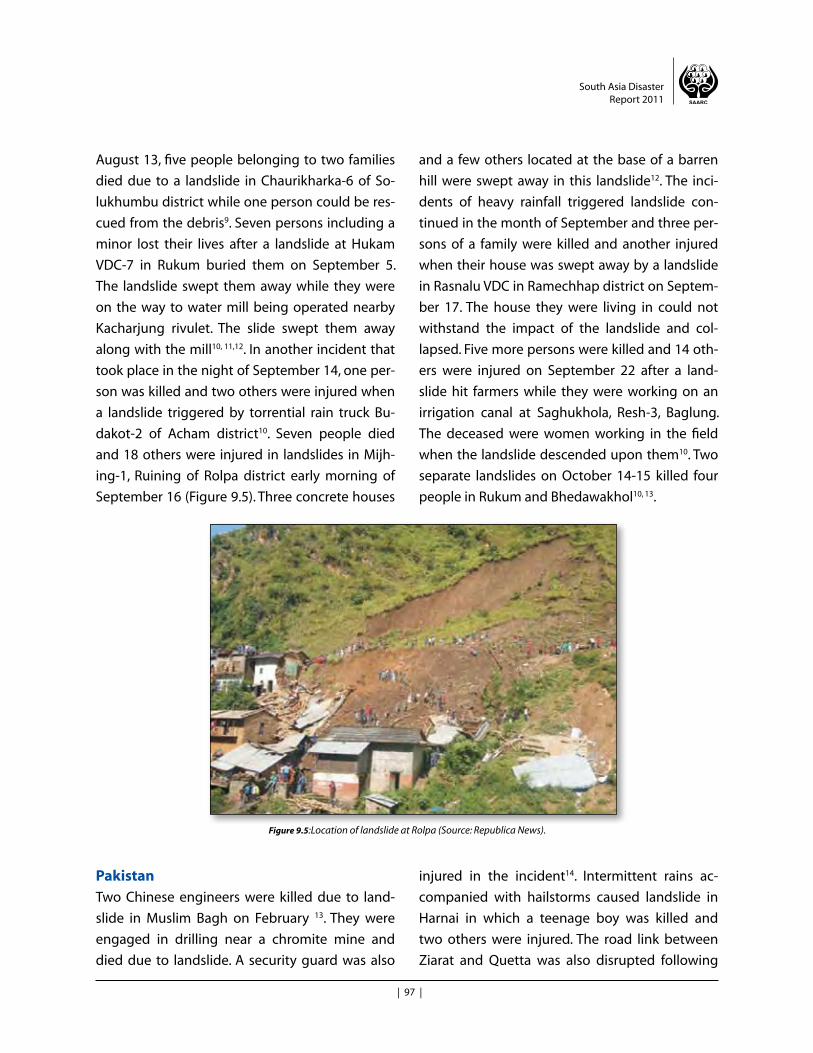
South Asia DisasterReport 2011
| 97 |
August 13, five people belonging to two families
died due to a landslide in Chaurikharka-6 of So-
lukhumbu district while one person could be res-
cued from the debris9. Seven persons including a
minor lost their lives after a landslide at Hukam
VDC-7 in Rukum buried them on September 5.
The landslide swept them away while they were
on the way to water mill being operated nearby
Kacharjung rivulet. The slide swept them away
along with the mill10, 11,12. In another incident that
took place in the night of September 14, one per-
son was killed and two others were injured when
a landslide triggered by torrential rain truck Bu-
dakot-2 of Acham district10. Seven people died
and 18 others were injured in landslides in Mijh-
ing-1, Ruining of Rolpa district early morning of
September 16 (Figure 9.5). Three concrete houses
and a few others located at the base of a barren
hill were swept away in this landslide12. The inci-
dents of heavy rainfall triggered landslide con-
tinued in the month of September and three per-
sons of a family were killed and another injured
when their house was swept away by a landslide
in Rasnalu VDC in Ramechhap district on Septem-
ber 17. The house they were living in could not
withstand the impact of the landslide and col-
lapsed. Five more persons were killed and 14 oth-
ers were injured on September 22 after a land-
slide hit farmers while they were working on an
irrigation canal at Saghukhola, Resh-3, Baglung.
The deceased were women working in the field
when the landslide descended upon them10. Two
separate landslides on October 14-15 killed four
people in Rukum and Bhedawakhol10, 13.
Figure 9.5:Location of landslide at Rolpa (Source: Republica News).
Pakistan
Two Chinese engineers were killed due to land-
slide in Muslim Bagh on February 13. They were
engaged in drilling near a chromite mine and
died due to landslide. A security guard was also
injured in the incident14. Intermittent rains ac-
companied with hailstorms caused landslide in
Harnai in which a teenage boy was killed and
two others were injured. The road link between
Ziarat and Quetta was also disrupted following

| 98 |
Introduction
the landslide14. Five female workers died and
three others got injured due to landslide in Kah-
ror Pakka area of Lodhran on October 9. Accord-
ing to the rescue sources, the female workers got
trapped under the sand rubble while taking part
in an underground construction15.
Sri Lanka
Landslides and earth slips claimed three lives
including a child and injured many more in Sri
Lanka's hill country of Kandy on January 6. In the
first incident a nine-year-old girl was buried un-
der an earth slip in the Thalathuoya area of Kan-
dy district while in another incident on the same
day; two more people were killed and 15 others
sustained injury when an earth slip in the area of
2nd Rajasingha Mawatha in Kandy. Several hous-
es were also destroyed in the incidents16. More
people died under a collapsed earth mound in
Getambe village. Sources from Sri Lanka's hill
capital Kandy says that rescue operations are un-
derway to save the lives of several people that
are buried under a collapsed earth mound in Ge-
tambe village. At least 20 people were reported
to have been killed when the earth mass crushed
five houses under it16. On February 1, a woman
was buried alive after a mound of earth from
a hill came down and razed her house to the
ground at about 9 p.m. in Badulla. The victim and
her husband were in the house when the mound
of earth fell from a height of about 75 feet17.
References:1. Daily Outlook
2. Pajhwok News Agency
3. Daily Star
4. The Independent
5. Kuensel
6. www. newsonair.com
7. The Hindustan Times
8. Zee News
9. Kantipur News
10. The Himlayan Times
11. The Kathmandu Post
12. Republica News
13. Nepal News
14. Daily Times
15. The News
16. Colombo Page
17. Daily Mirror
Landslide

South Asia DisasterReport 2011
| 99 |
An OverviewEpidemics are a major problem in most parts of
the SAARC region. An epidemic occurs when
new cases of a certain disease, in a given human
population, and during a given period, substan-
tially exceed what is expected based on recent
experiences. The main causes for occurrence of
epidemics are lack of clean and hygienic drinking
water, lack of awareness about sanitation, con-
tamination of drinking water sources, eating rot-
ten and unhygienic food, poor living conditions,
poor economic conditions (lack of sufficient
funds to provide medical infrastructure facilities
etc to control epidemics), overcrowding, biologi-
cal conditions and ecological factors. Epidemics
include Viral Infectious Diseases and Bacterial In-
fectious Diseases. An epidemic may be restricted
to one location, however if it spreads to other
countries or continents and affects a substantial
number of people, it may be termed a pandemic.
Many epidemics will have characteristics of both
common source and propagated outbreaks. For
example, secondary person-to-person spread
may occur after a common source exposure.
The declaration of an epidemic usually requires
a good understanding of a baseline rate of in-
cidence. Epidemics for certain diseases, such as
influenza, are defined as reaching some defined
increase in incidence above this baseline. Since
SAARC region consists of predominantly poor
population with little medical infrastructure facil-
ities, control and prevention of occurrence of epi-
demics is a major problem in the region. Contam-
ination of water is the largest cause of epidemic
diseases in South Asia. During the year 2011, the
SAARC region witnessed a large number of ca-
sualties due to epidemics. Around 1494 people
were killed due to various epidemic situations
during the year 2011. It is to be mentioned here
that the global data base (EMDAT) records only
major events. According to this data, there are
higher number of casualties this year mainly due
to diarrhoea in India and dengue in Pakistan and
Sri Lanka. Details of these cases are given in Ap-
pendix. Figure 10.1 below indicates the number
Chapter 10
Epidemics
Figure 10.1: A diagram showing the number of deaths due to Epidemics in each of the SAARC Member Countries during the year 2011
(Source: EM-DAT)
of people killed due to Epidemics in each of the
SAARC Member Countries during the year 2011.
The total number of casualties occurred due to
Epidemics in the entire SAARC region consisting
of Afghanistan, Bangladesh, Bhutan, India, Mal-
dives, Nepal, Pakistan and Sri Lanka during the

| 100 |
IntroductionEpidemics
years from 2007 to 2011 are illustrated in Figure
10.2 below.
Figure 10.2: Total number of deaths due to Epidemics in the SAARC region from 2007 to 2011 (Source: EM-DAT)
The country wise description of the major epi-
demic cases in each of the SAARC member Coun-
tries is discussed below:
Afghanistan
Respiratory Diseases
During the year 2011, the people of Afghani-
stan experienced major threats causing respi-
ratory diseases due to air pollution and poor
environment. The pollutants emitted by old
cars, poor quality fuel and people burning trash
increased the levels of pollution. In many areas,
people used masks during work. According to
the National Environment Protection Agency,
around 3000 people died every year due to air
pollution in Afghanistan. The health Ministry
of Afghanistan estimated that about 480,000
people have suffered from respiratory disease
over six years. Afghan people may face a health
disaster in the near future1. Over the last three
months, 2.4 million people were treated for re-
spiratory system disorders . In the capital city of
Kabul alone, more than 228,000 people suffered
from respiratory diseases alone due to wind
and dust in air causing more respiratory prob-
lems2.
PolioThe year 2011 witnessed fewer incidences of po-
lio cases in Afghanistan. During this year, there
was a dramatic change in polio cases in com-
parison to last year. Only 13 cases of polio were
recorded in Helmand, Kandahar and Farah Prov-
ince in Afghanistan during the year20113. This is
mainly due to the polio eradication efforts and
immunization programmes taken up by the Gov-
ernment of Afghanistan, the World Health Or-
ganization (WHO), the United Nations Children
Fund (UNICEF), and other partners, which have
invested heavily in improving routine immuni-
zation coverage in the country. Fig:10.3 shows a
Polio immunization camp organized by the Min-
istry of Public Health in Helmand, Kandahar and
Farah Provinces in Afghanistan2.
Figure-10.3: Polio immunization in Helmand, Kandahar and Farah Province in Afghanistan during the year2011
(Source: The Daily Outlook, Kabul)
CholeraLack of awareness, lack of access to safe drinking
water and sanitation as well as poor awareness
about personal hygiene are the major causes of
cholera. On 28 July 2011, four children died due
to cholera in Chapa Dara district of eastern Kunar
province of Afghanistan. According to the Minis-
try of Public Health (MoPH), the outbreak of chol-
era also spread out in Bodgah, Watala, Qala and
Gul Salak areas of the district3. About 136 people

South Asia DisasterReport 2011
| 101 |
were also infected by cholera in the district. The
existing medical infrastructure is not enough to
control the disease because the number of in-
fected people is high. However, the district health
department took several initiatives to provide
immediate medical care to people but the con-
secutive rain and flood increased symptom of
diseases. Government medical teams were de-
ployed in all the affected areas to control the dis-
ease.
DiarrhoeaFour people died from acute watery diarrhea in
the Mizan district of southern Kabul province of
Afghanistan on 4 September, 2011. The out brake
of the epidemic occurred during the Id-ul-fitr fes-
tival during September, 2011and infected dozens
of people in the province. The acute diarrheal in-
fection was caused by ingestion of bacteria. The
provincial health department of the Government
of Afghanistan took immediate initiatives and
appropriate measures to prevent further fatali-
ties3. Four people died of diarrhea in Giro district
of Ghazni province on 26th September 2011. The
epidemic was also spread in several villages of
the district affecting people of all ages. However,
the local health officials provided timely medical
assistance to all the affected people.
Bangladesh
Bangladesh is one of the most epidemic prone
countries in South Asia. About 35% to 40% of
the people in Bangladesh suffer from various
diseases each year due to its vulnerability to epi-
demiological diseases and very high population
density. The large number of vehicles and their
high emissions are the main cause to lead high
concentration of pollution in the air that results
in 4.5 million new cases of chronic bronchitis
each year in Bangladesh . In the year 2011, the
country witnessed wide spread outbreak of dis-
eases like diarrhea, chicken pox, anthrax, measles
and dengue which infected people in different
parts of the country due to poor health facilities.
The waterborne diseases cholera and diarrhea up
surged alarmingly in the country during the year
2011. According to International Centre for Diar-
rheal Disease Research (ICDDR), Bangladesh, the
diarrhea cases raised due to higher temperatures
and poor access to safe drinking water and sani-
tation facilities. The World Health Organization
(WHO) estimated that nearly 51,000 children are
affected by diarrhea each year in Bangladesh.
Some of the most alarming epidemics that oc-
curred in Bangladesh in the year 2011 are de-
scribed below:-
DiarrhoeaAbout 11 people died due to outbreak of di-
arrhoea at five different villages in Matamuhuri
Reserved area in Alikadam upazila on 27 April,
2011. More than 300 tribal people of different
localities were also infected. The health depart-
ment immediately sent medical teams to the af-
fected areas to prevent the fatalities4. The num-
Fig-10.4: A Patient Receiving ORS treatment at the ICDDR,B (Source-IRIN )

| 102 |
IntroductionEpidemics
ber of diarrhoea cases up surged due to higher
temperatures in the capital city of Dhaka in the
first week of August 2011. According to Interna-
tional Centre for Diarrhoeal Disease Research,
Bangladesh (ICDDR, B), 3,396 cases were report-
ed in the 1st week of August, 2011 which is 50%
more than last year. About 80% of all reported
cases included children5. Many patients received
treatment at the International Centre for Diar-
rhoeal Disease Research, Bangladesh(Fig10.4).
DengueDengue is an infectious tropical viral fever
caused by dengue virus. The carrier of dengue
virus is Aides mosquito. The symptoms of den-
gue include fever, headache, muscle and joint
pains, and a characteristic skin rash similar to
measles. The disease develops into the life-
threatening dengue hemorrhagic fever, result-
ing in bleeding, low levels of blood platelets and
blood plasma leakage, or into dengue shock
syndrome, where a dangerously low blood pres-
sure occurs. The number of dengue cases has
risen alarmingly in Bangladesh during the peri-
od 2007-2011 as shown in the Table 10.1 below:
2008, 188 cases in September 2009 and 183
cases in August 2010 while about 691 cases of
dengue reported in 2011. The number of deaths
since 2000 was put at 2337. The graph below
shows the month-wise details of dengue cases
in the period from 2007-2011 (Fig.10.5).
Year No of Dengue Cases
2007 183
2008 473
2009 188
2010 183
2011 691
Total 1718
Table- 10.1 :No of dengue cases reported (during2007-2011) in Bangladesh (Source:Institute of Epidemiology, Disease Control and
Research, Bangladesh)
The Institute of Epidemiology, Disease Con-
trol and Research, Bangladesh reported that
the peak of 183 dengue cases was recorded in
August 2007 while the peak of 473 cases in July
Figure-10.5 : A Graph showing Dengue cases in Dhaka ( Source: Institute of Epidemiology, Disease Control and Research,
Bangladesh)
Nipah encephalitis
In Bangladesh, Nipah virus (NiV) was first
identified as the cause of an outbreak of enceph-
alitis in 2001 in Meherpur district. In last 10 years,
Nipah outbreaks occurred eight times between
December and May each year. The Nipah out-
breaks have been identified in Noagoan (2003),
Rajbari (2004), Faridpur (2004), Tangail (2005),
Thakurgaon (2007) Kushtia (2007), Manikgonj
and Rajbari ( 2008), Faridpur ( 2010). Till January
Nipah Encephalitis
Nipah virus (NiV) is a highly pathogenic paramyxo-virus and belongs to genus Henipavirus. Large fruit bats of Pteropus genus are the natural reservoir of NiV. Human Nipah virus (NiV) infection was first rec-ognized in a large outbreak of 276 reported cases in peninsular Malaysia and Singapore from September 1998 through May 1999. Most patients had contact with sick presented primarily with encephalitis.

South Asia DisasterReport 2011
| 103 |
31 2011 total of 152 human cases of Nipah infec-
tion in Bangladesh were recognized. Beginning
2006, The Institute of Epidemiology, Disease Con-
trol and Research in collaboration with the Inter-
national Centre for Diarrhoeal Disease Research
(ICDDR), Bangladesh established Nipah surveil-
lance in 10 district level Government hospitals of
the country where Nipah outbreaks have been
identified. Presently surveillance system is func-
tioning in 6 hospitals. Through the surveillance
system 39 cases were identified. Outbreak inves-
tigations have identified two routes of transmis-
sion of Nipah virus from its natural reservoir into
human: drinking of raw date palm sap contami-
nated with Nipah virus and close physical contact
with Nipah infected case-patients8.
According to the Director of the Institute
of Epidemiology, Disease Control and Research,
(IEDCR) Bangladesh, five people were infected
with the Nepah virus in Faridpur and Rajbari dis-
tricts and four of them died on 23 January 20116.
The death rate of victims of the Nipah virus is very
high and around 75 % of the infected people do
not survive. The IEDCR reported that a total of 152
people were infected with the Nipah virus across
the country since 2001, of whom 113 died .The
virologists advised people in the Nipah-preva-
lent areas not to eat fruits that have been bitten
by fruit bats, or drink the raw juices of palm and
date trees. About 35 deaths were reported due
to Nipah virus across the country between the
months of January –February 20119.
AnthraxAnthrax is an infectious disease that occurs
due to a type of bacteria called Bacillus anthra-
ces. Infection in humans most often involves
the skin, gastrointestinal tract, or lungs. Anthrax
commonly affects hoofed animals such as sheep,
cattle, and goats, but humans who come into
contact with infected animals can get sick from
anthrax, too. The people who were most at risk
for anthrax included farm workers, veterinarians,
and tannery and wool workers.
In the year 2011, a number of anthrax cases
were found in different part of the country. The
Institute of Epidemiology, Disease Control and
Research Bangladesh reported few cases of an-
thrax during the months of May to July. Every
year during the rainy season anthrax spreads
among the cattle in the country. On 14 May
2011, the local Health department confirmed
three cases of Anthrax in Santhia upazila9. In Raut
Nagdapara village in Faridpur Upazila, two more
people were infected with anthrax on 2 June,
2011. On 11 June 2011, Local health officials con-
firmed more than 15 anthrax cases in Sirajganj
and Pabna districts. The officials of the upazila
health and family planning visited the village
and confirmed the disease. They also provided
free treatment to all the infected patients10.
Chicken PoxChicken pox is a highly contagious disease
caused by primary infection with Varicella Zos-
ter Virus (VZV). It usually starts with vesicular
skin rash mainly on the body and head rather
than at the periphery and becomes itchy, raw
pockmarks, which mostly heal without scarring.
Chicken pox is an airborne disease spread easily
through coughing or sneezing of ill patients or
through direct contact with secretions from the
rash. The disease Chicken pox is very common in
Bangladesh which always infected the children.
MeaslesMeasles is a very contagious illness caused
by a virus. The infection is spread by contact with

| 104 |
IntroductionEpidemics
droplets from the nose, mouth, or throat of an
infected person. Sneezing and coughing by an
infected person can put contaminated droplets
into the air, which may affect the normal persons
who may come in to contact. In the year 2011,
32 children were infected with measles and out
of them 4 children died. The disease out broke in
lamma upazila. According to health department,
41 children in Alikadam, seven in Lama and five
in Ruma upazilas died and several hundreds af-
fected children in 22 remote villages received
treatment from the special medical teams 10.
Bhutan
In year 2011, there was no outbreak of epidemics
in Bhutan. Across the country, a few cases of H1N1
(Flu) was witnessed by the government health of-
ficials. After analysis of World Health Organization,
it was observed that no fatal diseases were spread
out across the country during the year. The Roy-
al Government of Bhutan took several initiatives
for providing good health to the people. On 9
April 2011, more than 50 Bhutanese received life
changing surgeries with initiatives of the govern-
ment and American doctors and volunteers. A
team of American doctors and volunteers Provid-
ed medical treatment for 125 Bhutanese suffering
from congenital defects in Paro11 .
Influenza A (H1N1)On 13th April 2011, 17 students of the Phy-
lum Higher Secondary School and Phylum lower
secondary school in Lhuentse were tested posi-
tive for Influenza A. The Lhuentse authorities
took several initiatives to prevent the flu from
spreading and ordered to close the Phylum High-
er Secondary School and Phylum lower second-
ary school for one week. On April 4, 29 students
from the Phuyum Higher Secondary School were
treated at the Lhuentse hospital for fever, head-
ache and throat pain (Fig:10.6(a) &(b)). There were
cases of cough and cold among the students of
the Lhuentse primary school, where three of the
10 students tested positive for the flu11.
Fig:10.6(a)&(b): Students of Phuyum Higher Secondary School recovering from the H1N1 virus (Source: Kuensel Newspaper)
India
India ranks among the top 10 countries in the
world burdened with highest mortality arising
from communicable diseases, especially tuber-
culosis, as well as high maternal mortality and
child mortality rate. Barring Afghanistan, India
is worst affected by what are often described as
NCDs (Non-Communicable Diseases) in South
Asia with around 38 % of premature deaths of
males and 32.1 % of premature deaths of females

South Asia DisasterReport 2011
| 105 |
below 60 years. Non-Communicable Diseases
estimated to account for 53 % of all deaths in In-
dia. The WHO report shows that the diseases like
cardiovascular, cancers, chronic respiratory, blood
pressure and diabetes are an offshoot of growing
affluence of the middle classes as well as worsen-
ing health conditions among the people below
the poverty line. Around 37 % of deaths in India
are caused due to communicable, maternal, pre-
natal and nutritional conditions. In sharp con-
trast, India’s neighbours such as China, Pakistan,
Sri Lanka and Bangladesh are among other na-
tions having low proportion of premature deaths
due to NCDs12.
The description of communicable and non
communicable diseases in India during the year
2011 are discussed below:
MalariaMalaria is a mosquito-borne disease caused
by a parasite. People with malaria often experi-
ence fever, chills, and flu-like illness. On 10 Janu-
ary 2011, the city of Mumbai reeled under the
spell of malaria. The Bombay Municipal Corpora-
tion (BMC) statistics show that a total 4,391 peo-
ple were tested positive with malaria during this
year. There was a positivity rate of 3.07% malaria
cases during the month of January 13. In Tamil
Nadu, the number of malaria cases reported were
3,048. The key epidemic zones in the state of Tam-
il Nadu are :- Chennai, Ramanathapuram, Vellore,
and Tiruvallur districts14. The experts say that
fighting the malaria is a community initiative, in
which, every citizen should participate. In Chen-
nai city, malaria day was observed on 28 April
2011, in terms of fighting one of its most trouble-
some vectors - the mosquito. The thrust was on
providing awareness to the residents on ways of
preventing malarial infections. Though an infec-
tious disease, whether a person contracts malaria
or not, also depends substantially on how clean
the surrounding environments are. The focus in
the civic bodies should be to control breeding of
mosquitoes. The civic bodies should also focus on
spreading awareness among the residents about
how to control malaria.
The details of malaria preventive measures
are as follows:-
• Water should not be allowed to stagnate
within homes or offices.
• Old tyres, broken flower vases, buckets etc.
that collect water should be removed.
• It should be ensured that overhead tanks
and wells are closed.
• Sewage should not be let into storm water
drains.
• Call the corporation helpline for fogging in
case high density of mosquitoes was noticed.
DiarrheaIn Tamilnadu, sixty cases of Diarrhea were
reported in Thanjavur on 25 January 201113. The
water contamination was the main cause for the
outbreak of the disease. On 30 January 2011, an-
other incidence of the outbreaks of diarrhea in
Baselihata village of Narasinghapur block in Cut-
tack, Odisha, which affected many people was
reported. The consumption of contaminated wa-
ter was the cause of the outbreak of the disease
as the water pipelines in the area had broken14.
Sixteen people were also hospitalised because of
diarrhoea after consuming drinking water, which
was reportedly contaminated, in Tirusulam in
part of Tamilnadu on 30 March2011.
Avian Influenza (H5N1)Highly Pathogenic Avian Influenza was ob-
served during the year 2011 in Assam and West

| 106 |
IntroductionEpidemics
Bengal states of India. According to health of-
ficials, some poultry on the government farm
were infected with the H5N1 strain of bird flu14.
On 17 February 2011, about 4000 ducks and
chickens were culled from government run farm
by health workers in the northeastern state of
Tripura. Sixteen public health teams also began
slaughtering poultry within a distance of one
kilometer of the state-run farm in an attempt to
halt the spread of the virus. After the outbreak
of bird flu in a State-owned poultry at R. K. Nagar
Government duck farm in Agartala, Tripura, the
state government alerted the state poultry farms
and culled all the virus infected birds15(Fig.10.7).
On September 19, 2011, an outbreak of highly
pathogenic avian influenza (HPAI) was reported
in West Bengal. The outbreak was detected in a
rural backyard poultry flock in the Nadia district
of West Bengal. On September 8, 2011, an out-
break of avian influenza (AI) was reported in rural
backyard poultry in a village of the northeastern
state of Assam where measures were taken to
ensure containment of the outbreak.
Figure 10.7: Indian health workers carry killed ducks to burry them at the R.K. Nagar Government Duck Farm in Agartala, India
(Source: Associated Press)
MeaslesMeasles is a highly contagious viral disease,
which affects mostly children. It is transmitted via
droplets from the nose, mouth or throat of infect-
ed persons. Initial symptoms, which usually ap-
pear 10–12 days after infection, include high fe-
ver, running nose, bloodshot eyes, and tiny white
spots on the inside of the mouth. Several days
later, a rash develops, starting on the face and
upper neck and gradually spreading downwards.
In the year 2011, some cases of measles were
reported in Kutch district in Gujarat in India. Four
children died at the Rambagh hospital in Adipur
in Kutch district of Gujarat on 16 March, 2011.
The immediate action was taken to prevent fur-
ther spreading of the disease by the Gujarat state
government which also provided free oral vac-
cination to communities. The state government
has ordered to give assistance of Rs. one lakh
each to the bereaved families14.
Swine fluInfluenza – A (H1N1) (earlier know as swine
flu) is an influenza virus causing illness in people.
First detected in Mexico, it has spread to many
countries in the World. This was originally re-
ferred to as “swine flu” because laboratory test-
ing showed that many of the genes in this new
virus were very similar to those found in pigs in
North America. Swine Flu (H1N1) is a communi-
cable disease which spreads through sputum,
saliva, nasal discharge and sneezing of confirmed
infected persons. The main symptoms of the dis-
ease are headache, fever, soaring throat, trouble-
some breathing, cough and body ache, chill,
fatigue, abdominal pain, diarrhoea and severe
vomiting. The symptoms of swine flu in people
are similar to the symptoms of regular seasonal
flu. Some people also report diarrhoea and
vomiting associated with influenza-A (H1N1).
Swine flu viruses are spread mainly from person
to person through droplets created while cough-

South Asia DisasterReport 2011
| 107 |
ing or sneezing by a person infected with the in-
fluenza-A (H1N1)31. In the year 2011, there were
no major swine flu threats across the country.
The southern states of Tamil Nadu and Karnataka
were devoid of swine flu during the year. How-
ever, during the past three pilgrimage seasons,
Sabarimala in Kerala was in the grip of swine flu.
On 24 March 2011, the deadly swine flu outbreak
was reported and it took the season's first fatal-
ity due to the disease. The maximum number of
eight cases of the disease were reported in Pun-
jab while Delhi and Rajasthan reported fatali-
ties of two and one respectively14. The preventive
measures taken by the Government include facil-
itating training to the health workers, inspectors
and volunteers, wide distribution of pamphlets
detailing the symptoms of the disease and the
precautionary measures to be taken, setting up
of call centres with a helpline number to provide
details of the health care facilities and tie up with
the cellular providers to provide health tips on
H1N1 under the National Rural Health Mission
(NRHM).
DengueIn the year 2011, more than 10,000 dengue
cases were reported across the country, with
Punjab topping the list with 2,016 cases. Pun-
jab was followed by 1,793 cases in Odisha, 1,398
in Tamil Nadu and 963 in Kerala and Delhi was
fifth on the list with 900 cases16. The Madurai-
based Centre for Research in Medical Entomol-
ogy (CRME) was mandated by the Government
of India to develop strong surveillance tools for
dengue and chikungunya and study on various
parameters to develop a technology for control
of diseases and prepare a scientific roadmap
for control and prevention of these two vector-
borne diseases14.
Maldives
Dengue
In the year 2011, the outbreak of Dengue was
reported in some parts of the Islands. According
to the Maldives Health Ministry, 2,421 cases were
reported by August end with 11 fatalities record-
ed. The incidence of dengue cases was increased
by 60% in the islands during the year 2011 when
compared to last year . About 280 dengue cases
was reported in the month of April, 2011 alone18 .
Dengue is the most common in atolls like Lhavi-
yani, Alif Alif, Alif dhaal, and Thaa.
In July 2011, 129 islanders struck with den-
gue fever in Gaaf Alif Villigili. The “Villigili Dengue
Task Force’ conducted a door-to-door awareness
raising programme together with programmes
to clean the island and spray fog to eradicate
mosquito breeding grounds. The heavy rains in
all parts of the Maldives during the monsoon
period also increased the chances for mosquito
breeding, leading to an outbreak of dengue. The
health ministry took various initatives to control
disease immediately and provide medical treat-
ment to the victims19 .
Nepal
In the year 2011, the outbreaks of disease
like Diarrhea, pneumonia were reported in some
parts of the country. However, there were no fatal
diseases causing mass causalities during the year.
The diseases spread out during the year across
the country are discussed below:-
DiarrheaThe common symptoms of diarrhea disease
were fever, stomach ache, dizziness and vomit-
ing22.In Juna BK (22) of Dahakot-3 in Bajura dis-
trict of Nepal, one person died on 4 May 2011
due to diarrhea. The number of diarrhrea, chol-

| 108 |
IntroductionEpidemics
era and common cold surged during this year.
One person died due to diarrhea in jugada-6
in bajura district on 11 May 2011. A women lost
her life due to diarrhea in Rukum district on 29th
May 201120. Due to the outbreak of diarrhea in
Palpa district, three persons lost their lives and 50
others were taken ill in the month of July 2011.
Most of the diarrhea patients took treatment at
various private hospitals and clinics. On 23 July
2011, diarrhea claimed the lives of three children
at Bajaha of Bishala VDC-1 of Dailekh district21. In
Padi and Doyal of Sirdibas VDC of Gorkha district,
three lives were lost due to diarrhea and six peo-
ple were also badly affected by the disease on
5 August 2011. On 12 July 2010, in Saptai, three
persons died and two dozen people became ill
due to a mysterious virus disease.
Japanese Encephalitis (JE)Japanese encephalitis is a viral disease that
infects animals and humans. It is transmitted by
mosquitoes and in humans, it causes inflamma-
tion of the membranes around the brain. Patients
show symptoms such as fever, lethargy, hardness
in neck and legs, dizziness, vomiting, and loss
of consciousness, among others. The disease is
caused by Japanese B Encephalitis virus trans-
mitted by culex mosquito. In the year 2011, forty-
nine people were affected from this disease. On 2
September 2011, five people lost their lives from
this disease in Seti Zonal hospital in Nepall23.
Pakistan
During the year 2011, outbreaks of Epidemics
were reported across Pakistan, causing more fa-
talities. The diseases like diarrhea, cholera and
swine flu were noticed throughout the year in
Pakistan. Flooding in many parts of the country
also increased the frequency of these diseases
and increased the number of cases of swine flu
that was reported in different parts of the coun-
try. The major disease outbreaks occurred during
this year are discussed below:-
GastroenteritisIn the year 2011, the diseases of gastroenteri-
tis affected the various communities across the
country. The disease struck in the flood affected
areas of Faridabad, Khuzdar, Miramshah, Dir,
Badin, and Shangla. On 21 May 2011, one child
died due to gastroenteritis and 20 children were
severely affected in flood affected area of Farid-
abad. The gastroenteritis was common among
children living in areas with poor water and sani-
tation services25.Due to gastroenteritis three peo-
ple died and dozens of children were suffered in
Khudar district on 14 June 2011.
DiarrheaDuring first week of July 2011, four persons
died from diarrhea in Murree. About 60 to 70
patients suffering from the epidemic got timely
medicare in the Head Quarters Hospitalat Mur-
ree. Though people faced problems due to severe
shortage of life saving medicines in basic health
units in different areas, the problem was solved
with the timely intervention of the health author-
ities. The use of contaminated water was the main
reason for the disease outbreak25. In August 2011,
two people died and hundreds of people suf-
fered due to Cholera in Khorabad near Rasshaki
in Nowshera District. The cholera had spread in
the area due to water contamination26.
DengueAccording to the latest World Health Or-
ganization (WHO) statistics, there were 21,590
confirmed dengue virus cases and 317 deaths
reported in 2011 in Pakistan. About 257 deaths

South Asia DisasterReport 2011
| 109 |
were reported in Lahore province alone and
60 deaths were reported in other parts of the
country12. World Health Organization also pro-
vided technical assistance, standard guidelines
and capacity building in planning and imple-
mentation in all areas for prevention and con-
trol of dengue fever. All the people affected
by dengue fever received treatment in vari-
ous hospitals in Lahore (Fig:10.8) and health
workers took several measures including
spraying to control the menace of mosquitoes
(Fig:10.9) .
Figure -10.8: Dengue fever affected people receiving treatment at a Lahore hospital (Source: The Frontier Post)Figure -10.9: Health workers spraying to control the menace of mosquitoes in Lahore(Source: The Frontier Post)
Sri Lanka
In the year 2011, no major epidemic outbreaks
occurred in Sri Lanka but a few cases of epidem-
ics such as dengue, cholera and rat fever were re-
ported. The details of epidemic outbreaks during
this year in Sri Lanka are described below:-
DiarrheaIn the year 2011, about 32 dengue related
deaths were reported in the first four months it
self. A total number of 3,784 diarrhea confirmed
patients were reported by the government
health department across the country. According
to epidemiology unit of the Health Ministry, 907
patients were reported in January, 1,050 in Feb-
ruary, 1,111 in March and 716 in April. The high-
est number of cases was reported from the Co-
lombo district, with 1,273 patients and 12 deaths
during the period28. On 18 June 2011, a total
number of 11,901 cases were confirmed while
93 deaths were recorded in the Health Ministry’s
Epidemiology Unit. Among them, 1,497 den-
gue patients were reported from Colombo. The
number of dengue deaths reported from the
Colombo district were 52. Gampaha district was
the second worst affected by dengue with 776
cases and 15 deaths. A total of 20 persons died
from Dengue Hemorrhagic Fever (DHF) within
the Columbo Municpal Corporation area during
the period. Other parts of the Colombo district
reported a total of 32 deaths. Gampaha district
recorded a total of 17 dengue deaths during the
same period while Batticaloa district recorded a
total of nine deaths. The total number of deaths
reported from Kalutara district is six. Another six
dengue cases were also reported from the Put-
talam district. The Health Ministry’s Epidemiology
Unit statistics reported that 15,614 dengue cases
were reported from all parts of the country while
120 dengue related deaths were confirmed. The

| 110 |
IntroductionEpidemics
Colombo district recorded 4,093 dengue cases.
Gampaha, Kalutara and Batticaloa districts re-
corded 2340, 836 and 671 dengue cases respec-
tively while Ratnapura and Kurunegala districts
recorded 609 dengue cases each during this pe-
riod.
Rat feverAccording to the Epidemiology Unit of the
Health Ministry, leptospirosis, a fast spreading
fever (commonly known as rat fever) killed five
farmers in Anuradhapura. Around 25 paddy
farmers suffered from this disease and five of
them died. Around 2840 rat fever patients were
reported from all parts of the country during the
year 2011. The total number of deaths reported
was 60. The highest number of 11deaths were
reported from Gampaha district and 10 deaths
were reported from Kurunegala district. Most of
the victims were farmers. Seven deaths were re-
ported from Hambantota district. Four deaths
each were reported from Matara and Kurunegala
districts respectively29. Three deaths each were
also reported from the Gampaha and Anurad-
hapura districts respectively. The highest num-
ber of patients, 1039 were reported from the
Kurunegala district. The number of patients re-
ported from the Gampaha district was 244. The
number of patients reported from Hambantota
district was 212. In the country, March 2011 re-
corded the highest number of 1576 of rat fever
patients30.
Reference 1. Afghan Online Press, Kabul
2. The Daily Outlook, Kabul
3. PAN (Pajhwok Afghan News)
4. The New Nation
5. IRIN, Dhaka
6. New Age, UNB, Dhaka
7. The Independent
8. Institute of Epidemiology, Disease Control and Re-
search (IEDCR), Bangladesh
9. The Daily Star
10. The New Nation
11. Kuensel Newspaper
12. WHO (World health Organization)
13. The Times of India
14. The Hindu
15. Associated Press
16. Sify News
17. DD News
18. Haveeru News
19. Maldivian News
20. The Himalayan Times,
21. Kantipur News
22. Nepal News
23. Republica News
24. Daily Times
25. Dawn News,
26. The Frontier Post
27. The Express Tribune, Lahore
28. Daily Mirror,
29. Daily News
30. The Island

South Asia DisasterReport 2011
| 111 |
Chapter 11
An OverviewMan-made disasters can be broken down into
several categories and they include bomb blasts,
air strikes, mine blasts, militant strikes, terrorist at-
tacks, technological disasters, industrial disasters,
stampedes, and transportation hazards like road
and rail/ train accidents, airplane accidents, boat
capsizes, etc., among others. There are certain
types of man-made disasters that cause more
pronounced damage can be easily prevented
when compared to others. A good example is to
look at manmade disasters such as transportation
disasters. These are divided into different catego-
ries which include aviation, rail, road, water etc.
These are all preventable hazards. Often these
are as a result of neglect or ignorance and over
the years, they have claimed several lives. An-
other type of manmade disaster that killed many
people in the SAARC region is bomb blasts. These
bomb blasts are often as a result of bad intent
and the end results were catastrophic with a large
percentage of those involved losing their lives
or end up with major defects or long term inju-
ries. Other types of manmade disasters include
industrial accidents, chemical spill, oil spill, arson
and terrorism. There were also some technologi-
cal hazards which include power outages, nuclear,
chemical and radiological accidents, building/
structural collapse and fire accidents. The causes
behind many of these man-made disasters are
complicated in nature and are governed by socio-
economic, political and technological factors and
many times, combination of these. In the South
Asian region, these manmade disasters continue
Man-Made Disasters
to account for very high number of casualties.
In 2011, a large number of people were killed
on account of man-made disasters in the coun-
tries like Afghanistan, Pakistan, India and Bangla-
desh. These events are often witnessed in scat-
tered distribution and sometimes not properly
reported. The following Figure gives the details
of the total number of people killed on account
of man-made disasters in the SAARC region dur-
ing the period 2007-2011 (Fig.11.1). Table 11.1
below indicates the number of people killed due
to industrial accidents, miscellaneous accidents
and transport accidents) in South Asia during
the period 2007 to 2011 whereas Fig. 11.2 shows
the percentage of the number of people killed
due to these disasters in the region during 2011.
Some of the important man-made disasters wit-
nessed in the SAARC member countries during
2011 are discussed below country wise and the
individual events are listed in Appendix-VIII.
Fig.11.1 : Total number of people killed in man-made disasters during 2007 to 2011 in the SAARC Region (Source: EMDAT)

| 112 |
IntroductionMan-made Disasters
Total number of people killed in man-made disasters in South Asia during 2007 to 2011
2007 2008 2009 2010 2011
Industrial Accidents -- 17 97 -- 43
Miscellaneous Accidents 164 411 128 308 468
Transport Accidents 508 477 459 897 1190
Total 672 905 684 1205 1701
Table 11.1 : Number of people killed due to man-made disasters in South Asia during 2007 to 2011 (Source: EMDAT)
Fig. 11.2: A diagram showing the % of lives lost due to man-made disasters in the SAARC region during 2011 (Source: EMDAT)
Afghanistan
Bomb blasts/Violence
At least 20 persons were killed and 21 others
were severely injured in an operation carried out
by Afghan and foreign forces in eastern Nangar-
har province (Fig11.3) on January 2, 20111. The
operation was launched in Shirzad district of
Nangarhar province to wipe out insurgents from
the area. The militants suffered heavy casualties
in the operation.
Fig 11.3: Eastern Nangarhar province in Afghanistan (Source: Tolo News)
A Taliban commander was also killed in
clashes with Afghan and foreign troops in the
operation. Shirzad district, bordering Pakistan, is
one of the volatile areas where Taliban militants
were active.
A suicide bomber detonated explosives
strapped to his chest at a public bathhouse in
Kandahar on January 7, 2011, killing 17 people,
including a border police patrol officer2. Another
23 persons, including three policemen, were seri-
ously injured in the blast that occurred in Wesh
town of Spin Boldak district on the Pakistani bor-
der. The blast reflected the continuing instability
in the south region, where NATO has bolstered
its forces, but the insurgents were able to stand
their ground there while expanding their opera-
tions to other parts of Afghanistan once consid-
ered relatively safe. In another operation, a se-
nior Taliban leader and 14 other militants were
killed on January 8, 2011 in an Afghan-NATO op-
eration targeting the militants in north Afghani-
stan3. In another incident, at least seven civilians
were killed in a roadside bomb blast in Afghani-
stan's southern province of Zabul on January 14,
20114. All the victims were taxi drivers. In another
similar incident, nine people including six chil-
dren were killed in a terrorist explosion in the
northern Baghlan Province on January 16, 2011.
Six people died in another bomb attack in the
southern Helmand Province and three others
were killed by another explosion in Oruzgan on
the same day4. In a similar incident, a roadside

South Asia DisasterReport 2011
| 113 |
bomb claimed the lives of at least 20 civilians, in-
cluding women and children, in eastern Afghani-
stan, on January 19, 2011. The incident took place
in Khoshamad district of eastern Paktika prov-
ince, when a three-wheeled vehicle packed with
civilian passengers struck the roadside bomb,
killing 20 civilians, including 13 children and six
women, and wounding several others.
A suicide car bombing killed at least nine
people and injured 31 others in a busy bazaar
in southeastern Khost province on February 18,
2011. The attack in Khost City, the provincial capi-
tal, targeted a police post. The dead included six
civilians and a policeman manning the post. The
blast damaged various nearby houses, buildings
and shops. Eighteen people were killed and more
than 70 others were wounded in an armed attack
on a bank in Jalalabad in Afghanistan's Nangar-
har Province on February 18, 2011. The attackers
dressed like border police from their uniforms
and used guns and grenades to carry out the at-
tack on a branch of Kabul Bank4. Kabul Bank is Af-
ghanistan's top private lender, which distributes
salaries to the Afghan police and armed forces.
The Taliban claimed responsibility for the attack.
A roadside bomb ripped through a car in
eastern Afghanistan on March 4, 2011, killed 12
civilians and caused injuries to several other peo-
ple6. The Taliban-style home-made device struck
the car in the province of Paktika, killing five chil-
dren, two women and five men.
At least 35 people were killed and 42 others
were injured following a bomb attack on an army
recruitment center in the Kunduz city at northern
Afghanistan on March 14, 20114. Most of the vic-
tims were civilians, but three policemen and four
children have also lost their lives in the incident.
In another incident, three suicide bomb-
ers detonated a truck full of explosives in the
compound of a road construction company in
southeastern Paktia province, killing 23 people
and injuring another 60, on March 28, 20117. The
attackers shot dead the guard of the Zahir Road
Construction Company in Nawi Hada area of
Barmal district and then detonated their truck
bomb. All the 23 killed on the spot were the com-
pany’s employees. The building of the construc-
tion company was completely destroyed. All the
victims were guards and workers of the company.
Ten guards of a private security company
(Watan Risk Security Company) were killed during
an air strike by international soldiers in the south-
ern province of Ghazni in the Pul Mati area of Gilan
district on May 3, 2011. The guards were bombed
when they were escorting a logistic convoy.
Armed Taliban insurgents attacked another
Fig 11.4 (a) & (b): Snaps depicting bomb victims being carried to hospitals in Afghanistan

| 114 |
IntroductionMan-made Disasters
private construction company office in south-
eastern Paktia province on May 19, 2011 killing 36
people, including labourers, security guards and
engineers8. On the same day, at least ten people
were killed and several others were wounded in
an explosion in a market place in Konduz Prov-
ince in the northern Afghanistan9. A police officer
was among those killed in the blast. At least 24
others were injured. All the victims were admit-
ted in different hospitals (Figs: 11.4(a) & (b)). In an-
other suicide attack targeting a hospital in Logar
province on June 25, 2011 resulted in killing of 38
persons and severely injuring 50 others10. The at-
tack occurred around 11:20 am on June 25, 2011
when a car loaded with explosives was driven
into the Azrah district's central hospital. Three
women and two children were among the dead,
as were five health workers and a midwife.
The death toll from a Taliban attack on 28th
June, 2011 in a luxury hotel, frequented by for-
eigners and government officials, in Afghanistan
reached to 21, including 10 civilians, nine attack-
ers and two policemen who died on the spot and
several others were injured after Taliban militants
stormed the Intercontinental Hotel in the capital
city of Kabul late on June 28, 2011 (Fig:11.5). Two
foreign nationals were also among the dead. Po-
lice cordoned off the entire area and all streets
leading to the hotel were blocked.
In another incident, a landmine explosion
struck a bus in Afghanistan, killing at least 20 ci-
vilians, including women and children on June
30, 201111. The incident happened in the remote
southwestern province of Nimroz. The blast took
place in the region's Khash Rod district on the
main highway linking Nimroz to Kandahar. In
another incident, a passenger bus in southern Af-
ghanistan struck a land mine on July 2, 2011, kill-
ing at least 18 civilians. About 30 people, includ-
ing women and children, were severely injured.
A roadside bomb has ripped through a van,
killing 13 civilians, including two children and
four women on July 2, 2011 in Zabul province in
southern Afghanistan, when their vehicle struck
the device12. Roadside bombs, planted by mili-
tants who have been waging an insurgency
against foreign forces for nearly 10 years, are a
frequent cause of casualties among civilians in
Afghanistan.
In another incident, seven policemen were
killed in an attack on their check-post near
Lashkar Gah, the capital of southern Helmand
province, on July 18, 201113. On the same day, 10
militants were shot dead and as many wounded
during a firefight with Afghan and foreign forces
in the Giro district of Ghazni province. The police-
men manning a checkpoint on the Helmand-
Kandahar highway were killed by unidentified
assailants.
Again, on July 29, 2011, two separate power-
ful bomb explosions killed at least 23 civilians
and wounded several others in the southern Af-
ghanistan, in the province of Helmand. The civil-
ians lost their lives after a passenger minibus and
a tractor separately struck explosives near the
city of Lashkar Gah. Women and children were
Fig 11.5: Smoke coming from the Intercontinental hotel during a battle between Afghan security forces and Taliban militants in Kabul,
Afghanistan (Source: Press TV)

South Asia DisasterReport 2011
| 115 |
among the victims. Taliban militants attacked
the security forces when they arrived at the
scene of the explosion that hit the minibus.
At least seven civilians were killed and several
others injured in a market explosion in Afghani-
stan's southern province of Uruzgan on August 16,
2011. A motorcycle bomb went off in a market in
Dihrawud while people were shopping. In a simi-
lar incident, a bomb explosion has killed at least 20
people and wounded 12 others in the western Af-
ghan province of Herat, on August 18, 20114.
Sixteen people were killed and four others
injured in a road side bombing in the Shindand
district of western Herat province on Septem-
ber 27, 201114. On the same day the explosion
in Shindand occurred around noon, when a van
struck the bomb in the Chahak village of the dis-
trict, five kilometres from a police checkpoint.
Eleven children, four women and a driver were
among the dead.
Nine Afghan National Army (ANA) soldiers
were killed and four others injured following a
roadside bombing in southeastern Paktia prov-
ince, on October 2, 201115. The incident took
place in the Sahak area of Zurmat district. The
ANA soldiers were searching for roadside bombs
planted beneath culverts in the area when the
explosion occurred.
At least 10 people were killed and more than
42 others were wounded in two back-to-back
oil tanker explosions (Fig: 11.6) near the main
US military base in central Parwan province, on
October 26, 201115. A magnet bomb, attached
to a fuel tanker, went off on the road leading to
the Bagram Airfield. As residents gathered to
collect fuel from the tanker, a second explosion
shook the area, killing 10 civilians and injuring 42
others.
Nineteen civilians were killed by a roadside
bomb in Afghanistan’s southern Helmand prov-
ince on December 7, 2011, taking the death toll
from just 24 hours of bloodshed to 78, that came
as funerals took place for 59 people killed in un-
precedented bomb attacks on Ashura gatherings
in Kabul and Mazar-i-Sharif a day earlier16.
Twenty civilians were injured when a po-
lice vehicle was attacked with a hand-grenade
in southwestern Khost province on December
18, 201117. The explosion took place at around
9:15am in a busy square Sargardan Chawk area,
of Khost City where an unknown man threw
a hand grenade. The victims were provided
treatment in various hospitals in Khost City
(Fig: 11.7).
Fig 11.6 : Two back-to-back oil tanker explosions in central Parwan province,Afghanistan on 26th October, 2011,where 10 people were
killed and more than 42 were wounded (Source: Pajhwok Afghan News)
Fig 11.7: A grenade attack victim receiving treatment in Khost city in Afghanistan (Source: Pajhwok Afghan News)

| 116 |
IntroductionMan-made Disasters
Fire
As many as 936 incidents of fire that occurred
during 2011 caused property losses amounting
to more than 300 million Afghanis (US$ 6.1 mil-
lion), as per the Kabul fire brigade department.
Nearly 238 fire incidents happened in the capital
alone, with the rest taking place in several prov-
inces in the country. On 16 January, 2011, a fire-
wood stall blaze caused a huge loss amounting
to millions of Afghanis in the eastern province
of Nangarhar18. The stall was gutted in minutes
as the fire erupted on the early hours of January
16, 2011in the 3 police district near the old Kabul
bus stand in Jalalabad. The fire damaged a num-
ber of carpentry shops nearby inflicting a loss
of more than about 700,000 Afghanis on each
shopkeeper. Caused by a bare electric wire, the
blaze was controlled soon after the timely arrival
of fire fighters.
In another fire incident, eight shops were
burnt in a blaze caused by an explosion inside
a fuel tanker in the eastern province of Nangar-
har on April 27, 201120. Fire services personnel
from the fire brigade put off the fire (Fig:11.8).
The fire erupted at 7:30am when a fuel tanker
exploded in front of the Customs House on
the outskirts of Jalalabad. In another fire inci-
dent, at least 20 carpet shops were gutted in
a fire that broke out in Mazar-i-Sharif, the capi-
tal of northern Balkh province, on November
10,2011. The fire originated from an electric
short circuit at a rug market west of Hazrat Ali
Shrine at around 2 pm and soon engulfed 20
adjoining shops
Transport Accidents
Afghanistan during the last few years has wit-
nessed an increase in the number of road traffic
accidents. The increase in road traffic accidents
was due to the province’s small roads, mountain-
ous areas, winding roads, negligence and reckless-
ness of drivers22. The increase in the number of
cars on the roads, including many without proper
registration, was also a contributing factor to this.
As most of the houses are very close to the roads,
speeding drivers can cause accidents to pedes-
trians. Most of the accidents were caused by over
speeding and reckless driving. Afghanistan’s roads
are perilous and many vehicles in the country are
old. Hence, high casualties in road traffic accidents
were relatively common. If traffic rules were en-
forced strictly, road traffic accidents and resultant
casualties can be reduced significantly.
On January 15, 2011, a dozen people were
killed when a passenger coach rammed into a
truck on the Kabul-Torkham highway near Jalala-
bad in the Bakhtan area18. Twelve passengers in
the coach were killed in the accident instantly. In
another incident, eleven people, including two
children and a woman, were killed and 17 oth-
ers were seriously wounded in a traffic accident
in western Herat province on February 27, 201123.
The accident occurred when a truck crashed into
a mini van and both vehicles fell in a deep ditch,
resulted in killing of eleven people.
Twenty passengers were killed and 24 oth-Fig 11.8 : A fire services person from the fire brigade, putting off fire in
the eastern province of Nangarhar in Afghanistan (Source:PAN)

South Asia DisasterReport 2011
| 117 |
ers injured when a bus on its way from Kabul to
southwestern Nimroz province flipped over on
the main Kabul-Kandahar highway in southern
Zabul province on April 28, 201124.
As many as 11 people were killed and
wounded in two separate road traffic accidents
that took place in the southern Nimrooz province
on May 7, 201125. Three passengers including a
woman and two children were killed in the first
accident that happened when a Saracha-Type
Corolla car collided a Trailer vehicle along the
way between Zaranj and Delarm. In the second
accident two passengers were killed and three
others were wounded in Chagansoor district of
the same province. On May 14, 2011, twenty one
people were killed in northern Afghanistan when
a bus veered off the road and plunged into a river
in the Balkh province. The accident happened at
around 6 a.m. local time in Balkh district, located
322 kilometers northwest of the capital Kabul.
The driver of the bus was apparently driving at
a high speed when he lost control of the vehicle,
and the bus then skidded off the road and fell
into the river. The victims were all members of the
same family, who died on the spot. There were
three women and 15 children among the dead.
Fifteen people from four different families,
including women and children, were killed on
June 21, 2011, when a truck skidded off a road
and overturned in the western Herat province of
Afghanistan26. The truck was en route to Herat
City from Farsi district.
A total of 35 Afghans were killed and 27 oth-
ers injured on August 20, 2011 when a speed-
ing bus overturned on a highway in southern
Afghanistan28. The incident happened just out-
side the Kandahar city in the Daman district of
Kandahar province on the main road connect-
ing it to the capital, Kabul. Afghanistan President
Hamid Karzai issued a statement expressing his
deep sympathy for those killed.
At least eight people lost their lives in two
separate road accidents in the northern Bagh-
lan province on September 6, 201129. The first
accident took place in Gardab area of Baghlan-
i-Markazi district on September 6, 2011, when
a passenger bus collided with a van, killing five
civilians and injuring eight others. Elsewhere,
three people were killed when a car plunged
into a river in Shahr-i-Qadim of Pul-i-Khumri, the
provincial capital. In another incident, atleast 15
people were killed in a traffic accident in south-
ern Helmand province on November 12, 2011.
The incident happened in Helmand-Kandahar
highway when a speeding bus crashed with a car
coming in the opposite direction.
Other accidents
An Indian teacher, working in an Afghan universi-
ty, and his wife died following leakage of poison-
ous gas at a hotel in Kabul on January 30, 2011.
The couple died following leakage of some poi-
sonous gas in the hotel where some employees
of the hotel too were injured.
Bangladesh
Industrial Accidents
In Bangladesh, at least 388 workers were killed
in workplace related accidents across the
country during the year 2011, according to
a report of Safety and Rights Society, an NGO
from Dhaka31. The report was prepared on the
basis of reports published in 26 daily newspa-
pers (15 national and 11 regional newspapers)
from January 1 to December 31, 2011. The re-
port did not include the deaths of workers
outside the workplace or deaths of workers

| 118 |
IntroductionMan-made Disasters
as a result of road traffic incidents. The survey
found that the highest number of workers
(183) died in construction sites, followed by
deaths in factories and other manufacturing
organisations (86), service organisations like
hotels, workshops, power supply organisa-
tions (73) and others sectors (46). Electrocu-
tion was the cause of the highest number of
deaths (134 workers) while 74 died after fall-
ing from height (i.e scaffolds). Some 50 oth-
ers were crushed to death by machinery or
hard objects. The remaining 130 workers died
from various causes, including exploding boil-
ers, chemical and gas explosions, fire, suffoca-
tion as well as earth, roof and wall collapses.
However, the report mentioned that the ac-
tual number of the workplace deaths is cer-
tainly more than the numbers published in
the report as many workplace deaths were
not reported in the newspapers. The organisa-
tion observed that most of the electrocutions
occurred when iron rods carried by construc-
tion workers came into contact with live elec-
tric lines passing near the under construction
buildings. It also observed that the workers fall
victims to electrocution, as they were not pro-
vided protective wearing equipment like hel-
mets, gloves, shoes etc during the work.
On May 17, 2011, two people were injured, one
of them seriously, when a gas cylinder of a CNG-
run bus exploded at a filling station in Kalurghat
area in Chittagong (Fig:11.9). The blast blew up
the left hand of a driver, who was waiting to refu-
el his car. The other victim was a passerby. There
was no passenger on the bus at the time of the
accident. In another incident, three persons in-
cluding an adolescent boy were killed as a cylin-
der exploded in Cox's Bazar and a boiler went off
in Bogra on August 24, 2011.
Fig 11.9 : The gas cylinder of a bus that was exploded while it was being filled at a CNG station of Chandgaon in Chittagong, damaging the
vehicle along with a car and the dispenser in Kalurghat area on 17th May, Photo: STAR
Fire
At least 25 persons were injured and 30 houses
gutted in a devastating fire at Kamarpara village
under Sadar upazila in Panchagarh on January
27, 2011 evening32. The fire originated from a
kitchen and engulfed soon to adjacent houses.
Fire fighters rushed to the spot and brought the
blaze under control with the help of local people
after six hours of effort. In another incident, a
devastating fire gutted at least 24 huts belong-
ing to poor people including casual labourers at
Bonkola village of Sujanagar upazila under the
district on February 3, 201133(Fig:11.10).
Fig 11.10 : An elderly woman laments as she lost everything in the fire that burnt 24 huts to ashes at Bonkola village in Sujanagar upazila of
Pabna on 3rd February, 2011. Photo: STAR

South Asia DisasterReport 2011
| 119 |
The fire originated from a wood-burning stove
of Batashi Khatun of the village and spread very
quickly due to strong winds and destroyed all
the 24 houses in the area.
In another incident, at least 110 shops were
gutted in a fire at Chandukhali Bazar in Barnuna
district on April 15, 201134 (Fig:11.11). The fire
originated from a shop and soon engulfed the
Fig 11.11 : Remains of shops lie mangled after a devastating fire destroyed the whole of Chandukhali Bazar in Barguna district, causing
damage worth Tk 50 crore on April 15, 2011. Photo: STAR
Fig 11.12 : Patients, visitors and staff come out from Bangabandhu Memorial Hospital in Chittagong following a fire in the hospital
building. on May 27, 2011 Photo: STAR
entire bazar. On information, two fire fighting
units from Barguna and Patuakhali district head-
quarters rushed to the spot and extinguished the
blaze. The damage caused is estimated at Tk 50
crore.
At least 10 people were injured and proper-
ties worth around Tk 50 lakh was burnt in an-
other fire on May 27, 2011at Bangabandhu Me-
morial Hospital (BBMH) in Chittagong’s Khulshi
area34.
An electric short circuit caused the fire on the
fourth floor of the hospital and soon one side
of the floor was engulfed in flames. Panicked,
patients, attendants, visitors and staff of the
hospital started coming out of the seven-sto-
rey building in a rush and sustained injuries
(Fig:11.12).
A devastating fire gutted 105 shops in
Gobindaganj Upazila market on June 10, 2011
damaging goods and properties worth over Tk
7 crore35. The fire originated from an electric shot
circuit of a clothes shop at 5:00 am and soon en-
gulfed adjacent shops. The blaze burnt to ashes
the cash and goods of 105 shops and damaged
41 other shops.
In another fire incident, three people were
burnt to death on July 2, 2011 in a fire at a multi-
storey building at Sky Lark Point in Bijoynagar
area of Dhaka (Fig.11.13).
Fig 11.13 : Sky Lark Point at Bijoynagar in Dhaka. Fire ravaged the building on July 2, 2011 claiming three lives. Photo: STAR
The fire burnt the fifth, sixth and seventh
floors of 12-storey Sky Lark Point at Bijoynagar
(Fig: 11.13). Fire Service and Civil Defence (FSCD)
units from different parts of the capital rushed
to the spot and doused the fire with their joint
efforts.

| 120 |
IntroductionMan-made Disasters
In another major fire incident on November
22, 2011 in Lashma Fashion in Dhaka’s Uttara
area, the fire that engulfed a sweater factory in
Uttara was doused after around four-and-a-half
hours’ effort by fire fighters36 (Fig.11.15).
Fig 11.14: Curious people looking at the multi-storied building Skylark Point in city's Bijaynagar area on July 2, 2011, where three people were
burnt alive in a devastating fire (Photo: STAR)
Fig 11.15 : Fire fighters dousing an inferno that broke out at Lashma Fashion in Dhaka city's Uttara area on November 22, 2011
(Photo : Bangla News 24.com)
Road Accidents
As per a report of the Government of Bangla-
desh, around 18,500 people are being killed in
road accidents every year in Bangladesh that also
leave about 400000 people maimed causing a
burden on the nation. Another 20,600 people, in-
cluding 17,000 children, die in river transport ac-
cidents across the country every year.
Fig 11.16 : A police van lies badly mangled after being hit by a speeding truck on Dhaka-Sylhet Highway in Narsingdi on January 15, 2011
(Photo: STAR)
On January 15, 2011, nine police person-
nel were killed as a truck rammed their van on
Dhaka-Sylhet highway in Narsingdi37 (Fig:11.16).
The accident occurred around 10:45 am leaving
all the nine police personnel dead on the spot.
The cops, who were from Belabo Police Station in
Narsingdi, were on their way to Shibpur upazila
to attend a briefing on the law and order. Presi-
dent Zillur Rahman and Prime Minister Sheikh
Hasina expressed a deep shock at the deaths and
conveyed sympathy to the bereaved families. In
another tragedy, a three-bus crash in thick fog
killed nine people and injured 45 others in Pir-
ganj upazila of Rangpur on January 20, 201138.
The crash occurred at around 7:00 am when a
speeding bus of Uttar Banga Paribahan rammed
from behind a Dhaka-bound bus of FK Line on
Bogra-Rangpur highway at Chat Sholagari. The FK
Line bus had just pulled over to have an engine
glitch fixed. Within minutes, as locals were rescu-
ing the wounded, the third bus, which was bound
to Dhaka, ploughed into the Uttar Banga coach.

South Asia DisasterReport 2011
| 121 |
In another accident, ten persons were killed
and three others were injured in a road accident
on the Dhaka–Khulna Highway at Bhanga in
Faridpur on February 4, 201139. The accident took
place at about 6:00pm on February 4, 2011 when
a minibus carrying the victims collided head-on
with a tank lorry.
Thirteen people were killed and 45 oth-
ers injured in two train-bus collisions in Co-
milla and Jessore on February 19, 201140. Dha-
ka-bound Subarna Express from Chittagong
collided with a Comilla-bound bus .at a level
crossing near Shashidal Rail Station in Brahman-
para upazila, leaving eight dead and 25 others
injured (Fig.11.17 (a)). Meanwhile, five people
died and 20 others sustained injuries in a train-
bus collision at Rajarhat rail crossing in sadar
upazila of Jessore while passing an unguarded
level crossing at about 5:00am on the same
day(Fig.11.17(b) ).
Figures 11.17(a) & (b) : A minibus, (top), at Brahmanpara in Comilla gets rammed by Subarna Express as it was going over a level crossing on 19
February 2011. On the same day, a couch, (above), collided with a train at Rajarhat in Jessore while passing an unguarded level crossing. Photos: STAR
At least nine people were killed and 20 oth-
ers injured when a bus rammed into a human
hauler at Parkola area at Shahjadpur upazila in
Sirajganj on April 21, 201142. The human hauler,
locally known as Nosiman, fell into a roadside
ditch with 29 people aboard after the speeding
bus hit it killing 6 people on the spot and injur-
ing 23 others. Of the injured, three persons died
on the way to hospital.
In another tragedy on 23 April 2011, a
launch MV Bipasha sank after colliding with a
stone-laden trawler that had already tipped
over in the Meghna at Char Kakoria under Sarail
upazila of Brahmanbaria41 (Fig:11.18).
Eighteen people were killed and 21 others
injured as a truck collided with a passenger bus
in Shahjahanpur upazila of the district on July 28,
201143(Fig: 11.19). All the victims were passen-
gers of the bus bound for Joypurhat. The driver
while driving the vehicle lost control over the ve-
hicle. The Prime Minister of the People’s Republic
of Bangladesh, Sheikh Hasina expressed deep
shock at the deaths in the tragic road accident.
She conveyed her profound sympathy to the be-
reaved families and prayed for eternal peace of
the departed souls. In another road accident, at
least 16 people were killed and 50 others were
Fig:11.18:The wrecked bus after a truck from the opposite direction swiped it on Dhaka-Bogra highway near Noymile in Shahjahanpur of
Bogra on 28 July, 2011 Photo: STAR

| 122 |
IntroductionMan-made Disasters
seriously injured when a luxury bus collided
head-on with a local passenger bus at Amtola in
BSCIC industrial area at Shibpur in Narsingdi on
August 2, 201144. The accident happened as the
Volvo bus driver lost control over the steering af-
ter a tyre of the bus got punctured (Fig: 11.20). It
was raining heavily when the accident occurred.
Fig11.19:The wrecked bus after a truck from the opposite direction swiped it on Dhaka-Bogra highway near Noymile in Shahjahanpur of
Bogra on 28 July, 2011 Photo: STAR
Fig 11.20 : Remains of a Sylhet-bound luxury bus that was smashed after colliding head-on with a local bus on the Dhaka-Sylhet highway
at Shibpur in Narsingdi on 02 August, 2011. At least 16 people were killed and 50 others injured. (Source: The Daily Star)
Eight people died falling off the roof of run-
ning trains in Tangail and Bogra on 04th Novem-
ber 201145. In Bogra, four people travelling on
Dinajpur-bound Ekota express fell off the roof
and got hit against Halhaliya Bridge at Santahar
of Adamdighi upazila around 2:00 am. In Tangail,
four passengers died and three others sustained
injuries after they fell from the roof of a moving
train on 04th November, 2011 (Fig: 11.21).
Fig 11.21 : A snap showing people travelling on the roofs of trains in Tangail and Bogra on November 4, 2011 Source: The Daily Star, Star Report
India
Road AccidentsIn a tragic incident which occurred in Anantapur
distrtict on the New Year eve, a lorry coming
from Kothacheruvu towards Puttaparthy in the
district hit an autorickshaw coming in the op-
posite direction resulting in the death of 11 per-
sons on the spot on January 1, 201147 (Fig:11.22).
Eleven of the fourteen persons travelling in the
autorickshaw were killed on the spot while three
sustained severe bleeding. In another road acci-
dent, at least 22 people, including 7 women and
six children, were killed and 19 injured when a
bus carrying businessmen and their families fell

South Asia DisasterReport 2011
| 123 |
into a gorge in Kuthalgate area near Dehradun
on January 5, 2011. The mishap occurred when
the bus, going to Haridwar from Mussoorie, skid-
ded off the road and fell into 50-feet-deep gorge.
Most of the victims died on the spot. In another
incident, twenty-one people, including 19 wom-
en, were killed and nine others were injured
when a pick-up van in which they were travelling
collided with a truck in Kuchera area in Rajasthan
on February 14, 201148. The accident took place
when they all were returning home in Luwari vil-
lage of Jodhpur district after performing some
rituals in Butati village.
Forty-three people, including 34 members of
a marriage party, were killed in two accidents in
the remote Chamba district of Himachal Pradesh
on March 3, 201147. A truck carrying the marriage
party veered off the Sohra-Sherpur road in the
Dalhousie sub-division in the early hours and
plunged into a gorge, killing 34 people and in-
juring eight others. In the other incident, all nine
persons were killed when a pick-up van fell into
a gorge at Thala Sirhari village of the Bharmaur
sub-division.
Eleven persons were killed and 58 injured
seven of them seriously, when an over-loaded
mini bus skidded off the road and fell into a deep
Fig 11.22 : The lorry which rammed an autorickshaw killing 11 people and injuring three others on Kothacheruvu road in Anantapur district
in Andhra Pradesh, India on 1st January, 2011( Source : The Hindu).
gorge in Udhampur district of Jammu and Kash-
mir on March 15, 201148. The mishap occurred
when the driver of the bus, which was on its way
from Latti to Chenani, lost control over the vehi-
cle and the vehicle skidded off the road and fell
into the 330-feet deep gorge at Choka Nallah,
about 125 kms from Jammu. Six persons died on
the spot and five others succumbed on their way
to hospital.
(Fig 11.23 : Policemen and villagers extricating bodies from the mangled remains of the bus at Yanamadala village in Guntur district in
Andhra Pradesh, India on March 20, 2011 (Source : The Hindu)
Nine people travelling by a Guntur-bound
APSRTC bus were killed while 20 others were
injured when it collided with a lorry and later
crashed into the cement boulders at Yanama-
dala village on the NH-5, about 10 km. from
Guntur town on March 20, 201147. The impact of
the crash was severe and the road was strewn
with broken pieces of glass and twisted metals
(Fig: 11.23). The bus was reduced to a piece of
mangled rubble. In another road accident, ten
persons, including three women, were killed and
at least 25 injured when a bus fell into a deep
gorge near Koti, 25 km from Chamba, on April
4, 201147. While eight persons died on the spot,
two succumbed to their injuries on the way to
the Hospital. The ill-fated bus was on its way
to Chamba from Bharara village. The bus went

| 124 |
IntroductionMan-made Disasters
down at least 50 feet in the gorge when the driv-
er suddenly lost control as a portion of the road
caved in.
In another major accident in Guntur district
in Andhra Pradesh, 10 persons, including nine
women, drowned when the tractor-trailer in
which they were travelling plunged into the Na-
garjunasagar canal near Sattenapalli on April 25,
2011. All of them were agricultural workers be-
longing to Vaddepalli and Sundarayya Colony in
Sattenapalli town. The accident occurred around
7.45 a.m. when the vehicle hit the wall of a cul-
vert while crossing it on the way to an agricul-
tural field. The driver lost control, causing the ve-
hicle to plunge into the canal.
On May 9, 2011, in Karnataka, eleven labour-
ers, including eight women, were killed when a
truck in which they were travelling collided with
a lorry in Koppal district. Nine others were also
severely injured48. In another incident, twelve la-
bourers were killed, 10 of them on the spot and
two in hospital, and eight were injured when a
mini-goods vehicle in which they were travel-
ling collided with a lorry on National Highway
13 near Onabellary Cross, 30 km from Koppal,
on May 9, 201149. Nineteen people were killed
and 62 others were injured in two separate road
mishaps in Rajasthan, on May 12, 201150. 11 men
were killed when a truck carrying a marriage
party overturned in Dholpur district. The incident
occurred near Arua-ka-Nala area when the vic-
tims were returning to their native village Khedli
after attending a marriage function at a nearby
village. Nine men died on the spot, while two
others succumbed to injuries on way to a hospi-
tal. In another mishap, eight persons were killed
and 12 others injured in a collision between two
cars in Pali district. The accident happened near
Bavra village when the cars collided head on May
11, 2011. In West Bengal, at least 12 people were
killed and 50 others were injured in a road acci-
dent near Chhatna in Bunkura Distt on May 12,
201149. The incident occurred when a passenger
bus overturned following loss of control by the
driver on a road in Meghnath jungle in West Ben-
gal's Bankura district. The driver of the bus was
among those killed. The injured passengers were
rushed to Sammilani Medical College in Bankura
town. In another train and jeep collision in Mad-
hubani district in Bihar on May 22, 2011, 21 peo-
ple were killed49. Among those killed include 11
women, nine children and the driver of the jeep.
The collision between the overcrowded jeep and
Jay Nagar bound Garib Rath Express took place
at an unmanned railway crossing near Mangar-
patti Railway halt. The impact of the accident was
so severe that the jeep was dragged about half a
kilometer before the train stopped.
In another ghastly road accident in Lux-
ettipet mandal of Adilabad district in Andhra
Pradesh, six persons, including two children, trav-
elling in a jeep lost their lives on May 25, 201147.
Another dozen passengers of the ill-fated jeep
were severely injured after it rammed a station-
ary lorry near Yellampalli village in Luxettipet
mandal. In another bizarre incident on the same
day, three persons succumbed to injuries and 17
others suffered serious injuries when the side
iron holds of a trailer-truck laden with iron gird-
ers sliced through a passenger bus under the
Ramabhadrapuram Police Station limits. The pas-
sengers were travelling from Jeypore (Orissa) to
Rajahmundry in a bus belonging to the Orissa
State Road Transport Corporation.
Thirty-six people were killed and 17 oth-
ers injured in two road mishaps in Assam where
a bus carrying a marriage party fell into a pond
and an oil tanker caught fire on May 30, 2011. 31

South Asia DisasterReport 2011
| 125 |
passengers, including 12 women, were killed and
six persons critically injured when a bus carry-
ing a marriage party fell into a pond in Kamrup
(Rural) district on May 30, 2011 night. The bus,
carrying around 40 passengers from Guwahati
to Dihu in Rangia sub-division of the district, fell
into the 40 ft deep pond when a wooden bridge
it was crossing gave in. The accident occurred at
Rajabari on Hajo-Guwahati road. In the second
accident, five persons were charred to death and
12 others injured when an oil tanker burst into
flames in Badulipara in Golaghat district early on
the morning of May 31, 2011.
In another mishap, at least 18 pilgrims sleep-
ing near the roadside were killed and ten others
injured after they were run over by a speeding
truck near Ahmedabad on June 8, 201148. The mis-
hap took place on the Dholka-Bagodara High-
way when a group of people were sleeping near
a road side `dhaba' (eatery) at Beghwa crossroad.
The truck lost control and ran over them. Sixteen
persons, including nine women, were killed on
Fig 11.24 : The remains of the van which was involved in a collision with a truck near Mohanur in Namakkal district in Tamil Nadu, India on
June 15, 2011 (Source : The Hindu) .
the spot while two others died in hospital.
Eleven persons, including eight women, were
killed when the van in which they were travelling
collided with a lorry at Rasipalayam village near
Mohanur in Namakkal district, Tamil Nadu on
June 15, 201147(Fig:11.24). The van was negotiat-
Fig 11.25 : The wreckage of the accident occurred near Heggare in Tumkur district in Karnataka, India on June 27, 2011 (Source : The Hindu)
ing a blind curve when it collided with the lorry.
Sixteen persons died and eight were severely
injured when a Karnataka State Road Transport
Corporation (KSRTC) bus collided with a Tempo
Trax near Heggare in Tumkur district in Karna-
taka on June 27, 201147(Fig: 1125). The accident
occurred on National Highway 206, in front of
Gangadharaiah Memorial Hall, around 12.30 p.m.
While 15 people died on the spot, one died on
the way to hospital.
Rail Accidents
Ten persons were killed and over 40 were in-
jured in three train accidents at three different
places in Uttar Pradesh on January 1, 2011, even
as dense fog played havoc with rail, road and air
traffic47. The accidents, in a span of three hours,
involved five express trains. All casualties oc-
curred at the Panki station near Kanpur when the
Bhiwani-Gorakhpur Gorakhdam Express rammed
the stationary New-Delhi-Prayagraj Express from
the rear at around 9 a.m. The victims were in the
last two unreserved compartments of the Alla-
habad-bound train. The guard was also killed in
the mishap. Earlier in the day, the Delhi-Sitama-
rhi Lichchavi Express rammed the stationary

| 126 |
IntroductionMan-made Disasters
Magadh Express near the Sarai Bhopat station
in Etawah district at 8.15 a.m on January 1, 2011
(Fig: 11.26).
(Fig 11.26: The mangled coaches of the Delhi-Islampur Magadh Express after the Bihar-bound Lichchavi Express rammed it at Sarai Bhopat in
Uttar Pradesh in India Source : The Hindu ).
In another incident, 14 youths, travelling atop a
train, were killed when they hit against an over-
head bridge near the Rosa station in Shahjahan-
pur district of Uttar Pradesh on 1 February 2011.
The victims were returning from Bareilly by the
Jammu Tawi-Howrah Himgiri Express, after a re-
cruitment test for tradesmen in the Indo-Tibetan
Border Police (ITBP) (Fig: 11.27).
Fig 11.27: ITBP job aspirants, returning from Bareilly by an overcrowded train, at the Budaun station in India on February 1, 2011 Source : The Hindu.
Air Accidents
In one of the worst helicopter crashes in
Arunachal Pradesh, 17 persons, including three
crew members were killed and six injured when
a Pawan Hans MI-17 copter caught fire and
plunged into a gorge in Tawang city on April 19,
201147. The chopper was flying to Tawang from
the Lokopriya Gopinath Bordoloi International
Airport in Guwahati and had taken off at 12.45
p.m. It caught fire, broke into pieces and crashed
into a gorge close to the helipad around 13.57
p.m. Two crew members and four passengers
survived with grievous injuries .The villagers as-
sisted Army personnel in under taking rescue op-
erations (Fig: 11.28).
At least 66 persons, including ministers, legis-
lators, senior government officials and pilots,
were killed in air crashes in the North East dur-
ing the past one decade. Of the 66 killed in plane
and helicopter crashes at least 47 were killed in
Arunachal Pradesh alone. The air crashes had oc-
curred due to high altitude terrain in the region,
inclement weather conditions and mechanical
defects owing to lack of proper maintenance of
the air craft.
Stampedes
A stampede is a sudden rush of a congregated,
active or polarized aggregate of people, resulting
in many injuries and death from suffocation and
trampling. The two major behavioural reasons of
(Fig 11.28: Army personnel and villagers having a look at the remains of a Pawan Hans helicopter which crashed in Tawang, Arunachal
Pradesh, India on April 19, 2011 (Source : The Hindu).

South Asia DisasterReport 2011
| 127 |
any stampede are anxiety and panic. Most of the
stampede disasters can be prevented by simple
crowd management strategies.
On January 14, 2011, many pilgrims gath-
ered to attend the Makarjyothi darshan, on the
last day of a yearly festival which attracted mil-
lions of devotees, at a Hindu shrine in Pamba
at sabarimala in the Pattanamthitta district of
Kerala, India. After witnessing the Makarajyothi
at Pamba, the pilgrims were returning and on
their way back at around 8 p.m, the stampede
incident happened, killing 102 pilgrims and in-
juring at least 100 more. The tragedy occurred
when an auto and jeep overturned. Both the
vehicles were filled with the devotees. Initially,
the fully packed auto overturned after it lost
control. While the pilgrims were trying to lift
the auto, the jeep rammed, triggering the stam-
pede, which resulted in killing of 102 piligrims.
The autopsy report also suggested that most
of the pilgrims died of injuries to their internal
organs due to the stampede.The Kerala Chief
Minister announced a judicial inquiry into the
stampede that claimed the lives of 102 Sabari-
mala pilgrims. He also announced a solatium
of Rs five lakh for the families of each of the
victims. The seriously injured were given Rs
50,000($1,100 USD) and those with minor in-
juries Rs 25,000 ($550 USD) each. He also re-
viewed with cabinet colleagues on the spot ar-
rangements to transport the bodies as most of
the deceased were from neighbouring states of
Tamil Nadu, Karnataka and Andhra Pradesh. The
state of Kerala declared three days of mourning.
Prime minister of India Dr. Manmohan Singh
offered condolences for the deaths and an-
nounced a compensation of 100,000 ($2,200
USD) to the next of kin of the dead and 50,000
($1,100 USD) for those injured. A team of Na-
tional Disaster Response Force (NDRF) was sent
to the scene. The Tamil Nadu Chief Minister also
announced 1,00,000 to the family of each vic-
tim from Tamil Nadu. Keeping the fact of Sabari-
mala tragedy which left over 102 pilgrims dead
in a stampede, a cautious Kerala government
came up with a new footpath, a bridge and a
slew of measures to decongest the route lead-
ing to the Sabarimala temple. It was also decid-
ed that an integrated security and safety plan
involving police, rapid action force and disas-
ter management contingents would be put in
place during the two-month long pilgrimage
season of Sabarimala Ayyappa temple. Apart
from strengthening intelligence gathering,
trained commandos, bomb detection squads,
disaster management units and RAF contin-
gents would be deployed at the base camp
Pampa, ''Sannidhanam'' atop the hill shrine and
other places connected with the event.
Fire
The year 2011 witnessed a major fire accident in
AMRI Hospital which was located in a posh area
in Kolkata. AMRI hospital is a center for training
the students of Institute of Radiology & Medi-
cal Imaging and is ISO 9001:2000 certified. It is a
multistoried private hospital which turned into a
towering inferno in the early hours of the morn-
ing when a fire broke out in the AMRI hospital in
Kolkata on December 9, 2011(Fig: 11.29). The fire
spread fast from the basement of the hospital,
engulfing one ward after the other and trapping
hundreds of people.
The fire was first noticed by local residents at
around 3.30 a.m. who rushed to the gates but
were stopped by security guards. The hospital
authorities reported to the fire station after an
hour or so. Firemen, who reached at 4.30 a.m.

| 128 |
IntroductionMan-made Disasters
broke through the double-paned glass façade of
the hospital and rescued a few lucky survivors.
Around 25 fire engines were rushed to the spot.
The fire fighters used hydraulic ladders to rescue
the patients and office staffs by cutting open the
glasses with gas cutters. Many patients were low-
ered down from the upper floors in safety har-
nesses attached to ropes; others were wheeled
out on stretchers. But by then, it was too late for
a majority of the 150 patients admitted at AMRI.
The fire was the result of an electrical short cir-
cuit in the basement car park, which was used for
storing combustible material like LPG cylinders,
engine oil, PVC pipes, bedding, etc. The fire didn’t
spread at all and was confined to the basement.
But the thick black smoke went up through the
AC ducts and carried it through the rooms of
and the corridors of the seven-storeyed hospital
located in a densely-populated area.
Fig 11.29: Photograph showing fire in the AMRI hospital in Kolkata, India
The fire killed 91 patients including three
hospital staffers in the incident. While many pa-
tients died of burns, most died due to suffoca-
tion caused by carbon monoxide accumulation
all over the building. Critical patients trapped
inside the smoke-filled ICU were the biggest
casualties. In a desperate bid to rescue them,
windows were broken, locals rushed in, as fire-
fighters collapsed unable to cope with the
smoke (Fig: 11.30). The Chief Minister of West
Bengal, Ms Mamata Banerjee, who also holds
the health portfolio, cancelled the license of
the hospital immediately. A judicial investiga-
tion into the entire catastrophic incident was
ordered. Six members of the hospital board
were arrested on charges of culpable homicide
and negligence. An exgratia grant at the rate
of Rs 3 lakh was provided to the next of kin of
the deceased in the AMRI hospital fire by the
government of West Bengal. A sum of Rs 1.5
lakh was paid from the State Disaster Response
Fund and an equal amount was paid from the
State budget for the purpose. At the central
level, the Prime Minister sanctioned an ex-
gratia relief of Rs 2 lakh each to the kin of the
deceased and Rs 50,000 each to those injured
from the PM’s relief fund.
Fig 11.30 (a) & (b) :Photographs showing aggrieved relatives of the deceased of the AMRI hospital fire breakout in Kolkata, India
(Source: The Hindu).
Maldives
A house named ‘Fair’ in Maafannu ward was
severely damaged in a fire incident on March
9, 2011. Households and valuables were dam-
aged in the incident. In another fire incident,
two persons were killed on March 20, 201146.
The fire had originated in the kitchen of Hen-

South Asia DisasterReport 2011
| 129 |
veiru Orchid, the house in which the two vic-
tims were trapped. After the fire broke out,
firefighters from the MNDF, who were the first
to arrive on the scene, managed to douse the
flames, but were unable to control the blaze
that was enveloping Orchid house. After ini-
tial attempts to enter the house failed, a new
group of MNDF firemen managed to force their
way inside and retrieved the bodies of the two
victims (Fig:11.31). Later in the day, Maldivian
President, Mohamed Nasheed, visited Henvei-
ru Orchid to inspect the damage wrought by
the inferno. After meeting the members of the
grieved family President Nasheed expressed
his deep sympathy.
Fig 11.31 : The two dead bodies retrieved from Henveiru Orchidge in Maldives being taken to the ambulance on 20 March 2011.
(Source: HAVEERU News)
In another incident, a fire broke out on July 10,
2011 in an apartment on the fourth floor of
Galolhu Feeroz Lodge causing damage to the
premises owned by Donad Garment Factory. In
another incident, fire broke out on September
12, 2011 at a house located near the Maafannu
Piyajige, Buru, leaving a person in a serious condi-
tion46. Firefighters of Maldives National Defence
Force (MNDF) rescued the person trapped inside
the house (Fig: 11.32)
Road Accidents
On May 10, 2011, three people were injured in a
dangerous road accident involving 3 motor cy-
cles and a car on Addu Link Road. On June 21, a
speeding car, while trying to overtake a cycle, col-
lided with the cycle on Addu Link Road, sending
the cycle and its occupants crashing on to the
asphalt causing serious injuries. Simultaneously,
the collision sent the car rolling over several feet,
seriously injuring the driver and rendering the
vehicle unusable.
Nepal
Air Accidents
In Nepal, a small plane carrying foreign tour-
ists crashed in a hill south of Kathmandu air-
port early on, September 25, 2011, killing all 19
people aboard including the crew members51
(Fig: 11.33). The accident site, Kotdanda, lies
between Lamatar and Bisankhunarayan VDCs
in Lalitpur, around 15 kilometers south of the
Tribhuvan International Airport. The ill-fated
flight was approaching Kathmandu airport in
cloudy weather after completing its mountain
flight.
Fig 11.32 : Firefighters of Maldives National Defence Force (MNDF) rescue the person trapped inside Maafannu Piyajige after fire broke out
at a ground floor room of the house on September 12, 2011. (Source: HAVEERU News)

| 130 |
IntroductionMan-made Disasters
Fig 11.33 :Wreckages of an air craft that crashed on September 25, 2011at Kotdanda around 15 kilometers south of the Tribhuvan
International Airport, Nepal (Source: The Kantipur News)
Pakistan
Bomb Blasts
At least 35 security personne were killed and 54
seriously injured when a suicide bomber blew
himself up in the parade ground at Punjab Regi-
ment Centre (PRC) area in Mardan, District on
January 13, 2011. A 16 year old suicide bomber
in a student's uniform entered the ground from
the western side to PRC centre with other chil-
dren and reached the parade ground located
near Officers Mess where Jawans in large num-
ber were busy in their routine drill and other ex-
ercises. The suicide bomber blew himself up with
a huge bang. As a result 35 security forces jawans
were martyred and 54 got injured in which 20
were seriously injured. In another incident on
January 21, 2011, at least 20 persons, including
five Police and Frontier Constabulary person-
nel, were killed and 15 others sustained injuries
when a vehicle loaded with explosives rammed
into the Miryan police station. Six security of-
ficials were also severely injured in the explo-
sion. In another incident at Lahore, a massive car
bomb blast ripped through a gas station in Fais-
alabad on March 8, 2011, killing at least 32 peo-
ple and wounding 125 others53. The explosion
also damaged nearby buildings, including an of-
fice of the Pakistan International Airlines (PIA).
A suicide bomber killed 43 people and wounded
52 others in an attack on a funeral prayer in Ad-
ezai village near Peshawar on March 9, 2011. The
bomber blew himself up soon after the prayers
had begun. In another incident, at least 32 peo-
ple were killed in a suicide bombing in a market
in Peshawar late on June 11, 2011. Ninety-five
people were also wounded54. The bombing took
place near a building which houses several news-
paper offices as well as apartments and across
the street only about 100 yards from army hous-
ing units. In another blast at a hotel on the Na-
tional Highway close to Dera Allah Yar in Quetta
killed 15 people and injured 23 others on August
14, 201154. The blast destroyed the double-storey
building of the hotel and reduced it to rubble.
The explosion rocked the town and caused panic
among its residents. The attack also wounded 23
other people.
More than 50 persons, including women
and children, were killed and over 100 others in-
jured when a suicide bomber struck at a mosque
in Jamrud on August 19, 201152. The blast took
place at Jamia Masjid Madina in Sherabaz
Madokhel in Ghundai area of Tehsil Jamrud, Khy-
Fig11.34 :A blast victim being shifted to a hospital in Sherabaz Madokhel in Ghundai area on August 19, 2011 (Source: The Frontier Post)

South Asia DisasterReport 2011
| 131 |
ber Agency (Fig: 11.34). Hundreds of people were
offering Friday prayers inside the mosque when
the explosion took place. Immediately after the
blast, rescue teams and law enforcement agen-
cies personnel rushed to the spot and retrieved
the injured and bodies from under the collapsed
roof of the mosque.
A car bombing targeting the house of a
politician in southwestern Pakistan had killed at
least 15 people and injured 23 others in the city
of Quetta on December 30, 2011. The explosion
caused damage to nearby homes and cars and
set several shops on fire. Thousands of people
were killed in bombings and other militant at-
tacks over the past few years in Pakistan, and sev-
eral thousands more were displaced.
In Quetta, at least 19 miners were killed
and more than 34 others were trapped when a
coalmine in Sorang area collapsed due to pow-
erful explosions resulted from accumulation of
deadly methane gas, about 25 kilometers from
the provincial capital Quetta on March 21, 201155.
Sri Lanka
Road Accidents
At least six persons were killed and eight oth-
ers injured when a passenger bus bashed into
a van proceeding from Kuruwita to Colombo at
Ihala Kosgama on the Avissawella-Colombo road
on January 13, 201156. The passengers in the van
were returning after attending a funeral and the
bus was bound to Colombo from Walasmulla. In
another accident, at least three passengers were
killed and 40 others injured when a private bus
plying from Passara to Miyanakadura plunged
down a 300-feet precipice at Namunukula area
on March 25, 2011. In another incident, seven
persons were killed while ten others were injured
in Warakapola, on May 23, 2011, when the van in
which they were travelling collided head on with
a lorry in the Colombo- Kandy main road. All the
victims were admitted to the Kegalle General
Hospital but succumbed to their injuries. The vic-
tims are residents of Pallemorugama and Buth-
gamuwa. In an another collision incident, five
persons died and 27 others were injured when a
van transporting staff of a garment factory, col-
lided head on with a private bus at Kiribathkum-
bura on the Colombo-Kandy main road on July
16, 201157. The bus was travelling from Matale to
Colombo when it collided with the van carrying
staff of a garment factory from Hemmathagama
to Kandy. The driver of the van was among those
who died.
References:1. Tolo News
2. Daily Outlook Afghanistan, KANDAHAR CITY
(Pajhwok)
3. Press TV, Kunduz
4. Press TV
5. Daily Outlook Afghanistan, KABUL
6. Daily Times, Kabul
7. Pajhwok Afghan News (PAN) SHARAN
8. PAN by Mirwais Himmat (GHAZNI CITY)
9. PAN (GARDEZ) by Daud Tapan
10. PAN (PUL-I-ALAM)
11. Daily Times, Khost
12. VOA News
13. PAN
14. PAN (HERAT CITY/ KABUL) by Pajhwok Report
15. Pajhwok Afghan News, Parwan
16. Dawn News, Kabul
17. PAN (KHOST CITY)
18. Daily Outlook Afghanistan, JALALABAD (Pajhwok)
19. PAN
20. PAN (JALALABAD)
21. Pajhwok Afghan News (PAN) MAZAR-I-SHARIF

| 132 |
Introduction
22. Daily Outlook Afghanistan, ASADABAD (Pajhwok)
23. Daily Outlook, Herat
24. PAN KANDAHAR CITY
25. Bakhtar News Agency
26. Pajhwok Afghan News (PAN) HERAT CITY
27. PAN (Kabul)
28. The Frontier Post, KANDAHAR (APP)
29. PAN (PUL-I-KHUMRI)
30. Tolo News, Helmand
31. The Daily Star
32. The Daily Star, Thakurgaon
33. The Daily Star, Pabna
34. The Daily Star, Patuakhali
35. The Daily Star, Gobindaganj
36. New Age, Bdnews24.com, Dhaka
37. The Daily Star,
38. The Daily Star, Gaibandha
39. New Age,
40. The Daily Star, Star Report
41. The Daily Star, Brahmanbaria
42. The New Nation, Sirajganj
43. The Daily Star, Bogra
44. The Daily Star, Narsingdi
45. The Daily Star, Star Report
46. Haveeru News
47. The Hindu
48. DD News
49. News on air
50. Press Trust of India
51. The Kantipur News
52. The Frontier Post, Mardan
53. Daily Times, Faisalabad
54. Daily Times, Peshawar
55. Daily Times, Quetta
56. Daily Mirror
57. Daily News, Kiribathkumbura
Man-made Disasters
South Asia DisasterReport 2011
| 133 |
The SAARC Disaster Management Centre is pub-
lishing the South Asia Disaster Report annually
since 2007 onwards. This report documents the
relevant information about all the disasters, nat-
ural as well as man-made, in the South Asia re-
gion. The earlier annual reports generated by the
Centre for the years 2007, 2008, 2009 and 2010
have evoked overwhelming response from many
quarters. The present South Asia Disaster Report,
2011 documents the geological, hydro-meteoro-
logical, biological and man-made disasters that
were witnessed in all the eight SAARC countries
i.e., Afghanistan, Bangladesh, Bhutan, India, Mal-
dives, Nepal, Pakistan and Sri Lanka during the
year 2011 (i.e., from 01 January to 31 December,
2011).
The report analyzes the trends of disasters in
the SAARC region, their impacts and assessment
of damage and loss of lives, property and infra-
structure. It also discusses the manner in which
response to the disasters was organized in these
countries at the local, regional, provincial and na-
tional levels, and the necessary steps taken for re-
covery and reconstruction and for mitigation of
disaster risks, and the challenges and constraints
faced for the holistic management of disasters in
the region.
The data used for this publication is from
many sources. Daily reports of disasters in the
member countries of SAARC have been meticu-
lously collected by the SAARC Disaster Manage-
ment Centre from the published and electronic
media reports and the essential information have
been collected and analysed to document the
pattern and frequency of disasters in these coun-
tries. The important sources include the global
Emergency Disaster Database (EMDAT) main-
tained by the Centre for Research on Epidemiol-
ogy of Disasters (CRED), the Global Disaster Alert
and Coordination System (GDAC); the database
of the United States Geological Surveys (USGS),
Afghanistan National Disaster Authority (AND-
MA), Bangladesh Meteorological Department
(BMD), Disaster Management Bureau (DMB)
Bangladesh, Bhutan Geological Survey (BGS),
Geological Survey of India (GSI), India Meteoro-
logical Department (IMD), India Disaster Report
Department of Meteorology, Maldives; Nepal
Seismological Centre (NSC), Geological Survey of
Pakistan (GSP), Pakistan Meteorological Depart-
ment (PMD), and Department of Meteorology,
Sri Lanka. The national focal points of SDMC were
consulted for authentic information on the disas-
ters in respective countries. Because of inherent
limitations of international data agencies in re-
porting the country-based disaster information,
SDMC developed its own database generated
from an extensive daily survey and analysis of a
large number of newspapers published from the
region, which generated a wealth of extremely
valuable information on disasters in the region to
supplement the existing database. The SAARC Di-
saster Management Centre has now established
a mechanism of documenting disasters on a dai-
ly basis. It is primarily based on media reporting.
Aggregating daily reports, the Centre is already
Conclusion
Chapter 12

| 134 |
Introduction
publishing its weekly disaster update which is
posted on its website. The Centre is also pub-
lishing a quarterly news letter i.e., SDMC Informs
which also gives relevant information of all the
important disaster events occurred in the SAARC
region.
This report is a sincere effort to develop a
comprehensive disaster data bank on different
disaster themes by compiling data available from
different primary sources in the national govern-
ments, regional agencies, scientific and techni-
Conclusion
cal organizations and various global sources, as
detailed in the appendices on different disaster
themes.
It is hoped that the information and analysis
in the report will be extremely useful and gen-
erate interest among the researchers, disaster
managers, scientists, engineers, policy makers,
administrators, relief and rehabilitation agencies,
civil society organizations and other national and
international organizations.

Appendix

| 136 |
IntroductionA
pp
end
ix I-
A
So
uth
Asi
a D
isas
ter
Pro
file
Dis
aste
r Ev
ent>
>>
Cyc
lon
eEa
rth
qu
ake
Dro
ug
ht
Ava
lan
che
Flo
od
Hea
t an
d c
old
w
aves
Lan
d
slid
esEp
idem
icTo
tal
Co
un
try
In
jure
d in
nu
mb
er
Afg
han
ista
n5
--
-11
0-
--
115
Ban
gla
des
h12
1-
--
--
--
121
Bh
uta
n-
16-
--
--
-16
Ind
ia50
200
--
--
--
250
Mal
div
es-
--
--
--
-
Nep
al-
89-
-32
--
-12
1
Paki
stan
--
--
755
--
-75
5
Sri L
anka
41-
--
51-
--
92
Tota
l21
730
5-
-94
8-
--
1470
Co
un
try
Ho
mel
ess
in n
um
ber
Afg
han
ista
n-
--
-97
00-
--
9700
Ban
gla
des
h-
--
--
--
--
Bh
uta
n-
--
--
--
--
Ind
ia25
0000
7500
0-
--
--
-32
5000
Mal
div
es-
--
--
--
--
Nep
al-
--
--
--
--
Paki
stan
--
--
--
--
-
Sri L
anka
--
--
1060
273
--
-10
6027
3
Tota
l25
0000
7500
0-
-10
6997
3-
--
1394
973
Co
un
try
Tota
l af
fect
ed in
nu
mb
ers
Afg
han
ista
n5
-17
5000
0-
1281
0-
--
1762
815
Ban
gla
des
h12
1-
--
1570
559
1020
00-
-16
7268
0

South Asia DisasterReport 2011
| 137 |
Dis
aste
r Ev
ent>
>>
Cyc
lon
eEa
rth
qu
ake
Dro
ug
ht
Ava
lan
che
Flo
od
Hea
t an
d c
old
w
aves
Lan
d
slid
esEp
idem
icTo
tal
Bh
uta
n-
2001
6-
--
--
-20
016
Ind
ia25
0050
5752
00-
-12
0040
69-
--
1282
9319
Mal
div
es-
--
--
--
1289
1289
Nep
al-
1679
49-
-18
5825
000
--
1948
07
Paki
stan
-10
00-
-54
0075
5-
--
5401
755
Sri L
anka
3504
1-
--
1293
924
--
2634
313
5530
8
Tota
l28
5217
7641
6517
5000
0-
2028
3975
1270
00-
2763
223
2379
89
Co
un
try
Kill
ed in
nu
mb
er
Afg
han
ista
n21
--
2462
-3
-11
0
Ban
gla
des
h13
--
-10
6225
-11
0
Bh
uta
n-
1-
--
-1
-2
Ind
ia10
611
2-
-60
821
232
-10
70
Mal
div
es-
--
--
44
Nep
al-
7-
610
442
63-
222
Paki
stan
-2
-3
509
7
-52
1
Sri L
anka
22-
--
65
2416
727
8
Tota
l16
212
2-
3313
5831
615
517
123
17
Co
un
try
Esti
mat
ed D
amag
e(U
S$x1
000)
Afg
han
ista
n-
1420
00-
1654
000
--
-17
9600
0
Ban
gla
des
h-
--
--
--
--
Bh
uta
n-
--
--
--
--
Ind
ia37
5625
--
--
--
-37
5625
Mal
div
es-
--
--
--
--
Nep
al-
--
--
--
--
Paki
stan
--
--
2500
000
--
-25
0000
0
Sri L
anka
--
--
5000
00-
--
5000
00
Tota
l37
5625
--
-46
5400
0-
--
5171
625

| 138 |
Introduction
Sl. N
o.2
01
1To
tal K
illd
1.In
du
stri
al a
ccid
ents
43
2.M
isce
llan
eou
s ac
cid
ent
468
3.Tr
ansp
ort
Acc
iden
t11
90
Tota
l1
70
1
Sour
ce: E
mda
t acc
esse
d on
27
Feb2
012
& M
edia
Rep
ort S
DM
C
Peop
le k
illed
in M
an M
ade
Dis
aste
r

South Asia DisasterReport 2011
| 139 |
Ap
pen
dix
-I-B
Sou
th A
sia
Dis
aste
r Ev
ents
20
11
S.I.N
oC
ou
ntr
yLo
cati
on
Ty
pe
Dat
e st
arti
ng
D
ate
End
ing
K
illed
Tot.
A
ffec
ted
Est.
Dam
age
(US$
Mill
ion
)
Afg
han
ista
n
1.A
fgh
anis
tan
Bal
kh, S
aman
gan
, Tak
har
, ...
Dro
ug
ht
00/0
1/20
1100
/08/
2011
1750
000
142
2.A
fgh
anis
tan
Bag
hla
nFl
oo
d1/
5/20
118/
5/20
1137
9745
3.A
fgh
anis
tan
Wes
tern
Her
atFl
oo
d10
/2/2
011
16/0
2/20
1125
3065
4.A
fgh
anis
tan
Day
kun
di
Sto
rm10
/2/2
011
14/0
2/20
1121
5
Ban
gla
esh
1B
ang
lad
esh
No
rth
, So
uth
an
d S
ou
th
We
...Ex
trem
e te
mp
erat
ure
13/1
2/20
1118
/12/
2011
1220
00
2.B
ang
lad
esh
Bar
gu
na,
Gai
ban
dh
a,
Isb
wa
...Ex
trem
e te
mp
erat
ure
7/1/
2011
20/0
2/20
1150
1000
00
3.B
ang
lad
esh
Cox
's B
azar
, Sat
khir
a, J
e ...
Flo
od
21/0
7/20
1129
/07/
2011
1015
7055
9
4.B
ang
lad
esh
Ch
itta
go
ng
cit
yM
ass
Mov
emen
t Wet
4/7/
2011
4/7/
2011
17
5.B
ang
lad
esh
Sher
pu
r, M
ymen
sin
gh
, R
ang
...
Sto
rm4/
4/20
114/
4/20
1113
121
Bh
uta
n
1.B
hu
tan
Pero
-Th
imp
hu
reg
ion
Eart
hq
uak
e (s
eism
ic
acti
vity
)18
/09/
2011
18/0
9/20
111
2001
6
Ind
ia
1.In
dia
Sikk
im, W
est
Ben
gal
, Bih
a ...
Eart
hq
uak
e (s
eism
ic
acti
vity
)18
/09/
2011
18/0
9/20
1111
257
5200
2.In
dia
Utt
ar P
rad
esh
, Pu
nja
b,
Ha
...Ex
trem
e te
mp
erat
ure
16/1
2/20
1131
/12/
2011
132
3.In
dia
New
Del
hi;
Alla
hab
ad,
Pra
...Ex
trem
e te
mp
erat
ure
1/1/
2011
18/0
1/20
1180

| 140 |
IntroductionS.
I.No
Co
un
try
Loca
tio
n
Typ
eD
ate
star
tin
g
Dat
e En
din
g
Kill
edTo
t.
Aff
ecte
dEs
t. D
amag
e (U
S$ M
illio
n)
4.In
dia
Utt
ar p
rad
esh
, Utt
arak
han
...
Flo
od
15/0
6/20
1116
/07/
2011
5020
5.In
dia
Ori
ssa
stat
eFl
oo
d5/
9/20
1115
/09/
2011
4221
0000
043
2
6.In
dia
Utt
ar P
rad
esh
; Go
nd
a,
Bal
...
Flo
od
23/0
7/20
119/
8/20
1119
2000
00
7.In
dia
An
glo
ng,
Bar
pet
a, C
hir
ang
...
Flo
od
15/0
8/20
112/
10/2
011
204
5549
080
8.In
dia
Dem
aji d
istr
ict
(Eas
tern
...
Flo
od
15/0
8/20
118/
9/20
117
1100
0
9.In
dia
An
gu
l, B
asal
ore
, Bar
gar
h, .
..Fl
oo
d23
/09/
2011
23/1
0/20
1123
934
4398
993
0
10In
dia
Wes
t B
eng
al s
tate
sFl
oo
d10
/8/2
011
13/0
9/20
1147
7000
0027
5
11.
Ind
iaK
arn
atak
a st
ate
Sto
rm15
/04/
2011
15/0
4/20
1117
12In
dia
Cu
dd
alo
re, P
on
dic
hér
y (T
a ...
Sto
rm29
/12/
2011
30/1
2/20
1147
2500
0037
5.62
5
13.
Ind
iaU
ttar
Pra
des
hSt
orm
20/0
5/20
1120
/05/
2011
4250
Mal
div
es
1.M
ald
ives
Epid
emic
00/0
6/20
1128
/06/
2011
412
89
Nep
al
1.N
epal
San
khu
was
abh
a, T
aple
-ju
ng,
...
Eart
hq
uak
e (s
eism
ic
acti
vity
)18
/09/
2011
18/0
9/20
117
1679
49
2.N
epal
Kap
ilvas
tu, P
arb
at, B
ho
jp ..
.Ex
trem
e te
mp
erat
ure
11/1
/201
119
/01/
2011
420.
123
3.N
epal
Tap
leju
ng,
Ilam
, Pan
chth
a ...
Extr
eme
tem
per
atu
re00
/12/
2011
00/0
1/20
1225
000
4.N
epal
Mid
an
d F
ar W
este
rn re
gio
...
Flo
od
00/0
6/20
1100
/07/
2011
8918
58
5.N
epal
Acc
ham
dis
tric
tFl
oo
d2/
7/20
1119
/07/
2011
15
6.N
epal
Mas
s M
ovem
ent W
et20
/07/
2011
20/0
7/20
1113
7.N
epal
Ruku
m (N
uw
ako
t)M
ass
Mov
emen
t Wet
15/0
7/20
1115
/07/
2011
16
Paki
stan
1.Pa
kist
anB
alo
chis
tan
Eart
hq
uak
e (s
eism
ic
acti
vity
)18
/01/
2011
18/0
1/20
112
1000

South Asia DisasterReport 2011
| 141 |
S.I.N
oC
ou
ntr
yLo
cati
on
Ty
pe
Dat
e st
arti
ng
D
ate
End
ing
K
illed
Tot.
A
ffec
ted
Est.
Dam
age
(US$
Mill
ion
)
2.Pa
kist
anB
adin
, Mir
pu
rkh
as, T
and
o
...Fl
oo
d12
/8/2
011
1/11
/201
150
954
0075
525
00
Sri L
anka
1.Sr
i Lan
kaW
este
rn p
rovi
nce
Epid
emic
00/0
1/20
112/
12/2
011
167
2634
3
2.Sr
i Lan
kaK
egal
le, G
alle
, Gam
pah
a, ..
.Fl
oo
d29
/05/
2011
29/0
5/20
1186
00
3.Sr
i Lan
kaU
va p
rovi
nce
; Bat
tica
loa
...Fl
oo
d1/
2/20
1110
/2/2
011
1822
5000
300
4.Sr
i Lan
kaB
atti
calo
a, P
olo
nn
aru
wa,
...
Flo
od
5/1/
2011
18/0
1/20
1147
1060
324
200
5.Sr
i Lan
kaSo
uth
Sto
rm24
/11/
2011
27/1
1/20
1122
3504
1
Sour
ce: E
mer
genc
y D
atab
ase(
EM-D
AT)C
entr
e fo
r res
earc
h on
Epi
dem
iolo
gy o
f Dis
aste
r(C
RED
),Bel
gium
Acc
esse
d on
Sep
tem
ber-
3,20
12.D
ata
vers
ion
:v12
.07

| 142 |
IntroductionA
pp
end
ix-I
I
Sto
rms
in S
ou
th A
sia2
01
1
SI.N
o.C
ou
ntr
y
Loca
tio
n
Dis
as-
ter T
ype
Nam
eD
ate
Star
tin
g
dat
e en
din
g
Kill
ed
Tot.
Aff
ecte
d
Est.
Dam
age
(US$
Mill
ion
)
Afg
han
ista
n
1A
fgh
anis
tan
Day
kun
di
Sto
rm10
/2/2
011
14/0
2/20
1121
5
Ban
gla
des
h
1B
ang
lad
esh
Sher
pu
r, M
ymen
sin
gh
, R
ang
...
Sto
rm4/
4/20
114/
4/20
1113
121
Ind
ia
1In
dia
Kar
nat
aka
stat
eSt
orm
15/0
4/20
1115
/04/
2011
17
2In
dia
Cu
dd
alo
re, P
on
di-
chér
y (T
a ...
Sto
rmC
yclo
ne
Than
e29
/12/
2011
30/1
2/20
1147
2500
0037
5.62
5
3In
dia
Utt
ar P
rad
esh
Sto
rm20
/05/
2011
20/0
5/20
1142
50
Sri L
anka
1Sr
i Lan
kaSo
uth
Sto
rm24
/11/
2011
27/1
1/20
1122
3504
1
So
urce
- Em
erge
ncy
Dat
abas
e(EM
-DAT
)Cen
tre
for r
esea
rch
on E
pide
mio
logy
of D
isas
ter(
CRE
D),B
elgi
um A
cces
sed
on S
epte
mbe
r-3,
2012
.Dat
a ve
rsio
n :v
12.0
7

South Asia DisasterReport 2011
| 143 |
Ap
pen
dix
-III
Flo
od
in S
ou
th A
sia2
01
1
S.I N
oC
ou
ntr
y Lo
cati
on
Ty
pe
Dat
e St
arti
ng
D
ate
End
ing
K
illed
To
t. A
ffec
ted
Es
t. D
amag
e (U
S$ M
illio
n)
Afg
han
ista
n
1A
fgh
anis
tan
Bag
hla
nFl
oo
d1/
5/20
118/
5/20
1137
9745
2A
fgh
anis
tan
Wes
tern
Her
atFl
oo
d10
/2/2
011
16/0
2/20
1125
3065
Ban
gla
des
h
1B
ang
lad
esh
Cox
's B
azar
, Sat
khir
a, J
e ...
Flo
od
21/0
7/20
1129
/07/
2011
1015
7055
9
Ind
ia
1In
dia
Utt
ar p
rad
esh
, Utt
arak
han
...
Flo
od
15/0
6/20
1116
/07/
2011
5020
2In
dia
Ori
ssa
stat
eFl
oo
d5/
9/20
1115
/09/
2011
4221
0000
043
2
3In
dia
Utt
ar P
rad
esh
; Go
nd
a, B
al ..
.Fl
oo
d23
/07/
2011
9/8/
2011
1920
0000
4In
dia
An
glo
ng,
Bar
pet
a, C
hir
ang
...
Flo
od
15/0
8/20
112/
10/2
011
204
5549
080
5In
dia
Dem
aji d
istr
ict
(Eas
tern
...
Flo
od
15/0
8/20
118/
9/20
117
1100
0
6In
dia
An
gu
l, B
asal
ore
, Bar
gar
h, .
..Fl
oo
d23
/09/
2011
23/1
0/20
1123
934
4398
993
0
7In
dia
Wes
t B
eng
al s
tate
sFl
oo
d10
/8/2
011
13/0
9/20
1147
7000
0027
5
Nep
al
1N
epal
Mid
an
d F
ar W
este
rn re
gio
...
Flo
od
00/0
6/20
1100
/07/
2011
8918
58
2N
epal
Acc
ham
dis
tric
tFl
oo
d2/
7/20
1119
/07/
2011
15
Pak
ista
n
1Pa
kist
anB
adin
, Mir
pu
rkh
as, T
and
o ..
.Fl
oo
d12
/8/2
011
1/11
/201
150
954
0075
525
00
Sri L
anka
1Sr
i Lan
kaK
egal
le, G
alle
, Gam
pah
a, ..
.Fl
oo
d29
/05/
2011
29/0
5/20
1186
00
2Sr
i Lan
kaU
va p
rovi
nce
; Bat
tica
loa
...Fl
oo
d1/
2/20
1110
/2/2
011
1822
5000
300
3Sr
i Lan
kaB
atti
calo
a, P
olo
nn
aru
wa,
...
Flo
od
5/1/
2011
18/0
1/20
1147
1060
324
200
Sour
ce: E
mer
genc
y D
atab
ase(
EM-D
AT)C
entr
e fo
r res
earc
h on
Epi
dem
iolo
gy o
f Dis
aste
r(C
RED
),Bel
gium
Acc
esse
d on
Sep
tem
ber-
3,20
12.D
ata
vers
ion
:v12
.07

| 144 |
IntroductionA
pp
end
ix-I
V
Co
ld a
nd
Hea
t w
aves
in S
ou
th A
sia2
01
1
S.I.N
o.C
ou
ntr
y
Loca
tio
n
Dis
aste
r Ty
pe
Su
b T
ype
D
ate
St
arti
ng
D
ate
End
ing
K
illed
To
t.
Aff
ecte
d
Est.
Dam
age
(US$
Mill
ion
)
Ban
gla
des
h
1B
ang
lad
esh
No
rth
, So
uth
an
d
Sou
th W
e …
Extr
eme
tem
-p
erat
ure
Co
ld w
ave
13/1
2/20
1118
/12/
2011
1220
00
2B
ang
lad
esh
Bar
gu
na,
Gai
ban
dh
a,
Isb
wa
...Ex
trem
e te
m-
per
atu
reC
old
wav
e7/
1/20
1120
/02/
2011
5010
0000
Ind
ia
1In
dia
Utt
ar P
rad
esh
, Pu
nja
b,
Ha
...Ex
trem
e te
m-
per
atu
reC
old
wav
e16
/12/
2011
31/1
2/20
1113
2
2In
dia
New
Del
hi;
Alla
hab
ad,
Pra
...Ex
trem
e te
m-
per
atu
reC
old
wav
e1/
1/20
1118
/01/
2011
80
Nep
al
1N
epal
Kap
ilvas
tu, P
arb
at,
Bh
ojp
...
Extr
eme
tem
-p
erat
ure
Co
ld w
ave
11/1
/201
119
/01/
2011
420.
123
2N
epal
Tap
leju
ng,
Ilam
, Pan
ch-
tha
...Ex
trem
e te
m-
per
atu
reC
old
wav
e00
/12/
2011
00/0
1/20
1225
000
Sou
rce-
Em
erg
ency
Da
tab
ase
(EM
-DAT
)Cen
tre
for
rese
arc
h o
n E
pid
emio
log
y o
f Dis
ast
er(C
RED
),B
elg
ium
Acc
esse
d o
n S
epte
mb
er-3
,201
2.D
ata
ver
sio
n :v
12.0
7

South Asia DisasterReport 2011
| 145 |
S.I N
oD
ate
Lati
tud
e(N
ort
h)
Lon
git
ud
e(Ea
st)
Mag
nit
ud
eD
epth
Loca
tio
n/ E
arth
qu
ake
Felt
1A
fgh
anis
tan
226
/12/
2011
36.4
270
.94.
9 M
178
kmB
adak
hsh
an P
rovi
nce
321
/12/
2011
36.5
170
.84.
6 M
201
kmB
adak
hsh
an P
rovi
nce
418
/12/
2011
36.3
771
.57
4.6
M12
1 km
Bad
akh
shan
Pro
vin
ce
5.12
/12/
2011
36.4
371
.17
4.9
M13
7 km
Hin
du
Ku
sh R
egio
n.
67/
11/2
011
36.5
571
.06
5.5
M21
9 km
Bad
akh
shan
Pro
vin
ce
73/
11/2
011
36.4
571
.32
4.9
M95
km
Hin
du
Ku
sh R
egio
n.
831
/10/
2011
36.3
870
.74
4.6
M20
2 km
Bad
akh
shan
Pro
vin
ce
94/
10/2
011
36.6
268
.51
4.6
M24
km
Ko
nd
uz
Prov
ince
1030
/08/
2011
34.5
70.7
25
M10
9 km
Nan
gar
har
Pro
vin
ce
1126
/08/
2011
36.4
470
.69
5.4
M19
9 km
Bad
akh
shan
Pro
vin
ce
1224
/08/
2011
36.4
771
.61
4.8
M11
7 km
Bad
akh
shan
Pro
vin
ce
1323
/08/
2011
36.4
771
.23
4.8
M75
km
Bad
akh
shan
Pro
vin
ce
1419
/08/
2011
36.6
369
.84
4.9
M10
km
Takh
ar P
rovi
nce
1517
/08/
2011
36.3
569
.45.
2 M
31 k
mTa
khar
Pro
vin
ce
166/
8/20
1136
.35
71.0
84.
7 M
114
kmB
adak
hsh
an P
rovi
nce
1727
/07/
2011
36.1
869
.49
4.6
M16
8 km
Takh
ar P
rovi
nce
1817
/05/
2011
36.5
471
.15
4.8
M23
7 km
Bad
akh
shan
Pro
vin
ce
1914
/05/
2011
36.4
470
.74
5.9
M20
7 km
Bad
akh
shan
Pro
vin
ce
2014
/05/
2011
36.6
370
.97
4.8
M21
1 km
Bad
akh
shan
Pro
vin
ce
2113
/05/
2011
36.5
770
.93
4.9
M23
8 km
Bad
akh
shan
Pro
vin
ce
2221
/04/
2011
36.4
670
.58
4.6
M14
3 km
Bad
akh
shan
Pro
vin
ce
231/
4/20
1136
.51
70.9
24.
8 M
181
kmB
adak
hsh
an P
rovi
nce
2429
/03/
2011
36.7
571
.47
4.5
M18
2 km
Bad
akh
shan
Pro
vin
ce
2521
/03/
2011
36.5
170
.92
5.8
M19
6 km
Bad
akh
shan
Pro
vin
ce
Ap
pen
dix
-VA
Eart
hq
uak
e ev
ents
in S
ou
th A
sia
20
11
A
s re
cord
ed b
y G
lob
al D
isas
ter A
lert
an
d c
oo
rdin
atio
n S
yste
m(G
DA
C&
NSC
)
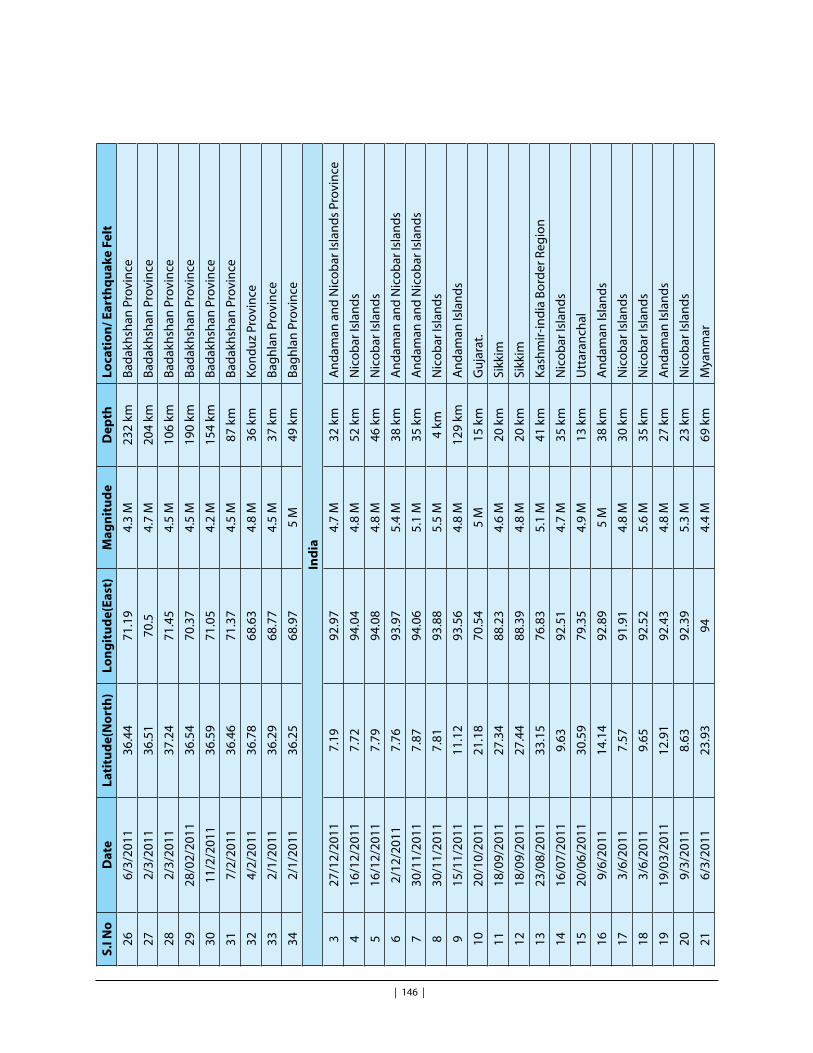
| 146 |
IntroductionS.
I No
Dat
eLa
titu
de(
No
rth
)Lo
ng
itu
de(
East
)M
agn
itu
de
Dep
thLo
cati
on
/ Ear
thq
uak
e Fe
lt
266/
3/20
1136
.44
71.1
94.
3 M
232
kmB
adak
hsh
an P
rovi
nce
272/
3/20
1136
.51
70.5
4.7
M20
4 km
Bad
akh
shan
Pro
vin
ce
282/
3/20
1137
.24
71.4
54.
5 M
106
kmB
adak
hsh
an P
rovi
nce
2928
/02/
2011
36.5
470
.37
4.5
M19
0 km
Bad
akh
shan
Pro
vin
ce
3011
/2/2
011
36.5
971
.05
4.2
M15
4 km
Bad
akh
shan
Pro
vin
ce
317/
2/20
1136
.46
71.3
74.
5 M
87 k
mB
adak
hsh
an P
rovi
nce
324/
2/20
1136
.78
68.6
34.
8 M
36 k
mK
on
du
z Pr
ovin
ce
332/
1/20
1136
.29
68.7
74.
5 M
37 k
mB
agh
lan
Pro
vin
ce
342/
1/20
1136
.25
68.9
75
M49
km
Bag
hla
n P
rovi
nce
Ind
ia
327
/12/
2011
7.19
92.9
74.
7 M
32 k
mA
nd
aman
an
d N
ico
bar
Isla
nd
s Pr
ovin
ce
416
/12/
2011
7.72
94.0
44.
8 M
52 k
mN
ico
bar
Isla
nd
s
516
/12/
2011
7.79
94.0
84.
8 M
46 k
mN
ico
bar
Isla
nd
s
62/
12/2
011
7.76
93.9
75.
4 M
38 k
mA
nd
aman
an
d N
ico
bar
Isla
nd
s
730
/11/
2011
7.87
94.0
65.
1 M
35 k
mA
nd
aman
an
d N
ico
bar
Isla
nd
s
830
/11/
2011
7.81
93.8
85.
5 M
4 km
Nic
ob
ar Is
lan
ds
915
/11/
2011
11.1
293
.56
4.8
M12
9 km
An
dam
an Is
lan
ds
1020
/10/
2011
21.1
870
.54
5 M
15 k
mG
uja
rat.
1118
/09/
2011
27.3
488
.23
4.6
M20
km
Sikk
im
1218
/09/
2011
27.4
488
.39
4.8
M20
km
Sikk
im
1323
/08/
2011
33.1
576
.83
5.1
M41
km
Kas
hm
ir-i
nd
ia B
ord
er R
egio
n
1416
/07/
2011
9.63
92.5
14.
7 M
35 k
mN
ico
bar
Isla
nd
s
1520
/06/
2011
30.5
979
.35
4.9
M13
km
Utt
aran
chal
169/
6/20
1114
.14
92.8
95
M38
km
An
dam
an Is
lan
ds
173/
6/20
117.
5791
.91
4.8
M30
km
Nic
ob
ar Is
lan
ds
183/
6/20
119.
6592
.52
5.6
M35
km
Nic
ob
ar Is
lan
ds
1919
/03/
2011
12.9
192
.43
4.8
M27
km
An
dam
an Is
lan
ds
209/
3/20
118.
6392
.39
5.3
M23
km
Nic
ob
ar Is
lan
ds
216/
3/20
1123
.93
944.
4 M
69 k
mM
yan
mar

South Asia DisasterReport 2011
| 147 |
S.I N
oD
ate
Lati
tud
e(N
ort
h)
Lon
git
ud
e(Ea
st)
Mag
nit
ud
eD
epth
Loca
tio
n/ E
arth
qu
ake
Felt
2216
/02/
2011
10.5
891
.78
4.7
M23
km
An
dam
an Is
lan
ds
2313
/02/
2011
13.7
492
.99
4.7
M35
km
An
dam
an Is
lan
ds
2411
/2/2
011
12.8
692
.46
4.4
M30
km
An
dam
an Is
lan
ds
2510
/2/2
011
26.7
288
.44
M68
km
Ind
ia-b
ang
lad
esh
Bo
rder
Reg
ion
261/
2/20
1110
.61
94.1
15.
6 M
22 k
mA
nd
aman
Isla
nd
s
277/
1/20
114.
1590
.37
5.4
M16
km
Off
Th
e W
est
Co
ast
Of N
ort
her
n S
um
atra
Mal
div
es
19/
5/20
111.
4568
.11
4.8
M15
km
Car
lsb
erg
Rid
ge
Nep
al
118
/09/
2011
27.7
288
.06
6.9
M19
km
Sikk
im
23/
6/20
1127
.61
88.1
14.
9 M
47 k
mSi
kkim
34/
4/20
1129
.67
80.7
55.
4 M
12 k
mN
epal
-In
dia
Bo
rder
Reg
ion
413
/02/
2011
27.4
386
.89
4.5
M32
km
Nep
al
Pak
ista
n
131
/12/
2011
27.1
366
.32
4.9
M31
km
Bal
uch
ista
n P
rovi
nce
223
/12/
2011
28.9
368
.33
5 M
34 k
mB
alu
chis
tan
Pro
vin
ce
311
/10/
2011
27.0
266
.59
4.9
M34
km
Bal
uch
ista
n P
rovi
nce
410
/8/2
011
27.7
65.0
45.
7 M
54 k
mB
alu
chis
tan
Pro
vin
ce
524
/07/
2011
28.2
666
.34
5 M
24 k
mB
alu
chis
tan
Pro
vin
ce
621
/06/
2011
35.0
475
.46
4.6
M64
km
No
rth
wes
tern
Kas
hm
ir
77/
6/20
1132
.76
71.8
4.7
M39
km
Pun
jab
Pro
vin
ce
825
/04/
2011
36.2
272
.17
5 M
98 k
mN
ort
h-w
est
Fro
nti
er P
rovi
nce
99/
2/20
1136
.32
73.3
4.8
M13
km
No
rth
wes
tern
Kas
hm
ir
1018
/01/
2011
28.7
763
.92
4.6
M60
km
Sou
thw
este
rn P
akis
tan
1118
/01/
2011
28.7
363
.92
7.2
M68
km
Sou
thw
este
rn P
akis
tan
127/
1/20
1127
.81
66.8
24.
6 M
34 k
mB
alu
chis
tan
Pro
vin
ce
134/
1/20
1127
.17
66.2
34.
6 M
31 k
mB
alu
chis
tan
Pro
vin
ce
Sri L
anka
119
/11/
2011
3.94
79.0
34.
7 M
10 k
mLa
ccad
ive
Sea

| 148 |
IntroductionA
pp
end
ix-V
B
Eart
hq
uak
e D
ata
of S
ou
th A
sia-
20
11
As
reco
rded
by
Ind
ian
Met
eoro
log
ical
Dep
artm
ent
(IMD
)
Dat
eLa
t(D
eg. N
)Lo
ng
(Deg
.E)
Dep
th(K
m)
Mag
nit
ud
eR
egio
n
26/0
1/20
1129
.0°N
77.2
°E10
3.2
Har
yan
a(D
istt
.So
nep
at)-
U.P
(Dis
tt.B
agh
pat
) Bo
rder
Reg
ion
27/0
1/20
1124
.3°N
94.4
°E75
4.6
May
anm
ar-I
nd
ia (M
anip
ur)
Bo
rder
Reg
ion
01/0
2/20
1123
.7°N
91.8
°E10
3.8
Trip
ura
01/0
2/20
1111
.3°N
93.8
°E33
5.3
Off
Eas
t C
oas
t O
f An
dam
an Is
lan
ds
04/0
2/20
1124
.8°N
94.6
°E72
6.4
May
anm
ar-I
nd
ia (M
anip
ur)
Bo
rder
Reg
ion
05/0
2/20
1116
.5°N
74.3
°E5
3.1
Kar
nat
ka (B
elg
aon
), M
ahar
ash
tra
(Ko
lhap
ur)
Bo
rder
Reg
ion
08/0
2/20
1122
.5°N
79.6
°E12
3.5
Seo
ni,
Mad
hya
Pra
des
h
09/0
2/20
1136
.1°N
73.6
°E15
5.0
No
rth
wes
tern
Kas
hm
ir
10/0
2/20
1109
.2°N
92.4
°E45
4.4
Car
Nic
ob
ar, N
ico
bar
Isla
nd
s
12/0
2/20
1123
.5°N
91.0
°E10
4.0
Ban
gla
des
h-I
nd
ia(T
rip
ura
)Bo
rder
Reg
ion
18/0
2/20
1128
.6°N
77.3
°E05
2.3
Del
hi
22/0
2/20
1124
.4°N
94.4
°E83
4.1
Mya
nm
ar-I
nd
ia(M
anip
ur)
Bo
rder
Reg
ion
26/0
2/20
1127
.5°N
75.6
°E10
3.0
Nim
Ka
Than
a ( D
istr
ict:S
ikar
), R
ajas
than
14/0
3/20
1130
.5°N
79.1
°E8
3.3
Ch
amo
li, U
ttar
akh
and
23/0
3/20
1136
.3°N
76.6
°E57
5.2
Ind
ia (J
amm
u &
Kas
hm
ir) -
Ch
ina
Bo
rder
Reg
ion
04/0
4/20
1129
.6°N
80.8
°E10
5.7
Nep
al In
dia
Bo
rder
Reg
ion
16/0
4/20
1118
.1°N
76.6
°E10
2.6
Latu
r Dis
t., M
ahar
ash
tra
26/0
4/20
1125
.5°N
92.5
°E70
4.3
Meg
hal
aya-
Ass
am B
ord
er R
egio
n
28/0
4/20
1133
.3°N
76.6
°E10
3.8
Him
ach
al-J
&K
Bo
rder
Reg
ion
29/0
4/20
1125
.9°N
94.7
°E10
4.3
Nag
alan
d
04/0
5/20
1130
.2°N
80.4
°E10
5.0
Ind
ia-N
epal
Bo
rder
Reg
ion
17/0
5/20
1123
.5°N
70.4
°E15
3.5
Kac
hch
h R
egio
n,G
uja
rat

South Asia DisasterReport 2011
| 149 |
Dat
eLa
t(D
eg. N
)Lo
ng
(Deg
.E)
Dep
th(K
m)
Mag
nit
ud
eR
egio
n
24/0
5/20
1125
.2°N
92.4
°E20
3.4
Meg
hal
aya,
Ind
ia
04/0
7/20
1129
.9°N
79.3
°E14
3.4
Ch
amo
li- A
lmo
ra D
ist.
Bo
rder
, Utt
arak
han
d
16/0
7/20
1109
.9°N
92.7
°E10
4.6
Nic
ob
ar Is
lan
ds,
Ind
ia
26/0
7/20
1109
.6°N
76.6
°E15
3.5
Ko
ttay
am -
Idu
kki D
ist
Bo
rder
Reg
ion
, Ker
ala
26/0
7/20
1109
.7°N
76.8
°E15
3.2
Ko
ttay
am -
Idu
kki D
ist
Bo
rder
Reg
ion
, Ker
ala
28/0
7/20
1125
.3°N
88.6
°E18
4.5
Ind
ia (
W.D
inaj
pu
r)-B
ang
lad
esh
Bo
rder
Reg
ion
28/0
7/20
1133
.3°N
76.0
°E21
4.4
Dis
tric
t K
ish
twar
, J &
K
09/0
8/20
1122
.8°N
86.5
°E5
3.4
W.B
.(Pu
ruliy
a) -
Jhar
khan
d(J
amsh
edp
ur)
Bo
rder
Reg
ion
12/0
8/20
1111
.1°N
79.1
°E33
3.5
Ari
yalu
r, Ta
mil
Nad
u
13/0
8/20
1123
.3°N
70.2
°E33
4.0
Kac
hch
h R
egio
n, G
uja
rat
28/0
8/20
1125
.9°N
69.8
°E15
3.5
Paki
stan
- In
dia
(Dis
tt. B
arm
er) B
ord
er R
egio
n
04/0
9/20
1125
.2°N
94.3
°E20
4.2
Ukh
rul,
Man
ipu
r
11/0
9/20
1123
.3°N
70.2
° E5
3.4
Kat
chch
h R
egio
n,G
uja
rat
18/0
9/20
1127
.7°N
88.2
°E10
6.8
Sikk
im--
Nep
al B
ord
er R
egio
n
18/0
9/20
1127
.6°N
88.5
°E16
5.0
Ind
ia(S
ikki
m)-
-Nep
al B
ord
er R
egio
n
18/0
9/20
1127
.5°N
88.4
°E9
4.5
Ind
ia(S
ikki
m)-
-Nep
al B
ord
er R
egio
n
18/0
9/20
1127
.6°N
88.4
°E28
4.2
Ind
ia(S
ikki
m)-
-Nep
al B
ord
er R
egio
n
19/0
9/20
1118
.0°N
76.7
°E05
3.9
Latu
r, M
ahar
ash
tra
21/0
9/20
1130
.9°N
78.3
°E10
3.1
Utt
arka
shi D
ist.,
Utt
aran
chal
22/0
9/20
1123
.7°N
94.9
°E12
84.
8M
yan
mar
22/0
9/20
1127
.6°N
88.4
°E30
3.9
Sikk
im
23/0
9/20
1124
.4°N
93.8
°E33
4.5
Imp
hal
24/0
9/20
1130
.9°N
78.3
°E10
3.0
Utt
arka
shi D
ist,
Utt
aran
chal
24/0
9/20
1134
.1°N
75.2
°E42
4.3
Jam
mu
& K
ash
mir,
Ind
ia
27/0
9/20
1136
.7°N
76.7
°E84
4.9
Ind
ia (
Jam
mu
& K
ash
mir
) - C
hin
a B
ord
er R
egio
n
28/0
9/20
1110
.9°N
94.5
°E10
4.7
An
dam
an S
ea
11/1
0/20
1128
.3°N
94.1
°E5
3.6
Aru
nac
hal
Pra
des
h, I
nd
ia
11/1
0/20
1113
.9°N
93.8
°E10
4.9
No
rth
An
dam
an S
ea

| 150 |
IntroductionD
ate
Lat(
Deg
. N)
Lon
g(D
eg.E
)D
epth
(Km
)M
agn
itu
de
Reg
ion
12/1
0/20
1128
.2°N
76.0
°E6
3.5
Raj
asth
an(J
hu
njh
un
un
Dis
t)-H
arya
na(
Mah
end
rag
arh
Dis
t)B
ord
er
Reg
ion
13/1
0/20
1124
.0°N
91.5
°E10
3.7
Ind
ia(T
rip
ura
)- B
ang
lad
esh
Bo
rder
Reg
ion
17/1
0/20
1127
.3°N
88.4
°E5
3.5
Sikk
im
19/1
0/20
1116
.5°N
79.0
°E7
3.6
Nal
go
nd
a - M
ahb
ub
nag
ar D
ist.
Bo
rder
Reg
ion
, A.P
.
20/1
0/20
1121
.2°N
70.7
°E10
5.3
Dis
tric
t Ju
nag
adh
, Gu
jara
t
21/1
0/20
1124
.8°N
94.0
°E36
4.5
Imp
hal
,Man
ipu
r
26/1
0/20
1131
.5°N
76.8
°E5
3.5
Man
di,
Him
ach
al P
rad
esh
28/1
0/20
1114
.5°S
75.9
°W35
6.9
Nea
r Th
e C
oas
t O
f Cen
tral
Per
u
29/1
0/20
1127
.4°N
88.4
°E5
3.5
Sikk
im, I
nd
ia
30/1
0/20
1126
.9°N
92.3
°E5
3.6
Ass
am-A
run
ach
al P
rad
esh
Bo
rder
Reg
ion
05/1
1/20
1121
.4°N
85.8
°E10
3.7
Ken
du
jhar
gar
h, O
riss
a
06/1
1/20
1130
.6°N
80.3
°E10
3.8
Ind
ia (U
ttra
khan
d) -
Ch
ina
Bo
rder
Reg
ion
08/1
1/20
1126
.3°N
90.6
°E15
3.7
Bar
pet
a, A
ssam
08/1
1/20
1124
.7°N
94.2
°E60
3.7
Ukh
rul,
Man
ipu
r
11/1
1/20
1126
.7°N
89.4
°E15
3.8
Jalp
aig
uri
, Wes
t B
eng
al
12/1
1/20
1121
.1°N
70.5
°E10
4.3
Jun
agad
h, G
uja
rat
20/1
1/20
1130
.4°N
78.7
°E33
3.2
Utt
arka
shi,
Utt
rakh
and
21/1
1/20
1125
.1°N
95.3
°E80
5.8
Mya
nm
ar-I
nd
ia B
ord
er ,R
egio
n
24/1
1/20
1128
.8°N
77.0
°E10
2.5
Del
hi -
Har
yan
a B
ord
er R
egio
n
25/1
1/20
119.
7°N
76.9
°E10
3.2
Idu
kki,
Ker
ala
02/1
2/20
1107
.9°N
94.0
°E40
5.4
Off
Eas
t C
oas
t O
f Nic
ob
ar Is
lan
ds
05/1
2/20
1112
.6°N
93.2
°E33
4.5
Off
Eas
t C
oas
t O
f An
dam
an Is
lan
ds
06/1
2/20
1112
.3°N
92.0
°E10
4.8
An
dam
an Is
lan
ds
08/1
2/20
1128
.5°N
77.0
°E05
2.6
Del
hi -
Har
yan
a( S
on
epat
) Bo
rder
Reg
ion
09/1
2/20
1127
.9°N
88.2
°E33
3.7
Ind
ia (
Sikk
im) -
Nep
al B
ord
er R
egio
n
12/1
2/20
1127
.3°N
92.6
°E33
3.4
Aru
nac
hal
Pra
des
h
13/1
2/20
1127
.3°N
88.6
°E5
2.9
Gan
gto
k,Si
kkim
13/1
2/20
1125
.2°N
91.5
°E20
3.5
Ind
ia(M
egh
alay
a)-B
ang
lad
esh
Bo
rder
Reg
ion

South Asia DisasterReport 2011
| 151 |
Dat
eLa
t(D
eg. N
)Lo
ng
(Deg
.E)
Dep
th(K
m)
Mag
nit
ud
eR
egio
n
14/1
2/20
1127
.7°N
88.0
°E50
4.5
Ind
ia(S
ikki
m) -
Nep
al B
ord
er R
egio
n
14/1
2/20
1130
.5°N
79.3
°E5
3.2
Dis
tt C
ham
oli,
Utt
rakh
and
15/1
2/20
1125
.7°N
94.1
°E10
3.4
Ind
ia (A
ssam
) - N
agal
and
Bo
rder
Reg
ion
18/1
2/20
1124
.1°N
94.3
°E70
3.5
Ind
ia-M
yan
mar
Bo
rder
Reg
ion
18/1
2/20
1128
.0°N
88.2
°E35
3.7
Ind
ia (S
ikki
m)-
Nep
al B
ord
er R
egio
n
30/1
2/20
1126
.5°N
92.8
°E10
3.6
Ass
am, I
nd
ia
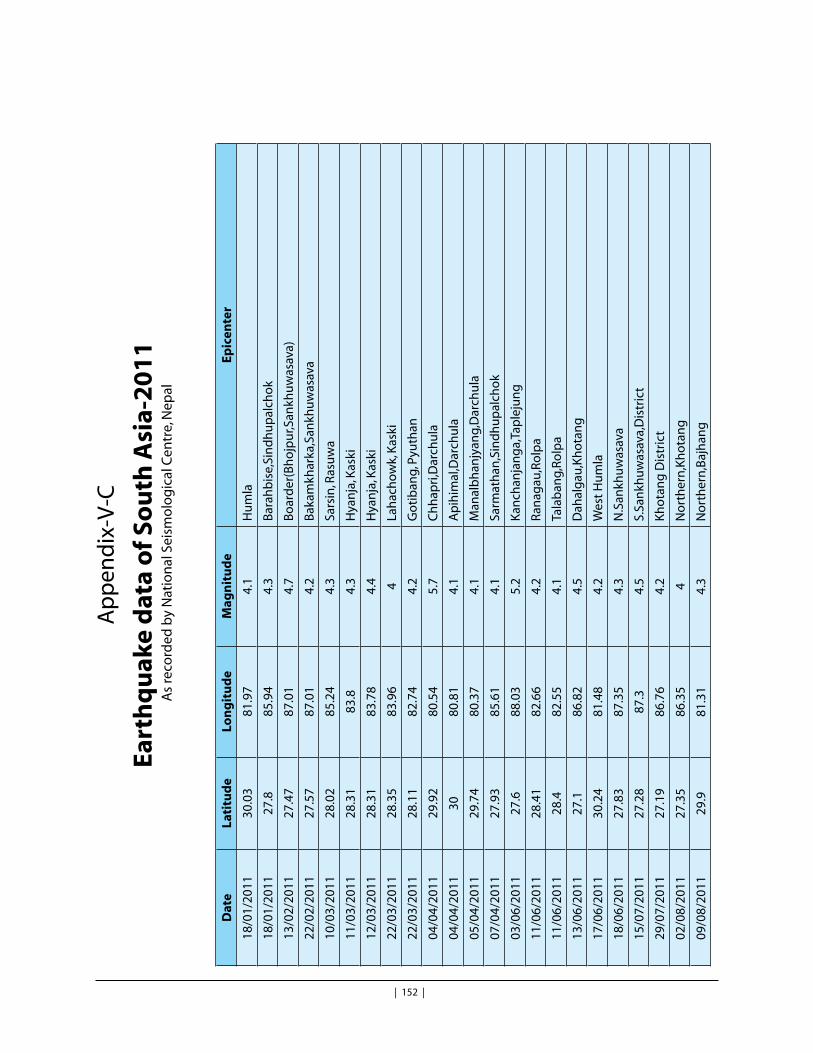
| 152 |
IntroductionA
pp
end
ix-V
-C
Eart
hq
uak
e d
ata
of S
ou
th A
sia-
20
11
As
reco
rded
by
Nat
ion
al S
eism
olo
gic
al C
entr
e, N
epal
Dat
eLa
titu
de
Lon
git
ud
eM
agn
itu
de
Epic
ente
r
18/0
1/20
1130
.03
81.9
74.
1H
um
la
18/0
1/20
1127
.885
.94
4.3
Bar
ahb
ise,
Sin
dh
up
alch
ok
13/0
2/20
1127
.47
87.0
14.
7B
oar
der
(Bh
ojp
ur,S
ankh
uw
asav
a)
22/0
2/20
1127
.57
87.0
14.
2B
akam
khar
ka,S
ankh
uw
asav
a
10/0
3/20
1128
.02
85.2
44.
3Sa
rsin
, Ras
uw
a
11/0
3/20
1128
.31
83.8
4.3
Hya
nja
, Kas
ki
12/0
3/20
1128
.31
83.7
84.
4H
yan
ja, K
aski
22/0
3/20
1128
.35
83.9
64
Lah
ach
ow
k, K
aski
22/0
3/20
1128
.11
82.7
44.
2G
oti
ban
g, P
yuth
an
04/0
4/20
1129
.92
80.5
45.
7C
hh
apri
,Dar
chu
la
04/0
4/20
1130
80.8
14.
1A
pih
imal
,Dar
chu
la
05/0
4/20
1129
.74
80.3
74.
1M
anal
bh
anjy
ang,
Dar
chu
la
07/0
4/20
1127
.93
85.6
14.
1Sa
rmat
han
,Sin
dh
up
alch
ok
03/0
6/20
1127
.688
.03
5.2
Kan
chan
jan
ga,
Tap
leju
ng
11/0
6/20
1128
.41
82.6
64.
2R
anag
au,R
olp
a
11/0
6/20
1128
.482
.55
4.1
Tala
ban
g,R
olp
a
13/0
6/20
1127
.186
.82
4.5
Dah
alg
au,K
ho
tan
g
17/0
6/20
1130
.24
81.4
84.
2W
est
Hu
mla
18/0
6/20
1127
.83
87.3
54.
3N
.San
khu
was
ava
15/0
7/20
1127
.28
87.3
4.5
S.Sa
nkh
uw
asav
a,D
istr
ict
29/0
7/20
1127
.19
86.7
64.
2K
ho
tan
g D
istr
ict
02/0
8/20
1127
.35
86.3
54
No
rth
ern
,Kh
ota
ng
09/0
8/20
1129
.981
.31
4.3
No
rth
ern
,Baj
han
g

South Asia DisasterReport 2011
| 153 |
Dat
eLa
titu
de
Lon
git
ud
eM
agn
itu
de
Epic
ente
r
15/0
8/20
1127
.44
86.2
75
East
,Ram
ech
hap
18/0
8/20
1128
.21
84.3
14
Du
rad
and
a,La
mju
ng
19/0
8/20
1129
.781
.34
4.9
Kan
gar
go
th, B
ajh
ang,
22/0
8/20
1128
.29
83.9
64
Lah
ach
ok,
Kas
ki
25/0
8/20
1128
.15
82.5
34.
4K
har
a, R
olp
a
27/0
8/20
1126
.94
86.6
4.2
Ud
ayap
ura
dh
i, U
day
apu
r
18/0
9/20
1127
.78
88.3
26.
8B
ord
er b
etw
een
Tap
leju
ng
& S
ikki
m
01/1
0/20
1130
.16
81.8
14.
7H
um
la
02/1
0/20
1129
.55
81.6
84.
2B
aju
ra
04/1
1/20
1128
.34
83.6
64
Parb
at
08/1
1/20
1127
.94
85.5
54.
1Si
nd
hu
pal
cho
wk
13/1
1/20
1128
.284
.93
5N
ort
hea
ster
n p
art
of G
ork
ha
19/1
1/20
1127
.786
.14.
1D
ola
kha
23/1
1/20
1128
.91
81.6
84.
2D
aile
kh
02/1
2/20
1128
.05
85.3
44.
2Sa
rsin
, Ras
uw
a
08/1
2/20
1127
.97
82.8
64
Pyu
than
09/1
2/20
1127
.83
88.1
34.
2N
ort
h o
f Tap
leju
ng
14/1
2/20
1127
.72
88.0
94.
9N
ort
h o
f Tap
leju
ng
18/1
2/20
1127
.73
88.1
64.
6N
ort
h o
f Tap
leju
ng
30/1
2/20
1129
.62
81.5
34
Baj
ura

| 154 |
IntroductionA
pp
end
ix-V
-D
Ear
thq
uak
e in
So
uth
Asi
a 2
00
1-2
01
1
SI
No
Loca
tio
n
Typ
e
Sub
-typ
e
Dat
e St
arti
ng
D
ate
End
ing
K
illed
To
t.
Aff
ecte
d
Est.
Dam
age
(US$
Mill
ion
)
Afg
han
ista
n
1Sa
mag
anEa
rth
qu
ake
( S
eism
ic A
ctiv
ity)
Eart
hq
uak
e(
Gro
un
d-s
hak
ing
)18
/04/
2010
18/0
4/20
1011
1070
2Sh
erza
d, H
esar
ak
( Nan
gar
h)
Eart
hq
uak
e
( Sei
smic
Act
ivit
y)Ea
rth
qu
ake(
G
rou
nd
-sh
akin
g)
17/0
4/20
0917
/04/
2009
2233
09
3Em
am S
ahib
( K
un
du
z D
istr
ict)
Eart
hq
uak
e
( Sei
smic
Act
ivit
y)Ea
rth
qu
ake
( G
rou
nd
-sh
akin
g)
29/0
7/20
0629
/07/
2006
193
5
4H
ind
uku
shEa
rth
qu
ake
( S
eism
ic A
ctiv
ity)
Eart
hq
uak
e (
Gro
un
d-s
hak
ing
)13
/12/
2005
13/1
2/20
055
501
5N
ang
arh
ar, J
alal
abad
Eart
hq
uak
e
( Sei
smic
Act
ivit
y)Ea
rth
qu
ake
( G
rou
nd
-sh
akin
g)
18/1
0/20
0518
/10/
2005
10.
05
6Pa
ktia
Pro
vin
ceEa
rth
qu
ake
( S
eism
ic A
ctiv
ity)
Eart
hq
uak
e (
Gro
un
d-s
hak
ing
)18
/07/
2004
18/0
7/20
042
1040
7Ya
kab
agh
(Ta
khar
Pr
ovin
ce)
Eart
hq
uak
e
( Sei
smic
Act
ivit
y)Ea
rth
qu
ake
( G
rou
nd
-sh
akin
g)
10/0
4/20
0310
/04/
2003
110
01
8D
awab
i, K
ho
jake
der
Eart
hq
uak
e
( Sei
smic
Act
ivit
y)Ea
rth
qu
ake
( G
rou
nd
-sh
akin
g)
12/0
4/20
0212
/04/
2002
5061
50
9N
ahri
n (
Bag
hla
n P
rov-
ince
)Ea
rth
qu
ake
( S
eism
ic A
ctiv
ity)
Eart
hq
uak
e (
Gro
un
d-s
hak
ing
)25
/03/
2002
25/0
3/20
0210
0091
228
10D
akh
li-Ez
eu (H
ind
u-
Kush
)Ea
rth
qu
ake
( Se
ism
ic A
ctiv
ity)
Eart
hq
uak
e (
Gro
un
d-s
hak
ing
)03
/03/
2002
03/0
3/20
0215
035
13
11Ja
bu
l Sar
aj, G
um
bah
arEa
rth
qu
ake
( S
eism
ic A
ctiv
ity)
Eart
hq
uak
e (
Gro
un
d-s
hak
ing
)01
/06/
2001
01/0
6/20
014
270

South Asia DisasterReport 2011
| 155 |
SI
No
Loca
tio
n
Typ
e
Sub
-typ
e
Dat
e St
arti
ng
D
ate
End
ing
K
illed
To
t.
Aff
ecte
d
Est.
Dam
age
(US$
Mill
ion
)
12Fa
izab
ad re
gio
n (B
ada-
khsh
)Ea
rth
qu
ake
( Se
ism
ic A
ctiv
ity)
Eart
hq
uak
e (
Gro
un
d-s
hak
ing
)25
/02/
2001
25/0
2/20
01
Ban
gla
des
h
1H
afu
n, G
arag
's, B
ari,
Kar
...
Eart
hq
uak
e (s
eis-
mic
act
ivit
y)Ts
un
ami
26/1
2/20
0426
/12/
2004
250
0
2C
hit
tag
on
g-C
ox's
B
azar
-Ra
...Ea
rth
qu
ake
( Se
ism
ic A
ctiv
ity)
Eart
hq
uak
e (
Gro
un
d-s
hak
ing
)27
/07/
2003
27/0
7/20
032
2525
Bh
uta
n
1Pa
ro –
Thim
ph
u R
egio
nEa
rth
qu
ake
( Se
ism
ic A
ctiv
ity)
Eart
hq
uak
e (
Gro
un
d-s
hak
ing
)18
/09/
2011
18/0
9/20
111
2001
6
2M
un
gaa
r, Ta
shig
ang
Eart
hq
uak
e (
Seis
mic
Act
ivit
y)Ea
rth
qu
ake
( G
rou
nd
-sh
akin
g)
21/0
9/20
0921
/09/
2009
1112
Ind
ia
1Si
kkim
, Wes
t B
eng
al,
Bih
arEa
rth
qu
ake
( Se
ism
ic A
ctiv
ity)
Eart
hq
uak
e (
Gro
un
d-s
hak
ing
)18
/09/
2011
18/0
9/20
1111
257
5200
2Ja
mm
u a
nd
Kas
hm
irEa
rth
qu
ake
(sei
s-m
ic a
ctiv
ity)
Eart
hq
uak
e (g
rou
nd
sh
akin
g)
08/1
0/20
0508
/10/
2005
1309
1566
2210
00
3Ta
mil
Nad
u s
tate
, An
da-
man
...
Eart
hq
uak
e (s
eis-
mic
act
ivit
y)Ts
un
ami
26/1
2/20
0426
/12/
2004
1638
965
4512
1022
.8
4A
nd
aman
Isl.
(Go
lfe d
u
Be
...Ea
rth
qu
ake
(sei
s-m
ic a
ctiv
ity)
Eart
hq
uak
e (g
rou
nd
sh
akin
g)
14/0
9/20
0214
/09/
2002
220
0
5K
ach
ch-B
hu
j, A
hm
ed-
abad
, R ..
.Ea
rth
qu
ake
(sei
s-m
ic a
ctiv
ity)
Eart
hq
uak
e (g
rou
nd
sh
akin
g)
26/0
1/20
0126
/01/
2001
2000
563
2181
226
23
Mal
div
es
1Ea
rth
qu
ake
(sei
s-m
ic a
ctiv
ity)
Tsu
nam
i26
/12/
2004
26/1
2/20
0410
227
214
470.
1
Nep
al
1Sa
nkh
uw
asb
ha,
Tap
le-
jun
gEa
rth
qu
ake
( Se
ism
ic A
ctiv
ity)
Eart
hq
uak
e
( Gro
un
d-s
hak
ing
)18
/09/
2011
18/0
9/20
117
1172
13

| 156 |
IntroductionSI
N
oLo
cati
on
Ty
pe
Su
b -t
ype
D
ate
Star
tin
g
Dat
e En
din
g
Kill
ed
Tot.
A
ffec
ted
Es
t. D
amag
e (U
S$ M
illio
n)
Pak
ista
n
1B
alo
chis
tan
Eart
hq
uak
e (
Seis
mic
Act
ivit
y)Ea
rth
qu
ake
( G
rou
nd
-sh
akin
g)
18/0
1/20
1118
/01/
2011
210
00
2K
han
ozai
, Ro
d, M
ula
zai
Eart
hq
uak
e (
Seis
mic
Act
ivit
y)Ea
rth
qu
ake
( G
rou
nd
-sh
akin
g)
29/1
0/20
0829
/10/
2008
166
7532
010
3B
agh
, Mu
zzaf
arab
ad,
Poo
nc
...Ea
rth
qu
ake
(sei
s-m
ic a
ctiv
ity)
Eart
hq
uak
e (g
rou
nd
sh
akin
g)
08/1
0/20
0508
/10/
2005
7333
851
2830
952
00
4B
atta
gra
m, M
anse
hra
, K
oh
i ...
Eart
hq
uak
e (s
eis-
mic
act
ivit
y)Ea
rth
qu
ake
(gro
un
d
shak
ing
)14
/02/
2004
14/0
2/20
0424
1314
8
5D
ash
kin
, Doy
an, H
arch
u,
K ..
.Ea
rth
qu
ake
(sei
s-m
ic a
ctiv
ity)
Eart
hq
uak
e (g
rou
nd
sh
akin
g)
21/1
1/20
0221
/11/
2002
1914
0782
6Ta
ta P
ani,
Mu
that
, R
aiko
t ...
Eart
hq
uak
e (s
eis-
mic
act
ivit
y)Ea
rth
qu
ake
(gro
un
d
shak
ing
)02
/11/
2002
02/1
1/20
0217
1506
5
7Ea
rth
qu
ake
(sei
s-m
ic a
ctiv
ity)
Eart
hq
uak
e (g
rou
nd
sh
akin
g)
26/0
1/20
0126
/01/
2001
1291
4292
0.5
SRI L
AN
KA
1Ea
rth
qu
ake
(sei
s-m
ic a
ctiv
ity)
Tsu
nam
i26
/12/
2004
26/1
2/20
0435
399
1019
306
1316
.5
Sour
ce- E
MD
AT a
cces
sed
on 0
1 M
AY 2
012

South Asia DisasterReport 2011
| 157 |
Ap
pen
dix
-VI-
A
Lan
dsl
ide
Even
ts in
So
uth
Asi
a20
11
Sl. N
o.Ty
pe
of D
isas
ter
Occ
urr
ence
D
ate
Rep
ort
ing
Dat
eLo
cati
on
Dea
ths
Inju
ries
Dam
age
& L
oss
Afg
han
ista
n
1 La
nd
slid
e/
Ro
ck
slid
e20
.02.
2011
21.0
2.20
11Ta
gab
Bes
t vi
llag
e o
f Jaw
and
dis
tric
t in
B
adg
his
pro
vin
ce
32
1La
nd
slid
e5.
04.2
011
7.04
.201
1Pa
rwaz
vill
age
of M
arm
al
dis
tric
t in
Bal
kh p
rovi
nce
Mo
re t
han
100
h
ou
ses
hav
e b
een
d
amag
ed
Ban
gla
des
h
1La
nd
slid
e/ E
arth
sl
ide
29.0
3.20
1130
.03.
2011
Shre
epu
r in
Gaz
ipu
r2
5
2La
nd
slid
e1.
07.2
011
3.07
.201
1B
atal
i hill
s, C
hit
tag
on
g17
3La
nd
slid
e9.
08.2
011
10-.0
8.20
11R
amja
di i
n B
and
arb
an2
2
4La
nd
slid
e/H
ill
slid
e14
.08.
2011
15-.0
8.20
11B
isw
a C
olo
ny
of P
ahar
tali
in C
hit
tag
on
g c
ity
22
5La
nd
slid
e22
.10.
2011
23.1
0.20
11D
han
mia
h P
ahar
are
a o
f R
ang
amat
i to
wn
11
6La
nd
slid
e/M
ud
sl
ide
7.12
.201
18.
12.2
011
Bijb
aru
a B
on
pu
r vill
age
nea
r Utm
a b
ord
er in
Co
m-
pan
ygan
j up
azila
1
Nep
al
1La
nd
slid
e04
.07.
2011
05.0
7.20
11K
aski
6
2La
nd
slid
e06
.07.
2011
07.0
7.20
11D
amau
li1
1
3La
nd
slid
e
15.0
7.20
11Ru
kum
13

| 158 |
IntroductionSl
. No.
Typ
e o
f Dis
aste
rO
ccu
rren
ce
Dat
eR
epo
rtin
g D
ate
Loca
tio
nD
eath
sIn
juri
esD
amag
e &
Lo
ss
4La
nd
slid
e20
.07.
2011
20.0
7.20
11K
aski
2
5La
nd
slid
e
02.0
8.20
11D
had
ing
30 c
attl
e h
erd
ers
mis
sin
g
6La
nd
slid
e03
.08.
2011
04.0
8.20
11R
olp
a3
2
7La
nd
slid
e13
.08.
2011
14.0
8.20
11C
hau
rikh
arka
-6 o
f So
-lu
khu
mb
u5
8La
nd
slid
e13
.08.
2011
14.0
8.20
11Po
khar
i Bh
anjy
ang
VD
C-1
Ta
nah
un
Dis
pla
ced
5 fa
mili
es
9La
nd
slid
e05
.09.
2011
07.0
9.20
11Ru
kum
7
10La
nd
slid
e14
.09.
2011
15.0
9.20
11A
cham
12
11La
nd
slid
e17
.09.
2011
17.0
9.20
11R
olp
a7
18
12La
nd
slid
e17
.09.
2011
18.0
9.20
11R
amec
hh
ap3
1
13La
nd
slid
e22
.09.
2011
23.0
9.20
11B
aglu
ng
514
14La
nd
slid
e18
.09.
2011
30.0
9.20
11G
ork
ha
Dis
pla
ced
12
fam
ilies
15La
nd
slid
e14
.10.
2011
15.1
0.20
11Jh
ula
VD
C1
16M
ud
slid
e15
.10.
2011
16.1
0.20
11Si
rah
a3
Pak
ista
n
1La
nd
slid
e05
.02.
2011
06.0
2.20
11K
arak
ora
n H
igh
way
, Bar
sin
Lan
dsl
ide
blo
ck K
ara-
kora
n H
igh
way
2La
nd
slid
e09
.02.
2011
10.0
2.20
11M
adra
za a
rea,
Ko
his
tan
Lan
dsl
ide
blo
ck K
ara-
kora
n H
igh
way
3La
nd
slid
e13
.02.
2011
14.0
2.20
11M
usl
im B
agh
2
Bo
th w
ere
Ch
ines
e n
atio
nal
s
4La
nd
slid
e
04.0
3.20
11Q
uet
ta1
2B
oth
wer
e C
hin
ese
nat
ion
als
5La
nd
slid
e11
.05.
2011
12.0
5.20
11G
ilgit
Blo
ck K
arak
ura
m
hig
hw
ay
6La
nd
slid
e30
.07.
2011
01.0
8.20
11G
ilgit
-Bal
tist
an
80
ho
use
s d
amag
ed
& 5
0 p
arti
ally
dam
-ag
ed

South Asia DisasterReport 2011
| 159 |
Sour
ce: D
ata
com
pile
d by
SD
MC
from
med
ia R
epor
ts&
EM
DAT
.
Sl. N
o.Ty
pe
of D
isas
ter
Occ
urr
ence
D
ate
Rep
ort
ing
Dat
eLo
cati
on
Dea
ths
Inju
ries
Dam
age
& L
oss
7La
nd
slid
e10
.10.
2011
10.1
0.20
11K
ahro
r Pak
ka, L
od
hra
n5
3
Sri L
anka
1La
nd
slid
e09
.01.
2011
09.0
1.20
11Th
alat
hu
oya
area
, R
ajas
-in
gh
a M
awat
ha,
Kan
dy
316
40 h
ou
ses
dam
aged
2La
nd
slid
e09
.01.
2011
11-1
0.01
.201
1K
and
y7
20
bu
ried
, bu
t o
nly
5 b
od
ies
reco
vere
d
3La
nd
slid
e/Ea
rth
sl
ip01
.02.
2011
04.0
2.20
11B
adu
lla1
4La
nd
slid
e08
.02.
2011
10.0
2.20
11Pu
nch
i Rat
tota
5 h
ou
ses
des
troy
ed

| 160 |
IntroductionA
pp
end
ix- V
IB
Ava
lan
che
Even
ts in
So
uth
Asi
a20
11
Sl.
No.
Typ
e o
f Dis
aste
rO
ccu
rren
ce
Dat
eR
epo
rtin
g D
ate
Loca
tio
nD
eath
sIn
juri
esD
amag
e &
Lo
ss
Afg
han
ista
n
1A
vala
nch
e8.
02.2
011
9.02
.201
1Sh
eeka
y d
istr
ict
of B
adak
hsh
an
pro
vin
ce1
2
2A
vala
nch
e
18.0
2.20
11Sa
ng
Tak
hat
dis
tric
t o
f Dai
-ku
nd
ee p
rovi
nce
235
7 re
sid
enti
al h
ou
ses
wer
e d
estr
oyed
Nep
al
1A
vala
nch
e24
.03.
2011
26.0
3.20
11La
ng
tan
g2
15
ho
use
s d
amag
ed
2A
vala
nch
e
06.0
6.20
11La
ng
tan
g2
1
Jap
anes
e
3A
vala
nch
e11
.11.
2011
12.1
1.20
11So
lukh
um
bh
u2
2
Ko
rean
nat
ion
als
Pak
ista
n
1A
vala
nch
e13
.02.
2011
14.0
2.20
11K
oh
ista
n3
7
2A
vala
nch
e20
.07.
2011
21.0
7.20
11La
kki M
arw
at
70
0 g
oat
die
d
3A
vala
nch
e
17.0
8.20
11Sk
ard
u
9
po
rter
bu
ried
Sour
ce: D
ata
com
pile
d by
SD
MC
from
med
ia R
epor
ts&
EM
DAT
.

South Asia DisasterReport 2011
| 161 |
Ap
pen
dix
-VII-
A
Epid
emic
s in
So
uth
Asi
a20
11
Co
un
try
Loca
tio
nTy
pe
Sub
Typ
eN
ame
Star
t E
nd
Kill
edTo
t. A
ffec
ted
Mal
div
es
Epid
emic
Vir
al In
fect
iou
s D
isea
ses
Den
gu
e00
/06/
2011
28/0
6/20
114
1289
Sri L
anka
Wes
tern
pro
vin
ceEp
idem
icV
iral
Infe
ctio
us
Dis
ease
sD
eng
ue
00/0
1/20
1102
/12/
2011
167
2634
3
So
urce
-EM
DAT
acc
esse
d on
3 S
epte
mbe
r 201
2

| 162 |
IntroductionA
pp
end
ix-V
II-B
Epid
emic
s in
So
uth
Asi
a-2
01
1 a
s co
mp
iled
by
Pro
MED
Co
un
try
Reg
ion
Loca
tio
nD
isea
seR
epo
rted
Dat
e (d
d/m
m/y
yyy)
Det
ails
Afg
han
ista
n
Afg
han
ista
nG
haz
ni
A
cute
dia
r-rh
oea
l syn
-d
rom
e
30/0
8/20
11A
s o
f 24
Au
g 2
011,
an
ou
tbre
ak o
f acu
te d
iarr
ho
ea re
po
rted
w
ith
mo
re t
han
100
0 ca
ses
in c
entr
al G
haz
ni p
rovi
nce
.
Afg
han
ista
n
A
cute
dia
r-rh
oea
l syn
-d
rom
e
16/0
2/20
11D
uri
ng
wee
k 52
in 2
010,
a to
tal o
f 10,
486
even
ts d
ue
to a
cute
d
iarr
ho
ea w
as r
epo
rted
.
Afg
han
ista
nZ
abu
l (Z
abo
l)
Ch
ole
ra23
/06/
2011
An
ou
tbre
ak o
f ch
ole
ra w
as re
po
rted
in s
ou
ther
n Z
abu
l pro
v-in
ce w
ith
84
case
s an
d 1
4 d
eath
s.
Afg
han
ista
nK
and
ahar
C
ho
lera
17/0
6/20
11A
n o
utb
reak
of c
ho
lera
was
rep
ort
ed in
So
uth
ern
Afg
han
i-st
an, w
ith
sev
eral
th
ou
san
d c
ases
rep
ort
ed in
Kan
dah
ar
Prov
ince
alo
ne.
80
per
cen
t o
f cas
es a
re c
hild
ren
un
der
five
.
Afg
han
ista
n
M
easl
es16
/02/
2011
104
susp
ecte
d c
ases
of m
easl
es w
ere
rep
ort
ed, o
f wh
ich
92
case
s w
ere
con
firm
ed b
y la
bo
rato
ry te
stin
g
Afg
han
ista
nB
alkh
M
enin
git
is16
/02/
2011
112
susp
ecte
d c
ases
of m
enin
git
is w
ere
rep
ort
ed fr
om
all
reg
ion
s. Th
e in
cid
ence
rate
was
hig
hes
t fr
om
Bal
kh.
Ban
gla
des
h
Ban
gla
des
hR
ajsh
ahi
A
nth
rax
24/0
8/20
1116
peo
ple
infe
cted
wit
h a
nth
rax
at K
hir
shin
Ban
gla
des
hK
hu
lna
Meh
erp
ur
dis
tric
tA
nth
rax
19/0
7/20
1139
peo
ple
wer
e in
fect
ed w
ith
an
thra
x in
Meh
erp
ur d
istr
ict,
Kh
uln
a.
Ban
gla
des
hPa
bn
a an
d S
iraj
gan
j
An
thra
x20
/06/
2011
As
of 1
7 Ju
n 2
011,
64
peo
ple
aff
ecte
d b
y th
e o
utb
reak
of
anth
rax.
Ban
gla
des
hPa
bn
a
An
thra
x8/
06/2
011
Thre
e p
eop
le w
ere
infe
cted
wit
h a
nth
rax
at S
hah
jad
pu
r U
paz
ila

South Asia DisasterReport 2011
| 163 |
Co
un
try
Reg
ion
Loca
tio
nD
isea
seR
epo
rted
Dat
e (d
d/m
m/y
yyy)
Det
ails
Ban
gla
des
hPa
bn
a
An
thra
x3/
06/2
011
As
of 3
1 M
ay 2
011,
39
peo
ple
wer
e af
fect
ed b
y cu
tan
eou
s an
thra
x in
Pab
na
du
e to
pro
cess
ing
mea
t o
f a s
ick
cow
.
Ban
gla
des
hPa
bn
a
An
thra
x16
/05/
2011
Thre
e p
eop
le in
fect
ed w
ith
an
thra
x in
Pab
na
dis
tric
t, in
clu
d-
ing
on
e d
eath
.
Ban
gla
des
hD
hak
a
Den
gu
e fe
ver
15/0
8/20
11A
su
dd
en in
crea
se in
den
gu
e ca
ses
hav
e b
een
rep
ort
ed in
D
hak
a ci
ty d
uri
ng
Ju
l- A
ug
201
1. A
s o
f 11
Au
g 2
011,
a to
tal o
f 47
3 ca
ses
hav
e b
een
rep
ort
ed.
Ban
gla
des
hLa
lmo
nir
hat
Ence
ph
alit
is7/
02/2
011
The
Inst
itu
te o
f Ep
idem
iolo
gy
Dis
ease
Co
ntr
ol a
nd
Res
earc
h
(IED
CR)
has
reve
aled
th
at t
he
cau
se o
f en
cep
hal
itis
cas
es in
R
ang
pu
r was
Nip
ah v
iru
s. A
s o
f 7 F
eb 2
011,
24
case
s an
d 1
7 d
eath
s h
ave
bee
n c
on
firm
ed.
Ban
gla
des
hR
ang
pu
rH
at-
iban
dh
aEn
cep
hal
itis
4/02
/201
1A
t le
ast
30 c
ases
of e
nce
ph
alit
is, i
ncl
ud
ing
17
dea
ths,
hav
e b
een
rep
ort
ed in
Ran
gp
ur.
Ban
gla
des
hD
hak
a, C
hu
adan
ga
and
Raj
shah
i
Influ
enza
A
(H5N
1)9/
09/2
011
A to
tal o
f 23,
889
com
mer
cial
farm
bir
ds
hav
e b
een
aff
ecte
d
by
the
late
st o
utb
reak
s o
f avi
an in
fluen
za (H
5N1)
in D
hak
a,
Ch
uad
ang
a an
d R
ajsh
ahi b
etw
een
21
Au
g 2
011
and
6 S
ep
2011
.
Ban
gla
des
hC
hu
adan
ga
In
fluen
za A
(H
5N1)
1/09
/201
1A
su
spec
ted
ou
tbre
ak o
f avi
an in
fluen
za A
(H5N
1) h
as b
een
re
po
rted
in B
ang
lad
esh
. As
man
y as
21,
590
hen
s w
ere
culle
d
at a
po
ult
ry fa
rm in
Ch
uad
ang
a.
Ban
gla
des
h
In
fluen
za A
(H
5N1)
26/0
7/20
11A
s o
f 21
Jul 2
011,
on
e th
ird
of t
he
cou
ntr
y's
farm
-rai
sed
ch
icke
ns
hav
e b
een
aff
ecte
d b
y th
e la
test
ou
tbre
ak o
f avi
an
influ
enza
(H5N
1). R
epo
rted
ly t
he
ou
tbre
aks
this
yea
r are
th
ree
tim
es h
igh
er t
han
th
e sa
me
per
iod
last
yea
r (20
10).
Ban
gla
des
hK
hu
lna
In
fluen
za A
(H
5N1)
8/07
/201
1C
om
mer
cial
po
ult
ry fa
rms
in K
hu
lna
pro
vin
ce h
ave
bee
n
affe
cted
by
avia
n in
fluen
za (H
5N1)
vir
us.
231
case
s w
ere
rep
ort
ed o
n 2
2 Ju
n 2
011
a to
tal o
f 869
bir
ds
wer
e cu
lled
.
Ban
gla
des
hD
hak
a
Influ
enza
A
(H5N
1)21
/04/
2011
A to
tal o
f 600
0 p
ou
ltry
bir
ds
wer
e cu
lled
an
d 2
9 00
0 eg
gs
dam
aged
du
e to
ou
tbre
ak o
f avi
an in
fluen
za v
iru
s (H
5N1)
at
Kas
had
a vi
llag
e, D
hak
a.
Ban
gla
des
hD
hak
a
Influ
enza
A
(H5N
1)12
/04/
2011
The
Wo
rld
Hea
lth
Org
aniz
atio
n h
as c
on
firm
ed t
he
seco
nd
h
um
an c
ase
of A
vian
Influ
enza
in B
ang
lad
esh
.

| 164 |
IntroductionC
ou
ntr
yR
egio
nLo
cati
on
Dis
ease
Rep
ort
ed D
ate
(dd
/mm
/yyy
y)D
etai
ls
Ban
gla
des
h
In
fluen
za A
(H
5N1)
18/0
3/20
11A
no
ther
cas
e o
f avi
an in
fluen
za h
as b
een
rep
ort
ed in
a 3
1 m
on
th-o
ld m
ale
fro
m D
hak
a o
n 1
5 M
ar 2
011.
Ban
gla
des
hD
hak
a
Influ
enza
A
(H5N
1)16
/03/
2011
A p
revi
ou
sly
rep
ort
ed h
um
an c
ase
of a
vian
influ
enza
in D
ha-
ka h
as b
een
co
nfir
med
by
hea
lth
au
tho
riti
es o
f Ban
gla
des
h.
Ban
gla
des
hD
hak
a
Influ
enza
A
(H5N
1)15
/03/
2011
A c
ase
of a
vian
influ
enza
A (H
5N1)
has
bee
n re
po
rted
in a
ch
ild fr
om
Dh
aka.
Ban
gla
des
hB
aris
al
Influ
enza
A
(H5N
1)8/
3/20
11O
utb
reak
s o
f avi
an in
fluen
za A
(H5N
1) h
ave
bee
n re
po
rted
in
Bar
isal
pro
vin
ce b
etw
een
16
- 17
Feb
201
1.
Ban
gla
des
hR
ajsh
ahi
Joyp
urh
at
and
C
hap
ain
-aw
abg
anj
dis
tric
ts
Influ
enza
A
(H5N
1)3/
3/20
11N
ew o
utb
reak
of a
vian
influ
enza
has
bee
n re
po
rted
Joy
-p
urh
at a
nd
Ch
apai
naw
abg
anj d
istr
icts
. At
leas
t 9,
065
po
ult
ry
wer
e cu
lled
an
d 1
0,23
5 eg
gs
des
troy
ed d
ue
to a
vian
influ
-en
za (H
5N1)
vir
us.
Ban
gla
des
hC
hit
tag
on
g, K
hu
lna,
R
ajsh
ahi a
nd
Syl
het
In
fluen
za A
(H
5N1)
18/0
2/20
11B
etw
een
31
Jan
an
d 1
7 Fe
b 2
011,
do
mes
tic
bir
ds
hav
e b
een
af
fect
ed b
y av
ian
influ
enza
(H5N
1) in
pro
vin
ces
of R
ajsh
ahi,
Ch
itta
go
ng,
Kh
uln
a an
d S
ylh
et.
Ban
gla
des
hD
hak
a an
d R
ang
pu
r
Influ
enza
A
(H5N
1)15
/02/
2011
Mo
re c
ases
of a
vian
influ
enza
H5N
1 h
ave
bee
n re
po
rted
in
po
ult
ry fa
rms
of D
hak
a an
d R
ang
pu
r bet
wee
n e
nd
of J
an
2011
an
d 5
Feb
201
1. A
s o
f 13
Feb
201
1, o
utb
reak
s h
ave
bee
n re
solv
ed.
Ban
gla
des
h
In
fluen
za A
(H
5N1)
4/2/
2011
A to
tal o
f 310
,678
cas
es o
f in
fluen
za A
H5N
1 h
ave
bee
n
rep
ort
ed in
bir
ds
thro
ug
ho
ut
the
cou
ntr
y.
Ban
gla
des
hD
hak
a
Influ
enza
A
(H5N
1)10
/1/2
011
On
1 J
an 2
011,
a n
ew o
utb
reak
of a
vian
influ
enza
A (H
5N1)
h
as b
een
rep
ort
ed in
Dh
aka.
530
cas
es/d
eath
s w
ere
rep
ort
ed
in c
om
mer
cial
po
ult
ry fa
rm.
Ban
gla
des
hB
and
arb
an
Mea
sles
3/05
/201
1A
n o
utb
reak
of m
easl
es h
as b
een
rep
ort
ed in
so
uth
-eas
tern
B
ang
lad
esh
. 200
cas
es a
nd
20
dea
ths
hav
e b
een
rep
ort
ed s
o
far.
Ban
gla
des
h
N
ipah
vir
al
dis
ease
28/0
2/20
11Th
e In
stit
ute
of E
pid
emio
log
y D
isea
se C
on
tro
l an
d R
esea
rch
(IE
DC
R) h
as c
on
firm
ed o
ne
mo
re d
eath
du
e to
nip
ah v
iru
s.
Ban
gla
des
h
N
ipah
vir
al
dis
ease
21/0
2/20
11Tw
o m
ore
pat
ien
ts h
ave
die
d d
ue
to n
ipah
en
cep
hal
itis
.

South Asia DisasterReport 2011
| 165 |
Co
un
try
Reg
ion
Loca
tio
nD
isea
seR
epo
rted
Dat
e (d
d/m
m/y
yyy)
Det
ails
Ban
gla
des
hD
inaj
pu
r, G
aib
and
ha,
Ku
rig
ram
, Ku
shti
a, L
al-
mo
nir
hat
, Nilp
ham
ari
and
Ran
gp
ur
N
ipah
vir
al
dis
ease
15/0
2/20
11A
cco
rdin
g to
med
ia re
po
rts,
Nip
ah e
nce
ph
alit
is h
ave
cau
sed
a
tota
l of 3
1 d
eath
s in
sev
en d
istr
icts
.
Ban
gla
des
hR
ang
pu
r an
d L
al-
mo
nir
hat
N
ipah
vir
al
dis
ease
7/02
/201
1Th
e In
stit
ute
of E
pid
emio
log
y D
isea
se C
on
tro
l an
d R
esea
rch
(IE
DC
R) h
as re
veal
ed t
hat
th
e ca
use
of e
nce
ph
alit
is c
ases
in
Ran
gp
ur w
as N
ipah
vir
us.
As
of 7
Feb
201
1, 2
4 ca
ses
and
17
dea
ths
hav
e b
een
co
nfir
med
.
Bh
uta
n
Bh
uta
nSa
mts
e
Rab
ies
25/0
2/20
11A
cat
has
bit
ten
sev
en p
eop
le in
Sam
tse
and
die
d t
her
eaft
er
wit
h s
usp
ecte
d ra
bie
s. A
ll p
erso
ns
bit
ten
by
the
cat
are
cur-
ren
tly
rece
ivin
g p
ost
-exp
osu
re ra
bie
s p
rop
hyl
axis
.
Ind
ia
Ind
iaPu
nja
b
Acu
te d
iar-
rho
eal s
yn-
dro
me
5/07
/201
146
cas
es o
f dia
rrh
oea
hav
e b
een
rep
ort
ed fr
om
th
e R
op
ar
city
in t
he
pas
t w
eek.
Th
e o
utb
reak
has
rep
ort
edly
bee
n
cau
sed
by
po
or q
ual
ity
wat
er s
up
plie
d to
th
e re
sid
ents
.
Ind
iaW
est
Ben
gal
A
cute
feb
rile
sy
nd
rom
e1/
08/2
011
Du
rin
g t
he
pas
t th
ree
wee
ks m
any
peo
ple
hav
e b
een
ho
s-p
ital
ized
wit
h h
igh
feve
r in
Jam
shed
pu
r cit
y. A
cco
rdin
g to
m
edia
rep
ort
s, th
ere
are
30,0
00 c
ases
of u
nd
iag
no
sed
feb
rile
ill
nes
ses
and
th
e n
um
ber
is in
crea
sin
g e
very
day
.
Ind
iaO
riss
a
An
thra
x17
/06/
2011
As
of 1
54 J
un
201
1, t
he
ou
tbre
ak h
as s
pre
ad to
ten
mo
re v
il-la
ges
of O
riss
a. T
he
anth
rax
has
so
far a
ffec
ted
25
per
son
s.
Ind
iaO
riss
a
An
thra
x13
/06/
2011
12 p
eop
le h
ave
bee
n a
ffec
ted
by
anth
rax
at G
uch
ua
villa
ge
in O
riss
a d
ue
to c
on
sum
pti
on
of r
ott
en b
eef a
nd
po
rk.
Ind
iaJa
mm
u a
nd
Kas
hm
irB
aram
ulla
d
istr
ict
Ch
icke
np
ox21
/07/
2011
At
leas
t th
ree
doz
en c
hild
ren
hav
e b
een
rep
ort
ed il
l du
e to
th
e o
utb
reak
of c
hic
ken
pox
in n
ort
h K
ash
mir
's B
aram
ulla
d
istr
ict.
Ind
iaG
oa
C
hik
un
gu
nya
vi
rus
infe
ctio
n15
/08/
2011
Fro
m J
an to
12
Au
g 2
011,
291
peo
ple
wer
e te
sted
for c
hik
un
-g
un
ya v
iru
s in
fect
ion
s, o
f wh
ich
39
wer
e p
osi
tive
.
Ind
iaJh
arkh
and
C
hik
un
gu
nya
vi
rus
infe
ctio
n5/
08/2
011
Am
on
g 3
2 b
loo
d s
amp
les
of v
iral
feve
r pat
ien
ts fr
om
Jam
-sh
edp
ur,
wh
ich
wer
e se
nt
to t
hre
e se
par
ate
rese
arch
cen
tres
in
Ind
ia, e
igh
t sa
mp
les
hav
e b
een
test
ed p
osi
tive
for c
hik
un
-g
un
ya v
iru
s.

| 166 |
IntroductionC
ou
ntr
yR
egio
nLo
cati
on
Dis
ease
Rep
ort
ed D
ate
(dd
/mm
/yyy
y)D
etai
ls
Ind
iaG
oa
C
hik
un
gu
nya
vi
rus
infe
ctio
n12
/01/
2011
In t
he
first
wee
k o
f Jan
201
1, 1
3 ca
ses
of c
hik
un
gu
nya
vir
us
has
bee
n re
po
rted
in G
oa.
Ind
iaM
ahar
ash
tra
C
ho
lera
15/0
8/20
11Fo
ur c
ases
of c
ho
lera
hav
e b
een
rep
ort
ed fr
om
Kas
turb
a H
osp
ital
in t
he
pas
t w
eek.
Ind
iaM
ahar
ash
tra
Mu
mb
aiC
ho
lera
5/08
/201
1O
ne
case
has
bee
n te
sted
po
siti
ve fo
r ch
ole
ra in
Mu
mb
ai.
Ther
e h
as b
een
a 2
5 p
er c
ent
incr
ease
in t
he
nu
mb
er o
f dia
r-rh
oea
cas
es a
mo
ng
ch
ildre
n t
his
yea
r.
Ind
iaG
uja
rat
Sara
jC
ho
lera
12/0
7/20
11A
s o
f 8 J
uly
201
1 66
cas
es o
f ch
ole
ra h
ave
bee
n re
po
rted
.
Ind
iaM
ahar
ash
tra
Mu
mb
aiC
ho
lera
5/07
/201
1Tw
o s
usp
ecte
d c
ases
of c
ho
lera
hav
e b
een
rep
ort
ed in
ch
ildre
n fr
om
Mu
mb
ai.
Ind
iaK
eral
aW
ayan
ad
dis
tric
tC
ho
lera
5/07
/201
111
4 p
eop
le h
ave
bee
n a
dm
itte
d in
th
e se
vera
l ho
spit
als
in
Way
anad
dis
tric
t w
ith
sym
pto
ms
of c
ho
lera
.
Ind
iaH
arya
na
Yam
u-
nan
agar
d
istr
ict.
Ch
ole
ra19
/04/
2011
As
of 5
Ap
r 201
1, 2
6 ca
ses
hav
e b
een
rep
ort
ed in
th
ree
vi
llag
es o
f Yam
un
a n
agar
dis
tric
t.
Ind
iaM
ahar
ash
tra
Pun
eC
ho
lera
31/0
1/20
11Tw
o c
ases
of c
ho
lera
hav
e b
een
rep
ort
ed in
Pu
ne.
Ind
iaM
ahar
ash
tra
C
ho
lera
19/0
1/20
1112
cas
es o
f ch
ole
ra h
ave
bee
n re
po
rted
in c
hild
ren
of
Mu
mb
ai c
ity.
In t
he
pas
t tw
o w
eeks
an
oth
er 2
00 p
eop
le h
ave
sou
gh
t m
edic
al t
reat
men
t w
ith
dia
rrh
oea
.
Ind
iaG
uja
rat
Meh
san
a d
istr
ict
Cri
mea
n
Co
ng
o h
aem
-o
rrh
agic
feve
r
31/0
5/20
1142
peo
ple
wh
o h
ad c
om
e in
co
nta
ct w
ith
a d
ecea
sed
pat
ien
t w
ith
Cri
mea
n-C
on
go
hem
orr
hag
ic fe
ver (
CC
HF)
are
un
der
su
rvei
llan
ce in
Meh
san
a d
istr
ict.
Ind
iaG
uja
rat
Ah
med
-ab
adC
rim
ean
C
on
go
hae
m-
orr
hag
ic fe
ver
1/03
/201
1A
s o
f 10
Feb
201
1, o
ut
of 2
98 b
loo
d s
amp
les
of c
ases
/co
n-
tact
s se
nt
for l
abo
rato
ry te
stin
g, n
ine
sam
ple
s h
ave
bee
n
test
ed p
osi
tive
for C
rim
ean
Co
ng
o h
aem
orr
hag
ic fe
ver
(CC
HF)
, in
clu
din
g fo
ur d
eath
s.
Ind
iaG
uja
rat
Ah
-m
edeb
adC
rim
ean
C
on
go
hae
m-
orr
hag
ic fe
ver
1/02
/201
1A
25
year
old
mal
e d
oct
or h
as b
eco
me
the
4th
vic
tim
to d
ie
of C
CH
F. H
e w
as a
n in
tern
at
a g
over
nm
ent
ho
spit
al. I
t is
no
t cl
ear w
het
her
he
had
co
nta
ct w
ith
th
e p
revi
ou
s vi
ctim
s
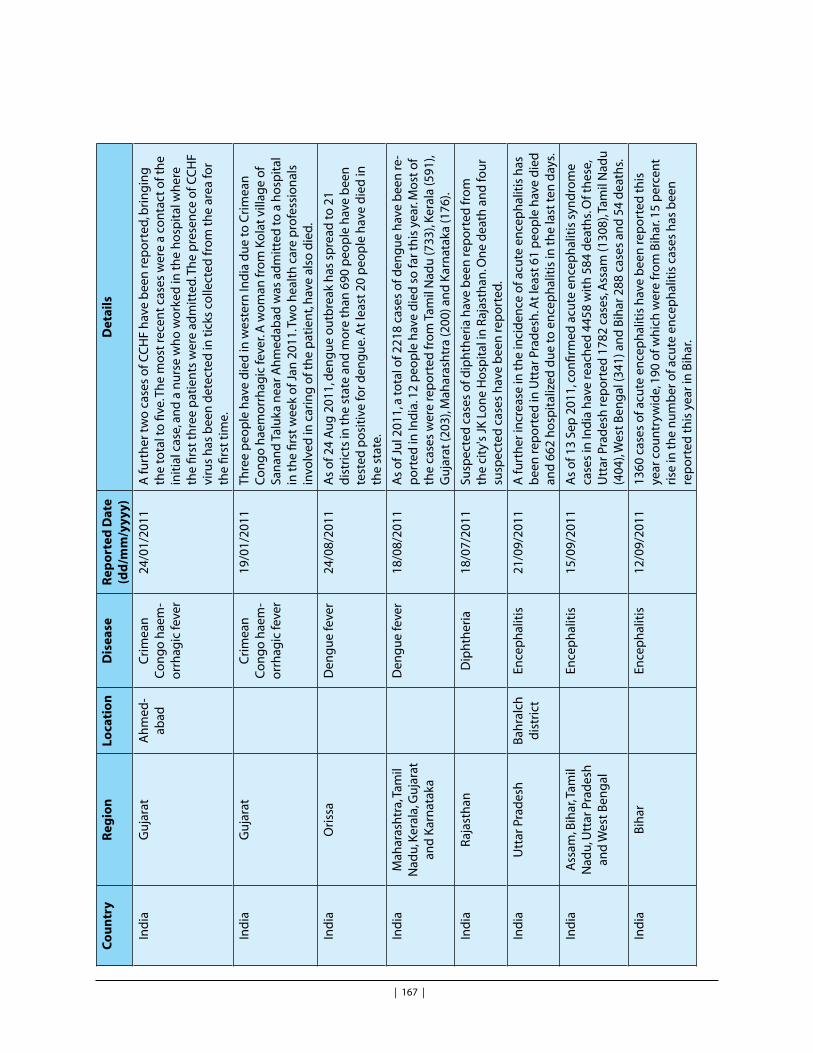
South Asia DisasterReport 2011
| 167 |
Co
un
try
Reg
ion
Loca
tio
nD
isea
seR
epo
rted
Dat
e (d
d/m
m/y
yyy)
Det
ails
Ind
iaG
uja
rat
Ah
med
-ab
adC
rim
ean
C
on
go
hae
m-
orr
hag
ic fe
ver
24/0
1/20
11A
furt
her
tw
o c
ases
of C
CH
F h
ave
bee
n re
po
rted
, bri
ng
ing
th
e to
tal t
o fi
ve. T
he
mo
st re
cen
t ca
ses
wer
e a
con
tact
of t
he
init
ial c
ase,
an
d a
nu
rse
wh
o w
ork
ed in
th
e h
osp
ital
wh
ere
the
first
th
ree
pat
ien
ts w
ere
adm
itte
d. T
he
pre
sen
ce o
f CC
HF
viru
s h
as b
een
det
ecte
d in
tic
ks c
olle
cted
fro
m t
he
area
for
the
first
tim
e.
Ind
iaG
uja
rat
C
rim
ean
C
on
go
hae
m-
orr
hag
ic fe
ver
19/0
1/20
11Th
ree
peo
ple
hav
e d
ied
in w
este
rn In
dia
du
e to
Cri
mea
n
Co
ng
o h
aem
orr
hag
ic fe
ver.
A w
om
an fr
om
Ko
lat
villa
ge
of
San
and
Tal
uka
nea
r Ah
med
abad
was
ad
mit
ted
to a
ho
spit
al
in t
he
first
wee
k o
f Jan
201
1. T
wo
hea
lth
car
e p
rofe
ssio
nal
s in
volv
ed in
car
ing
of t
he
pat
ien
t, h
ave
also
die
d.
Ind
iaO
riss
a
Den
gu
e fe
ver
24/0
8/20
11A
s o
f 24
Au
g 2
011,
den
gu
e o
utb
reak
has
sp
read
to 2
1 d
istr
icts
in t
he
stat
e an
d m
ore
th
an 6
90 p
eop
le h
ave
bee
n
test
ed p
osi
tive
for d
eng
ue.
At
leas
t 20
peo
ple
hav
e d
ied
in
the
stat
e.
Ind
iaM
ahar
ash
tra,
Tam
il N
adu,
Ker
ala,
Gu
jara
t an
d K
arn
atak
a
D
eng
ue
feve
r18
/08/
2011
As
of J
ul 2
011,
a to
tal o
f 221
8 ca
ses
of d
eng
ue
hav
e b
een
re-
po
rted
in In
dia
. 12
peo
ple
hav
e d
ied
so
far t
his
yea
r. M
ost
of
the
case
s w
ere
rep
ort
ed fr
om
Tam
il N
adu
(733
), K
eral
a (5
91),
Gu
jara
t (2
03),
Mah
aras
htr
a (2
00) a
nd
Kar
nat
aka
(176
).
Ind
iaR
ajas
than
D
iph
ther
ia18
/07/
2011
Susp
ecte
d c
ases
of d
iph
ther
ia h
ave
bee
n re
po
rted
fro
m
the
city
's J
K L
on
e H
osp
ital
in R
ajas
than
. On
e d
eath
an
d fo
ur
susp
ecte
d c
ases
hav
e b
een
rep
ort
ed.
Ind
iaU
ttar
Pra
des
hB
ahra
lch
d
istr
ict
Ence
ph
alit
is21
/09/
2011
A fu
rth
er in
crea
se in
th
e in
cid
ence
of a
cute
en
cep
hal
itis
has
b
een
rep
ort
ed in
Utt
ar P
rad
esh
. At
leas
t 61
peo
ple
hav
e d
ied
an
d 6
62 h
osp
ital
ized
du
e to
en
cep
hal
itis
in t
he
last
ten
day
s.
Ind
iaA
ssam
, Bih
ar, T
amil
Nad
u, U
ttar
Pra
des
h
and
Wes
t B
eng
al
En
cep
hal
itis
15/0
9/20
11A
s o
f 13
Sep
201
1, c
on
firm
ed a
cute
en
cep
hal
itis
syn
dro
me
case
s in
Ind
ia h
ave
reac
hed
445
8 w
ith
584
dea
ths.
Of t
hes
e,
Utt
ar P
rad
esh
rep
ort
ed 1
782
case
s, A
ssam
(130
8), T
amil
Nad
u
(404
), W
est
Ben
gal
(341
) an
d B
ihar
288
cas
es a
nd
54
dea
ths.
Ind
iaB
ihar
En
cep
hal
itis
12/0
9/20
1113
60 c
ases
of a
cute
en
cep
hal
itis
hav
e b
een
rep
ort
ed t
his
ye
ar c
ou
ntr
ywid
e, 1
90 o
f wh
ich
wer
e fr
om
Bih
ar. 1
5 p
erce
nt
rise
in t
he
nu
mb
er o
f acu
te e
nce
ph
alit
is c
ases
has
bee
n
rep
ort
ed t
his
yea
r in
Bih
ar.

| 168 |
IntroductionC
ou
ntr
yR
egio
nLo
cati
on
Dis
ease
Rep
ort
ed D
ate
(dd
/mm
/yyy
y)D
etai
ls
Ind
iaU
ttar
Pra
des
h, B
ihar
an
d N
agal
and
En
cep
hal
itis
22/0
8/20
11C
ases
of a
cute
en
cep
hal
itis
an
d J
apan
ese
ence
ph
alit
is (J
E)
con
tin
ue
to b
e re
po
rted
wid
ely
in n
ort
hea
ster
n In
dia
. A to
tal
of 8
91 c
ases
wit
h 1
48 d
eath
s h
ave
bee
n re
po
rted
in U
ttar
Pr
ades
h, 1
50 c
ases
an
d 5
5 d
eath
s in
Bih
ar s
tate
. As
of 1
9 A
ug
201
1, 2
3 ca
ses
wer
e re
po
rted
fro
m N
agal
and
wit
h fi
ve
dea
ths.
Ind
iaU
ttar
Pra
des
hG
ora
kh-
pu
r an
d
Kush
i-n
agar
d
istr
icts
Ence
ph
alit
is20
/07/
2011
Sin
ce t
he
beg
inn
ing
of t
he
year
a to
tal o
f 626
peo
ple
hav
e b
een
ad
mit
ted
to h
osp
ital
wit
h s
ymp
tom
s o
f en
cep
hal
itis
. Of
thes
e 10
1 w
ere
susp
ecte
d J
apan
ese
ence
ph
alit
is. G
ora
khp
ur
and
Ku
shin
agar
are
th
e w
ors
t af
fect
ed d
istr
icts
.
Ind
iaA
ssam
Siva
sag
ar
dis
tric
tEn
cep
hal
itis
22/0
7/20
1151
peo
ple
hav
e d
ied,
an
d 2
26 o
ther
s h
ave
bee
n a
ffec
ted
by
ence
ph
alit
is a
nd
alli
ed d
isea
ses
in A
ssam
sin
ce J
uly
201
1. O
f th
e 51
dea
ths,
31 w
ere
Jap
anes
e en
cep
hal
itis
cas
es. S
ivas
agar
d
istr
ict
is t
he
wo
rst
affe
cted
wit
h 1
00 c
ases
an
d 2
1 d
eath
s.
Ind
iaA
nd
hra
Pra
des
hG
ora
-kh
pu
r, D
eori
a,
Kush
ina-
gar
, Bas
ti,
Sid
dh
ar-
than
agar
, Sa
nt
Kab
ir N
a-g
ar a
nd
M
ahar
aj-
gan
j.
Ence
ph
alit
is7/
7/20
11In
crea
sed
nu
mb
er o
f cas
es o
f acu
te e
nce
ph
alit
is a
nd
Jap
a-n
ese
ence
ph
alit
is (J
E) h
as b
een
rep
ort
ed in
Utt
ar P
rad
esh
co
mp
ared
to p
revi
ou
s ye
ar. A
s o
f 5 J
ul 2
011,
th
ere
wer
e 45
0 ca
ses
of a
cute
en
cep
hal
itis
syn
dro
me
wit
h 7
7 d
eath
s. Th
ere
are
20 J
E ca
ses
wit
h t
hre
e d
eath
s. Th
e w
ors
t af
fect
ed d
istr
icts
b
y ac
ute
en
cep
hal
itis
, are
Go
rakh
pu
r wit
h 1
11 c
ases
an
d 2
1 d
eath
s, fo
llow
ed b
y D
eori
a (1
09 c
ases
an
d 1
5 d
eath
s) a
nd
Ku
shin
agar
(103
cas
es a
nd
22
dea
ths)
. JE
case
s h
ave
also
b
een
rep
ort
ed fr
om
th
ese
thre
e d
istr
icts
alo
ng
wit
h B
asti
, Si
dd
har
than
agar
, San
t K
abir
Nag
ar a
nd
Mah
araj
gan
j.
Ind
iaB
ihar
En
cep
hal
itis
22/0
6/20
11A
s o
f 20
Jun
201
1, t
he
nu
mb
er o
f dea
ths
has
incr
ease
d to
26
. Jap
anes
e en
cep
hal
itis
vir
us
is t
he
susp
ecte
d c
ause
of t
he
ou
tbre
ak.
Ind
iaB
ihar
Mu
zaf-
farp
ur
dis
tric
t
Ence
ph
alit
is20
/06/
2011
30 c
hild
ren
hav
e b
een
ad
mit
ted
to h
osp
ital
s in
Bih
ar w
ith
ac
ute
en
cep
hal
itis
an
d 1
7 h
ave
die
d in
th
e p
ast
two
wee
ks.

South Asia DisasterReport 2011
| 169 |
Co
un
try
Reg
ion
Loca
tio
nD
isea
seR
epo
rted
Dat
e (d
d/m
m/y
yyy)
Det
ails
Ind
iaJh
arkh
and
Fo
od
po
iso
n-
ing
21/0
4/20
1149
cas
es o
f fo
od
po
iso
nin
g h
ave
bee
n re
po
rted
in J
har
-ka
nd
sta
te. S
avo
ry s
nac
ks (c
haa
t) fr
om
a ro
adsi
de
ven
do
r at
Dh
okh
ara
villa
ge,
hav
e b
een
imp
licat
ed in
th
e cu
rren
t o
utb
reak
.
Ind
iaD
elh
i
Foo
d p
ois
on
-in
g11
/4/2
011
Mo
re t
han
300
peo
ple
wer
e b
ein
g t
reat
ed in
ho
spit
als
acro
ss
Del
hi a
nd
on
e p
erso
n h
as d
ied
du
e to
co
nsu
mp
tio
n o
f ad
ul-
tera
ted
bu
ckw
hea
t. Th
e b
uck
wh
eat
has
bee
n d
istr
ibu
ted
in
east
an
d n
ort
hea
st D
elh
i.
Ind
iaM
ahar
ash
tra
H
and,
foo
t an
d
mo
uth
dis
ease
4/1/
2011
Cas
es o
f han
d, fo
ot
and
mo
uth
dis
ease
(HFM
D) h
as b
een
re
po
rted
in c
hild
ren
fro
m N
agp
ur c
ity,
Mah
aras
htr
a st
ate.
Ind
iaPu
nja
b
Hep
atit
is (u
n-
spec
ified
)17
/01/
2011
354
case
s o
f hep
atit
is h
ave
bee
n re
po
rted
in B
ath
ind
a to
wn
, Pu
nja
b. T
he
infe
ctio
n s
ou
rce
is c
urr
entl
y b
ein
g in
vest
igat
ed.
Ind
iaPu
nja
bC
han
di-
gar
hH
epat
itis
A7/
7/20
11A
n in
crea
se in
hep
atit
is A
cas
e h
as b
een
rep
ort
ed in
Ch
an-
dig
arh
du
e to
co
nta
min
ated
wat
er. C
ity-
bas
ed h
osp
ital
s ar
e re
po
rtin
g 5
0 ca
ses
of t
he
viru
s d
aily
.
Ind
iaK
eral
a
Hep
atit
is B
9/9/
2011
Alu
va a
nd
Par
avo
or d
istr
icts
hav
e re
po
rted
su
spec
ted
cas
es
of H
epat
itis
B.
Ind
iaTa
mil
Nad
uC
hen
nai
Hep
atit
is B
29/0
7/20
11A
t le
ast
on
e in
eve
ry 2
5 p
eop
le li
vin
g in
no
rth
Ch
enn
ai h
ave
test
ed p
osi
tive
for h
epat
itis
. A ra
nd
om
scr
een
ing
of 1
297
peo
ple
in s
ix d
iffer
ent
loca
tio
ns
of N
ort
h C
hen
nai
by
the
Mad
ras
Med
ical
Co
lleg
e sh
ow
ed 6
1 o
f th
em p
osi
tive
for
hep
atit
is. O
f th
ese,
44
wer
e p
osi
tive
for h
epat
itis
B.
Ind
iaPu
nja
b
Hep
atit
is C
26/0
7/20
11In
th
e vi
llag
e o
f Mar
hi M
egh
a, m
ore
th
an fo
ur c
ases
ofh
epat
i-ti
s C
hav
e b
een
rep
ort
ed w
ith
in a
sh
ort
per
iod
of t
ime.
Ind
iaW
est
Ben
gal
In
fluen
za A
(H
5N1)
20/0
9/20
11O
n 1
4 Se
p 2
011,
an
ou
tbre
ak o
f avi
an in
fluen
za o
utb
reak
has
b
een
rep
ort
ed in
rura
l bac
kyar
d p
ou
ltry
in W
est
Ben
gal
. A
tota
l of 2
285
case
s w
ith
849
dea
ths
rep
ort
ed.
Ind
iaA
ssam
In
fluen
za A
(H
5N1)
9/09
/201
1O
n 2
9 A
ug
201
1, a
n o
utb
reak
of a
vian
influ
enza
H5N
1 h
as
bee
n re
po
rted
in a
rura
l bac
kyar
d p
ou
ltry
. A to
tal o
f 143
6 b
ird
s h
ave
bee
n a
ffec
ted
.

| 170 |
IntroductionC
ou
ntr
yR
egio
nLo
cati
on
Dis
ease
Rep
ort
ed D
ate
(dd
/mm
/yyy
y)D
etai
ls
Ind
iaTr
ipu
raA
gar
tala
d
istr
ict
Influ
enza
A
(H5N
1)23
/03/
2011
New
cas
es o
f avi
an in
fluen
za c
on
tin
ue
to b
e re
po
rted
in
Trip
ura
. Sin
ce 4
Mar
201
1, a
tota
l of 1
0,55
0 su
spec
ted
cas
es
hav
e b
een
rep
ort
ed in
Ag
arta
la p
ou
ltry
farm
, of w
hic
h 3
80
hav
e b
een
lab
ora
tory
co
nfir
med
cas
es.
Ind
iaTr
ipu
ra
Influ
enza
A
(H5N
1)8/
03/2
011
Sin
ce 1
Mar
201
1, fr
esh
cas
es o
f avi
an in
fluen
za h
ave
bee
n
rep
ort
ed in
th
e G
and
hi G
ram
gov
ern
men
t p
ou
ltry
farm
, w
este
rn T
rip
ura
.
Ind
iaTr
ipu
ra
Influ
enza
A
(H5N
1)18
/02/
2011
On
16
Feb
201
1, In
dia
n h
ealt
h a
uth
ori
ties
hav
e re
po
rted
an
ou
tbre
ak o
f avi
an in
fluen
za in
a p
ou
ltry
an
d d
uck
farm
lo
cate
d in
Tri
pu
ra s
tate
.
Ind
iaH
arya
na
Ja
pan
ese
ence
ph
alit
is12
/10/
2010
348
case
s o
f Jap
anes
e en
cep
hal
itis
hav
e b
een
rep
ort
ed.
Ind
iaK
arn
atak
a
Kyas
anu
r fo
r-es
t d
isea
se31
/05/
2011
11 c
ases
of t
ick-
bo
rne
vira
l fev
er (K
yasa
nu
r fo
rest
dis
ease
) h
ave
bee
n re
po
rted
in S
him
og
a.
Ind
iaB
ihar
Le
ish
man
iasi
s - v
isce
ral (
Kal
a A
zar)
22/0
7/20
11A
tota
l of 1
1,74
8 p
eop
le h
ave
bee
n t
reat
ed fo
r Kal
a A
zar i
r B
ihar
so
far t
his
yea
r. 32
peo
ple
hav
e d
ied
.
Ind
iaG
uja
rat
Vals
ad
and
-N
avsa
ri
dis
tric
ts
Lep
tosp
iro
sis
30/0
8/20
11Th
ere
has
bee
n a
n in
crea
se in
lep
tosp
iro
sis
case
s in
Gu
jara
t w
ith
a to
tal o
f 228
cas
es a
nd
46
dea
ths.
The
dis
ease
was
re-
po
rted
for t
he
first
tim
e w
ith
in c
ity
limit
s in
so
uth
Gu
jara
t as
it
sp
read
s m
ost
ly in
rura
l are
as. T
he
mo
st re
cen
t d
eath
s w
ere
rep
ort
ed fr
om
Val
sad
an
d N
avsa
ri d
istr
icts
.
Ind
iaK
arn
atak
a
Lep
tosp
iro
sis
11/7
/201
1Th
e fir
st e
ver c
ase
of l
epto
spir
osi
s h
as b
een
rep
ort
ed fr
om
th
e B
elg
aum
dis
tric
t. Th
e in
div
idu
al is
rece
ivin
g t
reat
men
t in
h
osp
ital
.
Ind
iaH
arya
na
Yam
u-
nan
agar
d
istr
ict.
Mal
aria
2/9/
2011
An
ou
tbre
ak o
f mal
aria
has
bee
n re
po
rted
in Y
amu
na
Nag
ar
dis
tric
t. 29
00 m
alar
ia c
ases
hav
e b
een
rep
ort
ed in
th
e p
ast
on
e m
on
th.
Ind
iaD
elh
i
Mal
aria
20/0
7/20
11A
n o
utb
reak
of m
alar
ia h
as b
een
rep
ort
ed in
Del
hi w
ith
53
case
s, w
hile
on
ly 1
3 ca
ses
rep
ort
ed in
th
e sa
me
per
iod
last
ye
ar (2
010)
.

South Asia DisasterReport 2011
| 171 |
Co
un
try
Reg
ion
Loca
tio
nD
isea
seR
epo
rted
Dat
e (d
d/m
m/y
yyy)
Det
ails
Ind
iaA
nd
hra
Pra
des
hH
yder
-ab
adM
alar
ia20
/06/
2011
As
of 1
9 Ju
n 2
011,
145
cas
es o
f mal
aria
hav
e b
een
rep
ort
ed
in H
yder
abad
. Th
e h
igh
est
nu
mb
ers
of c
ases
hav
e b
een
re-
po
rted
fro
m B
anja
ra H
ills
and
Bh
ola
kpu
r in
Mu
shee
rab
ad.
Ind
iaM
ahar
ash
tra
M
alar
ia2/
6/20
11A
n in
crea
se in
mal
aria
cas
es h
as b
een
rep
ort
ed in
Mah
aras
h-
tra
stat
e. F
rom
Jan
to A
pr 2
011,
28,
400
case
s h
ave
bee
n re
-p
ort
ed in
th
e st
ate,
co
mp
ared
wit
h 2
0,09
1 ca
ses
for t
he
sam
e p
erio
d in
201
0. T
he
hig
hes
t in
cid
ence
has
bee
n re
po
rted
in
Mu
mb
ai w
ith
16,
833
case
s an
d 1
1 d
eath
s, fo
llow
ed b
y Th
ane
(709
cas
es) a
nd
Kal
yan
(182
cas
es).
Ind
iaM
ahar
ash
tra
Mu
mb
aiM
alar
ia7/
4/20
1118
5 p
eop
le a
re re
po
rted
to h
ave
die
d in
th
e st
ate
bet
wee
n
Mar
to A
pr 2
011.
Of t
he
185
dea
ths,
Mu
mb
ai a
lon
e ac
cou
nte
d
for 1
37. A
tota
l of 1
38,6
05 c
ases
hav
e b
een
rep
ort
ed in
th
e st
ate
bet
wee
n 2
010
and
201
1, c
om
par
ed w
ith
85,
435
case
s fo
r th
e sa
me
per
iod
in la
st y
ear.
Ind
iaA
nd
hra
Pra
des
hK
ham
-m
am
dis
tric
t
Mal
aria
18/0
3/20
11A
n in
crea
se in
mal
aria
cas
es h
as b
een
rep
ort
ed in
vill
ages
of
Bh
adra
chal
am d
ivis
ion
, Kh
amm
am d
istr
ict.
Du
rin
g J
an 2
011,
35
5 ca
ses
wer
e te
sted
po
siti
ve fo
r mal
aria
ou
t o
f th
e 24
,144
b
loo
d s
amp
les
take
n a
nd
311
cas
es in
Feb
201
1 o
ut
of t
he
25,3
60 b
loo
d s
amp
les
test
ed. T
he
mo
st a
ffec
ted
vill
age
is
Tula
sip
aka.
Ind
iaM
ahar
ash
tra
Mu
mb
aiM
alar
ia10
/1/2
011
Un
usu
ally
hig
h n
um
ber
s o
f cas
es h
ave
bee
n re
po
rted
in
Mu
mb
ai d
uri
ng
Dec
201
0. A
tota
l of 4
391
peo
ple
hav
e su
f-fe
red
fro
m d
isea
se in
Dec
201
1.
Ind
iaM
ahar
ash
tra,
Gu
jara
t, C
hh
atti
sgar
h, K
ar-
nat
aka
and
An
dh
ra
Prad
esh
M
alar
ia6/
1/20
11A
s o
f 30
Dec
201
0, a
n in
crea
se in
mal
aria
cas
es h
as b
een
re
po
rted
in In
dia
. Mo
st a
ffec
ted
sta
tes
are
Mah
aras
htr
a (1
24,8
60 c
ases
), C
hh
atti
sgar
h (1
18,5
00),
Gu
jara
t (5
8,99
6),
Kar
nat
aka
(41,
861)
an
d A
nd
hra
Pra
des
h (3
1,09
5).
Ind
iaA
nd
hra
Pra
des
hH
yder
-ab
adM
easl
es5/
4/20
1134
5 ca
ses
of m
easl
es h
ave
bee
n re
po
rted
in t
he
last
th
ree
mo
nth
s.
Ind
iaTa
mil
Nad
uC
hen
nai
Pneu
mo
nia
4/5/
2011
An
ou
tbre
ak o
f pn
eum
on
ia h
as b
een
rep
ort
ed. T
he
nu
mb
er
of c
ases
bei
ng
rep
ort
ed a
t se
vera
l ch
ildre
n's
ho
spit
als
in
Ch
enn
ai c
ity.
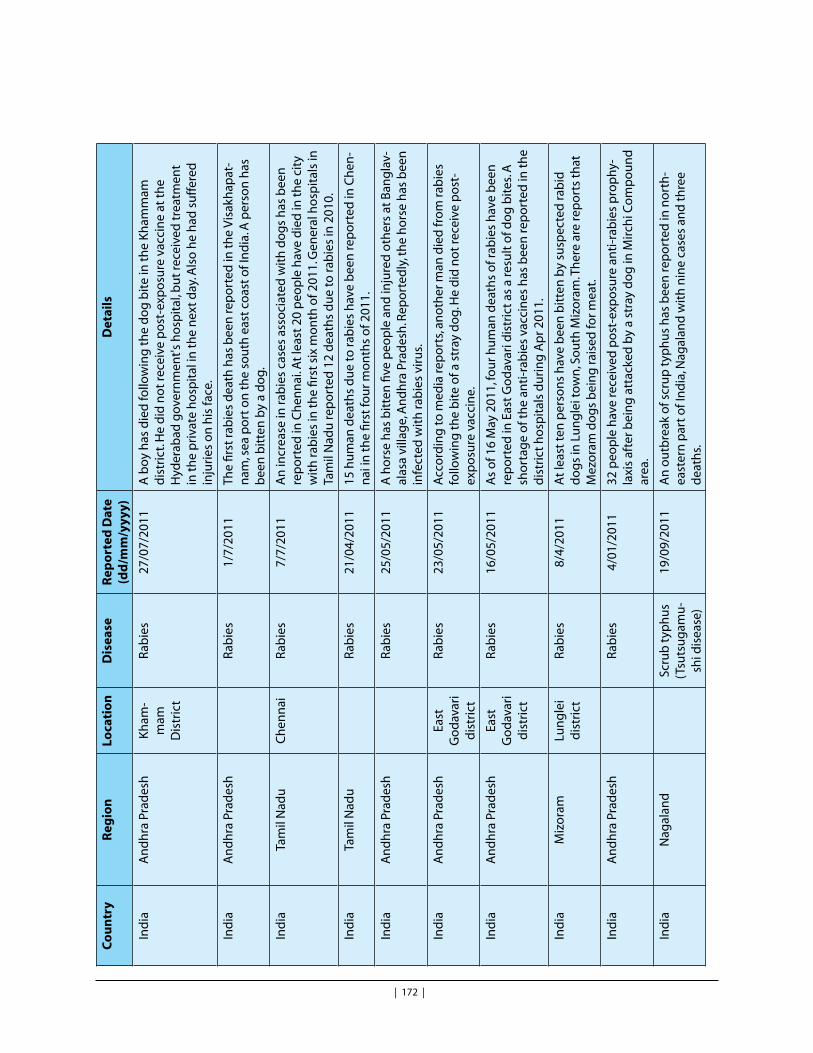
| 172 |
IntroductionC
ou
ntr
yR
egio
nLo
cati
on
Dis
ease
Rep
ort
ed D
ate
(dd
/mm
/yyy
y)D
etai
ls
Ind
iaA
nd
hra
Pra
des
hK
ham
-m
am
Dis
tric
t
Rab
ies
27/0
7/20
11A
boy
has
die
d fo
llow
ing
th
e d
og
bit
e in
th
e K
ham
mam
d
istr
ict.
He
did
no
t re
ceiv
e p
ost
-exp
osu
re v
acci
ne
at t
he
Hyd
erab
ad g
over
nm
ent's
ho
spit
al, b
ut
rece
ived
tre
atm
ent
in t
he
pri
vate
ho
spit
al in
th
e n
ext
day
. Als
o h
e h
ad s
uff
ered
in
juri
es o
n h
is fa
ce.
Ind
iaA
nd
hra
Pra
des
h
Rab
ies
1/7/
2011
The
first
rab
ies
dea
th h
as b
een
rep
ort
ed in
th
e V
isak
hap
at-
nam
, sea
po
rt o
n t
he
sou
th e
ast
coas
t o
f In
dia
. A p
erso
n h
as
bee
n b
itte
n b
y a
do
g.
Ind
iaTa
mil
Nad
uC
hen
nai
Rab
ies
7/7/
2011
An
incr
ease
in ra
bie
s ca
ses
asso
ciat
ed w
ith
do
gs
has
bee
n
rep
ort
ed in
Ch
enn
ai. A
t le
ast
20 p
eop
le h
ave
die
d in
th
e ci
ty
wit
h ra
bie
s in
th
e fir
st s
ix m
on
th o
f 201
1. G
ener
al h
osp
ital
s in
Ta
mil
Nad
u re
po
rted
12
dea
ths
du
e to
rab
ies
in 2
010.
Ind
iaTa
mil
Nad
u
Rab
ies
21/0
4/20
1115
hu
man
dea
ths
du
e to
rab
ies
hav
e b
een
rep
ort
ed in
Ch
en-
nai
in t
he
first
fou
r mo
nth
s o
f 201
1.
Ind
iaA
nd
hra
Pra
des
h
Rab
ies
25/0
5/20
11A
ho
rse
has
bit
ten
five
peo
ple
an
d in
jure
d o
ther
s at
Ban
gla
v-al
asa
villa
ge,
An
dh
ra P
rad
esh
. Rep
ort
edly
, th
e h
ors
e h
as b
een
in
fect
ed w
ith
rab
ies
viru
s.
Ind
iaA
nd
hra
Pra
des
hEa
st
Go
dav
ari
dis
tric
t
Rab
ies
23/0
5/20
11A
cco
rdin
g to
med
ia re
po
rts,
ano
ther
man
die
d fr
om
rab
ies
follo
win
g t
he
bit
e o
f a s
tray
do
g. H
e d
id n
ot
rece
ive
po
st-
exp
osu
re v
acci
ne.
Ind
iaA
nd
hra
Pra
des
hEa
st
Go
dav
ari
dis
tric
t
Rab
ies
16/0
5/20
11A
s o
f 16
May
201
1, fo
ur h
um
an d
eath
s o
f rab
ies
hav
e b
een
re
po
rted
in E
ast
Go
dav
ari d
istr
ict
as a
resu
lt o
f do
g b
ites
. A
sho
rtag
e o
f th
e an
ti-r
abie
s va
ccin
es h
as b
een
rep
ort
ed in
th
e d
istr
ict
ho
spit
als
du
rin
g A
pr 2
011.
Ind
iaM
izo
ram
Lun
gle
i d
istr
ict
Rab
ies
8/4/
2011
At
leas
t te
n p
erso
ns
hav
e b
een
bit
ten
by
susp
ecte
d ra
bid
d
og
s in
Lu
ng
lei t
ow
n, S
ou
th M
izo
ram
. Th
ere
are
rep
ort
s th
at
Mez
ora
m d
og
s b
ein
g ra
ised
for m
eat.
Ind
iaA
nd
hra
Pra
des
h
Rab
ies
4/01
/201
132
peo
ple
hav
e re
ceiv
ed p
ost
-exp
osu
re a
nti
-rab
ies
pro
ph
y-la
xis
afte
r bei
ng
att
acke
d b
y a
stra
y d
og
in M
irch
i Co
mp
ou
nd
ar
ea.
Ind
iaN
agal
and
Sc
rub
typ
hu
s (T
suts
ug
amu
-sh
i dis
ease
)
19/0
9/20
11A
n o
utb
reak
of s
cru
p t
yph
us
has
bee
n re
po
rted
in n
ort
h-
east
ern
par
t o
f In
dia
, Nag
alan
d w
ith
nin
e ca
ses
and
th
ree
dea
ths.
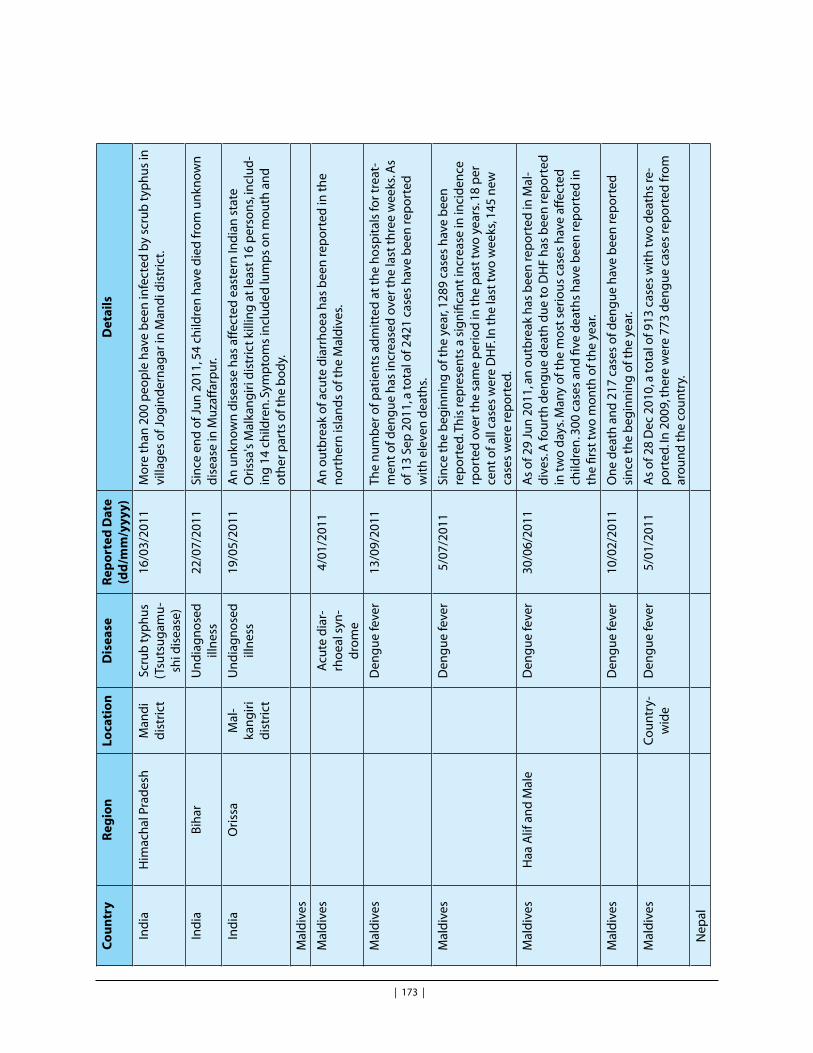
South Asia DisasterReport 2011
| 173 |
Co
un
try
Reg
ion
Loca
tio
nD
isea
seR
epo
rted
Dat
e (d
d/m
m/y
yyy)
Det
ails
Ind
iaH
imac
hal
Pra
des
hM
and
i d
istr
ict
Scru
b t
yph
us
(Tsu
tsu
gam
u-
shi d
isea
se)
16/0
3/20
11M
ore
th
an 2
00 p
eop
le h
ave
bee
n in
fect
ed b
y sc
rub
typ
hu
s in
vi
llag
es o
f Jo
gin
der
nag
ar in
Man
di d
istr
ict.
Ind
iaB
ihar
U
nd
iag
no
sed
ill
nes
s22
/07/
2011
Sin
ce e
nd
of J
un
201
1, 5
4 ch
ildre
n h
ave
die
d fr
om
un
kno
wn
d
isea
se in
Mu
zaff
arp
ur.
Ind
iaO
riss
aM
al-
kan
gir
i d
istr
ict
Un
dia
gn
ose
d
illn
ess
19/0
5/20
11A
n u
nkn
ow
n d
isea
se h
as a
ffec
ted
eas
tern
Ind
ian
sta
te
Ori
ssa'
s M
alka
ng
iri d
istr
ict
killi
ng
at
leas
t 16
per
son
s, in
clu
d-
ing
14
child
ren
. Sym
pto
ms
incl
ud
ed lu
mp
s o
n m
ou
th a
nd
o
ther
par
ts o
f th
e b
od
y.
Mal
div
es
Mal
div
es
A
cute
dia
r-rh
oea
l syn
-d
rom
e
4/01
/201
1A
n o
utb
reak
of a
cute
dia
rrh
oea
has
bee
n re
po
rted
in t
he
no
rth
ern
isla
nd
s o
f th
e M
ald
ives
.
Mal
div
es
D
eng
ue
feve
r13
/09/
2011
The
nu
mb
er o
f pat
ien
ts a
dm
itte
d a
t th
e h
osp
ital
s fo
r tre
at-
men
t o
f den
gu
e h
as in
crea
sed
ove
r th
e la
st t
hre
e w
eeks
. As
of 1
3 Se
p 2
011,
a to
tal o
f 242
1 ca
ses
hav
e b
een
rep
ort
ed
wit
h e
leve
n d
eath
s.
Mal
div
es
D
eng
ue
feve
r5/
07/2
011
Sin
ce t
he
beg
inn
ing
of t
he
year
, 128
9 ca
ses
hav
e b
een
re
po
rted
. Th
is re
pre
sen
ts a
sig
nifi
can
t in
crea
se in
inci
den
ce
rpo
rted
ove
r th
e sa
me
per
iod
in t
he
pas
t tw
o y
ears
. 18
per
ce
nt
of a
ll ca
ses
wer
e D
HF.
In t
he
last
tw
o w
eeks
, 145
new
ca
ses
wer
e re
po
rted
.
Mal
div
esH
aa A
lif a
nd
Mal
e
Den
gu
e fe
ver
30/0
6/20
11A
s o
f 29
Jun
201
1, a
n o
utb
reak
has
bee
n re
po
rted
in M
al-
div
es. A
fou
rth
den
gu
e d
eath
du
e to
DH
F h
as b
een
rep
ort
ed
in t
wo
day
s. M
any
of t
he
mo
st s
erio
us
case
s h
ave
affe
cted
ch
ildre
n. 3
00 c
ases
an
d fi
ve d
eath
s h
ave
bee
n re
po
rted
in
the
first
tw
o m
on
th o
f th
e ye
ar.
Mal
div
es
D
eng
ue
feve
r10
/02/
2011
On
e d
eath
an
d 2
17 c
ases
of d
eng
ue
hav
e b
een
rep
ort
ed
sin
ce t
he
beg
inn
ing
of t
he
year
.
Mal
div
es
Co
un
try-
wid
eD
eng
ue
feve
r5/
01/2
011
As
of 2
8 D
ec 2
010,
a to
tal o
f 913
cas
es w
ith
tw
o d
eath
s re
-p
ort
ed. I
n 2
009,
th
ere
wer
e 77
3 d
eng
ue
case
s re
po
rted
fro
m
aro
un
d t
he
cou
ntr
y.
Nep
al
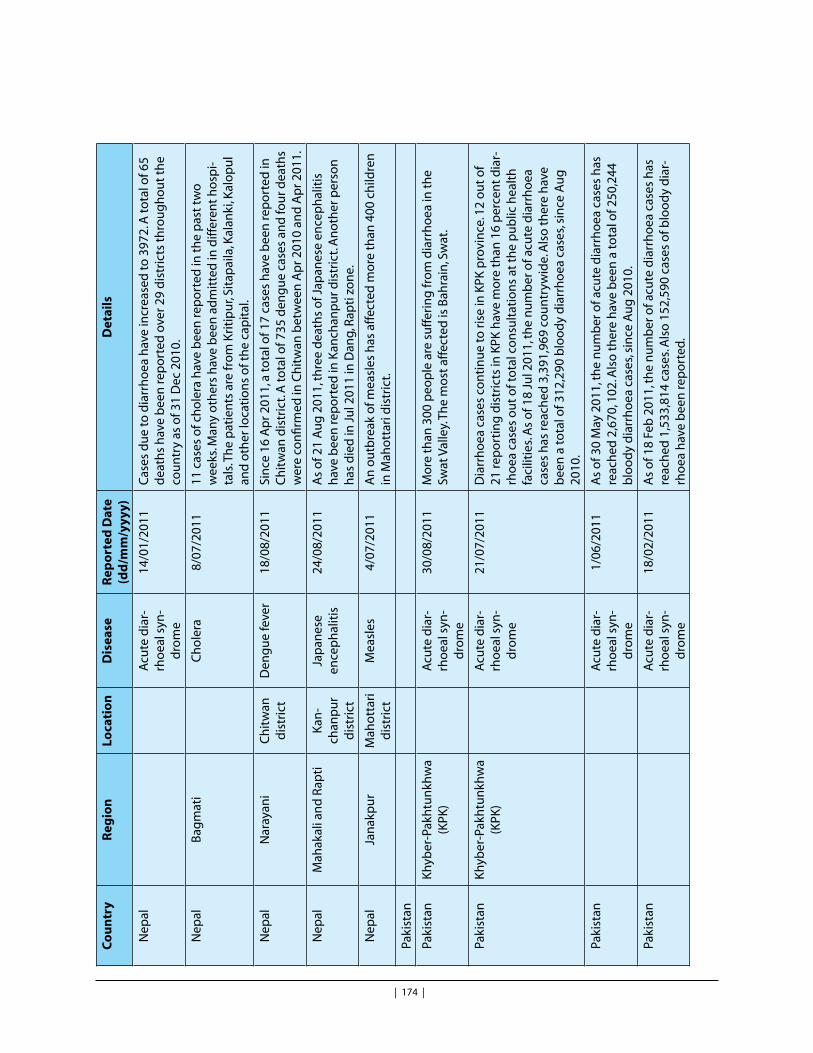
| 174 |
IntroductionC
ou
ntr
yR
egio
nLo
cati
on
Dis
ease
Rep
ort
ed D
ate
(dd
/mm
/yyy
y)D
etai
ls
Nep
al
A
cute
dia
r-rh
oea
l syn
-d
rom
e
14/0
1/20
11C
ases
du
e to
dia
rrh
oea
hav
e in
crea
sed
to 3
972.
A to
tal o
f 65
dea
ths
hav
e b
een
rep
ort
ed o
ver 2
9 d
istr
icts
th
rou
gh
ou
t th
e co
un
try
as o
f 31
Dec
201
0.
Nep
alB
agm
ati
C
ho
lera
8/07
/201
111
cas
es o
f ch
ole
ra h
ave
bee
n re
po
rted
in t
he
pas
t tw
o
wee
ks. M
any
oth
ers
hav
e b
een
ad
mit
ted
in d
iffer
ent
ho
spi-
tals
. Th
e p
atie
nts
are
fro
m K
riti
pu
r, Si
tap
aila
, Kal
anki
, Kal
op
ul
and
oth
er lo
cati
on
s o
f th
e ca
pit
al.
Nep
alN
aray
ani
Ch
itw
an
dis
tric
tD
eng
ue
feve
r18
/08/
2011
Sin
ce 1
6 A
pr 2
011,
a to
tal o
f 17
case
s h
ave
bee
n re
po
rted
in
Ch
itw
an d
istr
ict.
A to
tal o
f 735
den
gu
e ca
ses
and
fou
r dea
ths
wer
e co
nfir
med
in C
hit
wan
bet
wee
n A
pr 2
010
and
Ap
r 201
1.
Nep
alM
ahak
ali a
nd
Rap
tiK
an-
chan
pu
r d
istr
ict
Jap
anes
e en
cep
hal
itis
24/0
8/20
11A
s o
f 21
Au
g 2
011,
th
ree
dea
ths
of J
apan
ese
ence
ph
alit
is
hav
e b
een
rep
ort
ed in
Kan
chan
pu
r dis
tric
t. A
no
ther
per
son
h
as d
ied
in J
ul 2
011
in D
ang,
Rap
ti z
on
e.
Nep
alJa
nak
pu
rM
aho
ttar
i d
istr
ict
Mea
sles
4/07
/201
1A
n o
utb
reak
of m
easl
es h
as a
ffec
ted
mo
re t
han
400
ch
ildre
n
in M
aho
ttar
i dis
tric
t.
Paki
stan
Paki
stan
Kh
yber
-Pak
htu
nkh
wa
(KPK
)
Acu
te d
iar-
rho
eal s
yn-
dro
me
30/0
8/20
11M
ore
th
an 3
00 p
eop
le a
re s
uff
erin
g fr
om
dia
rrh
oea
in t
he
Swat
Val
ley.
Th
e m
ost
aff
ecte
d is
Bah
rain
, Sw
at.
Paki
stan
Kh
yber
-Pak
htu
nkh
wa
(KPK
)
Acu
te d
iar-
rho
eal s
yn-
dro
me
21/0
7/20
11D
iarr
ho
ea c
ases
co
nti
nu
e to
ris
e in
KPK
pro
vin
ce. 1
2 o
ut
of
21 re
po
rtin
g d
istr
icts
in K
PK h
ave
mo
re t
han
16
per
cen
t d
iar-
rho
ea c
ases
ou
t o
f to
tal c
on
sult
atio
ns
at t
he
pu
blic
hea
lth
fa
cilit
ies.
As
of 1
8 Ju
l 201
1, t
he
nu
mb
er o
f acu
te d
iarr
ho
ea
case
s h
as re
ach
ed 3
,391
,969
co
un
tryw
ide.
Als
o t
her
e h
ave
bee
n a
tota
l of 3
12,2
90 b
loo
dy
dia
rrh
oea
cas
es, s
ince
Au
g
2010
.
Paki
stan
Acu
te d
iar-
rho
eal s
yn-
dro
me
1/06
/201
1A
s o
f 30
May
201
1, t
he
nu
mb
er o
f acu
te d
iarr
ho
ea c
ases
has
re
ach
ed 2
,670
, 102
. Als
o t
her
e h
ave
bee
n a
tota
l of 2
50,2
44
blo
od
y d
iarr
ho
ea c
ases
, sin
ce A
ug
201
0.
Paki
stan
Acu
te d
iar-
rho
eal s
yn-
dro
me
18/0
2/20
11A
s o
f 18
Feb
201
1, t
he
nu
mb
er o
f acu
te d
iarr
ho
ea c
ases
has
re
ach
ed 1
,533
,814
cas
es. A
lso
152
,590
cas
es o
f blo
od
y d
iar-
rho
ea h
ave
bee
n re
po
rted
.
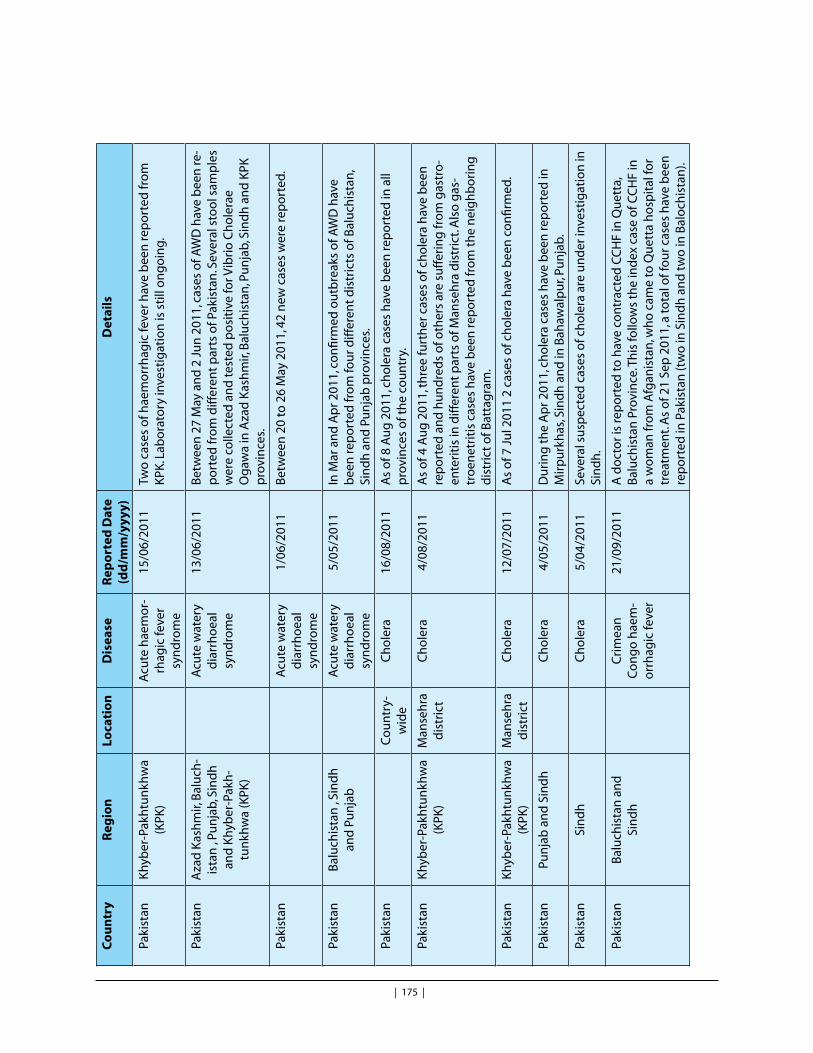
South Asia DisasterReport 2011
| 175 |
Co
un
try
Reg
ion
Loca
tio
nD
isea
seR
epo
rted
Dat
e (d
d/m
m/y
yyy)
Det
ails
Paki
stan
Kh
yber
-Pak
htu
nkh
wa
(KPK
)
Acu
te h
aem
or-
rhag
ic fe
ver
syn
dro
me
15/0
6/20
11Tw
o c
ases
of h
aem
orr
hag
ic fe
ver h
ave
bee
n re
po
rted
fro
m
KPK
. Lab
ora
tory
inve
stig
atio
n is
sti
ll o
ng
oin
g.
Paki
stan
Aza
d K
ash
mir,
Bal
uch
-is
tan
, Pu
nja
b, S
ind
h
and
Kh
yber
-Pak
h-
tun
khw
a (K
PK)
A
cute
wat
ery
dia
rrh
oea
l sy
nd
rom
e
13/0
6/20
11B
etw
een
27
May
an
d 2
Ju
n 2
011,
cas
es o
f AW
D h
ave
bee
n re
-p
ort
ed fr
om
diff
eren
t p
arts
of P
akis
tan
. Sev
eral
sto
ol s
amp
les
wer
e co
llect
ed a
nd
test
ed p
osi
tive
for V
ibri
o C
ho
lera
e O
gaw
a in
Aza
d K
ash
mir,
Bal
uch
ista
n, P
un
jab,
Sin
dh
an
d K
PK
pro
vin
ces.
Paki
stan
Acu
te w
ater
y d
iarr
ho
eal
syn
dro
me
1/06
/201
1B
etw
een
20
to 2
6 M
ay 2
011,
42
new
cas
es w
ere
rep
ort
ed.
Paki
stan
Bal
uch
ista
n ,
Sin
dh
an
d P
un
jab
A
cute
wat
ery
dia
rrh
oea
l sy
nd
rom
e
5/05
/201
1In
Mar
an
d A
pr 2
011,
co
nfir
med
ou
tbre
aks
of A
WD
hav
e b
een
rep
ort
ed fr
om
fou
r diff
eren
t d
istr
icts
of B
alu
chis
tan
, Si
nd
h a
nd
Pu
nja
b p
rovi
nce
s.
Paki
stan
C
ou
ntr
y-w
ide
Ch
ole
ra16
/08/
2011
As
of 8
Au
g 2
011,
ch
ole
ra c
ases
hav
e b
een
rep
ort
ed in
all
pro
vin
ces
of t
he
cou
ntr
y.
Paki
stan
Kh
yber
-Pak
htu
nkh
wa
(KPK
)M
anse
hra
d
istr
ict
Ch
ole
ra4/
08/2
011
As
of 4
Au
g 2
011,
th
ree
furt
her
cas
es o
f ch
ole
ra h
ave
bee
n
rep
ort
ed a
nd
hu
nd
red
s o
f oth
ers
are
suff
erin
g fr
om
gas
tro
-en
teri
tis
in d
iffer
ent
par
ts o
f Man
seh
ra d
istr
ict.
Als
o g
as-
tro
enet
riti
s ca
ses
hav
e b
een
rep
ort
ed fr
om
th
e n
eig
hb
ori
ng
d
istr
ict
of B
atta
gra
m.
Paki
stan
Kh
yber
-Pak
htu
nkh
wa
(KPK
)M
anse
hra
d
istr
ict
Ch
ole
ra12
/07/
2011
As
of 7
Ju
l 201
1 2
case
s o
f ch
ole
ra h
ave
bee
n c
on
firm
ed.
Paki
stan
Pun
jab
an
d S
ind
h
C
ho
lera
4/05
/201
1D
uri
ng
th
e A
pr 2
011,
ch
ole
ra c
ases
hav
e b
een
rep
ort
ed in
M
irp
urk
has
, Sin
dh
an
d in
Bah
awal
pu
r, Pu
nja
b.
Paki
stan
Sin
dh
Ch
ole
ra5/
04/2
011
Seve
ral s
usp
ecte
d c
ases
of c
ho
lera
are
un
der
inve
stig
atio
n in
Si
nd
h.
Paki
stan
Bal
uch
ista
n a
nd
Si
nd
h
C
rim
ean
C
on
go
hae
m-
orr
hag
ic fe
ver
21/0
9/20
11A
do
cto
r is
rep
ort
ed to
hav
e co
ntr
acte
d C
CH
F in
Qu
etta
, B
alu
chis
tan
Pro
vin
ce. T
his
follo
ws
the
ind
ex c
ase
of C
CH
F in
a
wo
man
fro
m A
fgan
ista
n, w
ho
cam
e to
Qu
etta
ho
spit
al fo
r tr
eatm
ent.
As
of 2
1 Se
p 2
011,
a to
tal o
f fo
ur c
ases
hav
e b
een
re
po
rted
in P
akis
tan
(tw
o in
Sin
dh
an
d t
wo
in B
alo
chis
tan
).

| 176 |
IntroductionC
ou
ntr
yR
egio
nLo
cati
on
Dis
ease
Rep
ort
ed D
ate
(dd
/mm
/yyy
y)D
etai
ls
Paki
stan
Pun
jab
D
eng
ue
feve
r5/
09/2
011
As
of 5
Sep
201
1, t
he
tota
l nu
mb
er o
f den
gu
e fe
ver c
ases
h
as in
crea
sed
to 3
335
in t
he
Lah
ore
cit
y, c
apit
al o
f eas
tern
Pu
nja
b p
rovi
nce
.
Paki
stan
Pun
jab,
Kh
yber
-Pak
-h
tun
khw
a (K
PK) a
nd
Si
nd
h
D
eng
ue
feve
r31
/08/
2011
Den
gu
e is
on
go
ing
in s
ever
al p
rovi
nce
s o
f Pak
ista
n. A
c-co
rdin
g to
med
ia re
po
rts,
the
nu
mb
er o
f den
gu
e ca
ses
has
re
ach
ed 7
62 in
Pu
nja
b, in
clu
din
g 6
81 c
ases
in L
aho
re. A
s o
f 22
Au
g 2
011,
138
den
gu
e ca
ses
hav
e b
een
rep
ort
ed in
Sin
dh
p
rovi
nce
th
is y
ear,
119
of w
hic
h w
ere
fro
m K
arac
hi.
Paki
stan
Pun
jab
D
eng
ue
feve
r16
/08/
2011
The
nu
mb
er o
f den
gu
e fe
ver c
ases
has
incr
ease
d in
Pu
nja
b
esp
ecia
lly in
th
e N
ort
her
n L
aho
re a
nd
th
e W
alle
d C
ity.
Sin
ce
Mar
201
1, 8
6 ca
ses
of d
eng
ue
feve
r hav
e b
een
rep
ort
ed in
La
ho
re a
lon
e w
ith
on
e d
eath
(in
clu
din
g 4
4 in
th
e fir
st h
alf o
f A
ug
201
1).
Paki
stan
Pun
jab
D
eng
ue
feve
r15
/08/
2011
On
e d
eng
ue
dea
th h
as b
een
rep
ort
ed fr
om
Raw
alp
ind
i cit
y.
At
leas
t fo
ur o
ther
su
spec
ted
cas
es h
ave
bee
n re
po
rted
.
Paki
stan
Sin
dh
Den
gu
e fe
ver
9/08
/201
1A
t le
ast
fou
r den
gu
e fe
ver c
ases
hav
e b
een
rep
ort
ed fr
om
K
arac
hi,
as o
f 9 A
ug
201
1.
Paki
stan
Sin
dh
an
d K
hyb
er-
Pakh
tun
khw
a (K
PK)
D
eng
ue
feve
r15
/06/
2011
Thre
e ca
ses
of d
eng
ue
hae
mo
rrh
agic
feve
r hav
e b
een
re-
po
rted
(in
clu
din
g o
ne
case
in S
ind
h a
nd
tw
o c
ases
in K
PK).
Paki
stan
Sin
dh
Den
gu
e fe
ver
21/0
4/20
11C
ases
of s
usp
ecte
d d
eng
ue
feve
r hav
e b
een
rep
ort
ed b
y lo
cal h
osp
ital
s in
Kar
ach
i. M
ore
th
an 3
0 p
eop
le w
ith
den
gu
e sy
mp
tom
s h
ave
bee
n t
reat
ed in
th
e la
st fo
ur m
on
ths.
Paki
stan
Dip
hth
eria
18/0
2/20
11A
s o
f 18
Feb
201
1, t
he
nu
mb
er o
f dip
hth
eria
cas
es h
as in
-cr
ease
d to
70.
Paki
stan
Bal
uch
ista
n
Kh
uzd
ar
and
Zh
ob
d
istr
icts
Gas
tro
ente
riti
s7/
09/2
011
At
leas
t 60
pat
ien
ts, s
uff
erin
g fr
om
gas
tro
ente
riti
s, h
ave
bee
n
adm
itte
d to
ho
spit
als
in K
hu
zdar
. Tw
o p
erso
ns
hav
e d
ied
so
fa
r. A
lso
at
leas
t 30
0 p
eop
le a
re re
po
rted
ly s
uff
erin
g fr
om
g
astr
oen
teri
tis
in Z
ho
b d
istr
ict.
Bo
th d
istr
icts
hav
e b
een
se
vere
ly a
ffec
ted
by
rese
nt
rain
s an
d fl
oo
din
g.
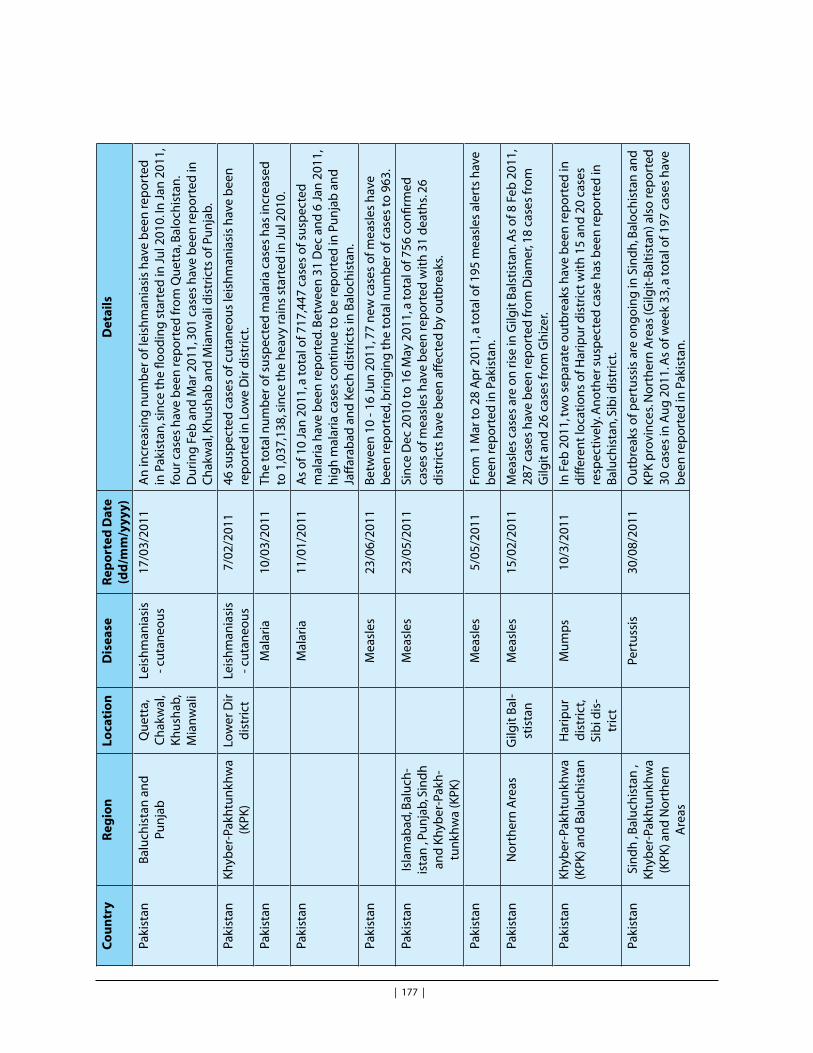
South Asia DisasterReport 2011
| 177 |
Co
un
try
Reg
ion
Loca
tio
nD
isea
seR
epo
rted
Dat
e (d
d/m
m/y
yyy)
Det
ails
Paki
stan
Bal
uch
ista
n a
nd
Pu
nja
bQ
uet
ta,
Ch
akw
al,
Kh
ush
ab,
Mia
nw
ali
Leis
hm
ania
sis
- cu
tan
eou
s17
/03/
2011
An
incr
easi
ng
nu
mb
er o
f lei
shm
ania
sis
hav
e b
een
rep
ort
ed
in P
akis
tan
, sin
ce t
he
floo
din
g s
tart
ed in
Ju
l 201
0. In
Jan
201
1,
fou
r cas
es h
ave
bee
n re
po
rted
fro
m Q
uet
ta, B
alo
chis
tan
. D
uri
ng
Feb
an
d M
ar 2
011,
301
cas
es h
ave
bee
n re
po
rted
in
Ch
akw
al, K
hu
shab
an
d M
ian
wal
i dis
tric
ts o
f Pu
nja
b.
Paki
stan
Kh
yber
-Pak
htu
nkh
wa
(KPK
)Lo
wer
Dir
d
istr
ict
Leis
hm
ania
sis
- cu
tan
eou
s7/
02/2
011
46 s
usp
ecte
d c
ases
of c
uta
neo
us
leis
hm
ania
sis
hav
e b
een
re
po
rted
in L
ow
e D
ir d
istr
ict.
Paki
stan
Mal
aria
10/0
3/20
11Th
e to
tal n
um
ber
of s
usp
ecte
d m
alar
ia c
ases
has
incr
ease
d
to 1
,037
,138
, sin
ce t
he
hea
vy ra
ins
star
ted
in J
ul 2
010.
Paki
stan
Mal
aria
11/0
1/20
11A
s o
f 10
Jan
201
1, a
tota
l of 7
17,4
47 c
ases
of s
usp
ecte
d
mal
aria
hav
e b
een
rep
ort
ed. B
etw
een
31
Dec
an
d 6
Jan
201
1,
hig
h m
alar
ia c
ases
co
nti
nu
e to
be
rep
ort
ed in
Pu
nja
b a
nd
Ja
ffar
abad
an
d K
ech
dis
tric
ts in
Bal
och
ista
n.
Paki
stan
Mea
sles
23/0
6/20
11B
etw
een
10
- 16
Jun
201
1, 7
7 n
ew c
ases
of m
easl
es h
ave
bee
n re
po
rted
, bri
ng
ing
th
e to
tal n
um
ber
of c
ases
to 9
63.
Paki
stan
Isla
mab
ad, B
alu
ch-
ista
n ,
Pun
jab,
Sin
dh
an
d K
hyb
er-P
akh
-tu
nkh
wa
(KPK
)
M
easl
es23
/05/
2011
Sin
ce D
ec 2
010
to 1
6 M
ay 2
011,
a to
tal o
f 756
co
nfir
med
ca
ses
of m
easl
es h
ave
bee
n re
po
rted
wit
h 3
1 d
eath
s. 26
d
istr
icts
hav
e b
een
aff
ecte
d b
y o
utb
reak
s.
Paki
stan
Mea
sles
5/05
/201
1Fr
om
1 M
ar to
28
Ap
r 201
1, a
tota
l of 1
95 m
easl
es a
lert
s h
ave
bee
n re
po
rted
in P
akis
tan
.
Paki
stan
No
rth
ern
Are
asG
ilgit
Bal
-st
ista
nM
easl
es15
/02/
2011
Mea
sles
cas
es a
re o
n r
ise
in G
ilgit
Bal
stis
tan
. As
of 8
Feb
201
1,
287
case
s h
ave
bee
n re
po
rted
fro
m D
iam
er, 1
8 ca
ses
fro
m
Gilg
it a
nd
26
case
s fr
om
Gh
izer
.
Paki
stan
Kh
yber
-Pak
htu
nkh
wa
(KPK
) an
d B
alu
chis
tan
H
arip
ur
dis
tric
t, Si
bi d
is-
tric
t
Mu
mp
s10
/3/2
011
In F
eb 2
011,
tw
o s
epar
ate
ou
tbre
aks
hav
e b
een
rep
ort
ed in
d
iffer
ent
loca
tio
ns
of H
arip
ur d
istr
ict
wit
h 1
5 an
d 2
0 ca
ses
resp
ecti
vely
. An
oth
er s
usp
ecte
d c
ase
has
bee
n re
po
rted
in
Bal
uch
ista
n, S
ibi d
istr
ict.
Paki
stan
Sin
dh
, B
alu
chis
tan
, K
hyb
er-P
akh
tun
khw
a (K
PK) a
nd
No
rth
ern
A
reas
Pe
rtu
ssis
30/0
8/20
11O
utb
reak
s o
f per
tuss
is a
re o
ng
oin
g in
Sin
dh
, Bal
och
ista
n a
nd
K
PK p
rovi
nce
s. N
ort
her
n A
reas
(Gilg
it-B
alti
stan
) als
o re
po
rted
30
cas
es in
Au
g 2
011.
As
of w
eek
33, a
tota
l of 1
97 c
ases
hav
e b
een
rep
ort
ed in
Pak
ista
n.

| 178 |
IntroductionC
ou
ntr
yR
egio
nLo
cati
on
Dis
ease
Rep
ort
ed D
ate
(dd
/mm
/yyy
y)D
etai
ls
Paki
stan
Sin
dh
an
d K
hyb
er-
Pakh
tun
khw
a (K
PK)
Pe
rtu
ssis
29/0
3/20
1185
cas
es o
f su
spec
ted
per
tuss
is h
ave
bee
n re
po
rted
am
on
g
child
ren
in S
wab
i (K
PK) a
nd
fro
m s
ix d
istr
icts
of S
ind
h -
Dad
u,
Gh
otk
i, H
yder
abad
, Kas
hm
ore
, Mir
pu
rkh
as, a
nd
Tan
do
Alla
Yar.
Paki
stan
Pun
jab
Tu
ber
culo
sis
20/0
6/20
11A
n in
crea
se in
tu
ber
culo
sis
has
bee
n re
po
rted
in P
akis
tan
. 10
,831
new
cas
es o
f tu
ber
culo
sis
hav
e b
een
rep
ort
ed in
35
dis
tric
ts a
cro
ss P
akis
tan
du
rin
g F
eb 2
011
(th
e n
um
ber
has
d
ou
ble
d c
om
par
ed w
ith
pre
vio
us
mo
nth
). Th
e Pu
nja
b p
rov-
ince
acc
ou
nte
d fo
r 86
per
cen
t o
f th
e re
po
rted
cas
es.
Paki
stan
Kh
yber
-Pak
htu
nkh
wa
(KPK
)
Typ
ho
id fe
ver
13/0
6/20
11Se
ven
co
nfir
med
cas
es o
f typ
ho
id fe
ver w
ere
rep
ort
ed in
B
HU
Bas
su M
era,
KPK
. On
inve
stig
atio
n a
nd
act
ive
surv
eil-
lan
ce t
hre
e m
ore
cas
es h
ave
bee
n fo
un
d.
Paki
stan
No
rth
ern
Are
asG
ilgit
B
alti
stan
Typ
ho
id fe
ver
26/0
5/20
1116
cas
es o
f su
spec
ted
typ
ho
id fe
ver h
ave
bee
n re
po
rted
in
Gilg
it B
alti
stan
du
e to
co
nta
min
ated
wat
er s
ou
rces
.
Paki
stan
Kh
yber
-Pak
htu
nkh
wa
(KPK
)
Typ
ho
id fe
ver
14/0
4/20
1150
su
spec
ted
cas
es o
f typ
ho
id fe
ver a
re b
ein
g in
vest
igat
ed.
All
case
s w
ere
rep
ort
ed b
etw
een
1 to
7 A
pr 2
011
fro
m U
C
Dh
eri J
ula
gra
m a
rea.
Sri L
anka
Sri L
anka
Bat
tica
loa
A
cute
dia
r-rh
oea
l syn
-d
rom
e
15/0
2/20
11Fo
llow
ing
th
e h
eavy
rain
s an
d fl
oo
din
g, 1
4 ca
ses
of b
loo
dy
and
mu
cou
s d
iarr
ho
ea h
ave
bee
n re
po
rted
in B
atti
calo
a.
Sri L
anka
Den
gu
e fe
ver
1/08
/201
1Sr
i Lan
ka h
as re
po
rted
th
e h
igh
est
nu
mb
er o
f den
gu
e ca
ses
of t
he
year
th
is m
on
th. D
uri
ng
Ju
l 201
1, a
tota
l of 3
639
case
s re
po
rted
, bri
ng
ing
th
e to
tal n
um
ber
of c
ases
in 2
011
to
13,8
87.
Sri L
anka
Co
lom
bo
an
d G
am-
pah
a
Den
gu
e fe
ver
23/0
6/20
11Si
nce
en
d o
f Ap
r 201
1, t
her
e h
as b
een
an
incr
ease
in d
eng
ue
case
s. A
s o
f 23
Jun
201
1, a
tota
l of 9
083
case
s w
ith
69
dea
ths
hav
e b
een
rep
ort
ed. O
f th
ese,
176
3 w
ere
rep
ort
ed in
Ap
r, 19
56 in
Ju
n a
nd
228
6 ca
ses
in M
ay 2
011.
Co
lom
bo
an
d G
am-
pah
a ac
cou
nte
d fo
r 341
3 an
d 1
113
case
s re
spec
tive
ly.
Sri L
anka
Den
gu
e fe
ver
3/05
/201
1A
s o
f 3 M
ay 2
011,
a to
tal o
f 447
2 ca
ses
of d
eng
ue
hav
e b
een
re
cord
ed w
ith
39
dea
ths.
Of t
hes
e 13
94 c
ases
wer
e re
po
rted
d
uri
ng
Ap
r 201
1. M
ost
of t
he
case
s w
ere
rep
ort
ed fr
om
C
olo
mb
o (1
485)
.

South Asia DisasterReport 2011
| 179 |
Co
un
try
Reg
ion
Loca
tio
nD
isea
seR
epo
rted
Dat
e (d
d/m
m/y
yyy)
Det
ails
Sri L
anka
Putt
alam
, Gam
pah
a an
d C
olo
mb
o
Den
gu
e fe
ver
1/03
/201
1A
s o
f 1 M
ar 2
011,
th
e n
um
ber
of d
eng
ue
case
s h
as in
crea
sed
to
172
2 w
ith
18
dea
ths.
The
maj
ori
ty o
f cas
es w
ere
rep
ort
ed
fro
m C
olo
mb
o (6
16),
Gam
pah
a (2
12) a
nd
Pu
ttal
am (1
18).
Sri L
anka
Co
lom
bo,
Gam
pah
a an
d P
utt
alam
D
eng
ue
feve
r14
/02/
2011
As
of 1
1 Fe
b 2
011,
110
5 ca
ses
and
13
dea
ths
hav
e b
een
re-
po
rted
. Hig
h n
um
ber
of c
ases
rep
ort
ed fr
om
Co
lom
bo
(383
), G
amp
aha
(134
) an
d P
utt
alam
(103
).
Sri L
anka
Putt
alam
Le
pto
spir
osi
s14
/09/
2011
Lep
tosp
iro
sis
is s
pre
adin
g in
th
e w
este
rn c
oas
t, C
hila
w
reg
ion
. A d
eath
had
alr
ead
y b
een
rep
ort
ed fr
om
th
e re
gio
n
wit
h o
ther
cas
es s
ho
win
g s
ymp
tom
s o
f th
e d
isea
se. I
t is
re
po
rted
th
at e
ntr
ance
of M
arad
anku
lam
a Ta
nk
(wat
er re
ser-
voir
) is
bei
ng
rest
rict
ed.
Sri L
anka
Kuru
neg
ala
and
G
amp
aha
Le
pto
spir
osi
s19
/08/
2011
So fa
r th
is y
ear 4
779
case
s o
f lep
tosp
iro
sis
hav
e b
een
re-
po
rted
in t
he
cou
ntr
y an
d 6
0 d
eath
s w
ere
amo
ng
th
em. T
he
hig
hes
t n
um
ber
of c
ases
, 138
6, w
as re
po
rted
fro
m K
uru
ne-
gal
a d
istr
ict.
Ten
peo
ple
hav
e d
ied
in t
he
dis
tric
t d
ue
to t
he
dis
ease
. Th
e h
igh
est
nu
mb
er o
f dea
ths
was
rep
ort
ed fr
om
G
amp
aha
dis
tric
t w
her
e 11
peo
ple
hav
e d
ied
an
d a
tota
l of
379
case
s h
ave
bee
n re
po
rted
.
Sri L
anka
Lep
tosp
iro
sis
14/0
3/20
11Th
e to
tal n
um
ber
of l
epto
spir
osi
s ca
ses
in S
rila
nka
has
in-
crea
sed
to 1
241
wit
h 1
1 d
eath
s. A
lmo
st h
alf o
f th
e re
po
rted
ca
ses
wer
e fr
om
Ku
run
egal
a (5
68).
Sri L
anka
Kuru
neg
ala,
An
ura
d-
hap
ura
an
d C
olo
mb
o
Lep
tosp
iro
sis
7/03
/201
1A
furt
her
incr
ease
in le
pto
spir
osi
s ca
ses
has
bee
n re
po
rted
d
uri
ng
th
e p
ast
wee
k. A
s o
f 4 M
ar 2
011,
a to
tal o
f 708
cas
es
and
11
dea
ths
hav
e b
een
rep
ort
ed in
th
e co
un
try.
Th
e m
ost
af
fect
ed d
istr
ict
rem
ain
s Ku
run
egal
a (2
24 c
ases
), fo
llow
ed b
y A
nu
rad
hap
ura
(55
case
s) a
nd
Co
lom
bo
(50
case
s).
Sri L
anka
Kuru
neg
ala
Le
pto
spir
osi
s2/
03/2
011
As
of 2
8 Fe
b 2
011,
th
e to
tal n
um
ber
of l
epto
spir
osi
s ca
ses
in
Sri L
anka
has
incr
ease
d to
488
. On
e m
ore
dea
ths
has
bee
n
rep
ort
ed. T
he
mo
st re
cen
t in
crea
se in
rep
ort
ed c
ases
oc-
curr
ed in
Ku
run
egal
a (7
3 ca
ses)
.

| 180 |
IntroductionC
ou
ntr
yR
egio
nLo
cati
on
Dis
ease
Rep
ort
ed D
ate
(dd
/mm
/yyy
y)D
etai
ls
Sri L
anka
An
ura
dh
apu
ra,
Co
lom
bo,
Gam
pah
a,
Keg
alla
, Rat
nap
ura
an
d K
uru
neg
ala
Le
pto
spir
osi
s25
/02/
2011
As
of 2
5 Fe
b 2
011,
th
e M
inis
try
of H
ealt
hca
re a
nd
Nu
trit
ion
o
f Sri
lan
ka h
as re
po
rted
a to
tal o
f 417
cas
es o
f lep
tosp
iro
sis
wit
h t
hre
e d
eath
s. Th
e m
ost
cas
es re
po
rted
fro
m C
olo
mb
o
(42)
, Ku
run
egal
a (4
1), R
atn
apu
ra (3
9) A
nu
rad
hap
ura
(32)
, G
amp
aha
(29)
an
d K
egal
le (2
5). S
o fa
r th
ree
peo
ple
hav
e d
ied
w
ith
lep
tosp
iro
sis.
Sri L
anka
An
ura
dh
apu
ra, K
i-lin
och
chi,
Mu
llait
tivu
, Po
lon
nar
uw
a an
d
Vavu
niy
a
Le
pto
spir
osi
s23
/02/
2011
Susp
ecte
d le
pto
spir
osi
s ca
ses
hav
e b
een
rep
ort
ed fr
om
flo
od
aff
ecte
d d
istr
icts
. Vav
un
iya
ho
spit
al h
as re
po
rted
eig
ht
case
s (in
clu
din
g o
ne
fro
m M
ulla
ttiv
u a
nd
on
e fr
om
Kili
no
ch-
ci).
An
ura
dh
apu
ra d
istr
ict
has
rep
ort
ed 2
5 ca
ses
and
an
oth
er
six
case
s w
ere
rep
ort
ed fr
om
Po
lon
nar
uw
a.
Sour
ce-N
thna
c o
utbr
eak
Repo
rt

South Asia DisasterReport 2011
| 181 |
Ap
pen
dix
-VIII
Man
-mad
e D
isas
ters
in S
ou
th A
sia
20
11
Co
un
try
Lo
cati
on
Ty
pe
Su
b T
ype
Star
t
End
N
ame
K
illed
To
t.
Aff
ecte
d
Est.
Dam
age
(US$
Mill
ion
)
Paki
stan
Bal
ou
chis
tan
Ind
ust
rial
Acc
iden
tEx
plo
sio
n20
/03/
2011
20/0
3/20
11C
oal
min
e43
Mis
cella
neo
us
acci
den
t
Ind
iaN
aisi
ng
par
aM
isce
llan
eou
s ac
-ci
den
tFi
re19
/03/
2011
19/0
3/20
11H
uts
1510
Ind
iaC
alcu
tta
Mis
cella
neo
us
ac-
cid
ent
Fire
9/12
/201
19/
12/2
011
Ho
spit
al89
90
Ind
iaH
arid
war
Mis
cella
neo
us
ac-
cid
ent
Oth
er8/
11/2
011
8/11
/201
1C
rush
1646
Ind
iaN
ew D
elh
iM
isce
llan
eou
s ac
-ci
den
tFi
re20
/11/
2011
20/1
1/20
11
1440
Ind
iaN
ear D
arje
el-
ing
Mis
cella
neo
us
ac-
cid
ent
Co
llap
se22
/10/
2011
23/1
0/20
11B
rid
ge
32
Ind
iaSa
bar
imal
a (K
eral
a st
ate)
...
Mis
cella
neo
us
ac-
cid
ent
Oth
er14
/01/
2011
14/0
1/20
11C
rush
100
75
Nep
al
Nep
alG
ork
ha
dis
tric
tM
isce
llan
eou
s ac
-ci
den
tC
olla
pse
22/1
0/20
1122
/10/
2011
Bri
dg
e42
4
Tran
spo
rt A
ccid
ent
Afg
han
ista
n
Afg
han
ista
nK
and
ahar
p
rovi
nce
Tran
spo
rt a
ccid
ent
Ro
ad20
/08/
2011
20/0
8/20
11
3524
Afg
han
ista
nH
esar
ak (B
alkh
p
rovi
nce
)Tr
ansp
ort
acc
iden
tR
oad
14/0
5/20
1114
/05/
2011
21
Afg
han
ista
nZ
abo
ul
Tran
spo
rt a
ccid
ent
Ro
ad28
/04/
2011
28/0
4/20
11
2033
Ind
ust
rial
Acc
iden
t

| 182 |
Introduction
Sour
ce- E
mer
genc
y D
atab
ase(
EM-D
AT)C
entr
e fo
r res
earc
h on
Epi
dem
iolo
gy o
f Dis
aste
r(C
RED
),Bel
gium
Acc
esse
d on
Sep
tem
ber-
3,20
12.D
ata
vers
ion
:v12
.07
Co
un
try
Lo
cati
on
Ty
pe
Su
b T
ype
Star
t
End
N
ame
K
illed
To
t.
Aff
ecte
d
Est.
Dam
age
(US$
Mill
ion
)
Ban
gla
des
h
Ban
gla
des
hN
ear M
irer
sho
-ra
i (C
hit
tag
...
Tran
spo
rt a
ccid
ent
Ro
ad11
/7/2
011
11/7
/201
1
316
Ban
gla
des
h
Tran
spo
rt a
ccid
ent
Wat
er21
/04/
2011
21/0
4/20
11Fe
rry
3220
Ind
ia
Ind
iaC
hen
nai
Tran
spo
rt a
ccid
ent
Rai
l13
/09/
2011
13/0
9/20
11
1052
Ind
iaK
ansh
iram
na-
gar
(Utt
ar P
ra ..
.Tr
ansp
ort
acc
iden
tR
oad
7/7/
2011
7/7/
2011
35
39
Ind
iaFa
teh
pu
r, n
ear
Luck
no
w (U
...
Tran
spo
rt a
ccid
ent
Rai
l10
/7/2
011
10/7
/201
1
6810
02
Ind
iaK
amru
p d
istr
ict
Tran
spo
rt a
ccid
ent
Ro
ad30
/05/
2011
30/0
5/20
11
2810
Ind
iaFa
rid
abad
(n
ear D
elh
i)Tr
ansp
ort
acc
iden
tA
ir26
/05/
2011
26/0
5/20
11
10
Ind
iaTw
ang
dis
tric
t (n
ear C
hin
...
Tran
spo
rt a
ccid
ent
Air
19/0
4/20
1119
/04/
2011
Hel
ico
pte
r18
5
Ind
iaN
ear D
ehra
du
n
(Utt
arak
han
...
Tran
spo
rt a
ccid
ent
Ro
ad5/
1/20
115/
1/20
11
2219
Nep
al
Nep
alN
ear K
atm
an-
do
uTr
ansp
ort
acc
iden
tA
ir25
/09/
2011
25/0
9/20
11B
eech
craf
t19
Nep
alSi
nd
hu
li d
is-
tric
tTr
ansp
ort
acc
iden
tR
oad
13/1
0/20
1113
/10/
2011
43
Nep
alK
amal
a ri
ver
(Sir
aha)
Tran
spo
rt a
ccid
ent
Wat
er16
/08/
2011
16/0
8/20
11
23
Pak
ista
n
Paki
stan
Lasb
ella
dis
-tr
ict
Tran
spo
rt a
ccid
ent
Ro
ad14
/08/
2011
14/0
8/20
11
1520
Paki
stan
Pen
ajb
reg
ion
Tran
spo
rt a
ccid
ent
Ro
ad26
/09/
2011
26/0
9/20
11
3055
Paki
stan
Mir
pu
rTr
ansp
ort
acc
iden
tR
oad
10/6
/201
110
/6/2
011
15