south africa brand report - · pdf filesouth africa brand report ... as well as a detailed...
TRANSCRIPT

©Analytix Business Intelligence 2012
www.analytixbi.com
SOUTH AFRICA BRAND REPORT
– CONSUMERS OF INFANT CEREAL –
COMPILED: FEBRUARY 2012
©Analytix Business Intelligence 2012
www.analytixbi.com
REPORT OVERVIEW
2
Compiled: February 2012
(75 pages)
This comprehensive report examines the South African purchasers of infant cereal: Infant
cereal usage and brands trends, Geo-demographic trends (2009-2011) among purchasers,
Detailed geo-demographic brand profile and brand penetration analysis (2011), Cellphone,
Internet, Lifestyle and Media consumption.
The consumer analysis is based on the latest annual consumer survey among a nationally
representative sample of more than 25,000 people - All Media and Products Survey conducted
by the South African Advertising Research Foundation.
Some of the key questions the report will help you to answer are:
What are the important consumer and market trends that should be included in your business strategy?
Who are the purchasers of Infant Cereals? What are geo-demographic trends (2009-2011) among
purchasers? e.g. age, gender, affluence, life-stage, geographics
How do you engage with them? e.g. lifestyle, cellphone, Internet, sports, music interests
What media do you use to communicate to them? e.g. online media, TV, radio, newspapers, magazines

©Analytix Business Intelligence 2012
www.analytixbi.com
REPORT OVERVIEW
3
It provides a comprehensive consumer profile of the infant cereal category (minimum category
sample = 1716 consumers), as well as a detailed segmentation by brand, namely: Nestle
Cerelac, Nestle Creamy Pap Maize, Nestle Nestum, Purity Cereals, Purity Creamy Maize,
and Purity Mabele.
An additional brand that forms part of the market trends and geo-demographic trends analysis
of Infant Cereal consumers is Pronutro Toddlers.
It examines in detail the demographics, lifestyle, media consumption and cellphone and
Internet usage of the infant cereal category by brand, making it a vital reference report for
anyone wanting to understand this segment of the market.
Why purchase this market research report?
The report focuses on consumer-based intelligence – the most valuable brand asset
Provides a comprehensive analysis of the “big picture” with local consumer/market trends
75 page report with 70+ charts, graphs, tables
Salient points and key insights are highlighted and summarised in comment boxes on each page

©Analytix Business Intelligence 2012
www.analytixbi.com
4
75 page report filled with >100 detailed charts, graphs, tables and insights
SCREENSHOTS FROM REPORT
©Analytix Business Intelligence 2012
www.analytixbi.com
5
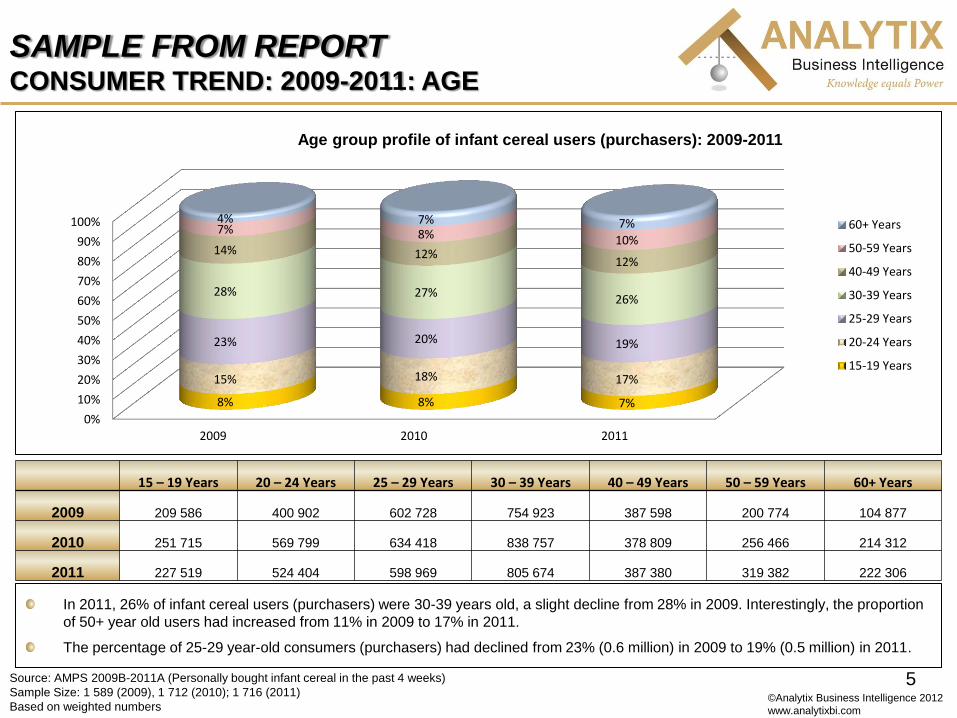
SAMPLE FROM REPORT CONSUMER TREND: 2009-2011: AGE
In 2011, 26% of infant cereal users (purchasers) were 30-39 years old, a slight decline from 28% in 2009. Interestingly, the proportion
of 50+ year old users had increased from 11% in 2009 to 17% in 2011.
The percentage of 25-29 year-old consumers (purchasers) had declined from 23% (0.6 million) in 2009 to 19% (0.5 million) in 2011.
15 – 19 Years 20 – 24 Years 25 – 29 Years 30 – 39 Years 40 – 49 Years 50 – 59 Years 60+ Years
2009 209 586 400 902 602 728 754 923 387 598 200 774 104 877
2010 251 715 569 799 634 418 838 757 378 809 256 466 214 312
2011 227 519 524 404 598 969 805 674 387 380 319 382 222 306
0%
10%
20%
30%
40%
50%
60%
70%
80%
90%
100%
2009 2010 2011
8% 8% 7%
15% 18% 17%
23% 20% 19%
28% 27% 26%
14% 12% 12%
7% 8% 10%
4% 7% 7%
Age group profile of infant cereal users (purchasers): 2009-2011
60+ Years
50-59 Years
40-49 Years
30-39 Years
25-29 Years
20-24 Years
15-19 Years
Source: AMPS 2009B-2011A (Personally bought infant cereal in the past 4 weeks)
Sample Size: 1 589 (2009), 1 712 (2010); 1 716 (2011)
Based on weighted numbers

©Analytix Business Intelligence 2012
www.analytixbi.com
6
Year Light (1:2) Medium (3:5) Heavy (6+) Total
2009 1 409 914 886 000 381 318 2 677 232
2010 1 617 629 1 059 198 482 239 3 159 067
2011 1 473 114 1 146 884 480 357 3 100 354
SAMPLE FROM REPORT INFANT CEREAL USAGE TRENDS: 2009-2011
Between 2009 and 2011, the proportion of consumers who were classified as “Light” consumers of infant cereal (personally bought 1-
2 units of infant cereal in the past 4 weeks) had dropped from 53% (1.4 million) to 48% (1.5 million).
In contrast, the number of infant cereal consumers who were classified as “Medium” consumers (personally bought 3-5 units of infant
cereal in the past 4 weeks) had increased by 4% to 1.1 million users.
53% 51%
48%
33% 34% 37%
14% 15% 15%
0%
10%
20%
30%
40%
50%
60%
70%
80%
2009 2010 2011
Infant cereal consumption trends: 2009-2011
Light Medium Heavy
Source: AMPS 2009B-2011A (Personally bought infant cereal in the past 4 weeks)
Sample Size: 1 589 (2009), 1 712 (2010); 1 716 (2011)
See previous page for sample details.
©Analytix Business Intelligence 2012
www.analytixbi.com
7
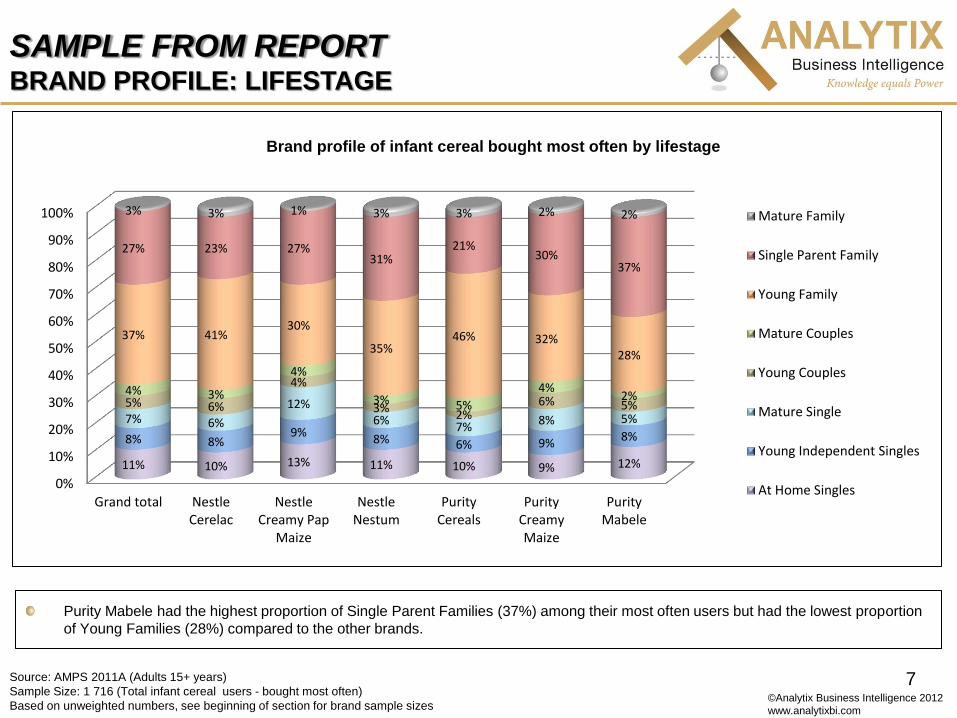
SAMPLE FROM REPORT BRAND PROFILE: LIFESTAGE
Purity Mabele had the highest proportion of Single Parent Families (37%) among their most often users but had the lowest proportion
of Young Families (28%) compared to the other brands.
Source: AMPS 2011A (Adults 15+ years)
Sample Size: 1 716 (Total infant cereal users - bought most often)
Based on unweighted numbers, see beginning of section for brand sample sizes
0%
10%
20%
30%
40%
50%
60%
70%
80%
90%
100%
Grand total NestleCerelac
NestleCreamy Pap
Maize
NestleNestum
PurityCereals
PurityCreamyMaize
PurityMabele
11% 10% 13% 11% 10% 9% 12%
8% 8% 9%
8% 6% 9% 8%
7% 6%
12% 6%
7% 8% 5%
5% 6%
4%
3% 2%
6% 5% 4% 3%
4%
3% 5%
4% 2%
37% 41% 30%
35% 46% 32%
28%
27% 23% 27% 31%
21% 30%
37%
3% 3% 1% 3% 3% 2% 2%
Brand profile of infant cereal bought most often by lifestage
Mature Family
Single Parent Family
Young Family
Mature Couples
Young Couples
Mature Single
Young Independent Singles
At Home Singles

©Analytix Business Intelligence 2012
www.analytixbi.com
8
Search (17%) was the most popular Internet activity among all infant cereal consumers across selected brands, followed by Email
(15%) and social networking (12%).
0%
5%
10%
15%
20%
25%
Top 10 Internet activities by infant cereal brands
Total
Nestle Jars
Nestle Baby Delight
Nestle Baby Menu
Purity Bottled JarredFoods
Purity BoxedMeals/Desserts
Purity Juices
Source: AMPS 2011A (Adults 15+ years)
Sample Size: 1 716 (Users of infant cereal product)
Based on unweighted numbers, see beginning of section for brand sample sizes.
SAMPLE FROM REPORT TOP 10 INTERNET ACTIVITIES