sources of error in epidemiological studiesresearch.fums.ac.ir/upload/15/05/03/1-error in...
TRANSCRIPT
Sources of error in epidemiological studies
“Bias, Confounding and the Role of Chance”
Mobasheri Farzaneh
MSc of Epidemiology
Fasa University of Medical Sciences
By the end of the lecture fellows will be able to
• Identify different types of error
• Define bias, confounding, chance
• Identify different types of bias
• Explain how bias & confounding affect risk estimates
• Develop strategies to minimise type of error
2
Epidemiologic Study
What do epidemiologists do?
1. Measure effects
2. Attempt to define a cause
an estimate of the truth
3

Estimated effect: the truth?
Mayonnaise Salmonella
RR = 4.3
Bias? Chance? Confounding?
True association?
4
To Show a Valid Statistical Association
We need to assess:
• Bias: whether systematic error has been built into the study design
• Confounding: whether an extraneous factor is related to both the disease and the exposure
• Role of chance: how likely is it that what we found is a true finding
5
Type of error
Random error
Systematic error
6
Random error
Deviation of results and inferences from the truth, occurring only as a result of the operation of chance. Can produce type 1 or type 2 errors.
Type 1 - observing a difference when in truth there is none.
Type 2 - failing to observe a difference when there is one.
7
Protection against random error
i. establishing that the result must be unlikely to have occurred by chance (e.g. p < .05).
ii. providing adequate sample size
8

X
freq
uen
cy
the distribution of X
with no random error
the distribution of X
with random error
Random error
9

X
freq
uen
cy
the distribution of X
with no systematic error
the distribution of X
with systematic error
Systematic error
10
Main sources of Systematic error
1. Selection bias
2. Information bias
3. Confounding bias
12

Definition of bias:
Systematic, non-random deviation of results
and inferences from the truth, or processes
leading to such deviation.
Any trend in the collection, analysis,
interpretation, publication or review of data
that can lead to conclusions which are
systematically different from the truth.
What is Bias?
13

Selection Bias
Selective differences between comparison groups that impacts on relationship between
exposure and outcome
Usually results from comparative groups not coming from the same study base and not
being representative of the populations they come from
14

Selection bias
Two main reasons:
Selection of study subjects
Factors affecting study participation
association between exposure and disease differs between those who participate and
those who don’t
15

Selection Bias Examples
Case-control study:
Controls have less potential for exposure than cases
Outcome = brain tumor
exposure = overhead high voltage power lines
Cases chosen from province wide cancer registry
Controls chosen from rural areas
Systematic differences between cases and controls 17

Selection Bias Examples
Cohort study:
Differential loss to follow-up
Especially problematic in cohort studies
Subjects in follow-up study of multiple sclerosis may differentially drop out due to disease severity
Differential attrition selection bias 18
Selection Bias Examples
Self-selection bias:
- You want to determine the prevalence of HIV infection
- You ask for volunteers for testing
- You find no HIV
- Is it correct to conclude that there is no HIV in this location?
19

Selection Bias Examples Diagnostic or workup bias:
Also occurs before subjects are identified for study
Diagnoses (case selection) may be influenced by physician’s knowledge of exposure
Example:
- Case control study – outcome is pulmonary disease, exposure is smoking
- Radiologist aware of patient’s smoking status when reading x-ray – may look more carefully for abnormalities on x-ray and differentially select cases
Legitimate for clinical decisions, inconvenient for research
20

Information/Measurement/ Misclassification Bias
Method of gathering information is inappropriate and yields systematic errors in measurement of exposures
or outcomes
non-differential
differential
21
Information Bias
Sources of information bias:
Subject variation
Observer variation
Deficiency of tools
Technical errors in measurement 22
Information Bias Examples
Recall bias: Those exposed have a greater sensitivity for
recalling exposure (reduced specificity)
- specifically important in case-control studies - when exposure history is obtained retrospectively cases may more closely scrutinize their past history
looking for ways to explain their illness - controls, not feeling a burden of disease, may less
closely examine their past history 23

Information Bias Examples
Surveillance bias:
the group with the known exposure or
outcome may be followed more closely or
longer than the comparison group
Hawthorne bias:
Individuals who are aware of being participants of a study behave differently 24
Information Bias Examples
Interviewer Bias:
an interviewer’s knowledge may influence the structure of questions and the manner of
presentation, which may influence responses
Observer Bias:
observers may have preconceived expectations of what they should find in an examination
25
Chance vs. Bias
Chance is caused by random error
Bias is caused by systematic error
Errors from chance will cancel each other out in the long run (large sample size)
Errors from bias will not cancel each other out whatever the sample size
Chance leads to imprecise results
Bias leads to inaccurate results
26

Errors in epidemiological studies
27
How to control for bias?
1.Be purposeful in the study design to minimize the chance for bias
Example: use more than one control group
2.Clear definition of study population
3.Explicit case, control and exposure definitions.
28
How to control for bias?
4.Define, a priori, who is a case or what
constitutes exposure so that there is no overlap
CC: Cases and controls from same population Same possibility of
exposure
Cohort: selection of exposed and non-exposed without knowing
disease status
29

How to control for bias?
5.Set up strict guidelines for data collection
Train observers or interviewers to obtain data in the same fashion
6.Randomly allocate observers/interviewers data collection assignments
7.Use multiple sources of information
30
How to control for bias?
8.Institute a masking process if appropriate • Single masked study
• Double masked study
• Triple masked study
9.Build in methods to minimize loss to follow-up
10.Standardise measurement instruments
31
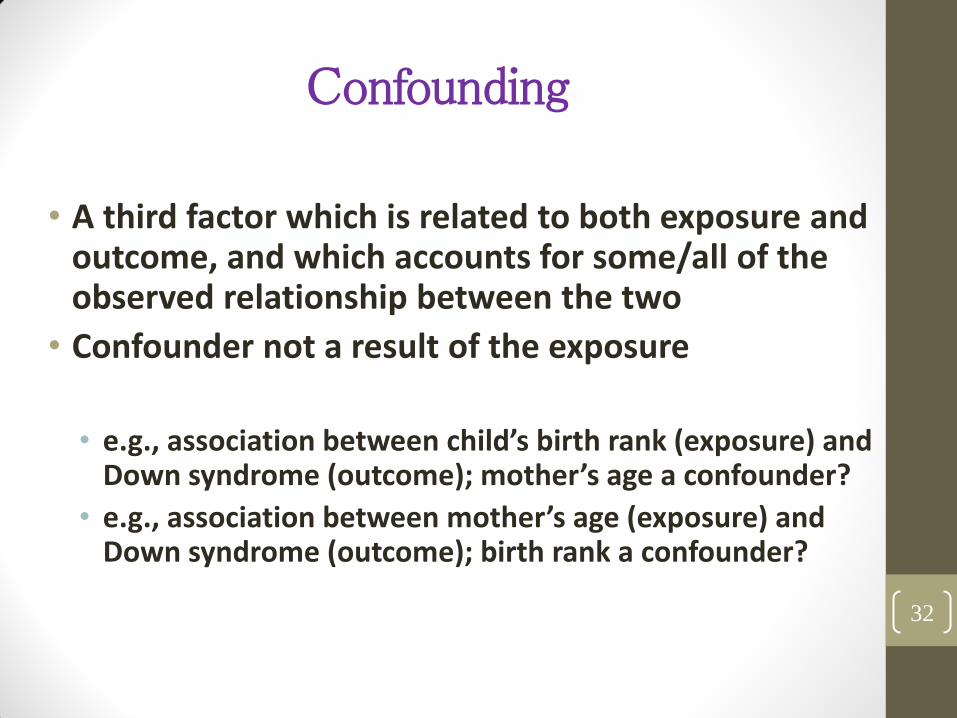
• A third factor which is related to both exposure and outcome, and which accounts for some/all of the observed relationship between the two
• Confounder not a result of the exposure
• e.g., association between child’s birth rank (exposure) and
Down syndrome (outcome); mother’s age a confounder?
• e.g., association between mother’s age (exposure) and Down syndrome (outcome); birth rank a confounder?
Confounding
32
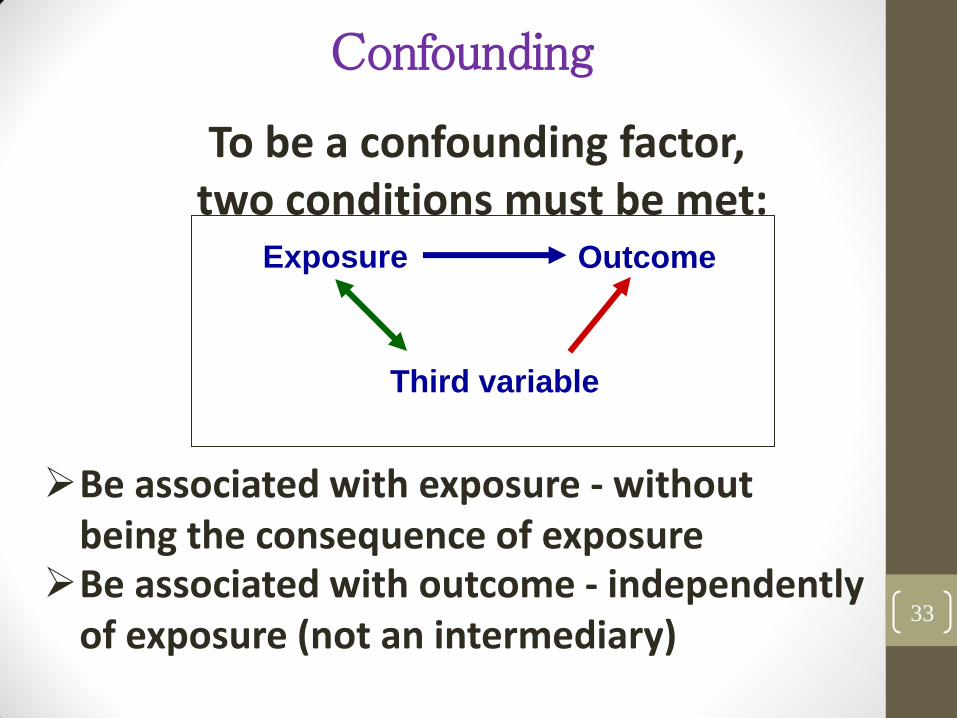
Exposure Outcome
Third variable
To be a confounding factor, two conditions must be met:
Be associated with exposure - without being the consequence of exposure
Be associated with outcome - independently
of exposure (not an intermediary)
Confounding
33

Diet CHD
Cholesterol
Confounding ?!!!
On the causal pathway
34

Birth Order Down Syndrome
Maternal Age
Confounding
Maternal age is correlated with birth order and a risk factor even if birth
order is low 35

Birth Order
Down Syndrome Maternal Age
Confounding ?!!!
Birth order is correlated with maternal age but not a risk factor in younger
mothers 36

Coffee CHD
Smoking
Confounding
Smoking is correlated with coffee drinking and a risk factor even for those
who do not drink coffee 37
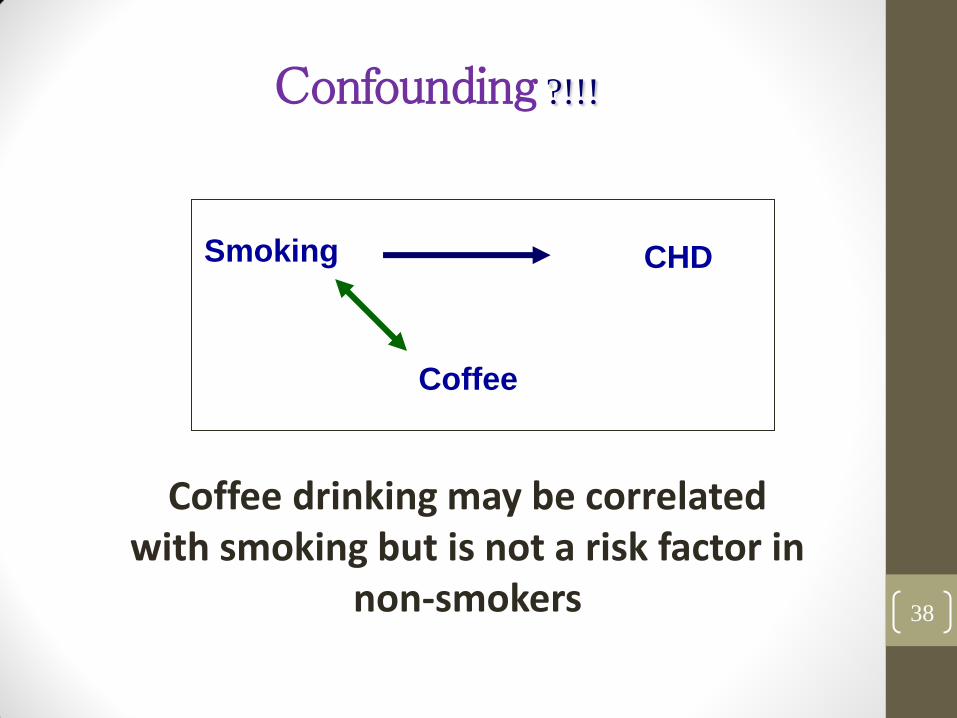
Coffee
CHD Smoking
Confounding ?!!!
Coffee drinking may be correlated with smoking but is not a risk factor in
non-smokers 38

The difference between bias and confounding
Bias creates an association that is not true, but confounding describes an
association that is true, but potentially misleading.
39

Warning!
• Chance and confounding can be evaluated
quantitatively
• Bias is much more difficult to evaluate
• Minimise by design and conduct of study
• Increased sample size will not eliminate bias
40
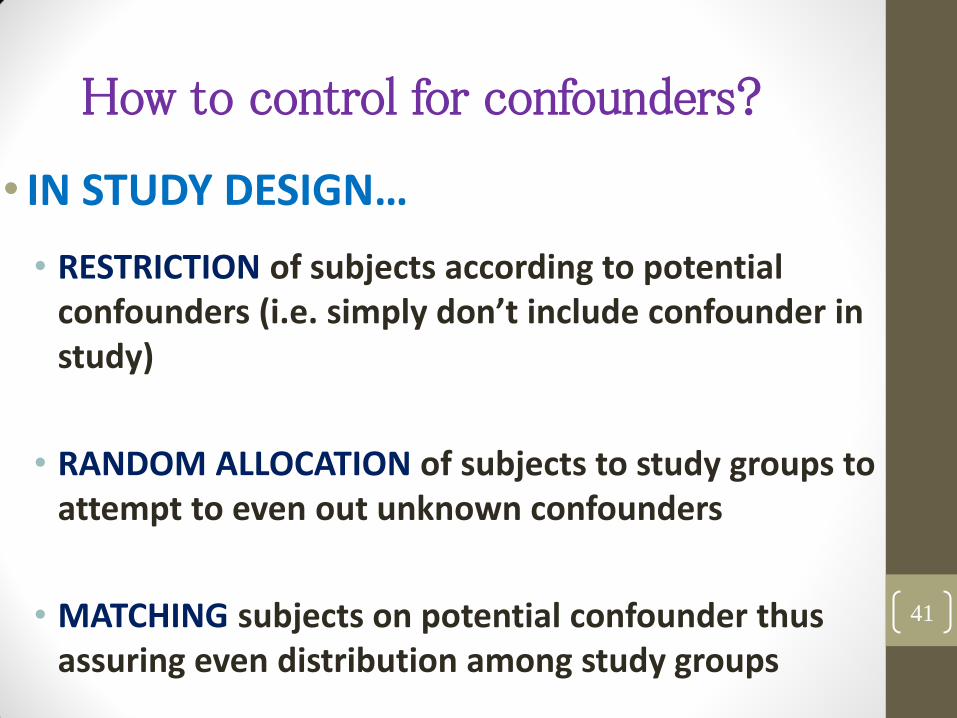
How to control for confounders?
• IN STUDY DESIGN…
• RESTRICTION of subjects according to potential confounders (i.e. simply don’t include confounder in study)
• RANDOM ALLOCATION of subjects to study groups to attempt to even out unknown confounders
• MATCHING subjects on potential confounder thus assuring even distribution among study groups
41

How to control for confounders?
• IN DATA ANALYSIS…
• STRATIFIED ANALYSIS using the Mantel Haenszel method to adjust for confounders
• RESTRICTION is still possible at the analysis stage but it means throwing away data
• MODEL FITTING using regression techniques 42

43