sources of bank charter value - federal deposit insurance ... · sources of bank charter value...
TRANSCRIPT

1
Sources of Bank Charter Value
Frederick T. Furlong
and
Simon H. Kwan
Federal Reserve Bank of San Francisco
September 2006
Abstract
The bank charter values have risen substantially since the early 1990s, reversing a decades-long slump. The rebound coincided with notable changes in the environment of banking potentially affecting the degree of competition, operating efficiency, as well as the scope of activities. In addition, banks have been operating under favorable economic conditions. This study investigates the extent to which the charter values among publicly traded banking holding companies have been tied to institution-specific characteristic reflecting traditional banking activities, innovation in product lines, degree of efficiency, and size. Among the key findings, bank charter value ratios are positively related to the share of funding accounted for by core deposits. The intensity of the effect, however, has not increased systematically, even with consolidation in banking. Another notable result is the strong, positive and growing impact of reliance on non-interest income on charter values of the largest banking organizations. This suggests that the largest organization have not over-extended their reliance on activities that generate non-interest income. On the other hand, our findings indicate that the market is less sanguine about reliance on non-interest income among BHC more generally. The analysis also points up the role of improved efficiency in lifting bank charter values but argues against the rise being due to an increase in the option value of the federal safety net for emerging mega-banks that might be deemed too-big-to-fail. It also appears that a good deal of the movement and general rise in bank charter values may have been due to favorable economic conditions since the early 1990s. Key words: bank charter value, core deposits, non-interest income, operating efficiency JEL classification: G21, G32, G34 Please send correspondence to Fred Furlong, Research Department, Federal Reserve Bank of San Francisco, 101 Market Street, San Francisco CA 94105, U.S.A. Email: [email protected] Telephone: 415-974-3205 Thanks are due to Zena Knight for absolutely excellent research assistance. Helpful comments from participants at the Basel Committee Research Task Force Workshop on Banking and Financial Stability in Vienna are gratefully acknowledged. The views expressed in this paper are the authors and do not necessarily represent the views of the Federal Reserve Bank of San Francisco or the Federal Reserve System. All remaining errors are ours.

2
Sources of Bank Charter Values
I. Introduction
Positive bank charter values can arise if there is something special about the activities
carried out by banks compared to other financial firms and entry into banking is limited. Given
some degree of market power among banks, charter values also may vary due to industry wide
and firm specific factors affecting efficiency.1 Developments affecting these conditions would
be expected to change bank charter values.
Indeed, an increase in competition in banking and financial services more generally that
was becoming evident in 1960s is argued to have contributed to the erosion of bank charter
values in the 1970s and into the 1980s. Measured by the ratio of market-to-book value of assets,
Keeley (1990), for example, finds that the average charter value ratio among a panel of large
bank holding companies (BHCs) fell sharply in the 1970s and recovered only partially by the
mid-1980s. The analysis in this article shows that bank charter values fell on balance in the
second half the 1980s and were negative or close to zero for a large portion of the publicly traded
BHCs by 1990.
However, since the early 1990s, charter values among banking organizations have
rebounded. As of 2003, the vast majority of publicly traded BHCs had positive charter values
measured by the difference between market-value equity and book-value equity. The overall rise
in charter values has been anything but steady, surging and ebbing. This period of change in
charter values provides the opportunity to identify factors that account for differences in bank
charter values and how their effects may have changed given shifts in the banking environment.
Regarding such shifts, banking has been affected by at least four major changes with
potential to impact charter values. One is the massive restructuring through consolidation and
geographic expansion. A second is the growth in reliance on non-interest revenue from fees on
deposit services, loan guarantees and services, securities trading, brokerage services, etc. A third
is improved operating efficiency that likely reflects in part the adoption of new technologies for
1 See Smirlock and Gilligan (1984).
3
processing information and managing risk. The fourth area of changes is the supervisory and
regulatory changes aimed at containing bank risk-taking and curbing the potential distortion from
under-priced deposit insurance and federal safety net more generally.
This study investigates which factors accounted for differences in bank charter values
using quarterly data for publicly traded BHCs for the period 1986 through 2003. In particular,
we examine the extent to which charter values among publicly traded BHCs have been tied to the
provision of traditional core deposit services and portfolio lending or activities associates with
non-interest revenue. We also examine how the effects may have changed over time for
evidence on whether reduced competition in traditional banking lines or shifts in product mix
have been associated with the rise in bank charter values. In addition, the empirical analysis
provides evidence relating to possible changes in the effects among the larger banking
organization of what might be called a too-big-to-fail policy. The analysis also looks at the role
of efficiency in accounting for differences in charter values among banks and the general rise in
charter values over time.
For the more traditional banking activities, the evidence suggests that core deposit
taking overall contributes to charter values for BHCs, similar to results in Keeley (1990). 2 It
does not appear, however, that the effects have increased as charter values have risen, and in fact
look to have weakened somewhat in more recent years among smaller BHCs. This suggest that
banks in general earn rents from providing core deposit services, but their ability to exercise
market power has not change appreciably even with the large scale consolidation of the industry.
The effects of portfolio lending vary by BHC size and loan type. In general, concentration in
business lending tends to reduce charter values relative to other types of activities, while higher
shares of consumer loans boost relative charter values mainly among large BHCs, as do higher
shares of real estate loans for medium and small BHCs. For large and medium size BHCs, the
effects on charter value associated with portfolio lending were less positive or more negative
after the mid-1990s.
2 Core deposits are defined as transactions deposits and small denomination (less than $100,000 balance) savings and time deposits at banks. Keeley (1990) included transactions deposits.

4
The findings also indicate that reliance on fee-based and other off-balance sheet
activities, as reflected in shares of net operating income accounted for by non-interest income,
have a consistent and positive impact on charter value ratios only among very largest BHCs.
Moreover, for these BHCs, the intensity of the effect has undergone swings since the mid-1990s,
rising on balance, thus contributing to the variation as well as the net gain in charter values. This
is a particularly interesting finding given the results in Stiroh (2005a) showing rates of return on
market equity are not higher for non-interest income activities at BHCs.3 That finding is more
consistent with the analysis in our study showing that, for other then the very largest BHCs, the
market is less sanguine about reliance on activities generating non-interest income relative to
other activities.
Potentially relevant to policy measures intended to affect a too-big-to-fail policy,
among the very largest BHCs, the negative effect of size on relative charter value has intensified
over time. This is consistent with policy measures having reduced market expectations for too-
big-to-fail rescues of large BHCs, though it might also reflect the effects of diseconomies of
scale or restrictions on potential growth. For medium and smaller BHCs, on the other hand, the
positive effect of size on charter value has intensified over time. For those size groups, this more
likely reflects size being associated with the opportunities for exercising expanded activities or
the likelihood of being acquired than increased value of the federal safety net. Efficiency has a
strong and consistent impact on relative charter values of BHCs.
The next section discusses movements in bank charter values over the past several years
and developments that may have affected them. Section III identifies several changes in the
environment for banking and discusses the possible implications for charter values. Section IV
presents the empirical model used to test for the influences on bank charter values. Section V
presents the empirical results and conclusions are discussed in Section VI.
3 Stiroh (2005a) argues that risk adjustment returns on market equity are lower for activities that generate non-interest income compared to those generating interest income. Stiroh (2005b) finds similar results using accounting data.
5
II. Rebound in bank charter values
A positive bank charter value indicates that an institution has some degree of market
power—that is, it is expected to earn economic rents. To the extent that activities carried out by
a bank are special, with limited entry into banking, rents could reflect the ability to secure
deposits at below market interest rates or to earn a higher risk-adjusted return when extending
credit and credit guarantees. Also, given some degree of market power among banks, charter
values may vary over time and among banks due to industry wide as well as firm specific factors
affecting overall efficiency or efficiency in providing selected services.
The charter value of a bank then would represent the present value of the expected stream
of rents. Ex ante, that would be equivalent to the difference between the market value of a
bank’s equity and the value of equity invested by the bank’s shareholders. The relative market
power of a bank, then, could be represented by the ratio of the market value of equity to the
equity invested. The ratio would be equal to one in absence of market power and greater than
one depending on the relative market power of a bank.4
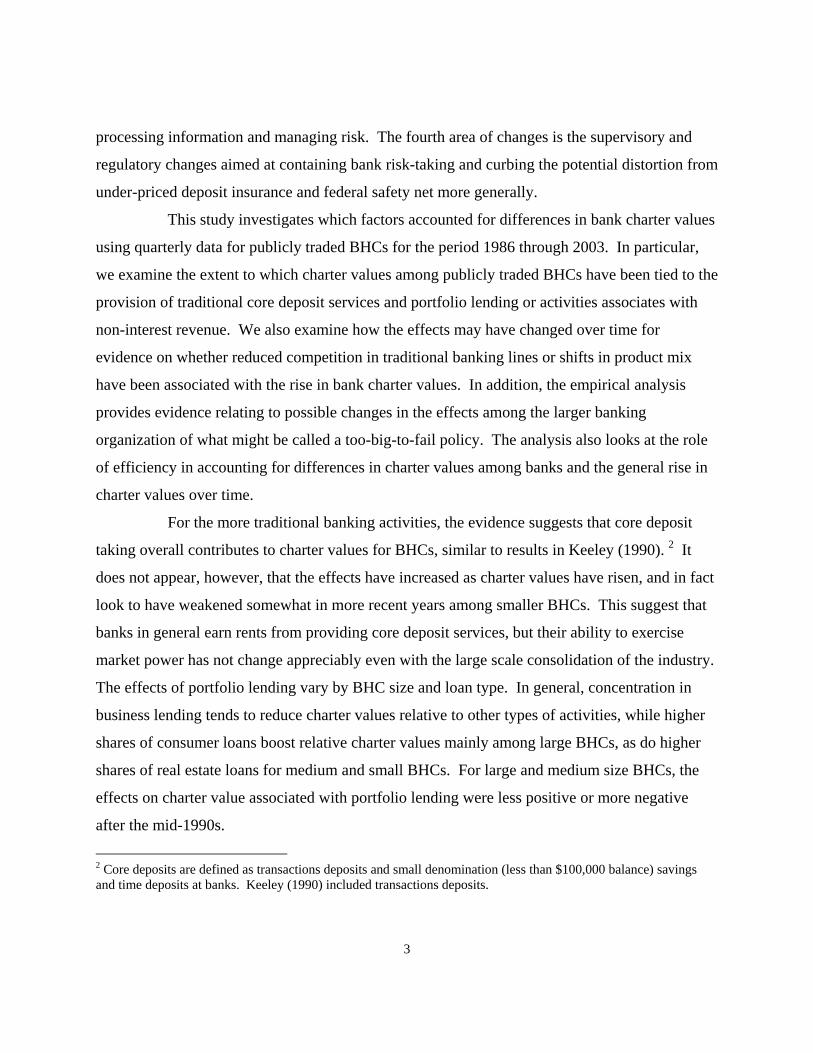
An estimate, albeit, ex post, of bank relative charter value is the ratio of an organization’s
market value of equity to its book value of equity.5 Figure 1 shows the median value of the
ratios for three groupings of publicly traded BHCs for the period 1986 through 2003. In the
figure, BHCs are grouped by size related to their percentile ranking of total assets. In each
quarter, banking organizations in the top tenth percentile by maximum total assets are classified
as Large. Firms at the fiftieth to the ninetieth percentile are Medium, and firms in the bottom
fiftieth percentile are Small.
In the second half of the 1980s, the medians for the three size groups were similar and all
moved below one by the middle of 1990; that is, over half of the BHC had negative estimated
4 Other studies, including Keeley (1990), employ an ex post Tobin Q measure calculated as the ratio of market-value assets (market equity plus book liabilities) to book-value assets. The ratio of market equity to book-value has is highly correlated with the ex post Q measure. 5 As pointed out by Keeley (1990) for his empirical estimate of Q, the relative charter value in this study measures the ex ante ratios with error. One reason is that book value of equity will reflect the historical cost of assets bought and sold as well as the mix of favorable and unfavorable outcomes affecting portfolio values captured by accounting measures.
6
charter values. This low point for banking also was marked by high failure rates and losses
among many surviving banks. In the wake of this period of adjustment, charter values began to
rise and by 1993 the median charter value ratios had recovered to levels prevailing in the mid-
1980s. Subsequently, charter values surged through 1997, before declining. For the Large
BHCs the partial retracing of median charter value ratio continued through 2002. The retracing
of the medians for the Medium and Small BHCs was quicker and more complete, hitting levels
that were about the same as in 1993. For these later groups of BHCs, the rise in charter values
starting in 2000 can account for just about all the net gain in the median charter value ratios since
the mid-1980s.
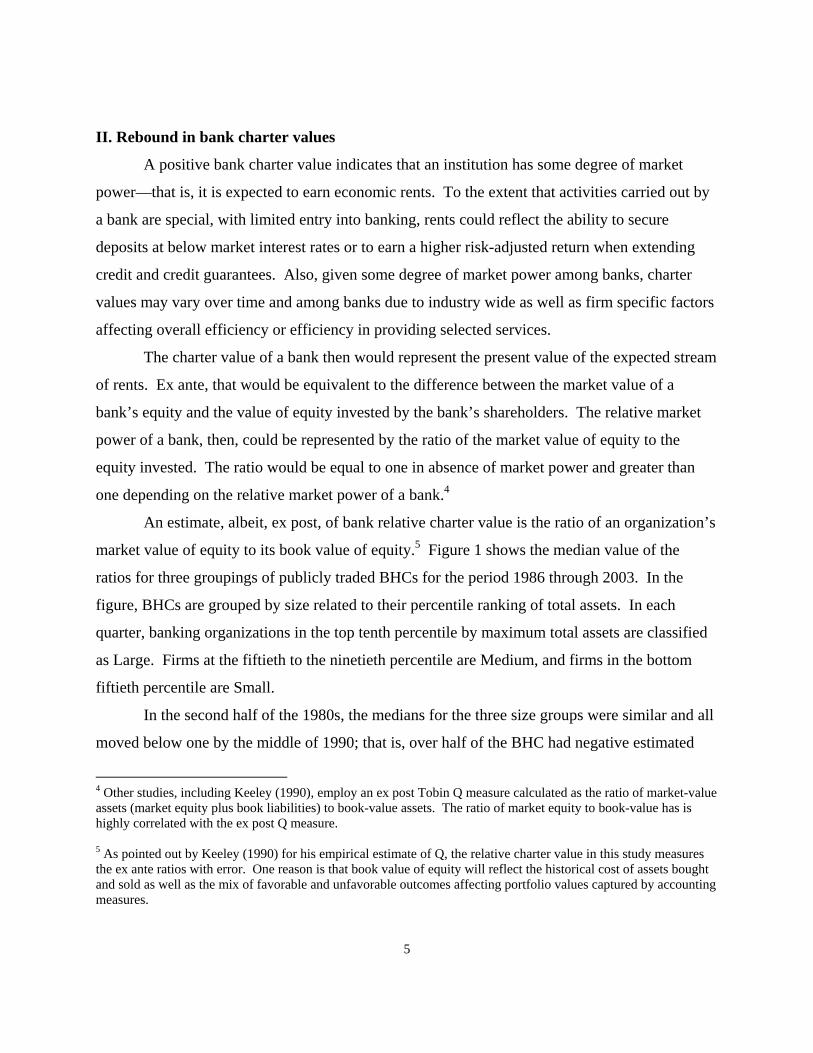
The extent of the net shift in the distribution of estimated charter value ratios since the
lows in 1990 is illustrated in Figure 2. The figure shows the distribution (kernel densities) of the
estimated charter value ratios in June 1990 and in December 2003 for the three groups of BHCs
combined. As of the latter date, virtually all of the BHCs in the sample had positive estimated
charter values (ratios greater than one).
III. Banking developments
This broad-based turnaround in banking has occurred as the environment for banks has
undergone fundamental changes that may have affected charter values. One development is the
massive restructuring of banking that may have affected the degree of competition as well as
efficiency in banking. Another is changes in the use of fees and product mix among banking
organizations related to greater integration of financial services and greater emphasis on off-
balance activities. A third is the adoption of technology affecting operating efficiency. A fourth
is the set of legislative, regulatory and supervisory changes targeted at containing risk taking in
banking and addressing the moral hazard problem associated with under-price deposit insurance
and the federal safety net more generally.
Restructuring
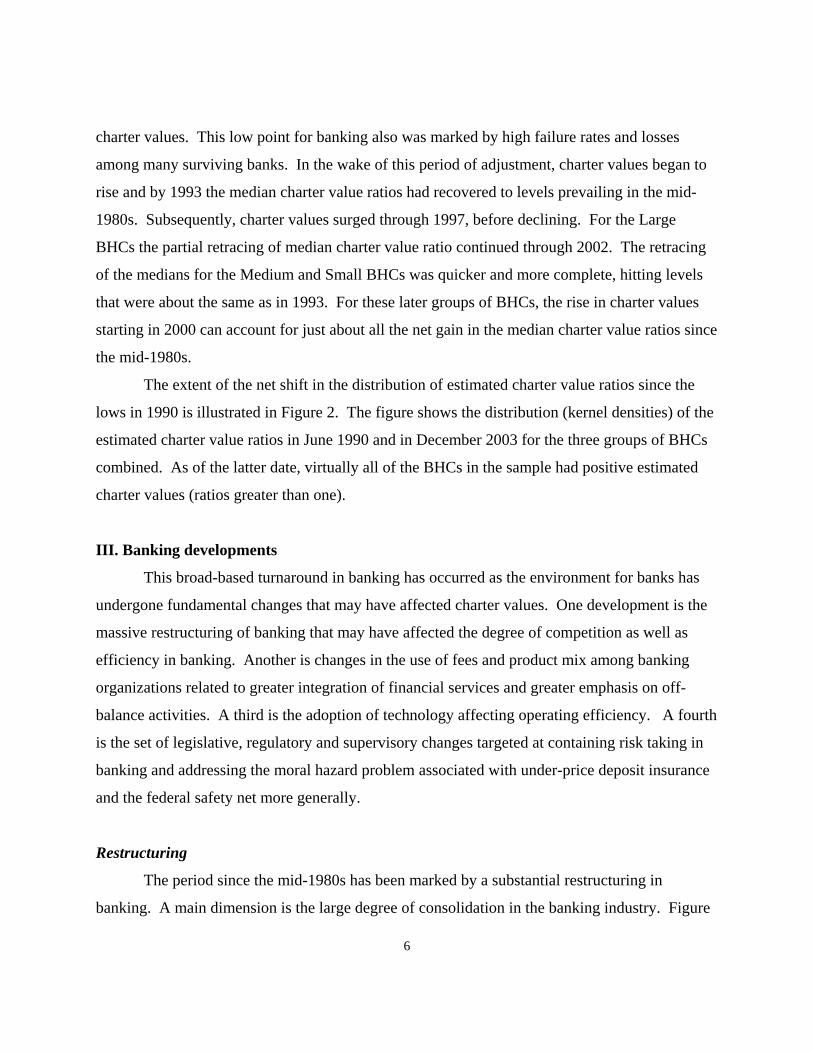
The period since the mid-1980s has been marked by a substantial restructuring in
banking. A main dimension is the large degree of consolidation in the banking industry. Figure
7
3 shows the number of commercial banks in the U.S. from 1986 to 2003. In part, the
consolidation reflects the large number of bank failures and problem bank resolutions in the late
1980s and early 1990s. This purging of less profitable institutions with low charter values could
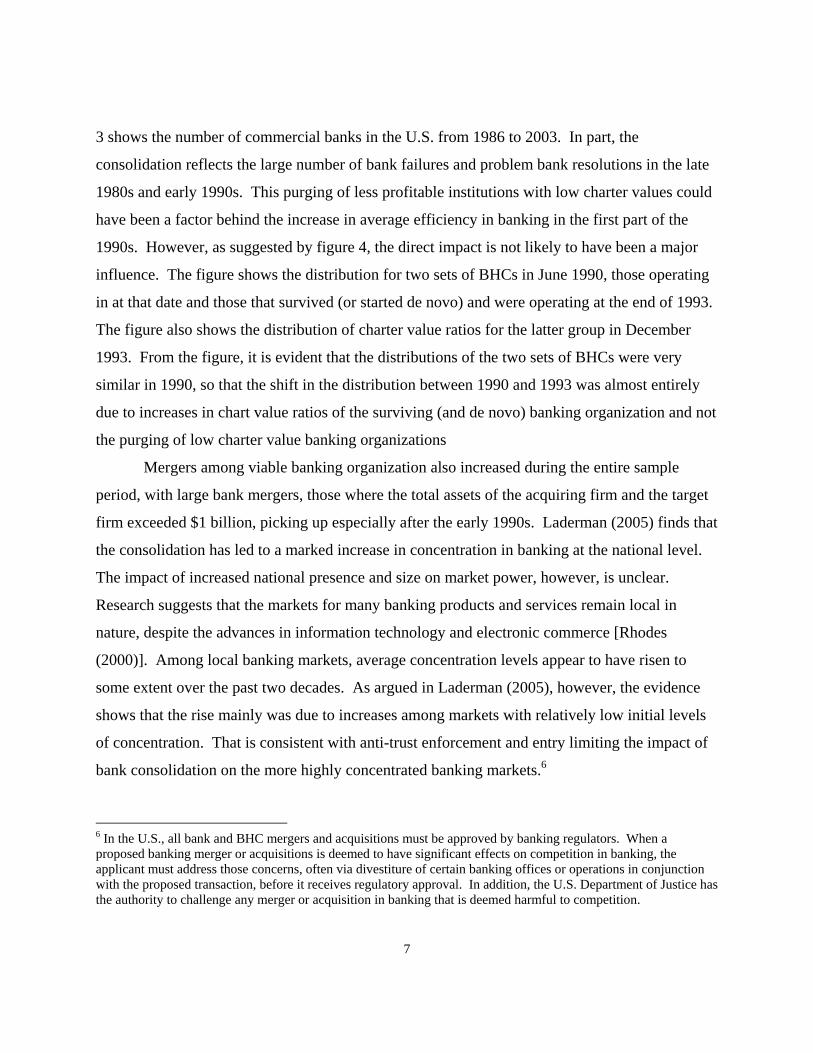
have been a factor behind the increase in average efficiency in banking in the first part of the
1990s. However, as suggested by figure 4, the direct impact is not likely to have been a major
influence. The figure shows the distribution for two sets of BHCs in June 1990, those operating
in at that date and those that survived (or started de novo) and were operating at the end of 1993.
The figure also shows the distribution of charter value ratios for the latter group in December
1993. From the figure, it is evident that the distributions of the two sets of BHCs were very
similar in 1990, so that the shift in the distribution between 1990 and 1993 was almost entirely
due to increases in chart value ratios of the surviving (and de novo) banking organization and not
the purging of low charter value banking organizations
Mergers among viable banking organization also increased during the entire sample
period, with large bank mergers, those where the total assets of the acquiring firm and the target
firm exceeded $1 billion, picking up especially after the early 1990s. Laderman (2005) finds that
the consolidation has led to a marked increase in concentration in banking at the national level.
The impact of increased national presence and size on market power, however, is unclear.
Research suggests that the markets for many banking products and services remain local in
nature, despite the advances in information technology and electronic commerce [Rhodes
(2000)]. Among local banking markets, average concentration levels appear to have risen to
some extent over the past two decades. As argued in Laderman (2005), however, the evidence
shows that the rise mainly was due to increases among markets with relatively low initial levels
of concentration. That is consistent with anti-trust enforcement and entry limiting the impact of
bank consolidation on the more highly concentrated banking markets.6
6 In the U.S., all bank and BHC mergers and acquisitions must be approved by banking regulators. When a proposed banking merger or acquisitions is deemed to have significant effects on competition in banking, the applicant must address those concerns, often via divestiture of certain banking offices or operations in conjunction with the proposed transaction, before it receives regulatory approval. In addition, the U.S. Department of Justice has the authority to challenge any merger or acquisition in banking that is deemed harmful to competition.

8
An important element of the restructuring of banking has been interstate expansion. This
interstate dimension of restructuring was facilitated by the Riegle-Neal Interstate Banking and
Branching Efficiency Act of 1994 (Riegle-Neal) that permitted interstate bank mergers starting
in 1997. In the years leading up to Reagle-Neal, most states had taken steps to liberalize rules
for entry by out-of-state banking organizations. Reagle-Neal opened the way for nationwide
interstate banking and, very importantly, interstate branching. Prior to the act, a banking firm
had to enter a new state by a separately chartered bank subsidiary of the holding company.
Indeed, among large bank mergers, the number of interstate mergers where the acquirer and the
target were headquartered in different states escalated noticeably after the passage of Reagle-
Neal.
To the extent that these large interstate bank mergers were market-expansion mergers,
where the acquirer and the target had little overlapping operations in their respective local
banking markets, they contribute to banking concentration at the national level but not in local
banking markets. Even if market power in banking is tied to local market conditions, interstate
mergers still could have affected charter values.7 Jayaratne and Strahan (1998), for example
provide empirical evidence regarding the effects of easing branching restrictions. They showed
that bank performance improved significantly after state restrictions on bank expansion were
lifted. Specifically, operating costs and loan losses decreased after states permitted statewide
branching and, to a lesser extent, after states allowed interstate banking. They argued that
improvements following branching deregulation appeared to occur because more efficient banks
grew at the expense of their less efficient rivals and the reductions in banks' costs were passed
along to bank borrowers in the form of lower loan rates.8 However, they do not show that all the
cost savings were passed on to bank customers, so charter values of successful banking
7 Research on mega bank mergers suggests that merged banks did experience higher profit efficiency from increased revenues, stemming from providing higher value-added products and services to customers than a group of individual banks [see for example, Akhavein, Berger, and Humphrey (1997)]. 8 Keeley (1990) finds that the easing of intra-state banking restrictions tended to lower bank charter values, though the relaxation of a state’s inter-state branch restrictions did not have a statistically significant effect on charter values.
9
organizations may still have increased. Even banks with market power would be expected to
lower loan rates, for example, in the wake of improved efficiency (lower marginal costs).9
Expanded product mix and off-balance sheet activity
Innovations in financial services such as the growth in securitization and the expansion of
derivatives have led to changes in product mixes among banking organizations. While market
making in derivative, for example, is limited to only a few large banking organizations, even
medium and smaller banking organizations have increased reliance on fee income relative to
interest income. For these banks, the rents associated with fee income would represent an
intangible asset that would not be fully reflected in their balance sheets.10
Another development that has turned out to be relevant mainly to larger banking
organization is greater financial integration. Full affiliation of commercial banking with other
financial services became a reality with Gramm-Leach-Bliley Act (GLB), signed into law in
November 1999. Before the act was passed banks and other financial firms had to take a variety
of side routes to integrate financially (see Furlong 2000). Perhaps the best example of a side
route to financial integration is one that banks have used to get involved in securities
underwriting--the so-called Section 20 securities subsidiary. The Federal Reserve first
authorized such a subsidiary in 1987 (see Kwan 1998). Banks also have gotten into insurance
through side routes.11
While the path to fuller financial integration involves nearly two decades of debate and
false starts, serious momentum was evident in 1997 and 1998 prior to the enactment of GLB.
One marker was the full mockup of the legislation H.R. 10, the Financial Services
9 In another possible avenue of effect from consolidation in banking, the value of the banking franchise could benefit from gains in diversification due to market or product expansions. See for example, Mester, Huges, Lang, and Moon (1999), Kwan (1998), and Kwan and Laderman (1999). 10 In the case of mergers, if the transaction is accounted for using the purchase method, the value of intangible assets of the acquired entity will be reflected in good will on the balance sheet of the combined firm.

10
Competitiveness Act in June of 1997. Another was the creation of Citigroup, which combined
Citicorp, a large bank holding company, with Travelers, a large insurance company. The merger
was formally announced in April 1998 and consummated in October of that year. But this move
to integration is not really representative of organizations taking a side route. Instead, the
creation of Citigroup is better viewed as a move in anticipation of the main path being opened up
by the passage of legislation like GLB.
The combination of scope economies and potential efficiency enhancement codified by
GLB could have contributed to the increase in some banking organizations’ charter values. In
this regard, during the period leading up to GLB, it seems likely that the market’s views on both
the likelihood of the ultimate legislation as well as the implication of fuller financial integration
for banking were in transition. Moreover, in the period after GLB, the market had more
information on the extent of the take-up and payoff for banking organization from the
opportunities for financial integration.
A general indication of the extent of the shift in product mix and reliance on fee income
in banking that has taken place is the movement in the relative importance of non-interest
income. Figure 5 shows the medians of the ratio of non-interest income to the sum of net-
interest income and non-interest income at BHCs since the mid-1980s. In the figure, BHCs are
grouped by size related to their percentile ranking of total assets, as in Figure 1. It is clear that
shares of non-interest revenues rose during our study period, particularly among Large BHCs.
How might new services and off-balance sheet activities affect charter values? First,
there could be at least temporary rents associated with first-mover effects. There also could be
scope economies with other bank activities, giving banks a cost advantage over other non-bank
financial institutions. For some more traditional off-balance sheet activities such a loan
commitments banks may also have a comparative advantage. Similarly, rents related to fees for
11 For example, some states passed laws allowing state-chartered banks to sell insurance, and the Comptroller of the Currency’s interpretation of federal law permitted national banks to sell insurance nationally from offices in small towns.

11
deposit services may merely reflect extant market power associated with deposit taking more
generally.
There is some previous empirical evidence suggesting a shift in product mix and use of
fees contributed to the rise in bank chart values. For example, event studies suggested that the
passage of the GLB Act increased shareholders’ wealth (added to charter values) at least among
larger banking institutions [Carow (2001a, 2001b), Carow and Heron (2001), Carow and Kane
(2001) and Collins, Kwag, and Yildirim (2002)]. On the other hand, Stiroh (2005a and 2005b)
finds that higher share of non-interest income are associated with lower risk-adjusted returns.
Advances in technology
Another macro development that may have had important implications for bank charter
values is advances in information technology (IT). As an information-based industry, banks
tended to be early investors in IT, permitting banking firms to reduce the cost of back-office
operations and facilitating innovations in financial products and delivery systems [see Berger
(2003)]. For example, traditional banking services likely have been enhanced by the
proliferation of ATMs, greater use of banking phone centers, and the Internet.
There is some evidence that increases efficiency in banking began in earnest in the early
1980s. Furlong (2001) showed that labor productivity growth in banking turned up sharply in
the early 1980s and continued at a strong pace into the 1990s. The acceleration was evident in
both the labor productivity measure used by the Bureau of Economic Analysis and in the
measure of value-added in banking relative to labor inputs.12
In considering the implications of these developments, the initial timing of the boost to
labor productivity in banking suggested that the impetus for firms to push for greater labor
productivity coincided with deregulation and increased competition. This suggests that there
likely were downward pressures on charter values at the same time productivity in banking
began to rise. Indeed, bank charter values did languish in the 1980s. However, the longer-run
12 In Furlong (2001) value-added in banking is measured as the sum of the net-interest income and gross-non-interest income. Labor inputs are measured as the number of employees and the dollar value of personnel expenses.
12
effect may have been to eliminate less efficient banking organizations. In addition, technological
innovations have not just lowered that cost of providing traditional banking services, they
enabled expansion into new activities and the growth of more sophisticated financial services
activities that has changed the quality and nature of bank outputs.
Whether due to restructuring, the adoption of information technology or expanded
economies of scale and scope, overall efficiency in banking appears to have increased since the
early 1990s. Figure 6 shows one measure of efficiency, the ratios of the sum of net-interest
revenue and non-interest revenue to non-interest expenses, for the different size groupings of
banking organizations. This ratio is an estimate of the value-added in banking relative to net
operating expenses, and abstracts from expenses related to allocations to loan loss reserves. For
each grouping, the ratio shows a pickup after the early 1990s, with the rise most notable among
large banking organizations.
To the extent that banks retained market power, at lease some of the improvements in
operating efficiency would be expected to be captured by banks and thus add to charter values.
Moreover, to the extent that more efficient banks are more likely to survive over time, they
would be seen by the market as more likely to realize rents associated with their charter over a
longer horizon.13
Option value of the federal safety net
The market value of a bank also can reflect the option value of federal protection,
including under-priced deposit insurance and being perceived by the market as being too-big-to-
fail. In this regard, the Federal Deposit Insurance Corporation Improvement Act of 1991
(FDICIA) was passed to reform the deposit insurance system and address the issue of too-big-to-
fail. While a main goal of the act was to recapitalize the depleted deposit insurance funds, the
aim of other major provisions was to lessen the moral hazard problem associated with the
13 Improved efficiency in banking, as measured in Figure 6, could raise charter values if some or all of the cost savings are retained by shareholders. Note, however, this measure of efficiency also would capture change in revenues relative to cost due to changes in market power or a shift to services with higher value-added relative to costs (that is, those that earn higher rents).
13
government deposit insurance program. These provisions include: Prompt-Corrective-Action
requiring the FDIC to intervene with troubled banks earlier and more vigorously based on the
levels of book-value capital ratios; risk-based insurance premiums allowing the FDIC to charge
insurance premia according to some simple measures of bank risk; Least-Cost Resolution
requiring the FDIC to resolve bank failures using methods which produce the least cost to the
deposit insurance system; and clarifying a too-big-to-fail policy by specifying the conditions
under which a bank is considered too-big-to-fail.
A large body of banking literature studies the effectiveness of FDICIA in redressing the
moral hazard problem inherent in the deposit insurance system [see, for example, Benston and
Kaufman (1997) and Mishkin (1997)]. The general consensus is that the FDICIA was a step in
the right direction in lessening the moral hazard problem. However, the implementation of
Prompt-Corrective-Action and risk-based deposit insurance premium may be prone to
measurement problems in both bank capital and bank risk. Thus, the deposit insurance subsidy
embedded in bank charter values may be reduced but is unlikely to have been eliminated.14
Another shortcoming of FDICIA is argued to be its too-big-to-fail provision [see Stern
and Feldman (2004) and Kaufman (2002)]. Under FDICIA, a bank can be declared too-big-to-
fail so that insured and uninsured liability holders would be protected, only if not doing so would
have serious adverse effects on economic conditions or financial stability. To invoke too-big-to-
fail, a two-thirds majority of both the Board of Governors of the Federal Reserve System and the
directors of the FDIC, as well as the approval of the secretary of the Treasury, would be required.
Hence, FDICIA effectively enacted an explicit too-big-to-fail policy and lessened its ambiguity
from the perspective of market participants. This could have increased the potential too-big-to-
fail subsidy for very large banking firms.
However, there is some evidence that suggests that bank debt holders are exposed to risk.
A number of studies find evidence that interest rates on uninsured bank-related debt were
sensitive to bank risk-taking. In the case of subordinated debts, some studies suggested that
market sensitivity to risk rose in the 1990s following the reform of prudential regulations and the
14 See Hovokimian and Kane (2000).
14
transformation of banking supervision [Flannery (1998), Federal Reserve (1999), Flannery,
Kwan, and Nimalendran (2004)].15 Krainer and Lopez (2004) also find that interest rates on
subordinate debt of BHCs tend to move in anticipation of changes in supervisory ratings,
representing further evidence that debt holder are sensitive to the risk of large banking
organizations.
In addition to the legislative measures, there have been notable changes in prudential
regulation and supervision of banks in the U.S. over the past twenty years that likely have limited
the option value of the federal safety net. As part of the legislation, FDICIA included increased
banking supervision to reform the deposit insurance program, and the GLB Act called for
umbrella supervision of financial holding companies. Another, important development in
banking supervision has been the gradual shift from emphasizing the quality of the bank loan
portfolio to the quality of the bank risk management process. For example, the traditional
CAMEL rating assigned by banking regulators upon banking examination was changed to
CAMELS to explicitly recognize the importance of risk management in the S rating.16
Studies conducted on bank supervisory ratings find they have become tougher over time.
Berger, Kyle, and Scalise (2001) suggest that commercial bank rating standards were tougher
during the credit crunch of the early 1990s, and then eased in the expansion. Krainer and Lopez
(2003) model supervisory ratings for bank holding companies during the 1990s. They relate a
BHC's supervisory rating to variables such as the BHC's lagged nonperforming loan ratio, its
loan loss reserve ratio, the capital ratio, return on assets, and its lagged rating. Their results for
the early 1990s match those of Berger, Kyle, and Scalise (2001); moreover, they find that
standards changed again in the late 1990s and early 2000. Specifically, the actual ratings
15 Flannery and Sorescu (1996) find that subordinate debt holders disciplined bank risk-taking only after 1989, and did not find any detectable bond market discipline before that. On the other hand, Covitz et al. (2002) find that, after accounting for liquidity premia, banking related subordinated debt spreads were sensitive to organization-specific risks in the mid-1980s, and that the risk sensitivity was about the same in the pre- and post-FDICIA periods. 16 CAMEL rating is the supervisory rating of the quality of bank capital (C), assets (A), management (M), earnings (E), and liquidity (L), with one being the best and five being the worst.

15
assigned in the latter period were stricter than predicted by a model based on empirical ratings
standards from the mid-1990s.
Capital regulation also appears to have become tougher since the mid-1980s, as reflected
in the substantial recapitalization in banking. Figure 7 shows book-value equity capital to assets
ratios for the different size groupings of bank holding companies. For each grouping, book-
value capital ratios began rising very sharply in the early part of the 1990s before stabilizing.17
The Large bank grouping had another surge in capitalization in more recent years. Under the so-
called charter value hypothesis higher capital ratios could be an endogenous response to higher
charter values among banks. Empirical findings in Keeley (1990) Demsetz et al. (1996) and
Suanders et al. (2001), provide support for the charter value hypothesis.18 Furlong and Kwan
(2006) also find that higher charter values are associated with higher book-value capital ratios,
though the rise in charter value since the early 1990s appears to account for only a small portion
of the net rise in capitalization among BHCs.
With the emergence of a few mega banking organizations, it still is feasible that, despite
legislative, regulatory and supervisory changes, the value of the federal safety net may have
increased for such organizations. However, given all the changes, it seems unlikely that a
change in option value of the federal safety net accounts for the rise in charter values more
generally.
IV. Empirical model of bank charter value
In a perfectly contestable market, all profits are competed away so that existing
shareholders earn just the competitive rate of return on their capital that was supplied to the firm.
In this case, the capital market values each dollar of shareholders’ equity exactly one dollar so
that the market value of capital equals the book value of capital. However, in the case where a
17 Furlong (1992) showed that the average target capital ratios for all banks from about 7% during the 1985-1989 period to almost 9% during the 1990-1991 period. This increase was observed for both large banks, which were more likely to be affected by Basel Regulatory changes, and for small banks. 18 Looking over a long-time period, Saunders et al. (2001) find that the charter value hypothesis holds for some time period such as post 1980, but not other time periods.

16
firm can earn an above-normal profit on its capital, the present value of the future stream of rents
will accrue to existing shareholders. As such, the market value of the firm’s capital equals the
sum of the book-value capital plus the present value of future rents. Thus, as indicated above,
the market-to-book value capital ratio can be used as an estimate of the relative value of a
banking organization’s charter, denoted as CV.
Following the earlier discussion, to model the determinants of CV, we allow the charter
value ratio to be a linear function of a banking firm’s deposit composition, revenue mix and loan
portfolio composition, operating efficiency, and log of size along with macro financial variables.
For the pooled time series cross-section regression we use the following empirical model:
CVi t = 20 + 21 X1it + 22 X2it + 23 X3it + 24 X4it + <it , (1)
Where:
CV = market-value equity / book-value equity;
X1 is a vector of deposit variables
TRAN = transaction deposits / total liabilities
NONTRAN = small-denomination nontransaction deposits / total liabilities
CD = large certificate of deposits / total liabilities
X2 represents a vector of variables that are sources of bank revenue
CILOAN = commercial loans / total assets
CSLOAN = consumer loans / total assets
RELOAN = real estate loans / total assets
NIC = non-interest revenue / (non-interest revenue + net interest income)
X3 is a vector of variable for size and operational efficiency
LNASSETS = log(total book-value of assets)
EFFCY = (non-interest revenue + net interest income) / non-interest expenses

17
X4 is a vector of macro financial market variables
SP500 = SP500 index
3MTREAS = 3-month Treasury bill rate
10YTRREAS =10-year Treasury bond rate
2j (j = 1, 2, 3, 4) is a vector of coefficients; and < is an error term.
To the extent that banks may derive charter value from different types of funding the
effects are modeled as being proportional to shares of total liabilities. For portfolio lending, the
effects are modeled to be proportional to shares of total assets. Regarding non-interest revenues,
ideally, we would like to include the present value of the revenue streams. The quarterly
measures from the income statements are used as proxies for this measure.
In the empirical analysis, Equation (1) is estimated using the three categories of deposit
ratios. The coefficients of TRAN and NONTRAN capture the extent to which banking
organizations have market power in providing core deposit services, which for most banking
organization involves service to customers in local market.19 On the other hand, since the market
for most large CDs (balances greater than $100,000) is national, banking firms are expected to
have little market power in the large CD market so that the coefficient of CD should be
indistinguishable from zero.
The coefficients for the various loan-to-asset ratios test whether banking firms earn rents
from portfolio lending. For lending, the market power would be expected to derive in part from
servicing borrowers who face high transaction cost to secure credit outside the local banking
market. In the case of CILOAN, banking theory also postulates that banking firms have an
information advantage in servicing their business borrowers. The coefficient for NIC in
Equation (1) captures whether banking organizations earn rents from providing financial services
that generate non-interest revenues.
19 Nontransaction deposits include savings and small-denomination time deposits.

18
The log of assets is included to control for the potential that the relative option value of
the federal safety net increases with bank size. This is likely to be most relevant for the group of
very large BHCs. It also is possible that the market views larger banks generally as being more
likely to benefit from future innovations and expansion, which also would tend to make charter
value positively related to bank size. One caveat is that, some of the largest BHCs already have
expanded scope and the legislative restriction from GLB that a resulting bank merger cannot
result in the consolidated entity having a ten percent or more share of deposits nationally.
Within the size groups, asset size might capture the effects of any economies or diseconomies of
scale.
The coefficient of EFFCY is intended to capture the extent to which relative charter value
ratios are related to differences in the efficiency of BHCs. Ideally we would like to measure the
quantity of banking products and services produced relative to the quantity of inputs, rather than
the dollar revenues from those products and services because the revenue stream also reflects the
effects of differences in market power among banks, which in turn may be related to their
product and input mix. To address these measurement issues, we would like a measure of
efficiency that controls for the differences the firm’s output mix. To derive such measure, we
orthogonalize EFFCY by the BHC-specific right-hand-side variables in Equation 1.20
Among the financial variables, the S&P500 index controls for market-wide changes in
equity valuation that might be related to factor such as shifts in investors’ demand for risk
compensation. The interest rate environment also could affect bank charter values directly via
loan and deposit rates and indirectly via the discount factor on future rents. We include both a
short-term and a long-term interest rate.
19
VI. Empirical Findings
To estimate the model, we construct a sample of publicly traded bank holding companies
(BHCs) that file the Consolidated Financial Statements for Bank Holding Companies (FR Y-9C)
with the Federal Reserve from 1986 Q2 to 2003 Q4. Federal regulation requires all BHCs with
total consolidated assets of $150 million or more to file the Y-9C report quarterly. To avoid
double counting of multi-tiered BHCs, only the top tier BHCs are retained for analysis. To be
included in the sample, the daily stock price data of a BHC must be available from the Center for
Research in Security Prices (CRSP). Firms that were insolvent, that is, with negative book value
equity, and firms that were near failure, defined as the market-to-book equity ratio of being less
than 10 percent, were excluded. Our final sample contains 624 publicly traded BHCs that have
22,338 firm-quarter observations.
To control for the effects of large differences in firm size on the coefficients of the right-
hand side variables, we group our sample BHCs into three size classes using their maximum total
assets. Firms in the top tenth percentile by maximum total assets are classified as Large. Firms
between the fiftieth to the ninetieth percentile are Medium, and firms in the bottom fiftieth
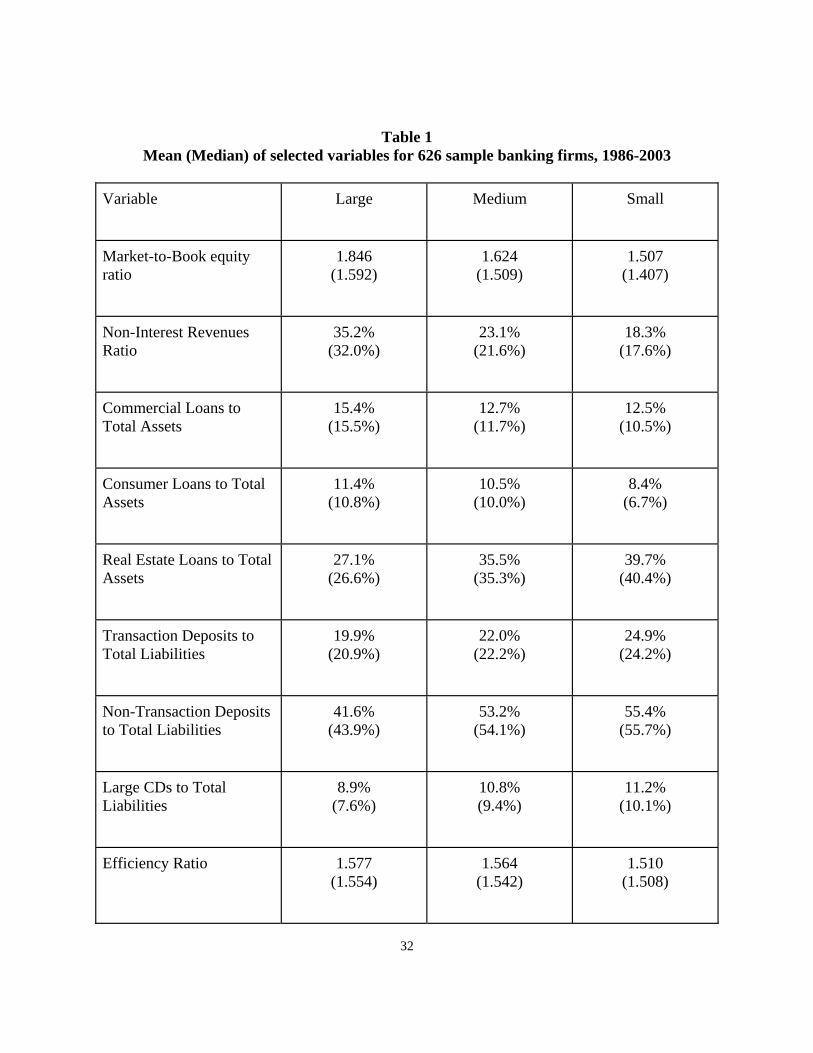
percentile are Small. Table 1 provides descriptive statistics of the sample BHCs by size classes.
Results are reported for pooled time series cross-section estimation of Equation (1) for the entire
time period and for selected sub-periods. To test for shift in the effect of the factors potentially
affecting bank charter values, we first divide the sample period into two halves—1986 through
1994 and 1995 through 2003. As discussed above, during the second time period several
developments built up to the ultimate enactment of GLB. We test for whether the market’s
assessment of the implication for bank charter values from reliance on fee-based activities varied
during the second sub-period. Specifically, we test for difference in the coefficient on
NONINTINC in three periods—1995-1996, 1997-1999, and 2000-2003. These are intended to
represent the period before the build-up to GLB, the lead up to GLB, and the post-GLB period.
20 That is, at each time t, we regress the ratio of (non-interest income + net interest income) to net operating expense on , TRANi t , NONTRANi t CDi t CILOANi t , CSLOANi t , RELOANi t , NICi t and LNASSETSi t and use the
20
Factors affecting bank charter values—1986-2003
The panels of Table 2 provide the first set of regression results using pooled time-series
cross-section observations.21 The results are shown for the full sample and for two sub-periods
that essentially split the sample period into two halves. Table 3 provides the statistics relating to
the significance of the changes in the coefficients between the two sub-periods. From Table 2,
the estimation results show the model provides a much better fit for Large BHCs than for the
other size groups. Table 3 also indicates significant changes in the coefficients of several of the
explanatory variables.
Turning to the coefficient estimates in Table 2, the coefficients on the macro financial
variables are highly significant. Charter value ratios for Large BHCs were positively related to
the S&P 500 index over the sample period. The relationship of the stock index to charter values
for Medium and Small BHCs was less consistent.22 The coefficient for the interest rate variables
generally are significant and with similar signs among the size groups. The financial variables
also appear to capture a good deal of the quarterly movement in BHC charter value ratios not
related to institution specific characteristics.23 The a good deal of the overall increase in bank
charter values also appears to be related to the more general rise in stock market valuations as
reflected in the S&P500 index.24 This suggests that banks as a group have benefits from
favorable economic conditions since the earlier the 1990s.
Regarding the relationship of traditional banking activities to charter values, the empirical
results indicate that overall higher shares of core deposits boost bank charter value ratios. For
Large BHCs, coefficients on transactions accounts (TRANS) and small denomination savings are
positive and highly significant. This is consistent with the results from Keeley (1990) in which
residuals from this regression, denoted as the measure of EFFCY. 21 The model is linear and robust standard errors are reported in the tables. 22 The model was estimated using the Russell 2000, and the results were essentially the same. 23 Equation (1) also was estimated dropping the macro financial variables and adding quarterly dummies. The results for the BHC specific variables were essentially the same and the overall adjusted R2s were similar. 24 For example, for Large banks over the full sample period, the R2 for the charter value equation with only the financial market variables is 0.45, while the figure for the model with only the BHC specific variables is 0.34.

21
higher shares of transactions deposits contributed to higher Q values. The findings support the
view that very large BHCs overall retain market power with regard to core deposits, likely
reflecting local market power in smaller denomination local deposit services and/or the provision
of transactions services in general.
In Table 2, the coefficient for core deposit for the Medium and Small BHCs vary
somewhat between the time periods, but provide strong support for the view that higher shares of
core deposits, particularly transactions deposits are associated with higher charter value ratios.
This suggests that insured deposit funding and providing transaction services to tend to
differentiate banks from other financial institutions.
From Table 3, the changes in the coefficients on core deposits are not statistically
significant for the Large BHCs. This suggests that changes in banking environment may not
have led to material increases in market power associated with core deposits services for the
important portion of the banking sector.25 This also appears to be the case for the Small BHC as
a group; in fact the change in the coefficient on NONTRAN is negative and statistically
significant. For the Medium BHCs, the changes in coefficients on TRAN and NONTRAN are
significant, but only the positive coefficient on NONTRAN is statistically significant. A
separate estimation for the Medium BHCs with the core deposits combined showed no
significant difference in the coefficients for the two sub-periods.
Regarding the reliance on large denomination CDs, as might be expected it is not
systematically associated with higher bank charter value ratios. In fact for Large BHCs, more
reliance on large CDs tends to damp charter value ratios, and the dampening effect is more
pronounced in the more recent sample period. This result, combined with the effects of core
deposit funding, suggests that Large BHCs overall would prefer to shift funding sources, but
apparently face sufficiently high marginal cost of securing core deposits that offset the incentive.
25 One reservation regarding to this conclusion is the change in coefficient on non-interest income discussed in more detail below. For Medium and Small BHCs, the fees on deposits tend to account for a larger share of non-interest income. Holding balance sheet shares constant, if the application of fees on deposits services among a set of BHCs is a function of the degree of market power, the effect would be captured by the coefficient on non-interest income shares.
22
Also note that Large BHCs would not necessarily adjust funding shares merely by reducing non-
core deposit funding—that is, by shrinking. As long as the marginal investment earns at least a
competitive rate of return, the BHC would be expected to fund the investment. To the extent that
a BHC funds such investments with a combination of equity and non-core liabilities, the charter
value ratio would decline, but not necessarily the absolute value of the bank charter.
For Medium and Small BHCs, the effects of relative reliance on large CDs are not as
clearly differentiated. Among Medium BHCs, the coefficients are not statistically significant for
the sample period as a whole or the sub-periods. In the case of the Small BHCs, the coefficient
on CD is statistically significantly negative and positive in the first and second sub-periods,
respectively.
The effects of portfolio lending on charter values vary by BHC size group, loan category
and time. The most consistent results across the size groupings is the negative, and at time
statistically significant, coefficients of CILOAN. The negative coefficient of CILOAN might
seem to be at odds with the theory that banking firms have information advantage in relationship
lending to their business borrowers. However, the much larger absolute size of the coefficient
for Large BHCs is consistent with competition faced by those organization serving larger
businesses with access to money and capital markets. More generally, it also is possible that, for
certain business customers, the degree of information advantages of BHCs from lending may
affect the use of fees and other non-interest revenues from providing off-balance sheet services
to those customers. In that case, the effect might be captured by the coefficient on non-interest
income shares.
Among the other loan categories, the coefficients on consumer loan (CSLOAN) are
positive and statistically significant for the Larger BHCs, but negative for Medium BHCs in the
second sub-period and for Small BHCs in both periods. The difference may reflect the
prominence of larger BHCs in credit card lending. On the other hand, at least in the more recent
sub-period, higher shares of assets in real estate loans has tend to boost charter value ratios for
Medium and Small BHCs. In a separate estimation with the loan categories combined, the
coefficients for all the sample periods were negative and statistically significant for Large BHCs

23
and positive and statistically significant for Medium and Small BHCs.
From Table 3, changes in banking environment for Large and Medium BHCs appear to
have reduced the role of certain types of portfolio lending in generating rents. The changes in
the coefficients are negative and statistically significant for business loan shares and real estate
loan share for Large BHCs and for consumer loans for Medium BHCs. Only the results for
Small BHCs show positive and significant changes in the effects of portfolio lending. In
separate estimation where the loan categories are combined, the changes were significant, with
more of a negative effect for Large BHCs and declines in the positive coefficients for Medium
and Small BHCs. Combined with the results for funding shares, it appears that changes in
banking environment during the sample period have had more of an impact the effects on charter
value ratios from portfolio lending than from core deposit services. This may reflect the relative
importance of increases in securitization and competition in credit markets compared to the
provision of transactions services and liquidity by financial markets more generally over the
sample period.
Non-interest income shares appear to have had a strong and growing positive effect on
charter value ratios for Large BHCs, but more mixed effects for the other two size groups. For
Large BHCs in the sample, the coefficients on non-interest income are notably larger than and
statistically differ from those for the other BHCs. This may reflect the difference in mix of
activities generating non-interest income, with the Large BHC group dominating activities such
as those associated with financial integration and market making in derivatives.
For Medium and Small BHCs, the effects of the share of net operating revenue
accounted for by non-interest income are diffuse and weaker. In the first sub-period, higher
shares of the non-interest income lower charter value ratios for the two smaller size groups of
BHCs. Even in the second sub-period, when the effect is positive for Medium BHCs, the
coefficient is less than one-fifth the size of the coefficient for Large BHCs. The result strongly
suggests that the market sees the shift to fee-based activities as a much more significant change
in banking environment for the very largest BHCs. This view is further supported by the more
detail analysis of the effects of non-interest income in the next section.

24
Within the three size groups, an increase in size, measured in terms of assets, of BHCs
boosts charter value ratios for Medium and Small BHCs and reduces the ratios for Large BHCs.
These results could reflect increasing and then decreasing scale economies in banking. It also
might reflect the market views concerning the potential for future growth through mergers and
acquisitions, with largest organization facing greater constraints. From Table 3, the significant
additional negative effects of asset size on charter value ratios among Large BHCs might be
reflect an accentuation of these influences with the rise of mega-banks. The difference in the
coefficient in the two periods, however, would not seem to be consistent with the market
attributing higher charter values owing to high a probability shareholders of very large banking
organization being protected under a too-big-to-fail policy.
The coefficients of the efficiency measure are all positive and highly significant,
confirming that bank charter value is significantly related to operating efficiency. The
consistency of the efficiency effect over time is striking, suggesting that efficiency had always
been an important determinant of charter value regardless of the banking industry condition. The
results may reflect the ability of more efficient (lower cost) organizations to retain rents. It also
may be because more efficient firms are seen as being more likely to survive and continue to
earn rents. At the same time, it is possible that the orthogonalized efficiency measure is still
affected by differences in market power among banks. We may not have fully purged EFFCY of
effects of rents, so the measure could reflect higher revenues not just lower costs. Indeed, Berger
and Mester (2003) find that improved performance in banking in 1990s was related to improved
profit efficiency rather than cost efficiency. Their analysis also suggests that improve
performance in banking was related to shifts in product mix rather than increases in market
power owing to increase market concentration. That is consistent with our findings showing that
the effects of traditional banking activities on charter value ratios did not increase over the
sample period.
Non-interest income and bank charter values, 1995-2003
The findings in Tables 2 and 3 regarding non-interest income appear to put a somewhat
25
different perspective on how the market views of the growth in non-interest income shares in
banking compared with those in Stiroh (2005a). For the period 1997 to 2004, that study finds
that that returns on market equity for banks are not higher for activities generating non-interest
income. Moreover, the study concludes that, given the share of net operating income account for
by non-interest income, for most BHCs the risk-adjusted return is less for non-interest income
activities. In apparent contrast, the results reported above suggest that, when assessed in terms
of the impact on charter value ratios, the market has viewed reliance on fee-based activities as a
quite positive developments overall for the very largest BHCs, positive for Medium banks in
second sub-period, and “neutral” for Small BHCs in the second sub-period.
To assess the findings regarding the relationship of charter values to non-interest income
shares, we divide the second sub-period further in to three periods as mentioned above—1995-
96, 1997-99, and 2000-03. For the three periods the coefficients on NONINTINC are allowed to
vary, while the other coefficients are estimated for the entire 1995-2003 period. The coefficients
for NONINTINC for the three periods for each BHC size groups are shown in Table 4.
Comparing the result for the 1995-2003 period in Table 3 to those in Table 4, there are only
small and statistically insignificant difference in the coefficients most of the other variables. The
one exception is the stock market index.
The results for NONINTINC indicate that the market’s assessment of the impact of the
impact of non-interest income shares on BHC charter values has varied since 1995. In particular,
during the run-up to GLB, the 1997-99 period, for each BHC size group the coefficient on
NONINTINC is positive, significantly different from zero, and significantly larger than the
coefficients for the other two periods.26 One possibility is, during the period of intense debate
over financial integration the market was expecting gains from fuller integration and saw BHCs
already with high shares of non-interest income as more likely to be able to take advantage of the
broader scope of activities. The subsequent declines in the coefficients on NONINTINC for the
26 Among the Large BHCs, the coefficient on NONINTINC in the 2000-03 period is significantly larger than for the 1995-96 period. For those to time periods, the coefficient for Small BHCs also in significantly larger (less negative) in the 2000-03 period, though the overall effect is still negative and statistically significant.

26
post-2000 period might be due to the market revising the expected impact of financial
integration, especially for the Large and Medium BHC groups. Indeed, the take-up on the
broader scope of powers by these BHCs for the most part has been quite limited, especially given
the number of BHCs that applied for and were granted.
Whatever the reason, the market having a relatively optimistic view on the gains to BHCs
from activities generating non-interest income appears to have accounted for part of the surge
(and subsequent ebb) in BHCs charter value ratios in the second part of the 1990s, especially for
Large BHCs. This is illustrated in panels of Figure 8 which shows the median charter value
ratios along with predicted median ratios for the BHC size groups. For the predicted values, the
dashed lines are based on estimated coefficient from in Table 3. For the dashed line, the
predicted values reflect the different coefficients of the BHC specific and financial market
variables before and after 1995 only. The dotted line in Figure 8 is based on the estimated
coefficient from Table 4—that is, where the coefficient on NONINTINC is allowed to shift
during the 1995-2003 period. Note that the dashed and dotted lines coincide for the pre-1995
period.
From Panel A of the Figure 8, for the Large BHC group, without taking into account the
greater intensity of the impact from non-interest income shares during the 1997-99 interval, the
actual median charter value ratio for the Large BHC rises substantially above the predicted value
(dashed line) for much of 1997-98 period. The predicted value (the dashed line) also continues
to rise after the actual median charter value starts to decline in 1999. The movements in the
dashed line reflect in part reflect the general rise in the S&P index until early 2000.
The dotted line, on the other hand traces a good deal, though not all, of the run-up in the
median charter value ratio for the Large BHCs. It also tends to track better the subsequent ebb in
the median charter value ratio for the Large BHCs. The dotted line in panels for the other BHC
size groups also capture some of the surge and ebb in the median charter value ratios, though less
than for the Large BHCs.
In addition to helping account for some of swing in chart value ratios in recent years,
allowing for changes the coefficient on NONINTINC within the 1995-03 period also may help to

27
square the findings with those in Stiroh (2005a). For the Medium and Small BHC groups, which
makes up 90 percent of the sample in any quarter, non-interest income shares tend to reduces
charter value ratios, except during the run-up to GLB. For the bulk of the banking organization,
then, it appears that greater reliance on non-interest income tends to lower charter value ratios.27
What remains, however, is that, for the very largest BHCs as a group, non-interest
income shares tend to boost charter value ratios throughout the sample period. And, while the
intensity of the effect has declined some compared to that for the 1997-99 interval, in recent
years it remained significantly above that for the pre-1995 period. Based on the impact on
charter values, it would appear that among the very largest BHCs for the sample period
considered in this study the market did not view the BHCs as having over-extended their reliance
on non-interest income, and in fact BHCs seem to have incentive to increase activities that would
raise non-interest income as share of net operating income.
VI. Conclusions
The rebound in bank charter values since the early 1990s suggests that, despite (or
perhaps because of) changes in banking environment, banks apparently remain special. This
study investigates which institution-specific factors accounted for differences in bank charter
values using quarterly data for publicly traded BHCs for the period 1986 through 2003.
The empirical results suggests that, among traditional banking activities, the provision
of core deposits services contributes to charter values ratios for BHCs. This is consistent with
banks exercising a degree of market power in connection with transactions and small
denomination deposit accounts services. At the same time, even with the massive consolidation
in banking, the connection between core deposit funding and charter value ratios does not appear
to have systematically increased, and may have weakened a bit in more recent years at least
27 To the extent that these BHCs are deliberating substituting reliance on non-interest income for interest income, the findings suggests that they would be better off not doing so. However, to the extent that non-interest income generating activities are in addition to other activities, they might still make economic sense. If Small and Medium BHCs as a group are realizing rents on certain activities, other activities earning competitive rate of return on allocated equity will tend lower charter value ratios, though not charter values per se.

28
among smaller sized BHCs. In the case of bank portfolio lending, evidence regarding potential
rents in banking is more mixed.
One of the strongest and most consistent findings is the positive effect of non-interest
income on charter value ratios for the very largest banking organizations. Among the largest
BHCs, shares of net operating income accounted for by non-interest income has risen
substantially over time and the effect on charter value ratios has intensified on balance. When
assessed in terms of the impact on charter values, the market apparently has seen the reliance on
fee-based activities as positive developments overall for the very largest BHCs. The market,
however, is more sanguine about the implications of non-interest income for charter values of
other BHCs.
Potentially relevant to policy measure intended to affect a too-big-to-fail policy,
among the large BHCs, the negative effect of size on relative charter values has intensified over
time. This would be consistent with policies measures having reduced the market’s expectations
for too-big-to-fail rescues of large BHCs, though it might also be due to the effects of
diseconomies of scale or restrictions on potential growth for large BHCs. For medium and
smaller BHCs, on the other hand, the positive effect of size on charter value has intensified over
time. For those size groups, this more likely reflects size being associated with scale economies,
the opportunities for exercising expanded activities, or perhaps the likelihood of being acquired,
than increased expected value of the federal safety net. Efficiency has a strong and consistent
impact on relative charter value of BHCs. It also appears, however, that a good deal of the
movement and general rise in bank charter values may have been due to favorable
macroeconomic conditions, rather than development specific to banking.

29
References
Akhavein, J.D., A.N. Berger, and D.B. Humphrey, 1997, The effects of megamergers on efficiency and prices: Evidence from a bank profit function, Review of Industrial Organization 12, pp. 95-139. Benston, G. J. And G. G. Kaufman, 1997, FDICIA after five years: A review and evaluation, Journal of Economic Perspectives Vol. 11, No. 3, pp.139-158. Berger, A.N. 2003, The Economic Effects of Technological Progress: Evidence from the Banking Industry, Journal of Money Credit and Banking, 35, pp. 141-176. Berger, A.N. and L.J. Mester, 2003, Explain the Dramatic Changes in Performance of US Banks: Technological Change, Deregulation, and Dynamic Changes in Competition, Journal of Financial Intermediation, 12, pp 57-95. Berger, A., M. Kyle, and J. Scalise. 2001. "Did U.S. Bank Supervisors Get Tougher during the Credit Crunch? Did They Get Easier during the Banking Boom? Did It Matter to Bank Lending?" In Prudential Supervision: What Works and What Doesn't, ed. Frederic S. Mishkin. Chicago: University of Chicago Press. Carow, K. A., 2001a, The Citicorp-Traveler’s merger: Challenging barriers between banking and insurance, Journal of Banking and Finance Vol. 25, pp. 1553-1571. Carow, K. A., 2001b, The wealth effects of allowing bank entry into insurance industry, Journal of Risk and Insurance Vol. 68, pp. 129-150. Carow, K. A. and R. A. Heron, 2001, Capital market reactions to the passage of the financial services modernization act of 1999, Quarterly Review of Economics and Finance Vol. 42, No. 3, pp. 465-485. Carow, K. A. and E. J. Kane, 2001, Event-study evidence of the value of relaxing longstanding regulatory restraints on banks, 1970-2000, Quarterly Review of Economics and Finance Vol. 42, No. 3, pp. 439-463. Collins, M. C., S. A. Kwag and H. S. Yildirim, 2002, An examination of the equity market response to the Gramm-Leach-Bliley Act across commercial banking, investment banking, and insurance firms, University of Tennessee Working Paper. Covitz, D. M., D. Hancock and M. L. Kwast, 2002, Market discipline in banking reconsidered: The roles of deposit insurance reform, funding manager decisions and bond market liquidity,
30
Working Paper, Board of Governors of the Federal Reserve System. Federal Reserve System Study Group on Subordinated Notes and Debentures,1999, Using subordinated debt as an instrument of market discipline, Staff Study 172, Board of Governors of the Federal Reserve System. Flannery, M. J., 1998, Using market information in prudential bank supervision: A review of the U.S. empirical evidence, Journal of Money, Credit, and Banking Vol.30, pp. 273–305. Flannery, M. J., S. H. Kwan and M. Nimalendran, 2004, Market evidence on the opaqueness of banking firms’ assets, Journal of Financial Economics Vol 71, pp. 419-460. Flannery, M. J. and S. M. Sorescu, 1996, Evidence of bank market discipline in subordinated debenture yields: 1983-1991, Journal of Finance Vol. 51, pp. 1347-1377. Furlong, F. T, and S. H. Kwan, 2006, Recapitalization, Charter Values, and Bank Risk-Taking, mimeo. Furlong, F. T., 2001, Productivity in Banking, Federal Reserve Bank of San Francisco Economic Letter, July. Furlong, F.T., 2000, The Gramm-Leach-Bliley Act and Financial Integration, Federal Reserve Bank of San Francisco Economic Letter, March. Furlong, F. T.,1992, Capital Regulation and Bank Lending, Federal Reserve Bank of San Francisco Economic Review, 3, pp. 23-33. Hovakimian, A. and E. J. Kane, 2000, Effectiveness of Capital Regulation at U.S. Commercial Banks, 1985 to 1994, Journal of Finance, Vol. 55, No.1, February 2000, pp. 451-468. Kaufman, G. G., 2002, Too big to fail in U.S. banking: Quo vadis? Quarterly Review of Economics and Finance, Summer, pp. 423-436. Keeley, M. C., 1990, Deposit insurance, risk, and market power in banking, American Economic Review Vol. 80, No. 5, pp. 1183-1200. Kwan, S. H., 1998, Securities activities by commercial banking firms’ section 20 subsidiaries: Risk, return and diversification benefits, Federal Reserve Bank of San Francisco Working Paper. Kwan, S. H. and E. Laderman, 1999, On the Portfolio Effects of Financial Convergence -- A Review of the Literature, Economic Review, Federal Reserve Bank of San Francisco, Number 2, pp. 18-31.

31
Krainer, John, and Jose A. Lopez. 2004. Incorporating Equity Market Information into Supervisory Models. Journal of Money, Credit, and Banking 36(6) (December), pp. 1043–1067. Krainer J. , J. A. Lopez, 2003 The Current Strength of the U.S. Banking Sector Federal Reserve Bank of San Francisco, Economic Letter 2003-37 December 19. Laderman E., 2005 Changes in Twelfth District Local Banking Market Structure during a Period of Industry Consolidation, Federal Reserve Bank of San Francisco Economic Review, forthcoming. Mester, L. J., J.P. Hughes, W. Lang, and C.G. Moon, 1999, The Dollars and Sense of Bank Consolidation, Journal of Banking and Finance 23, pp. 291-324. Mishkin, F. S., 1997, Evaluating FDICIA, in George G. Kaufman, ed., FDICIA: Bank reform five years later and five years ahead, Greenwich, CT.: JAI Press, pp. 17-33. Rhoades, S.A., 2000, Bank mergers and banking structure in the United States, 1980-98, Federal Reserve Staff Study 174. Jayaratne, J., and P. E. Strahan, 1998, Entry Restrictions, Industry Evolution and Dynamic Efficiency, Journal of Law & Economics, 41, pp. 239-273. Stern, G. H. and R. J. Feldman, 2004, Too big to fail: The hazards of bank bailouts, Brookings Institution Press, Washington D.C. Stiroh, K. J., 2005a, A Portfolio View of Banking with Interest and Noninterest Assets Journal of Money, Credit, and Banking (forthcoming) Stiroh, K. J., and Adrienne Rumble 2005b, The Darkside of Diversification: The Case of US Financial Holding Companies Journal of Banking and Finance (forthcoming)
32
Table 1 Mean (Median) of selected variables for 626 sample banking firms, 1986-2003
Variable Large Medium Small
Market-to-Book equity ratio
1.846 (1.592)
1.624 (1.509)
1.507 (1.407)
Non-Interest Revenues Ratio
35.2% (32.0%)
23.1% (21.6%)
18.3% (17.6%)
Commercial Loans to Total Assets
15.4% (15.5%)
12.7% (11.7%)
12.5% (10.5%)
Consumer Loans to Total Assets
11.4% (10.8%)
10.5% (10.0%)
8.4% (6.7%)
Real Estate Loans to Total Assets
27.1% (26.6%)
35.5% (35.3%)
39.7% (40.4%)
Transaction Deposits to Total Liabilities
19.9% (20.9%)
22.0% (22.2%)
24.9% (24.2%)
Non-Transaction Deposits to Total Liabilities
41.6% (43.9%)
53.2% (54.1%)
55.4% (55.7%)
Large CDs to Total Liabilities
8.9% (7.6%)
10.8% (9.4%)
11.2% (10.1%)
Efficiency Ratio 1.577 (1.554)
1.564 (1.542)
1.510 (1.508)

33
Table 2
Determinants of Bank Charter Values Panel A:
Larege BHCs: Dependent Variable = CV1986-2003 1986-1994 1995-2003
Variable PARMS STDERR PARMS STDERR PARMS STDERRIntercept 4.714 0.263 *** 3.439 0.236 *** 7.610 0.580 ***TRAN 1.166 0.190 ** 1.128 0.196 *** 1.030 0.326 ***NONTRAN 0.205 0.115 * 0.287 0.107 *** 0.544 0.224 **CD -0.874 0.209 *** 0.176 0.202 -2.662 0.586 ***CILOAN -1.485 0.190 *** -0.709 0.178 *** -2.070 0.369 ***CSLOAN 2.305 0.242 *** 1.943 0.236 *** 2.063 0.471 ***RELOAN -1.438 0.153 *** -0.840 0.162 *** -2.256 0.287 ***NONINTINC 1.790 0.142 *** 0.893 0.147 *** 2.487 0.226 ***LNASSETS -0.215 0.012 *** -0.125 0.011 *** -0.363 0.026 ***EFFCY 0.933 0.083 *** 0.916 0.078 *** 0.947 0.132 ***SP500 0.0019 0.0001 *** 0.0006 0.0002 *** 0.0017 0.0001 ***3MTREAS 0.071 0.011 *** -0.021 0.010 ** 0.097 0.027 ***10YTREAS -0.181 0.020 *** -0.098 0.019 *** -0.189 0.048 ***
RMSE 0.625 0.404 0.789N 3325 1937 1388RSQ 0.640 0.408 0.498***, **, * indicate significant at the 1%, 5%, and 10% levels, respectively.
Panel B:
Medium BHCs: Dependent Variable = CV1986-2003 1986-1994 1995-2003
Variable PARMS STDERR PARMS STDERR PARMS STDERRIntercept 0.902 0.165 *** 2.868 0.212 *** -1.223 0.270 ***TRAN 0.364 0.090 *** 0.455 0.122 *** 0.567 0.137 ***NONTRAN 0.280 0.067 *** -0.131 0.086 0.665 0.100 ***CD 0.069 0.116 0.015 0.160 0.136 0.154CILOAN -0.096 0.107 -0.166 0.134 -0.243 0.165CSLOAN 0.073 0.118 0.475 0.135 *** -1.031 0.187 ***RELOAN 0.202 0.075 ** 0.110 0.093 0.321 0.109 ***NONINTINC -0.091 0.098 -0.656 0.105 *** 0.357 0.200 *LNASSETS 0.081 0.008 *** 0.003 0.008 0.193 0.015 ***EFFCY 0.159 0.118 0.084 0.072 0.674 0.096 ***SP500 0.00043 0.00003 *** -0.00097 0.00016 *** 0.00022 0.00004 ***3MTREAS 0.032 0.007 *** -0.018 0.009 ** 0.032 0.012 **10YTREAS -0.175 0.012 *** -0.146 0.016 *** -0.100 0.022 ***
RMSE 0.627 0.532 0.673N 10498 5505 4993RSQ 0.270 0.088 0.161***, **, * indicate significant at the 1%, 5%, and 10% levels, respectively.

34
Table 2 continued
Panel C Small BHCs: Dependent Variable = CV
1986-2003 1986-1994 1995-2003Variable PARMS STDERR PARMS STDERR PARMS STDERR ***Intercept 0.100 0.239 0.736 0.447 * -0.815 0.279TRAN 0.324 0.110 *** 0.305 0.112 *** 0.606 0.154 ***NONTRAN 0.401 0.092 *** 0.590 0.090 *** 0.330 0.124 **CD 0.450 0.134 *** 0.905 0.173 *** -0.118 0.176CILOAN -0.231 0.126 * -0.453 0.152 *** 0.236 0.199CSLOAN -0.408 0.120 *** -0.362 0.175 ** -0.543 0.155 ***RELOAN -0.004 0.074 -0.375 0.113 *** 0.207 0.087 **NONINTINC -0.036 0.051 -0.947 0.179 *** -0.011 0.029LNASSETS 0.152 0.014 *** 0.112 0.023 *** 0.207 0.017 ***EFFCY 0.696 0.047 *** 0.721 0.048 *** 0.680 0.072 ***SP500 0.00009 0.00003 *** -0.00090 0.00023 *** -0.00013 0.00004 ***3MTREAS 0.065 0.008 *** 0.016 0.011 0.027 0.012 **10YTREAS -0.193 0.013 *** -0.112 0.021 *** -0.097 0.023 ***
RMSE 0.684 0.52901 0.747N 8515 3295 5220RSQ 0.171 0.158 0.076***, **, * indicate significant at the 1%, 5%, and 10% levels, respectively.
Table 3 Changes in Effects on Charter Values: 1995-2003 compared to 1986-1994
Change in Coefficients for CVs 1995-2003 compared to 1986-1994
Large BHCs Medium BHCs Small BHCsVariable PARMS STDERR PARMS STDERR PARMS STDERRIntercept 4.171 0.626 *** -4.091 0.343 *** -1.551 0.527 ***TRAN -0.098 0.380 0.111 0.184 0.301 0.190NONTRAN 0.257 0.248 0.796 0.132 *** -0.260 0.153 *CD -2.838 0.620 *** 0.122 0.222 -1.023 0.247 ***CILOAN -1.361 0.409 *** -0.076 0.213 0.689 0.250 ***CSLOAN 0.120 0.527 -1.506 0.231 *** -0.181 0.234RELOAN -1.417 0.329 *** 0.211 0.143 0.582 0.143 ***NONINTINC 1.594 0.270 *** 1.013 0.226 *** 0.936 0.182 ***LNASSETS -0.238 0.028 *** 0.189 0.017 *** 0.095 0.029 ***EFFCY 0.031 0.154 0.589 0.121 *** -0.041 0.087SP500 0.00103 0.00023 *** 0.00118 0.00017 *** 0.00078 0.00023 ***3MTREAS 0.118 0.029 *** 0.051 0.015 *** 0.011 0.01610YTREAS -0.090 0.052 * 0.047 0.027 * 0.015 0.031
***, **, * indicate significant at the 1%, 5%, and 10% levels, respectively.
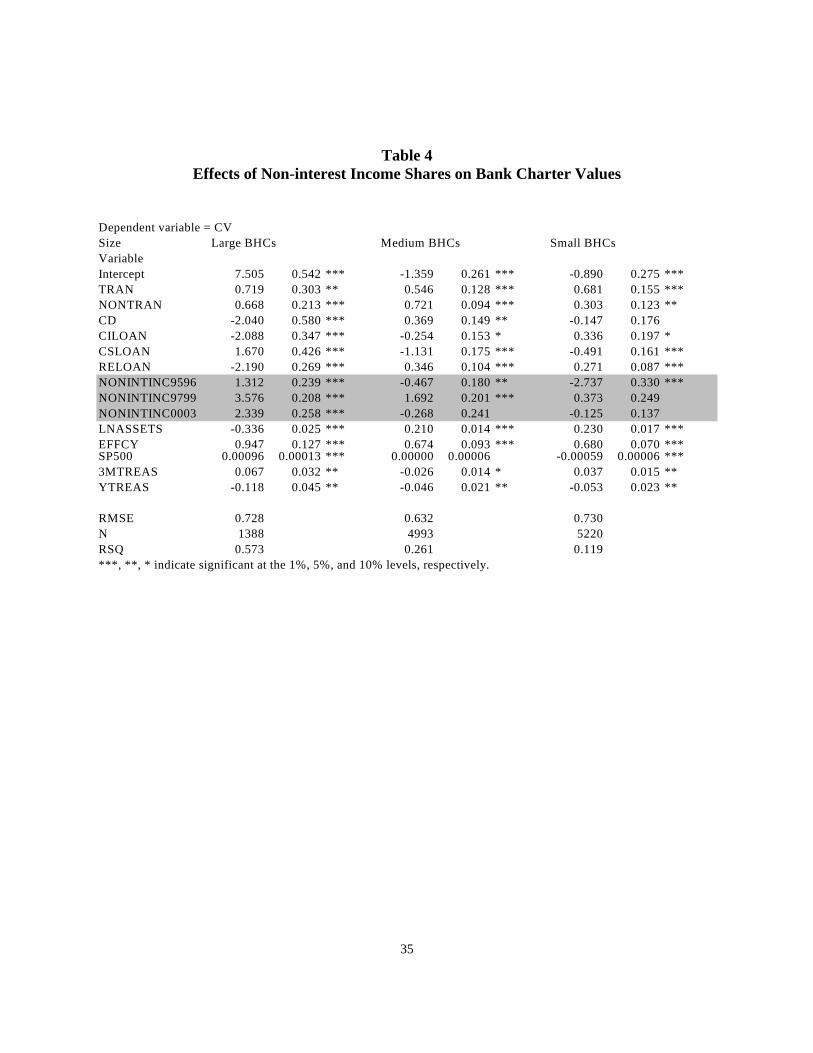
35
Table 4
Effects of Non-interest Income Shares on Bank Charter Values
Dependent variable = CVSize Large BHCs Medium BHCs Small BHCsVariableIntercept 7.505 0.542 *** -1.359 0.261 *** -0.890 0.275 ***TRAN 0.719 0.303 ** 0.546 0.128 *** 0.681 0.155 ***NONTRAN 0.668 0.213 *** 0.721 0.094 *** 0.303 0.123 **CD -2.040 0.580 *** 0.369 0.149 ** -0.147 0.176CILOAN -2.088 0.347 *** -0.254 0.153 * 0.336 0.197 *CSLOAN 1.670 0.426 *** -1.131 0.175 *** -0.491 0.161 ***RELOAN -2.190 0.269 *** 0.346 0.104 *** 0.271 0.087 ***NONINTINC9596 1.312 0.239 *** -0.467 0.180 ** -2.737 0.330 ***NONINTINC9799 3.576 0.208 *** 1.692 0.201 *** 0.373 0.249NONINTINC0003 2.339 0.258 *** -0.268 0.241 -0.125 0.137LNASSETS -0.336 0.025 *** 0.210 0.014 *** 0.230 0.017 ***EFFCY 0.947 0.127 *** 0.674 0.093 *** 0.680 0.070 ***SP500 0.00096 0.00013 *** 0.00000 0.00006 -0.00059 0.00006 ***3MTREAS 0.067 0.032 ** -0.026 0.014 * 0.037 0.015 **YTREAS -0.118 0.045 ** -0.046 0.021 ** -0.053 0.023 **
RMSE 0.728 0.632 0.730N 1388 4993 5220RSQ 0.573 0.261 0.119***, **, * indicate significant at the 1%, 5%, and 10% levels, respectively.

36
Figure 1: Median Charter Value Ratios for BHCs (Ratio of Market-Value Equity to Book-Value Equity)
0
0.5
1
1.5
2
2.5
3
3.5
4
Jun-86
Jun-87
Jun-88
Jun-89
Jun-90
Jun-91
Jun-92
Jun-93
Jun-94
Jun-95
Jun-96
Jun-97
Jun-98
Jun-99
Jun-00
Jun-01
Jun-02
Jun-03
0
0.5
1
1.5
2
2.5
3
3.5
4
Small BHCs
Medium BHCs
Large BHCs
FDICIA Reagle-Neal Passed Reagle-Neal
EffectiveH.R.10 Mockup
GLB
Citigroup-Travelers Announcement Merger
Figure 2: Distribution of Charter Value Ratios for BHCs(market-value equity/book-value equity)
0
0.2
0.4
0.6
0.8
1
1.2
1.4
0 1 2 3 4 5 6Charter Value Ratio
KernelDensity
December 2003
June 1990

37
Figure 3: Number of Commercial Banks
0
2000
4000
6000
8000
10000
12000
14000
16000
Mar
-84
Mar
-86
Mar
-88
Mar
-90
Mar
-92
Mar
-94
Mar
-96
Mar
-98
Mar
-00
Mar
-02
Mar
-04
Figure 4: Charter Value Densities for BHCs
0
0.2
0.4
0.6
0.8
1
1.2
1.4
0 1 2 3 4 5Charter Value
Density
December 1993, BHCs in sample for 12/1993 (dashed line)
June 1990, BHCs in sample as of 12/1993 (dotted line)
June 1990, all BHCs (solid line)

38
Figure 5: Median Noninterest Income Ratios for BHCs [noninterest income/(net interest income + noninterest income)]
0
0.1
0.2
0.3
0.4
0.5
Jun-86
Jun-87
Jun-88
Jun-89
Jun-90
Jun-91
Jun-92
Jun-93
Jun-94
Jun-95
Jun-96
Jun-97
Jun-98
Jun-99
Jun-00
Jun-01
Jun-02
Jun-03
0
0.1
0.2
0.3
0.4
0.5
LargeBHCs
Medium BHCs
SmallBHCs
Figure 6: Median Efficiency Ratios for BHCs[(noninterest revenue + net interest revenue)/noninterest expenses]
1
1.2
1.4
1.6
1.8
2
Jun-86
Jun-87
Jun-88
Jun-89
Jun-90
Jun-91
Jun-92
Jun-93
Jun-94
Jun-95
Jun-96
Jun-97
Jun-98
Jun-99
Jun-00
Jun-01
Jun-02
Jun-03
1
1.2
1.4
1.6
1.8
2
Small BHCs
Medium BHCs
Large BHCs
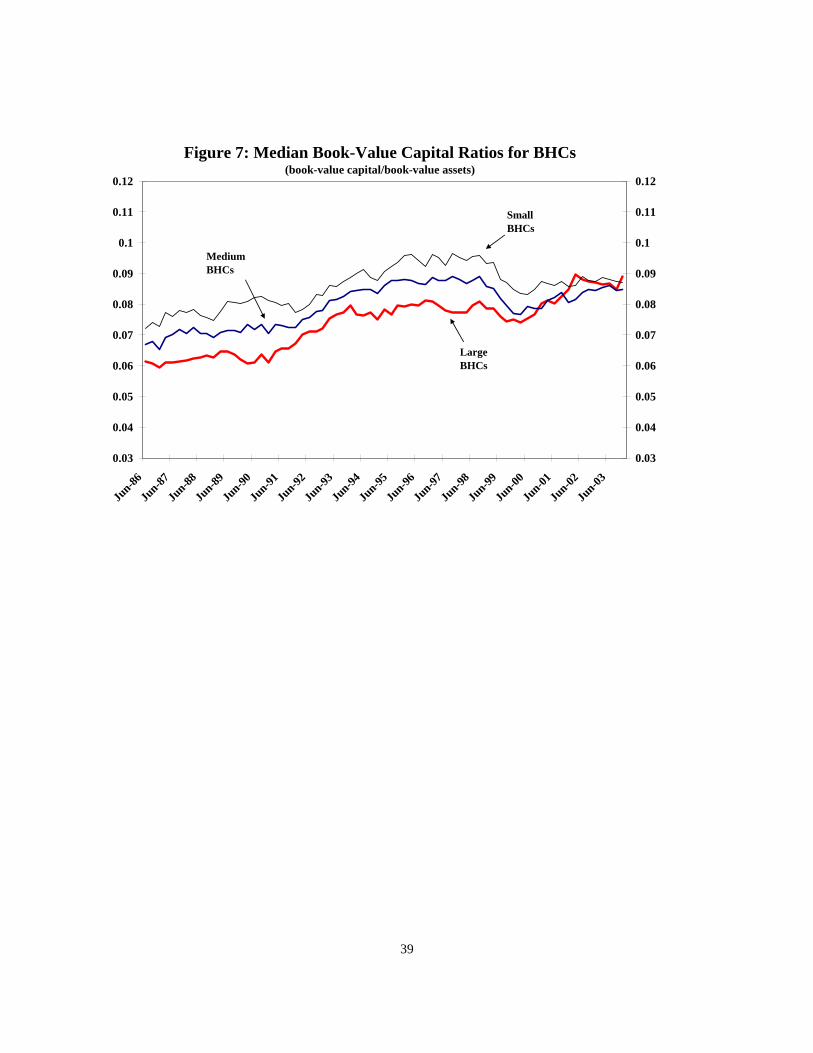
39
Figure 7: Median Book-Value Capital Ratios for BHCs(book-value capital/book-value assets)
0.03
0.04
0.05
0.06
0.07
0.08
0.09
0.1
0.11
0.12
Jun-86
Jun-87
Jun-88
Jun-89
Jun-90
Jun-91
Jun-92
Jun-93
Jun-94
Jun-95
Jun-96
Jun-97
Jun-98
Jun-99
Jun-00
Jun-01
Jun-02
Jun-03
0.03
0.04
0.05
0.06
0.07
0.08
0.09
0.1
0.11
0.12
Large BHCs
SmallBHCs
Medium BHCs
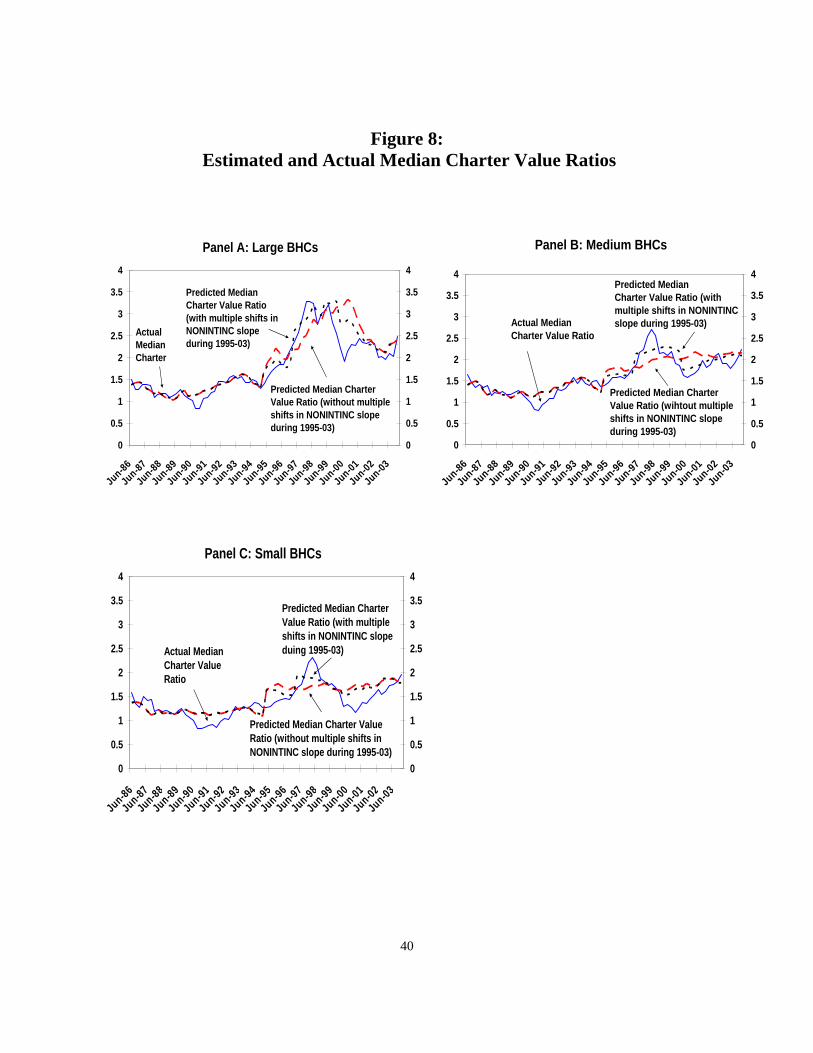
40
Figure 8: Estimated and Actual Median Charter Value Ratios
Panel A: Large BHCs
0
0.5
1
1.5
2
2.5
3
3.5
4
Jun-86Jun-87
Jun-88Jun-89
Jun-90Jun-91
Jun-92Jun-93
Jun-94Jun-95
Jun-96Jun-97
Jun-98Jun-99
Jun-00Jun-01
Jun-02Jun-03
0
0.5
1
1.5
2
2.5
3
3.5
4
Actual Median Charter
Predicted Median Charter Value Ratio (without multiple shifts in NONINTINC slope during 1995-03)
Predicted Median Charter Value Ratio (with multiple shifts in NONINTINC slope during 1995-03)
Panel C: Small BHCs
0
0.5
1
1.5
2
2.5
3
3.5
4
Jun-86Jun-87
Jun-88Jun-89
Jun-90Jun-91
Jun-92Jun-93
Jun-94Jun-95
Jun-96Jun-97
Jun-98Jun-99
Jun-00Jun-01
Jun-02Jun-03
0
0.5
1
1.5
2
2.5
3
3.5
4
Actual Median Charter Value Ratio
Predicted Median Charter Value Ratio (without multiple shifts in NONINTINC slope during 1995-03)
Predicted Median Charter Value Ratio (with multiple shifts in NONINTINC slope duing 1995-03)
Panel B: Medium BHCs
0
0.5
1
1.5
2
2.5
3
3.5
4
Jun-86
Jun-87
Jun-88
Jun-89
Jun-90
Jun-91
Jun-92
Jun-93
Jun-94
Jun-95
Jun-96
Jun-97
Jun-98
Jun-99
Jun-00
Jun-01
Jun-02
Jun-03
0
0.5
1
1.5
2
2.5
3
3.5
4
Actual Median Charter Value Ratio
Predicted Median Charter Value Ratio (wihtout multiple shifts in NONINTINC slope during 1995-03)
Predicted Median Charter Value Ratio (with multiple shifts in NONINTINC slope during 1995-03)