sources and ecological risk of heavy metals in soils of ... · different land uses were...
TRANSCRIPT

Accepted Manuscript
Title: Sources and Ecological Risk of Heavy Metals in Soils of Different Land Uses in
Bangladesh
Author: Md. Saiful ISLAM, Md. Kawser AHMED, Md. Habibullah-AL-MAMUN, Shah Md.
Asraful ISLAM
PII: S1002-0160(17)60394-1
DOI: 10.1016/S1002-0160(17)60394-1
Reference: NA
To appear in:
Received date: NA
Revised date: NA
Accepted date: NA
Please cite this article as: Md. Saiful ISLAM, Md. Kawser AHMED, Md. Habibullah-AL-MAMUN, Shah Md. Asraful
ISLAM, Sources and Ecological Risk of Heavy Metals in Soils of Different Land Uses in Bangladesh, Pedosphere (2017),
10.1016/S1002-0160(17)60394-1.
This is a PDF file of an unedited manuscript that has been accepted for publication. As a service to our customers we are
providing this early version of the manuscript. The manuscript will undergo copyediting, typesetting, and review of the
resulting proof before it is published in its final form. Please note that during the production process errors may be
discovered which could affect the content, and all legal disclaimers that apply to the journal pertain.

ACCEPTED MANUSCRIPT
PEDOSPHERE
Pedosphere ISSN 1002-0160/CN 32-1315/P doi:10.1016/S1002-0160(17)60394-1
Sources and Ecological Risk of Heavy Metals in Soils of Different Land Uses in
Bangladesh
Md. Saiful ISLAM
1,2,*, Md. Kawser AHMED
3, Md. Habibullah-AL-MAMUN
2,4, Shah Md. Asraful ISLAM
5
1Departmentof Soil Science, Patuakhali Science and Technology University, Dumki, Patuakhali-8602,
Bangladesh 2Environment and Information Sciences, Yokohama National University, 79-7 Tokiwadai, Hodogaya-ku,
Yokohama, Kanagawa 240-8501, Japan 3Department of Oceanography, University of Dhaka, Dhaka-1000, Bangladesh
4Department of Fisheries, University of Dhaka, Dhaka-1000, Bangladesh
5Departmentof Plant Pathology, Patuakhali Science and Technology University, Dumki, Patuakhali-8602,
Bangladesh
*Corresponding author. E-mail: [email protected], [email protected]
ABSTRACT
Soil pollution, influenced by both natural and anthropogenic factors, significantly reduces environmental
quality. Six heavy metals i.e., chromium, nickel, copper, arsenic, cadmium and lead in eight different land-use
soils from the Patuakhali district in Bangladesh were assessed. Metals were measured using an inductively
coupled plasma mass spectrometer (ICP-MS). The concentrations of Cr, Ni, Cu, As, Cd and Pb in soils were
1.3–87, 4.9–152, 4.1–181, 0.26–80, 0.17–24 and 5.2–276 mg kg-1
, respectively. The enrichment factor (EF),
pollution load index (PLI) and contamination factor ( i
fC ), were used to assess the ecological risk posed by
heavy metals in soils. The range of PLI was 0.78–2.66, indicating baseline levels to progressive deterioration of
soil due to metal contamination. However, i
fC values of Cd ranging from 1.8 to 12 which showed that the
studied soils were strongly impacted by Cd. Considering the severity of the potential ecological risk (i
rE ) for a
single metal, the descending order of contaminants was Cd > As > Pb > Cu > Ni > Cr. In relation to the
potential ecological risk (PER), soils from all land uses showed moderate to very high ecological risk.
Key Words: Ecological risk, Heavy metals, Land use, Patuakhali, Bangladesh.
INTRODUCTION
The natural concentration of heavy metals and metalloids like Cr, Ni, Cd, Cu, Pb and As in soils tends to
remain low and therefore ensure an optimum ecological equilibrium. However, the concentrations of heavy
metals and metalloids in soils frequently increase due to human activities. Indeed, the concentrations of heavy
metals and metalloids in agricultural soils are well-known and have adversely affected many parts of the world
(Kheir, 2010; Sun et al., 2010), including Bangladesh (Islam et al., 2014). Soil is a dynamic natural resource for
the survival of human life and regarded as the key receiver of persistent toxic heavy metals and metalloids due
to expanding (Luo et al., 2007; Karim et al., 2014). In recent decades, there has been significant concern
regarding soil contamination by various toxic metals due to expanding industrialization and urbanization (Chen
et al., 2010; Sun et al., 2010). However, in urban areas heavy metals and metalloids may originate from various
sources such as industrial activities, power generation, mining, smelting, waste spills or fossil fuel combustion
and waste disposal (Wei and Yang, 2010; Li and Feng, 2012; Rodriguez Martin et al., 2014; Karim et al., 2014).
The excessive input of heavy metals and metalloids into urban soils may lead to the deterioration of soil biology
and function, changes in soil physicochemical properties which may create other environmental problems (Papa
Accep
ted M
anus
cript

ACCEPTED MANUSCRIPT
et al., 2010). Therefore, the accumulation of heavy metals and metalloids in soils are of increasing concern due
to their potential risks and harmful effects on soil ecosystems (Cui et al., 2004; Li et al., 2009; Yu et al., 2012;
Yuan et al., 2014). As a result, studies on the assessment of ecological risk from heavy metals and metalloids
contamination in soil have gained more attention.
There is concern about the ecological risks and sources of heavy metals and metalloids in soils due to the rate
of urbanization in developing countries including Bangladesh. Different methods have been widely used to
assess the contamination of heavy metals and metalloids in soil such as enrichment factor (EF), contamination
factor (CF), geoaccumulation index (Igeo) etc. (Rashed, 2010; Liu et al., 2014). To evaluate the combined risk of
numerous heavy metals and metalloids in soil, the pollution load index (PLI) and potential ecological risk index
(PER) have also been developed (Huang et al., 2013). Thus, Sayadi and Sayyed (2011) noted that natural and
human-related metal enrichment in soils should be differentiated prior to the assessment of metal contamination
processes by enrichment factor (EF). The EF of an area indicates the relative enrichment in any contaminant
when compared to pre-industrial soil from a similar environment (Dias et al., 2014; However et al., 2013). On
the other hand, study of the distribution and source identification of heavy metals and metalloids in soils utilized
for different land uses is very important in identifying pollution status (Carr et al., 2008; Acosta et al., 2011;
Yuan et al., 2014).
The area of Patuakhali district is about 3,204.58 square kilometers; the total population is about 1,444,340
and population density is 451 people per square kilometer (Islam et al., 2015a). The study area has gained
attention due to its environmental pollution and is facing serious threats caused by the district's rapid
expansion, congestion and activities from industries (Islam et al., 2015a). In the study area, increasing air,
water and soil pollution emanating from traffic congestion and industrial waste are serious problems that
adversely affect public health. Several studies have reported metal concentration in urban agricultural soils in
Bangladesh (e.g. Kashem, and Singh, 1999; Ahmad and Gani, 2010; Rahman et al., 2012; Islam et al., 2014)
consider the land-use angle for measuring the metals concentrations. Nevertheless, these studies did not
consider land use aspect for the metal concentration in urban soils (Cerqueira et al., 2012; Saikia et al., 2014;
Martinello et al., 2014). Therefore, in this study, the levels of heavy metals and metalloids in soils of
different land uses were investigated. Trace element concentrations in soils from different land uses has
scarcely been investigated and is of critical importance in assessing heavy metals and metalloids’
contamination in soils and their impact on the environment (Chen et al., 2005; Luo et al., 2007; Islam et al.,
2015b,c). The hypothesis of the present study states that metal concentration values depend on soils utilized
for different land uses. Therefore, the objectives of this study are to address the problem of Cr, Ni, Cu, As,
Cd and Pb pollution in different urban soils, to identify the sources of heavy metals and metalloids and to
assess the ecological risk of heavy metals and metalloids in soils utilized for different land uses.
MATERIALS AND METHODS
Study area and sampling
This study focused on different urban soils of Patuakhali District, located in the southern part of Bangladesh
as shown in Figure 1. The study was conducted within eight different land use urban soils i.e. brick field (BF),
ferry ghat (FG), launch terminal (LT), power station (PS), agriculture field (AF), residential area (RA), market
(M) and play ground (PG). The study area receives domestic raw sewage, household waste, and industrial waste
from surrounding habitation. The basic information of the study area is presented in Table SI. Fifty three
composite soil samples were collected during August and September, 2013. To represent the preindustrial
sample, soil was taken by means of a percussion hammer corer (50–80 cm in length) for metal analysis
(Schottler and Engstrom, 2006). Lead-210 dating by alpha spectrometry method was used to determine the soil
age and accumulation rates (Islam et al., 2015d). The samples were subjected to chemical treatment in order to
obtain sources of alpha activity of 210
Pb (Sikorski and Goslar, 2003). The measurement of alpha radiation was
performed using of an alpha spectrometer (Canberra- 7401, PIPS®). The specific activity of
210Pb was
determined using the method described by (Sikorski and Bluszcz, 2008) which makes allowance for short lived
isotope decay, efficiency of the chemical procedure and the geometric efficiency of the spectrometric
measurement. Samples were air-dried at room temperature for fifteen days then ground and homogenized. The
dried soil samples were crumbled with a porcelain mortar, pestle, sieved and stored to clean Ziploc bags under
Accep
ted M
anus
cript
ACCEPTED MANUSCRIPT
freezing conditions until chemical analysis.
Measurement of soil physicochemical properties
The pH of the soil was measured in 1:2.5 soils to water ratio. The suspension was allowed to stand overnight
and the pH was measured using a pH meter. For electrical conductivity (EC) determination, 5.0 g of soil was
taken in 50 mL polypropylene tubes and 30 mL of Milli-Q water was added to the tube. The lid was closed and
it was shaken for 5 minutes. EC was then measured using an EC meter (Horiba D-52). Organic carbon of soil
was measured using an elemental analyzer (model type: Vario EL III, Elenemtar, Germany). The catalytic
combustion was carried out at a permanent temperature of up to 1200 °C. The carbon concentration from the
detector signal and the sample weight on the basis of stored calibration curves were measured. Particle size
distribution was determined using the hydrometer method (Zhao et al., 2014). The soil particles were classified
for their size using the United States Department of Agriculture (USDA) classification system (gravel [>2 mm],
sand [2–0.05 mm], silt [0.05–0.002 mm] and clay [< 0.002 mm]).
Sample analysis
Analytical grade chemical reagents were used for sample extraction. Milli-Q (Elix UV5 and MilliQ,
Millipore, USA) water was used for the preparation of solution. For metal analysis, about 0.5 g powdered soil
sample was treated with 4.5 mL 35% HCl (Kanto Chemical Co, Tokyo, Japan) and 1.5 mL 69% HNO3 (Kanto
Chemical Co, Tokyo, Japan) in a Teflon vessel and was digested using the Microwave Digestion System
(Berghof speedwave®, Eningen, Germany). The digested soil samples were then transferred into a Teflon beaker
and the total volume was made up to 50 mL with Milli-Q water. The extracted solution was then filtered using a
syringe filter (DISMIC® - 25HP PTFE, pore size = 0.45 µm) (Arenas-Lago et al., 2014; Cerqueira et al., 2011;
Silva et al., 2011) Toyo Roshi Kaisha, Ltd., Tokyo, Japan and stored in 50 mL polypropylene tubes (Nalgene,
New York). Afterwards, the Teflon vessels were cleaned by Milli-Q water and air dried. Finally, blank digestion
with 5 mL HNO3 following the said digestion procedures was carried out to clean up the digestion vessels
(Berghof’s product user manual, 2008).
Instrumental analysis and quality control
For the measurement of heavy metals and metalloids, samples were analyzed using an inductively coupled
plasma mass spectrometer (ICP-MS, Agilent 7700 series). For the preparation of calibration curve
multi-element Standard XSTC-13 (Spex Certi Prep®, Metuchen, USA) solutions were used. Multielement
solution (Agilent Technologies, USA) 1.0 µg/L was used as tuning solution covering a wide range of masses of
metals. All test batches were evaluated using an internal quality approach and validated to ensure Internal
Quality Controls. Instrument operating conditions and parameters for metal analysis are presented in Table SII.
Data calculation
Enrichment factors (EFs)
Enrichment factor (EF) is an appropriate methodology which helps to differentiate a metal source of
anthropogenic origin from those occurring naturally in the environment (Zhang et al., 2009). Enrichment factor
is calculated by normalizing the given metals’ concentration in soils to the percentage of Al (Luoma and
Rainbow, 2008; Islam et al., 2015b). The EF is calculated according to the following equation:
backgroundAlMsampleAlM CCCCEF )//()/( (1)
Where, (CM/CAl) sample is the ratio of concentration of heavy metals (CM) to that of aluminum (CAl) in soil sample,
and (CM/CAl) background is the same reference ratio in the pre-industrial sample. Generally, an EF value of about 1
suggests that a given metal may originate entirely from crustal source or natural processes of weathering
(Rashed, 2010). Samples having enrichment factor > 1.5 is considered indicative of human influence and
arbitrarily, an EF of 1.5-3, 3-5, 5-10 and > 10 is considered as evidence of minor, moderate, severe, and very
severe contamination respectively (Islam et al., 2015c,d).
Accep
ted M
anus
cript

ACCEPTED MANUSCRIPT
Contamination factor ( i
fC )
The contamination factor ( i
fC ) is the ratio obtained by dividing the concentration of each metal in soil by
the baseline or background value (heavy metals and metalloids in the pre-industrial soil sample of the study
area):
background
heavymetali
fC
CC
(2)
The contamination levels may be classified based on their intensities on a scale ranging from 1 to 6: low degree
( i
fC < 1), moderate degree (1 ≤ i
fC < 3), considerable degree (3 ≤ i
fC < 6), and very high degree ( i
fC ≥ 6)
(Luo et al. 2007; Rashed, 2010; Islam et al., 2015a) (Table 4). Thus, i
fC values can monitor the enrichment of
one given metal in soils over a period of time.
Pollution load index (PLI)
To assess the soil quality, an integrated approach of pollution load index of five heavy metals and one
metalloid is calculated. The PLI is defined as the nth
root of the multiplications of the contamination factor ( i
fC )
of metals (Bhuiyan et al., 2010; Islam et al., 2015a,b). n
ni
f
i
ffii
f CCCCPLI /1321 )......( (3)
PLI gives an overall toxicity assessment status of the soil sample and also the contribution of the studied heavy
metals and metalloids.
Potential ecological risk (PER)
Potential ecological risk load index (PER) is used to assess the degree of metal contamination in soils. The
equations for PER calculation were proposed by Guo et al. (2010) and are as follows.
i
n
ii
fC
CC ,
n
i
i
fd CC1
(4)
i
f
i
r
i
r CTE ,
m
i
i
rEPER1
(5)
Where, i
fC is the contamination factor of a single metal, iC is the content of metal in samples and i
nC is the
background value of the heavy metal. The background value (pre-industrial samples of the study area) of Cr, Ni,
Cu, As, Cd and Pb in soils were 29, 32, 27, 6.5, 0.82 and 23 mg/kg, respectively. The sum of contamination
factor ( i
fC ) for all metals represents the integrated pollution degree ( dC ). i
rE is the potential ecological risk
index and i
rT is the biological toxic factor of an individual metal. The toxic-response factors for Cr, Ni, Cu, As,
Cd and Pb were 2, 6, 5, 10, 30 and 5, respectively (Xu et al., 2008; Guo et al., 2010; Islam et al., 2015a,b). PER
is the comprehensive potential ecological risk index, the sum ofi
rE .
Statistical analysis
The data was statistically analyzed using the statistical package, SPSS 22.0 (SPSS, USA). The means and
standard deviations of heavy metals in soils were calculated. Multivariate method of principal component
analysis (PCA) was used to interpret the sources of heavy metals in soil. The Multivariate Post-hoc Tukey test
was performed to test significant differences of metal concentrations in soils of different land uses. Varimax
normalized rotation using Ward’s Method was applied to minimize the number of variables with a high loading
on each component.
Accep
ted M
anus
cript

ACCEPTED MANUSCRIPT
RESULTS AND DISCUSSION
Physicochemical properties and metal concentration in soil
The physicochemical properties of soil are presented in Table I. The studied soils were slightly acidic to
neutral where the range of pH was 5.4 to 7.2. Soil acidity favors the availability of cations in soil (Adeniyi et al.,
2008). The effects of soil pH on nutrient intake are mainly indirect, caused by increasing the solubility of toxic
metals in low-pH soils (pH < 5.0); the hydrogen ion exists as a hydrated proton and become a toxicant (Liu et
al., 2007). The range of organic carbon was 4.3 to 8.1 (g kg-1
) and the highest value was observed in soil
collected from the FG site (8.1 g kg-1
). According to the United States Department of Agriculture soil
classification system, the textural analysis revealed that the soil belonged to the sand, sandy loam, loamy sand
and sandy clayey loam class (Table I). The concentrations of heavy metals and metalloids (Cr, Ni, Cu, As, Cd
and Pb) in soils are presented in Table II. The levels of heavy metals and metalloids varied among the sampling
sites and followed the descending order of: LT > PS > BF > FG > M > AF > RA > PG. It was observed that
some heavy metals showed higher standard deviation for some land uses. Such high deviation can be due to the
lack of uniformity of the distribution of heavy metals across the site (Arenas-Lago et al., 2013, 2014; Cerqueira
et al., 2011, 2012; Silva et al., 2011; Quispe et al., 2012). Other possible causes might have been due to the
intensification of land use activities, such as digging, excavation, and construction, as well as other natural
processes, such as weathering and erosion, which could alter stabilization of the soil environment (Amuno,
2013).
The highest concentration of Cr was obtained at the PS site (52±25 mg kg-1
) followed by the LT site (47±23
mg kg-1
) (Table II) which could have resulted from the disposal and application of untreated waste from the
station and district urban area (Srinivasa et al., 2010). A statistically significant difference (P < 0.05) was
observed for Cr concentration in some of the land use areas within the study (Table II). The highest mean
concentration of Ni was observed in soil at the BF site (83±69 mg kg-1
) followed by the LT site (76±49 mg kg-1
).
The high level of Ni in soils of BF, LT, FG and PS sites may have resulted from localized additions or accidental
spillages from the brick field, launch terminal, ferry ghat and power station sites containing Ni (Krishna and
Govil, 2007). From Table II, it was also observed that individual concentrations of some metals (Ni, Cu, As and
Cd) in some samples exceeded Bangladesh background values, as well as Dutch and Canadian soil quality
guidelines values but were lower than the National Environment Protection Measures (NEPM) guidelines for
soil contamination by metals and metalloids (NEPC, 2013). The extent of contamination of soil is evaluated by
comparing total concentration against the NEPM Health Investigation Levels (HILs) criteria for contaminated
soil (NEPC, 2013). A site may be assessed based on investigation levels, or a site specific assessment can be
undertaken. The extent of contamination of soil is evaluated by comparing total concentration against the
criteria for contaminated soil referred to as NEPMs (NEPC, 2013).
The highest level of Cu was observed in soil at the LT site (73±31 mg kg-1
) followed by the PS site (67±77
mg kg-1
) (Table II). An elevated level of Cu at this site may be due to emissions from different waste burning
activities (Kashem and Singh, 1999; Srinivasa et al., 2010). The highest mean concentration of As was found in
soil collected from the BF site (38±12 mg kg-1
) followed by the LT site (15±12 mg kg-1
), where most samples
exceeded the Dutch target value and Canadian guidelines value (Table II). In the study area, very large amount
of As contaminated ground water (Polizzotto et al., 2013; Neumann et al., 2010) is being used for irrigation
along with various As-enriched fertilizers and pesticides in the agricultural fields (Bhuiyan et al., 2011; Alam et
al., 2003). Moreover, emission and waste from brick fields and incineration activities may contribute to the high
concentration of As in the study area (Olawoyin et al., 2012).
Sources of heavy metals in soil
Principal component analysis (PCA) was performed to identify the sources of heavy metals and metalloids
in soils of different land uses (Bai et al., 2011; Anju and Banerjee, 2012). In the present study, three principal
components were obtained which accounted for 74.7% of all the total variation (Fig. 2). Metals like Ni and Pb
were included in the first principal component (PC1) explaining the greatest variance (40.4%); the second
component (PC2) was composed of As and Cd explaining 19.5% of the variance. The third component (PC3)
included Cr and Cu explaining 14.8% of the total variance (Table III and Fig. 2). The anthropogenic and
geogenic elements have been considered to be Ni and Pb in the surface soils in many previous studies (Li et al.
Accep
ted M
anus
cript

ACCEPTED MANUSCRIPT
2006; Liu et al., 2011). Moreover, their distribution patterns were generally invariant in soils of different land
uses in the study area. Although Cr and Cu were included in PC3, the distribution of these two metals in the
studied soils confirmed that they were derived from the parent material of soil. From Fig. 2, it was implied that
As and Cd in PC2 were considered to mainly originate from the regional lithogenic factors of natural parent
soils as reported by previous reports (Zhou et al., 2008; Franco-Urı´a et al., 2009). However, the elements in
PC2 may also derive from anthropogenic factors such as the agrochemicals (including fertilizers and pesticides)
as mentioned in previous reports (Nziguheba and Smolders, 2008; Karim et al., 2008). PCA results were
consistent with the distribution of heavy metals in different land use soils and further confirmed the sources of
heavy metals and metalloids in the studied area.
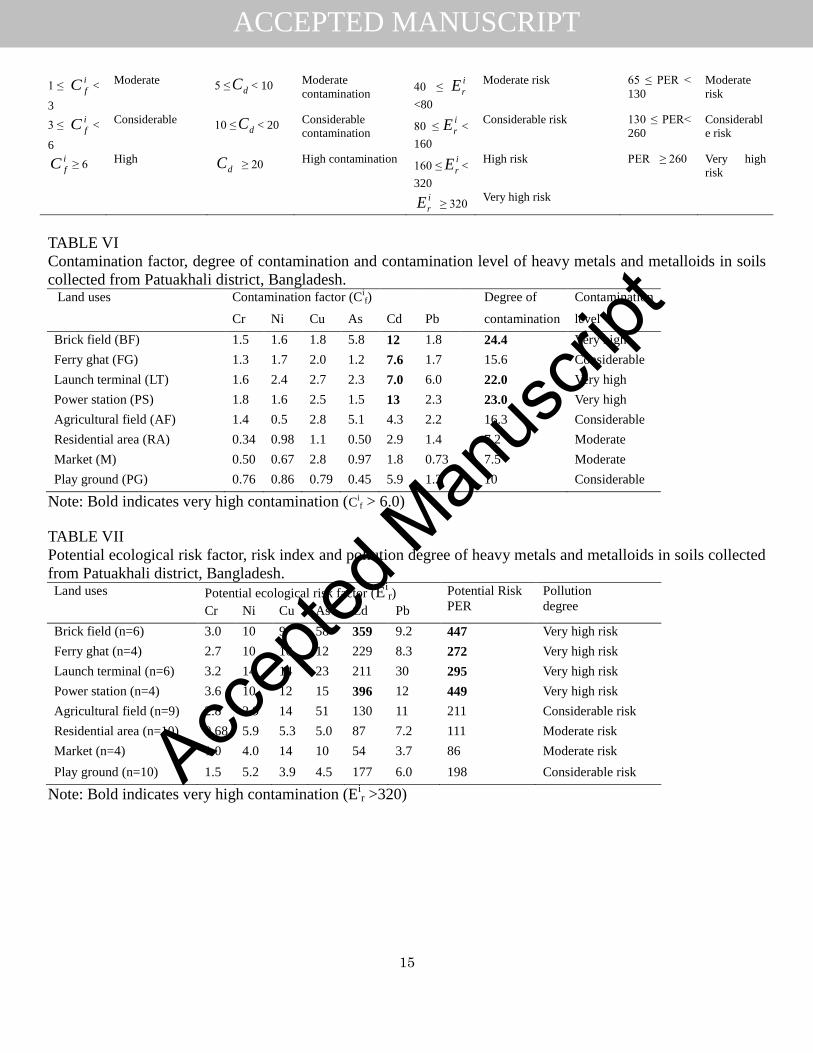
Toxic unit analysis
Potential toxicity of heavy metals and metalloids in soils can be estimated as the sum of toxic units (∑TUs),
the ratio of the determined concentration of metal in soil to probable effect levels (PELs) (Zheng et al., 2008;
Islam et al., 2015a). The toxic unit (TU) and sum of toxic units (∑TUs) for heavy metals and metalloids in
different land use soils are presented in Fig. 3. Toxic units for the studied metals were in the descending: Cd >
Ni > As > Pb > Cr > Cu. The sum of toxic units for BF (7.8), LT (7.0), PS (6.7) and FG (5.0) land use soils were
greater than 4 (Fig. 3), indicating a moderate to serious toxicity of heavy metals and metalloids (Bai et al.,
2011).
Ecological risk assessment
The enrichment factor (EF), pollution load index (PLI), contamination factor ( i
fC ) and degree of
contaminations ( dC ) were applied to assess metal contamination in soils of different land uses. The values of
EF for different land use soils are presented in Table IV. Among the sites the EFs decreased in the order: BF >
PS > LT > PS > FG > PG > AF > M > RA. As a whole, the EFs values for the studied metals were in the
descending: Cd > Pb > As > Cu > Ni > Cr. From Table IV, it was noted that the EF of Cd was higher than 1.5 for
most of the sites indicating strong human influence from various urban activities in the Patuakhali district
(Rashed, 2010; Islam et al., 2015a,b). Generally, studies have shown that low enrichment values indicate a large
contribution from crustal source in soil, while high EFs indicate a significant contribution from anthropogenic
sources (Yadao and Rajamani, 2006; Rashed, 2010).
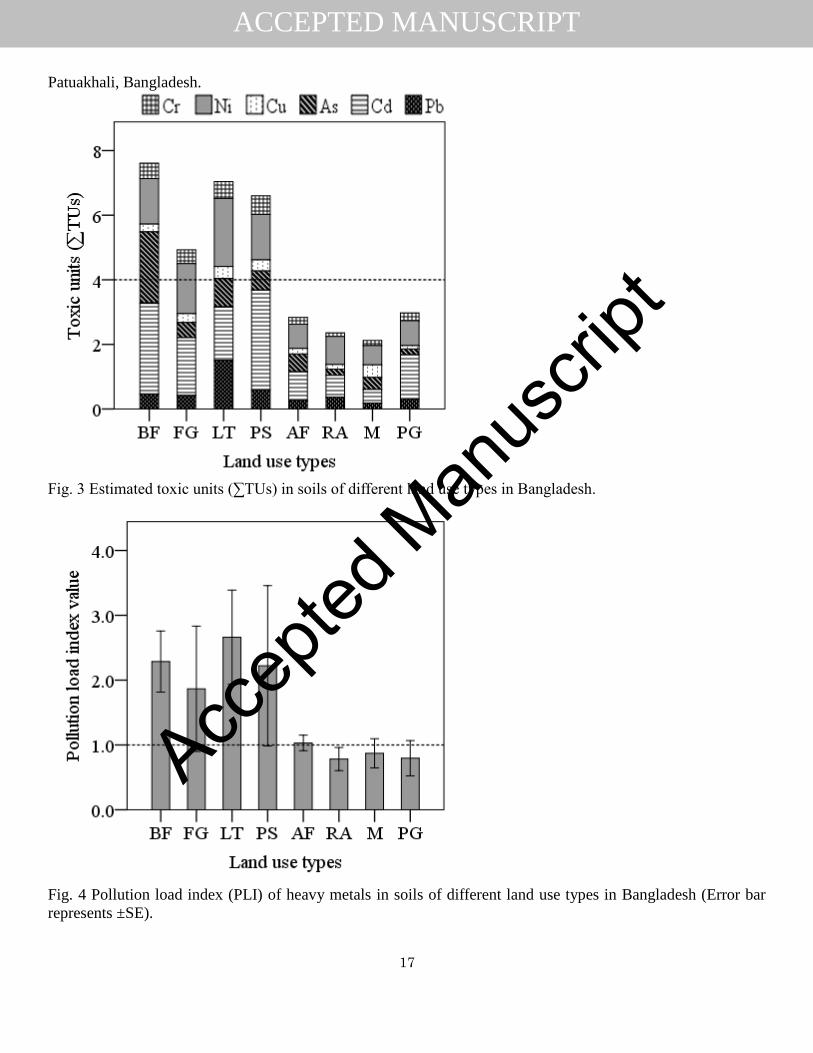
Pollution load index (PLI) value equal to zero indicates perfection; value of one indicates the presence of
only baseline levels of contaminants and values above one indicate progressive deterioration of soil due to metal
contamination (Rashed, 2010; Islam et al., 2015a). Extent of pollution increases with the increase of numerical
PLI value. Using the above indicators, soils studied were considerably polluted, since the PLI of most lands was
higher than one (Fig. 4). Among the land uses, the highest PLI values were observed at site LT (2.66) followed
by BF (2.29) and PS (2.22) sites. An elevated level of pollution load index (PLI) for LT, BF and PS sites
suggested that the activities from launch terminal, industries, emissions from BF and PS may cause some risks
(Bhuiyan et al., 2010; Liu et al., 2014; Islam et al., 2015c,d).
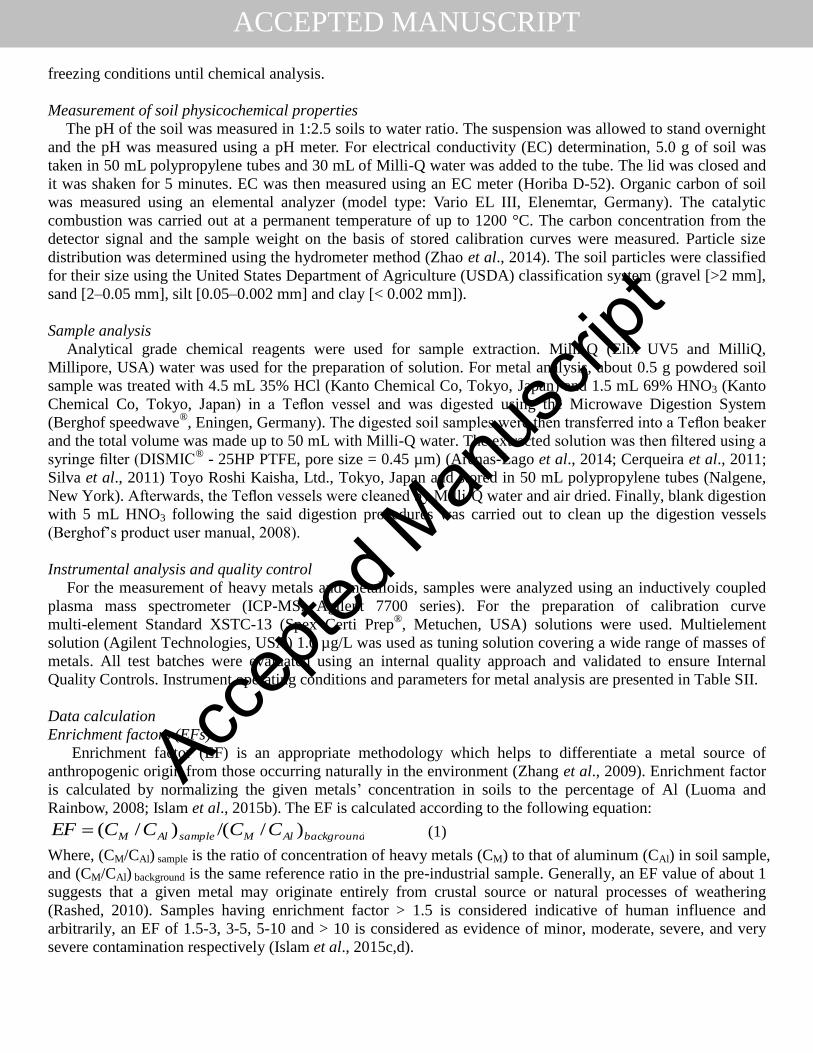
Hakanson (1980) defines four categories of i
fC , four categories of dC , five categories ofi
rE , and four
categories of PER, as shown in Table V. The contamination factor ( i
fC ) for individual metals and the degree of
contamination ( dC ) are presented in Table VI. Among the land uses, BF, FG, LT and PS sites showed very high
contamination ( i
fC > 6) with Cd concentration in the soil (Table VI), indicating Cd may pose potential risks to
the surrounding ecosystems (Rashed, 2010). Overall, the i
fC for studied metals were in the descending order:
Cd > As > Pb > Cu > Ni > Cr. The assessment of soil contamination was based on the degree of contamination
( dC ). Considering dC , BF, LT and PS sites showed a very high degree of metal contamination ( dC > 20) (Table
VI).
Combining the potential ecological risk index of individual metals (i
rE ) and the potential ecological risk
index (PER) (Table VII) with their grades (Table V), soils from BF, FG, LT, AF, PG and PS were classified at
Accep
ted M
anus
cript

ACCEPTED MANUSCRIPT
considerable to very high ecological risk for Cd and low to moderate potential ecological risk for the remaining
heavy metals. i
rE in the soil was in the descending order: Cd > As > Pb > Cu > Ni > Cr. Among the land uses,
considerable variations were observed for the potential ecological risk index (i
rE ) of individual metals which
indicated ecological risks of heavy metals varied with different land uses (Table VII). PER represents the
sensitivity of various biological communities to different toxic substances and illustrates the potential ecological
risk caused by heavy metals. In this study PER values of the environments of different land uses were found in
the descending: PS > BF > LT > FG > AF > PG > RA > M. According to other authors (Mass et al., 2010; Luo
et al., 2012), Cd contributes significantly to the PER of the environment and may originate from anthropogenic
activities (application of phosphate fertilizers and industrial activities) (Rodríguez Martín et al., 2013). Overall,
the range of PER for all kinds of land use is 86–449, indicating moderate to very high potential ecological risk.
The maximum value of PER (449 in soil at PS site) denotes very high potential ecological risk for land
receiving waste from coal burning power station.
CONCLUSIONS
Soils from launch terminal (LT), power station (PS) and brick field (BF) sites were contaminated by heavy
metals and metalloids especially Ni, Cu, As, Cd and Pb. The study also confirmed that metal concentrations in
the urban soils of Bangladesh varied with different land-uses. Some metal groups indicate that they have the
same origin, whereas the distribution of Cr, Cu, As and Cd in the studied soils confirmed that these metals are
derived from the parent material. Metals in soils of different land uses showed a moderate to high degree of
contamination. Considering the individual metals, only Cd showed a very high ecological risk for brick field
(BF) and power station (PS) sites, whereas the potential ecological risk indexes of other metals showed
moderate to very high potential ecological risks. Therefore, a long-term risk assessment needs to be carried out
on the leach ability and migration potential of these heavy metals and metalloids at the contaminated sites.
Moreover, different remediation measures (phyto-remediation or bio-remediation) should be taken promptly to
remove or reduce existing metal contamination in the study areas.
ACKNOWLEDGMENTS
The authors thank the authority of Patuakhali Science and Technology University (PSTU), Bangladesh and
Yokohama National University (YNU), Japan, for providing laboratory facilities. The samples collected in
Bangladesh were brought into Japan based on the permission issued by the Yokohama Plant Protection Station
(Import permit No. 25Y324 and 25Y1009). The authors are also delighted to express their gratitude and
sincerest thanks to Professor Dr. Md. Shams-Ud-Din (Vice Chancellor, PSTU), for his valuable suggestions,
cooperation and provision of funding to carry out this research. Furthermore, we are thankful for the kind help
from the members of the Soil Science Department, Patuakhali Science and Technology University (PSTU),
Bangladesh, during field sampling.
REFERENCES
Acosta, J. A., Faz, A., Martínez-Martínez, S., Zornoza, R., Carmona, D. M. and Kabas, S. 2011. Multivariate
statistical and GIS-based approach to evaluate heavy metals behavior in mine sites for future reclamation. J.
Geochem. Explor. 109: 8–17.
Adeniyi, A. A., Yusuf, K. O. and Okedeyi, O. O. 2008. Assessment of the exposure of two fish species to metals
pollution in the Ogun river catchments, Kettu, Lagos, Nigeria. Environ. Monit. Assess. 137: 451–458.
Ahmad, J. U. and Goni, M. A. 2010. Heavy metal contamination in water, soil, and vegetables of the industrial
areas in Dhaka, Bangladesh. Environ. Monit. Assess. 166: 347–357.
Alam, M. G. M., Snow, E.T. and Tanaka, A. 2003. Arsenic and heavy metal contamination of vegetables grown
in Samta village, Bangladesh. Sci. Total Environ. 308: 83–96.
Amuno, S. A. 2013. Potential ecological risk of heavy metal distribution in cemetery soils. Water Air Soil Pollut.
224: 1435–1446.
Anju, M. and Banerjee, D. K. 2012. Multivariate statistical analysis of heavy metals in soils of a Pb–Zn mining
area, India. Environ Monit Assess. 184: 4191–4206.
Accep
ted M
anus
cript

ACCEPTED MANUSCRIPT
Arenas-Lago, D., Vega, F. A., Silva, L. F. O. and Andrade, M. L. 2014. Copper distribution in surface and
subsurface soil horizons. Environ. Sci. Pollut. Res. 21: 10997–11008.
Arenas-Lago, D., Vega, F. A., Silva, L. F. O. and Andrade, M. L. 2013. Soil interaction and fractionation of
added cadmium in some Galician soils. Microchem. J. 110: 681–690.
Bai, J., Xiao, R., Cui, B., Zhang, K., Wang, Q., Liu, X., Gao, H. and Huang, L. 2011. Assessment of heavy
metal pollution in wetland soils from the young and old reclaimed regions in the Pearl River Estuary, South
China. Environ. Pollut. 159: 817–824.
Bhuiyan, M. A. H., Parvez, L., Islam, M., Dampare, S. B. and Suzuki, S. 2010. Heavy metal pollution of coal
mine-affected agricultural soils in the northern part of Bangladesh. J. Hazard. Mater. 173: 384–392.
Bhuiyan, M. A. H., Suruvi, N. I., Dampare, S. B., Islam, M. A., Quraishi, S. B., Ganyaglo, S. and Suzuki, S.
2011. Investigation of the possible sources of heavy metal contamination in lagoon and canal water in the
tannery industrial area in Dhaka, Bangladesh. Environ. Monit. Assess. 175: 633–649.
Carr, R., Zhang, C. S., Moles, N. and Harder, M. 2008. Identification and mapping of heavy metal pollution in
soils of a sports ground in Galway City, Ireland, using a portable XRF analyser and GIS. Environ. Geochem.
Health. 30: 45–52.
CCME (Canadian Council of Ministers of the Environment). 2003. Canadian environmental quality guidelines.
Winnipeg, Canada.
Cerqueira, B., Vega, F. A., Serra, C., Silva, L. F. O. and Andrade, M. L. 2011. Time of flight secondary ion mass
spectrometry and high-resolution transmission electron microscopy/energy dispersive spectroscopy: A
preliminary study of the distribution of Cu2+
and Cu2+/
Pb2+
on a Bt horizon surfaces. J. Hazard. Mater. 195:
422–431.
Cerqueira, B., Vega, F. A., Silva, L. F. O. and Andrade, L. 2012. Effects of vegetation on chemical and
mineralogical characteristics of soils developed on a decantation bank from a copper mine. Sci. Total
Environ. 421–422: 220–229.
Chen, T. B., Zheng, Y. M., Chen, H., Wu, H. T., Zhou, J. L., Luo, J. F. and Zheng, G. D. 2005. Arsenic
accumulation in soils for different land use types in Beijing (in Chinese). Geogr. Res. 24: 229–235.
Chen, X., Xia, X. H., Zhao, Y. and Zhang, P. 2010. Heavy metal concentrations in roadside soils and correlation
with urban traffic in Beijing, China. J. Hazard. Mater. 181: 640–646.
Cui, Y., Zhu, Y., Zhai, R., Chen, D., Huang, Y. and Qiu, Y. 2004. Transfer of metals from soil to vegetables in
an area near a smelter in Nanning, China. Environ. Int. 30: 785–791.
Dias, C. L., Oliveira, M. L. S., Hower, J. C., Taffarel, S. R., Kautzmann, R. M. and Silva, L. F. O. 2014.
Nanominerals and ultrafine particles from coal fires from Santa Catarina, South Brazil. Int. J. Coal Geol.
122: 50-60.
Franco-Uria, A., Lopez-Mateo, C., Roca, E. and Fernandez-Marcos, M. L. 2009. Source identification of heavy
metals in pasture land by multivariate analysis in NW Spain. J. Hazard. Mater. 165: 1008–1015.
Guo, W., Liu, X., Liu, Z. and Li, G. 2010. Pollution and potential ecological risk evaluation of heavy metals in
the sediments around Dongjiang Harbor, Tianjin. Proc. Environ. Sci. 2: 729–736.
Håkanson, L. 1980. An ecological risk index for aquatic pollution control: a sedimentological approach. Water
Res. 14: 975–1001.
Hower, J. C., O’Keefe, J. M. K., Henke, K. R., Wagner, N. J., Copley, G., Blake, D. R., Garrison, T., Oliveira,
M. L. S., Kautzmann, R. M. and Silva, L. F. O. 2013. Gaseous emissions and sublimates from the Truman
Shepherd coal fire, Floyd County, Kentucky: A re-investigation following attempted mitigation of the fire.
Int. J. Coal Geol. 116: 63–74.
Huang, L., Pu, X., Pan, J. F. and Wang, B. 2013. Heavy metal pollution status in surface sediments of Swan
Lake lagoon and Rongcheng Bay in the northern Yellow Sea. Chemosphere. 93: 1957–1964.
Islam, M. S., Ahmed, M. K. and Al-Mamun, M. H. 2015b. Metal speciation in soil and health risk due to
vegetables consumption in Bangladesh. Environ. Monit. Assess. 187: 288–303.
Islam, M. S., Ahmed, M. K., Al-Mamun, M. H. and Hoque, M. F. 2015a. Preliminary assessment of heavy metal
contamination in surface sediments from a river in Bangladesh. Environ. Earth Sci. 73: 1837–1848.
Islam, M. S., Ahmed, M. K., Al-mamun, M. H. and Masunaga, S. 2014. Trace metals in soil and vegetables and
associated health risk assessment. Environ. Monit. Assess. 186: 8727–8739.
Accep
ted M
anus
cript

ACCEPTED MANUSCRIPT
Islam, M. S., Ahmed, M. K., Al-Mamun, M. H. and Masunaga, S. 2015c. Potential ecological risk of hazardous
elements in different land-use urban soils of Bangladesh. Sci. Total Environ. 512–513: 94–102.
Islam, M. S., Ahmed, M. K., Raknuzzaman, M., Al-Mamun, M. H. and Islam, M. K. 2015d. Heavy metal
pollution in surface water and sediment: A preliminary assessment of an urban river in a developing country.
Ecol. Ind. 48: 282–291.
Karim, R. A., Hossain, S. M., Miah, M. M. H., Nehar, K. and Mubin, M. S. H. 2008. Arsenic and heavy metal
concentrations in surface soils and vegetables of Feni district in Bangladesh. Environ. Monit. Assess. 145:
417–425.
Karim, Z., Qureshi, B. A., Mumtaz, M. and Qureshi, S. 2014. Heavy metal content in urban soils as an indicator
of anthropogenic and natural influences on landscape of Karachi—A multivariate spatio-temporal analysis.
Ecol. Ind. 42: 20–31.
Kashem, M. A. and Singh, B. R. 1999. Heavy metal contamination of soil and vegetation in the vicinity of
industries in Bangladesh. Water Air Soil Pollut. 115: 347–361.
Kheir, R. B. 2010. Spatial soil zinc content distribution from terrain parameters: a GIS-based decision-tree
model in Lebanon. Environ. Pollut. 158: 520–528.
Krishna, A. K., Govil, P. K. 2007. Soil contamination due to heavy metals from an industrial area of Surat,
Gujarat, Western India. Environ. Monit. Assess. 124: 263–275.
Li, J. H., Lu, Y., Yin, W., Gan, H. H., Zhang, C., Deng, X. L. and Lian, J. 2009. Distribution of heavy metals in
agricultural soils near a petrochemical complex in Guangzhou, China. Environ. Monit. Assess. 153: 365–
375.
Li, J., Xie, Z. M., Xu, J. M. and Sun, Y. F. 2006. Risk assessment for safety of soils and vegetables around a
lead/zinc mine. Environ. Geochem. Health. 28: 37–44.
Li, X. and Feng, L. 2012. Multivariate and geostatistical analyzes of metals in urban soil of Weinan industrial
areas, Northwest of China. Atmos. Environ. 47: 58–65.
Liu, G. D., Dunlop, J., Phung, T. and Li, Y. C. 2007. Physiological responses of wheat phosphorus-efficient and
-inefficient genotypes in field and effects of mixing other nutrients on mobilization of insoluble phosphates
in hydroponics. Commun. Soil Sci. Plant Anal. 38: 2239–2256.
Liu, G., Yu, Y., Hou, J., Xue, W., Liu, X., Liu, Y., Wang, W., Alsaedi, A., Hayat, T. and Liu, Z. 2014. An
ecological risk assessment of heavy metal pollution of the agricultural ecosystem near a lead-acid battery
factory. Ecol. Ind. 47: 210–218.
Liu, P., Zhao, H., Wang, L., Liu, Z., Wei, J., Wang, Y., Jiang, L., Dong, L. and Zhang, Y. 2011. Analysis of
heavy metal sources for vegetable soils from Shandong Province, China. Agricul. Sci. China. 10: 109–119.
Luo, W., Lu, Y., Gisey, J. P., Wang, T., Shi, Y., Wang, G. and Xing, Y. 2007. Effects of land use on
concentrations of metals in surface soils and ecological risk around Guanting Reservoir, China. Environ.
Geochem. Health. 29: 459–471.
Luo, X. S., Yu, S., Zhu, Y. G. and Li, X. D. 2012. Trace metal contamination in urban soils of China. Sci. Total
Environ. 421–422: 17–30.
Luoma, S. N. and Rainbow, P. S. 2008. Metal contamination in aquatic environments: Science and lateral
management (573 pp.). Cambridge: Cambridge University Press.
Martinello, K., Oliveira, M. L. S., Molossi, F. A., Ramos, C. G., Teixeira, E. C., Kautzmann, R. M. and Silva, L.
F. O. 2014. Direct identification of hazardous elements in ultra-fine and nanominerals from coal fly ash
produced during diesel co-firing. Sci. Total Environ. 470-471: 444–452.
Mass, S., Scheifler, R., Benslama, M., Crini, N., Lucot, E., Brahmia, Z., Benyacoub, S., Muhammad, S., Shah,
M. T. and Khan, S. 2011. Heavy metal concentrations in soil and wild plants growing around Pb–Zn sulfide
terrain in the Kohistan region, northern Pakistan. Microchem. J. 99: 67–75.
NEPC. 2013. National Environment Protection Measures. Assessment of Site Contamination – Guideline on
Investigation Levels for Soil and Groundwater 2013. National Environmental Protection Council: Canberra,
Australia.
Neumann, R. B., Ashfaque, K., Badruzzaman, A. B. M., Ali, M. A., Shoemaker, J. and Harvey, C. 2010.
Anthropogenic influences on groundwater arsenic concentrations in Bangladesh. Nature Geosci. 3: 46–52.
Nziguheba, G. and Smolders, E. 2008. Inputs of trace elements in agricultural soils via phosphate fertilizers in
Accep
ted M
anus
cript

ACCEPTED MANUSCRIPT
European countries. Sci. Total Environ. 390: 53–57.
Olawoyin, R., Oyewole, S. A. and Grayson, R. L. 2012. Potential risk effect from elevated levels of soil heavy
metals on human health in the Niger delta. Ecotoxicol. Environ. Saf. 85: 120–130.
Papa, S., Bartoli, G., Pellegrino, A. and Fioretto, A. 2010. Microbial activities and trace element contents in an
urban soil. Environ. Monit. Assess. 165: 193–203.
Polizzotto, M. L., Lineberger, E. M., Matteson, A. R., Neumann, R. B., Badruzzaman, A. B. M. and Ali, M.
2013. Arsenic transport in irrigation water across rice-field soils in Bangladesh. Environ. Pollut. 179: 210–
217.
Quispe, D., Pérez-López, R., Silva, L. F. O. and Nieto, J. M. 2012. Changes in mobility of hazardous elements
during coal combustion in Santa Catarina power plant (Brazil). Fuel. 94: 495–503.
Rahman, S. H., Khanam, D., Adyel T. M., Islam, M. S., Ahsan, M. A. and Akbor, M. A. 2012. Assessment of
heavy metal contamination of agricultural soil around Dhaka Export Processing Zone (DEPZ), Bangladesh,
implication of seasonal variation and indices. Appl. Sci. 2: 584–601.
Rashed, M. N. 2010. Monitoring of contaminated toxic and heavy metals, from mine tailings through age
accumulation, in soil and some wild plants at Southeast Egypt. J. Hazard. Mater. 178: 739–746.
Rodríguez Martín, J. A., Gutiérrez, C., Escuer, M., García-González, M. T., Campos-Herrera, R. and Águila, N.
2014. Effect of mine tailing on the spatial variability of soil nematodes from lead pollution in La Union
(Spain). Sci. Total Environ. 473–474: 518–529.
Rodríguez Martín, J. A., Ramos-Miras, J. J., Boluda, R. and Gil, C. 2013. Spatial relations of heavy metals in
arable and greenhouse soils of a Mediterranean environment region (Spain). Geoderma. 200–201: 180–188.
Saikia, B. K., Ward, C. R., Oliveira, M. L. S., Hower, J. C., Braga, M. and Silva, L. F. 2014. Geochemistry and
nano-mineralogy of two medium-sulfur Northeast Indian coals. Int. J. Coal Geol. 121: 26–34.
Sayadi, M. H. and Sayyed, M. R. G. 2011. Comparative assessment of baseline concentration of the heavy
metals in the soils of Tehran (Iran) with the comprisable reference data. Environ. Earth Sci. 63: 1179–1188.
Schottler, S. P. and Engstrom, D. R. 2006. A chronological assessment of Lake Okeechobee (Florida) sediments
using multiple dating markers. J. Paleolimnol. 36: 19–36.
Sikorski, J. and Bluszcz, A. 2008. Application of α and γ spectrometry in the 210
pb method to model
sedimentation in artificial retention reservoir. Geochron. 31: 65–75.
Sikorski, J. and Goslar, T. 2003. Inventory of sediments of the dammed lake in Kozłowa Góra and first
measurements of 210
Pb activities in the lake deposits. Geochron. 22: 55–62.
Silva, L. F. O., Oliveira, M. L. S., Neace, E. R., O’Keefe, J. M. K., Henke, K. R. and Hower, J. C. 2011.
Nanominerals and ultrafine particles in sublimates from the Ruth Mullins coal fire, Perry County, Eastern
Kentucky, USA. Int. J. Coal Geol. 85: 237–245.
Srinivasa, G. S., Reddy, M. R. and Govil, P. K. 2010. Assessment of heavy metal contamination in soils at
Jajmau (Kanpur) and Unnao industrial areas of the Ganga Plain, Uttar Pradesh, India. J. Hazard. Mater. 174:
113–121.
Sun, Y. B., Zhou, Q. X., Xie, X. K. and Liu, R. 2010. Spatial, sources and risk assessment of heavy metal
contamination of urban soils in typical regions of Shenyang, China. J. Hazard. Mater. 174: 455–462.
VROM (Volkshuisvesting, RuimtelijkeOrdeningenMilieubeheer). 2000. Circular on target values and
intervention values for soil remediation. Spatial Planning and Environment, Netherlands: Ministry of
Housing, Spatial Planning and Environment.
Wei, B. G. and Yang, L. S. 2010. A review of heavy metal contaminations in urban soils, urban road dusts and
agricultural soils from China. Microchem. J. 94, 99–107.
Xu, Z. Q., Ni, S. J. and Tuo, X. G. 2008. Calculation of heavy metals toxicity coefficient in the evaluation of
potential ecological risk index. Environ. Sci. Technol. 31: 112–115.
Yadao, S. and Rajamani, V. 2006. Air quality and trace metal chemistry of different size fractions of aerosols in
N–NW India—implications for source diversity. Atmos. Environ. 40: 698–712.
Yu, J., Huang, Z., Chen, T., Qin, D., Zeng, X. and Huang, Y. 2012. Evaluation of ecological risk and source of
heavy metals in vegetable-growing soils in Fujian province, China. Environ. Earth Sci. 65: 29–37.
Yuan, G. L., Sun, T. H., Han, P., Li, J. and Lang, X. X. 2014. Source identification and ecological risk
assessment of heavy metals in topsoil using environmental geochemical mapping: Typical urban renewal
Accep
ted M
anus
cript

ACCEPTED MANUSCRIPT
area in Beijing, China. J. Geochem. Explor. 136: 40–67.
Zhang,W., Feng, H., Chang, J., Qu, J., Xie, H. and Yu, L. 2009. Heavy metal contamination in surface
sediments of Yangtze River intertidal zone: An assessment from different indexes. Environ. Pollut. 157:
1533–1543.
Zhao, L., Xu, Y., Hou, H., Shangguan, Y. and Li, F. 2014. Source identification and health risk assessment
of metals in urban soils around the Tanggu chemical industrial district, Tianjin, China. Sci. Total Environ.
468–469: 654–662.
Zheng, N., Wang, Q., Liang, Z. and Zheng, D. 2008. Characterization of heavy metal concentrations in the
sediments of three freshwater rivers in Huludao City, Northeast China. Environ. Pollut. 154: 135–142.
Zhou, J., Ma, D. S., Pan, J. Y., Nie, W. M. and Wu, K. 2008. Application of multivariate statistical approach to
identify heavy metal sources in sediment and waters: a case study in Yangzhong, China. Environ. Geol. 54:
373–380.
Accep
ted M
anus
cript

ACCEPTED MANUSCRIPT
TABLE I
Physicochemical properties (mean ± SD) of soils, at different land uses of Patuakhali District, Bangladesh.
Land
types
pH (1:2.5 H2O)
EC (µScm-1
)
Organic carbon
(gkg-1
)
Sand Silt Clay Soil texturea
(gkg
-1 in < 2 mm)
BF 6.5±1.3 70±16 7.0±1.8 730 150 120 Sandy loam
FG 5.4±1.1 34±7.9 8.1±1.2 888 77 35 Sand
LT 5.7±0.72 67±13 6.8±2.6 582 188 230 Sandy clayey loam
PS 7.2±0.65 26±4.9 5.8±2.1 670 240 90 Sandy loam
AF 6.9±1.4 51±19 7.5±3.5 700 190 110 Sandy loam
RA 5.8±0.84 35±5.5 4.3±1.1 805 150 45 Loamy sand
M 7.1±1.6 39±11 6.6±2.1 565 145 290 Sandy clayey loam
PG 6.1±0.75 22±6.8 6.4±1.2 580 165 255 Sandy clayey loam aAccording to the United States Department of Agriculture soil classification system.
TABLE II
Metal concentration (mgkg-1
) in soils of different land uses and guidelines value.
Vertically letters a and b show statistically significant differences at (p < 0.05, Multivariate Post-hoc Tukey test) among the land uses
of each metal.
Sites Al Cr Ni Cu As Cd Pb
Brick field (n=6) Mean±SD 13±5.7 43±14a 83±69a 51±37a 38±12b 10±7.7a 42±27a
Range 5.2-21 19-58 21-271 15-90 5.1-80 3.9-24 9.0-73
Ferry ghat (n=4) Mean±SD 12±4.8 39±23ab 56±20a 54±32a 8.0±3.2a 6.3±5.2a 38±27a
Range 6.0-17 17-70 29-75 13-89 3.5-11 1.3-11 16-76
Launch terminal (n=6) Mean±SD 15±11 47±23a 76±49a 73±31a 15±12a 5.8±5.1a 137±78b
Range 4.1-31 18-87 21-152 26-122 5.5-36 0.81-13 51-276
Power station (n=4) Mean±SD 14±1.8 52±25a 51±54a 67±77a 10±12a 11±8.8a 54±22a
Range 12-16 16-74 22-131 15-181 2.8-28 2.0-23 26-78
Agricultural field (n=9) Mean±SD 15±8.2 19±16ab 27±27a 34±21a 9.3±6.0a 3.1±2.2a 24±16a
Range 6.0-28 6.3-58 8.3-95 6.2-65 4.0-22 1.0-7.2 10=63
Residential area (n=10) Mean±SD 15±7.1 10±11b 31±24a 28±22a 3.3±2.7a 2.4±1.3a 33±23a
Range 7.6-32 2.4-39 6.7-89 6.2-61 1.0-10 0.87-4.2 10=70
Market (n=4) Mean±SD 16±6.7 14±8.1ab 21±5.8a 77±44a 6.3±4.8a 1.5±0.93a 17±20a
Range 7.1-21 7.5-26 16-29 15-111 2.3-13 0.54-2.7 5.2-47
Play ground (n=10) Mean±SD 14±5.5 22±19ab 28±23a 21±18a 3.0±2.9a 4.8±5.2a 27±22a
Range 9.4-28 1.3-62 4.9-76 4.1-57 0.26-8.0 0.17-17 9.4-81
Background value of the present study 29 32 27 6.5 0.82 23
Background value of Bangladesh soilc NA 22 27 3 0.01-0.2 20.0
Dutch soil quality standard (Target Value)d 100 35 36 29 1 85
Dutch soil quality standard (Intervention Value)d 380 210 190 55 12 530
Canadian Environmental Quality Guidelinese 64 50 63 12 1.4 70
National Environment Protection Council, Canberra,Australiaf
100 400 7000 100 20 300
cKashem and Shingh, 1999
dVROM, 2000
eCCME, 2003
fNEPC, 2013
Accep
ted M
anus
cript

ACCEPTED MANUSCRIPT
14
TABLE III
Total variance explained and component matrices for the heavy metals in surface soils collected from Patuakhali
district, Bangladesh.
Initial Eigen values Extraction Sums of Squared Loadings Rotation Sums of Squared
Loadings
Compone
nt
Tota
l
% of
Variance
Cumulative
%
Tota
l % of Variance
Cumulative
% Total % of Variance Cumulative %
1 2.4 40.4 40.4 2.4 40.4 40.4 1.7 28.0 28.0
2 1.2 19.5 59.9 1.2 19.5 59.9 1.5 24.8 52.8
3 0.89 14.8 74.7 0.89 14.8 74.7 1.3 21.9 74.7
4 0.68 11.3 86.0
5 0.44 7.4 93.4
6 0.40 6.6 100
Elements Component matrix Rotated Component Matrix
PC1 PC2 PC3 PC1 PC2 PC3
Component
Matrix
Cr 0.73 0.372 0.11 0.45 0.28 0.63
8
Ni 0.77 -0.211 -0.38 0.82 0.33 -0.03
Cu 0.33 0.80 0.357 -0.02 -0.04 0.93
As 0.54 -0.45 0.45 0.08 0.826 0.01
3
Cd 0.63 -0.36 0.359 0.21 0.78 0.09
Pb 0.71 0.14 -0.53 0.88 0.02 0.19
Extraction Method: Principal Component Analysis
TABLE IV
Enrichment factor of heavy metals in soil from different land uses in Patuakhali, Bangladesh Land use type Cr Ni Cu As Cd Pb
Brick field (BF) 0.83±0.27 0.89±0.65 0.99±0.59 3.3±2.8 6.7±5.3 1.0±0.65
Ferry ghat (FG) 0.67±0.39 0.88±0.31 1.0±0.61 0.62±0.25 3.9±3.2 0.84±0.60
Launch terminal (LT) 0.82±0.40 1.2±0.77 1.4±0.59 1.2±0.96 3.6±3.1 3.0±1.7
Power station (PS) 0.91±0.44 0.80±0.85 1.3±1.4 0.78±0.92 6.7±5.4 1.2±0.48
Agricultural field (AF) 0.33±0.28 0.43±0.43 0.64±0.39 0.73±0.46 1.9±1.4 0.53±0.35
Residential area (RA) 0.17±0.19 0.50±0.39 0.53±0.41 0.25±0.21 1.5±0.81 0.73±0.50
Market (M) 0.25±0.14 0.34±0.09 1.4±0.82 0.49±0.37 0.90±0.57 0.37±0.45
Play ground (PG) 0.38±0.32 0.44±0.36 0.40±0.33 0.23±0.23 3.0±3.2 0.60±0.47
TABLE V
Indices and grades of potential ecological risk of trace metals pollution (Luo et al., 2007). Contamin
ation
factor
(i
fC )
Contamination
degree of
individual metal
Degree of
contamination
( dC )
Contamination
degree of
the environment
i
rE Grade of ecological risk of
individual
metal
Potential ecological risk
(PER)
i
fC < 1 Low
dC < 5 Low contamination i
rE < 40 Low risk PER < 65 Low risk
Accep
ted M
anus
cript
ACCEPTED MANUSCRIPT
15
1 ≤ i
fC <
3
Moderate 5 ≤ dC < 10
Moderate
contamination 40 ≤
i
rE<80
Moderate risk 65 ≤ PER <
130
Moderate
risk
3 ≤ i
fC <
6
Considerable 10 ≤ dC < 20
Considerable
contamination 80 ≤
i
rE <
160
Considerable risk 130 ≤ PER<
260
Considerabl
e risk
i
fC ≥ 6 High dC
≥ 20
High contamination 160 ≤
i
rE <
320
High risk PER ≥ 260 Very high
risk
i
rE
≥ 320 Very high risk
TABLE VI
Contamination factor, degree of contamination and contamination level of heavy metals and metalloids in soils
collected from Patuakhali district, Bangladesh. Land uses Contamination factor (C
if) Degree of Contamination
Cr Ni Cu As Cd Pb contamination level
Brick field (BF) 1.5 1.6 1.8 5.8 12 1.8 24.4 Very high
Ferry ghat (FG) 1.3 1.7 2.0 1.2 7.6 1.7 15.6 Considerable
Launch terminal (LT) 1.6 2.4 2.7 2.3 7.0 6.0 22.0 Very high
Power station (PS) 1.8 1.6 2.5 1.5 13 2.3 23.0 Very high
Agricultural field (AF) 1.4 0.5 2.8 5.1 4.3 2.2 16.3 Considerable
Residential area (RA) 0.34 0.98 1.1 0.50 2.9 1.4 7.2 Moderate
Market (M) 0.50 0.67 2.8 0.97 1.8 0.73 7.5 Moderate
Play ground (PG) 0.76 0.86 0.79 0.45 5.9 1.2 10 Considerable
Note: Bold indicates very high contamination (Cif > 6.0)
TABLE VII
Potential ecological risk factor, risk index and pollution degree of heavy metals and metalloids in soils collected
from Patuakhali district, Bangladesh. Land uses Potential ecological risk factor (E
ir) Potential Risk
PER
Pollution
degree Cr Ni Cu As Cd Pb
Brick field (n=6) 3.0 10 9 58 359 9.2 447 Very high risk
Ferry ghat (n=4) 2.7 10 10 12 229 8.3 272 Very high risk
Launch terminal (n=6) 3.2 14 14 23 211 30 295 Very high risk
Power station (n=4) 3.6 10 12 15 396 12 449 Very high risk
Agricultural field (n=9) 2.8 2.9 14 51 130 11 211 Considerable risk
Residential area (n=10) 0.68 5.9 5.3 5.0 87 7.2 111 Moderate risk
Market (n=4) 1.0 4.0 14 10 54 3.7 86 Moderate risk
Play ground (n=10) 1.5 5.2 3.9 4.5 177 6.0 198 Considerable risk
Note: Bold indicates very high contamination (Eir >320)
Accep
ted M
anus
cript

ACCEPTED MANUSCRIPT
16
Fig. 1 Map of the study area of Patuakhali district in Bangladesh.
Fig. 2 Principal component analysis (PCA) of heavy metals in soils collected from different land uses in
Accep
ted M
anus
cript
ACCEPTED MANUSCRIPT
17
Patuakhali, Bangladesh.
Fig. 3 Estimated toxic units (∑TUs) in soils of different land use types in Bangladesh.
Fig. 4 Pollution load index (PLI) of heavy metals in soils of different land use types in Bangladesh (Error bar
represents ±SE).
Accep
ted M
anus
cript

ACCEPTED MANUSCRIPT
18
TABLE SI
Descriptions of different land uses and their respective number of sites under present investigation. Different types of
land use
Numb
er Description about the sampling sites
of
sites
Residential area
(RA)
10 The area consists of houses.
Play ground (PG) 10 Playground for children, adults and other residents. Agriculture field
(AF)
9 Traditional farming growing different types of vegetables and cereal crops with chemical
fertilizers and pesticides
Brick field (BF) 6 Burning of coal and wood for making bricks.
Launch terminal
(LT)
6 Transport of goods from various industries of Dhaka City and dispose waste from the terminal.
Power station (PS) 4 Burning coal for producing electricity, dispose of some waste from the station.
Market (M)
4 Shopping activity, breaking down of electronic components, dispose waste from the shop
keepers.
Ferry ghat (FG)
4 Boating activity, transportation of different raw materials from various industries, dispose waste
from boat.
TABLE SII
The ICP-MS operating conditions and measurement parameters.
Operating conditions
Spray chamber Scott double-pass
Nebulizer pump (rps) 0.1
RF power (W) 1550
RF Matching (V) 0.2
Sample depth (mm) 8
Torch-H (mm) 0.2
Torch-V (mm) 0.2
Plasma gas flow rate (L min-1
) 15
Carrier gas (Ar) flow rate (L min-1
) 0.9 (optimized daily)
Measurement parameters
Scanning mode Peak hop
Resolution (amu) 0.7
Readings/replicate 1
No. of replicates 3
Isotopes 52
Cr, 60
Ni, 63
Cu, 75
As, 111
Cd, 208
Pb
Accep
ted M
anus
cript